Sensitivity Analysis: parameters and structure EPI 260 May 9, 2007.
48
Sensitivity Analysis: parameters and structure EPI 260 May 9, 2007
-
Upload
sara-johns -
Category
Documents
-
view
213 -
download
0
Transcript of Sensitivity Analysis: parameters and structure EPI 260 May 9, 2007.
Sensitivity Analysis: parameters and structure
EPI 260
May 9, 2007

Probabilistic aspects of dynamic modeling
• Stochastic models
• Uncertainty analysis
• Sensitivity analysisDeterministic orstochastic models
Topics
• Sensitivity to model parameters– Uncertainty analysis– Sensitivity analysis
• Random sampling (and variations)
• Sensitivity to model structure
• Example: Varicella-Zoster Virus vaccine– Sources of uncertainty
Uncertainty analysis
• How uncertain are we about the predictions / what is range of plausible possibilities?
• Source of uncertain predictions: ignorance of parameter values
Sensitivity Analysis
• In which of the parameters does our uncertainty translate into the greatest variation in outcomes: depends on the parameter’s– Degree of uncertainty– Importance to outcome– Monotonicity of effect
Sensitivity to parameter valuesSteps:
1. Identify uncertain parameters and range of uncertainty for each
2. Identify outcomes of interest3. Estimate total uncertainty of each
outcome (Uncertainty Analysis)4. Estimate contribution (strength and
direction(s) of influence) of each parameter to uncertainty about outcome (Sensitivity Analysis)
Informal (“Scenario”) approach:
1. Identify direction of effect of each parameter on outcome(s) of interest
2. Identify “best”, “base”, and “worst” case parameter sets
3. Run or analyze model under each to determine range of uncertainty
4. Vary some parameters individually to see relative contributions
5. Show example runs and report results of cases
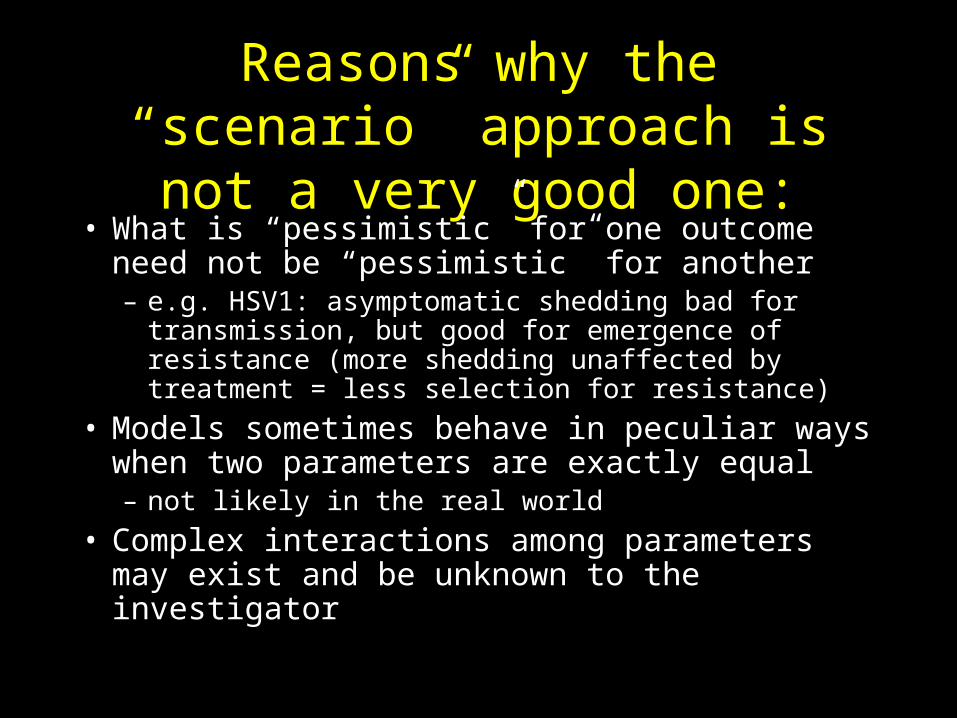
Reasons why the “scenario” approach is not a very good one:• What is “pessimistic” for one outcome need
not be “pessimistic” for another– e.g. HSV1: asymptomatic shedding bad for
transmission, but good for emergence of resistance (more shedding unaffected by treatment = less selection for resistance)
• Models sometimes behave in peculiar ways when two parameters are exactly equal – not likely in the real world
• Complex interactions among parameters may exist and be unknown to the investigator
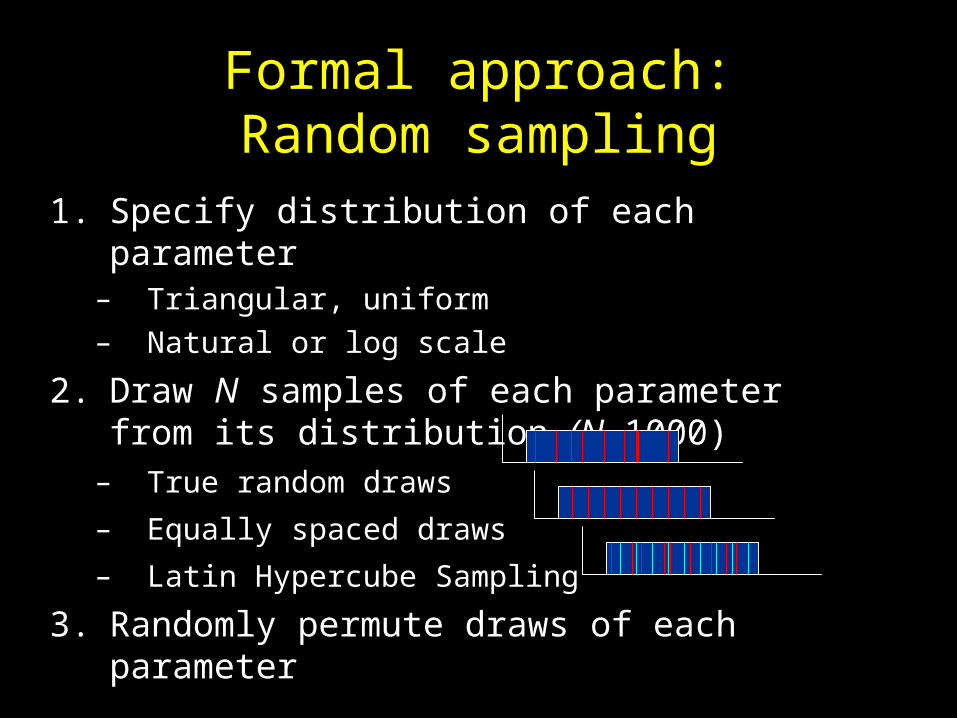
Formal approach:Random sampling
1. Specify distribution of each parameter– Triangular, uniform– Natural or log scale
2. Draw N samples of each parameter from its distribution (N~1000)
– True random draws
– Equally spaced draws
– Latin Hypercube Sampling
3. Randomly permute draws of each parameter
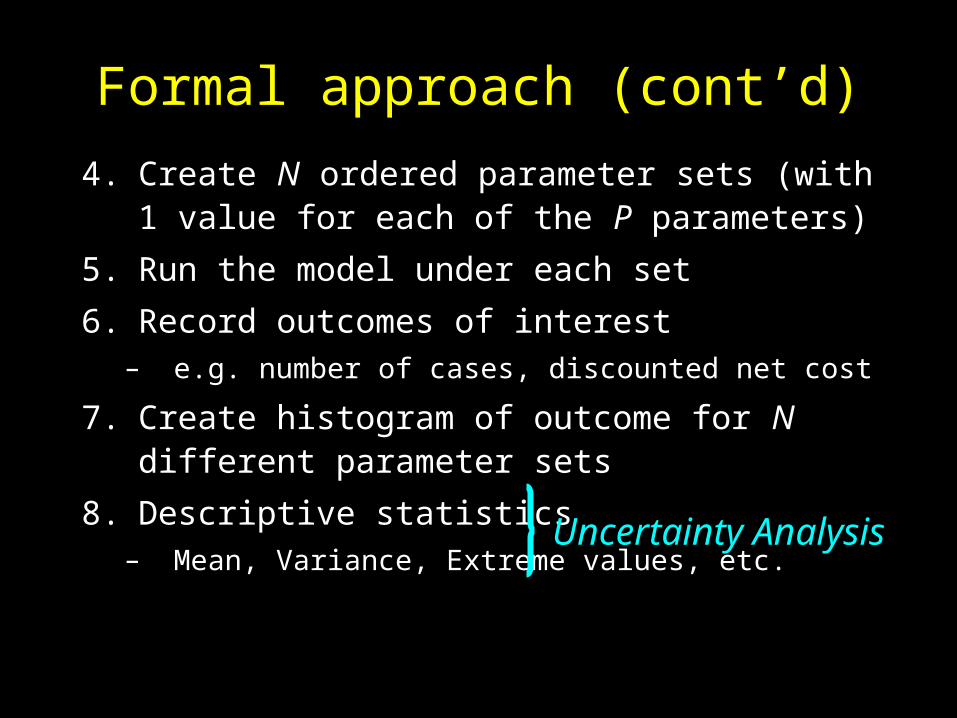
Formal approach (cont’d)
4. Create N ordered parameter sets (with 1 value for each of the P parameters)
5. Run the model under each set
6. Record outcomes of interest– e.g. number of cases, discounted net cost
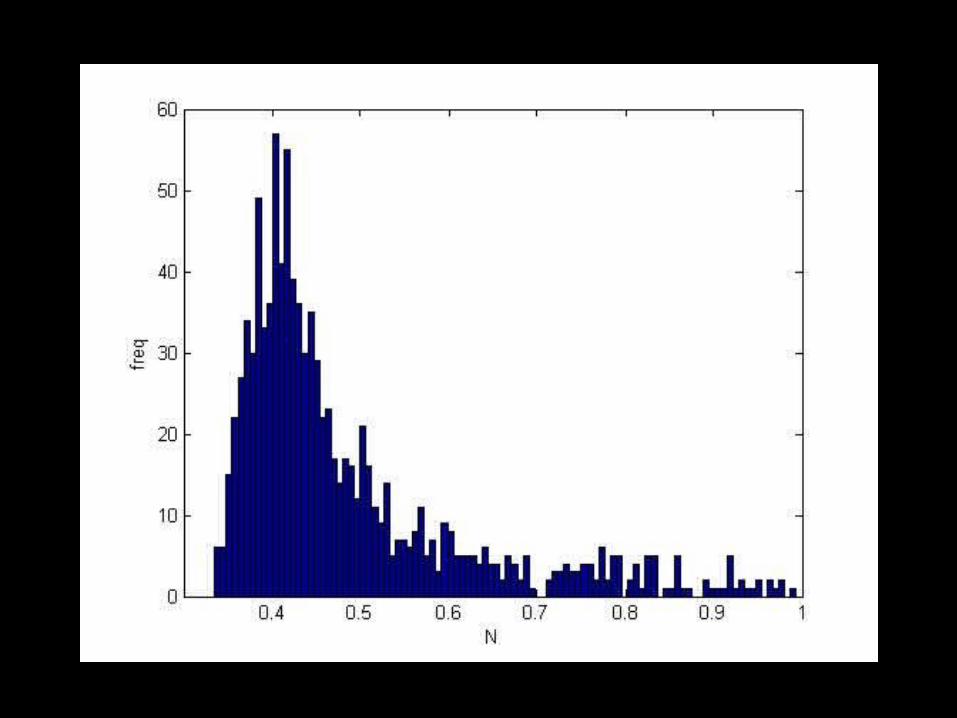
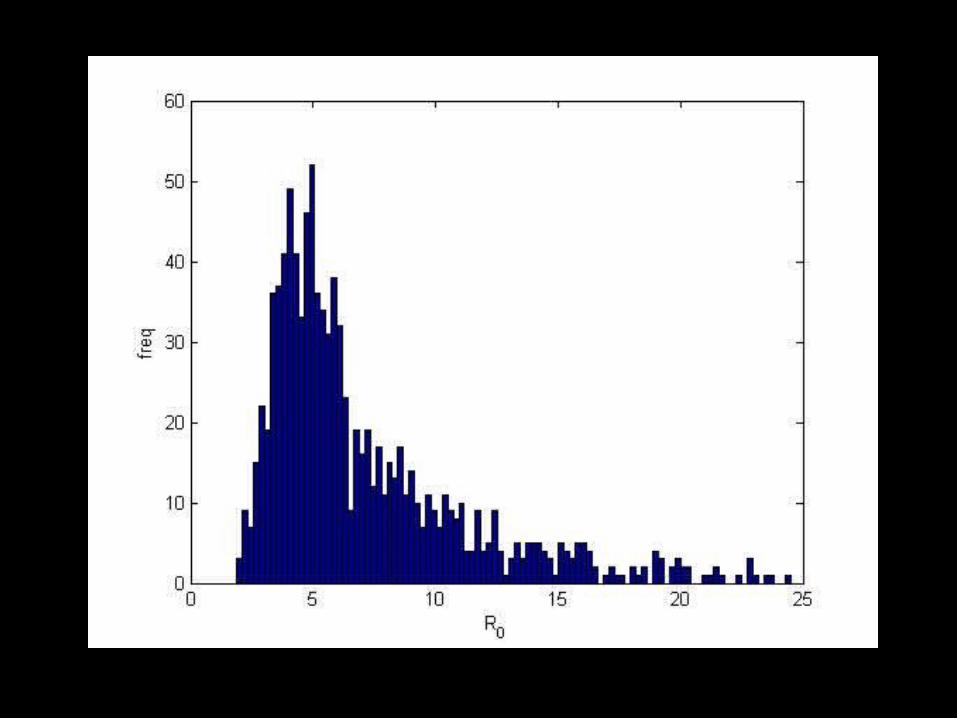
7. Create histogram of outcome for N different parameter sets
8. Descriptive statistics– Mean, Variance, Extreme values, etc.
Uncertainty Analysis
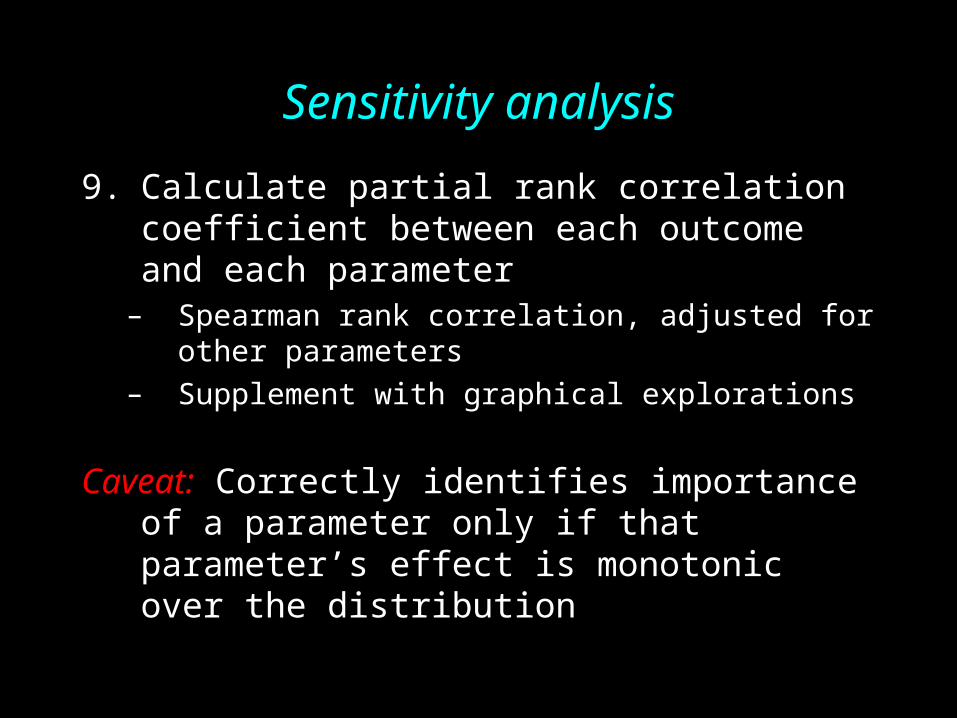
Sensitivity analysis
9. Calculate partial rank correlation coefficient between each outcome and each parameter
– Spearman rank correlation, adjusted for other parameters
– Supplement with graphical explorations
Caveat: Correctly identifies importance of a parameter only if that parameter’s effect is monotonic over the distribution
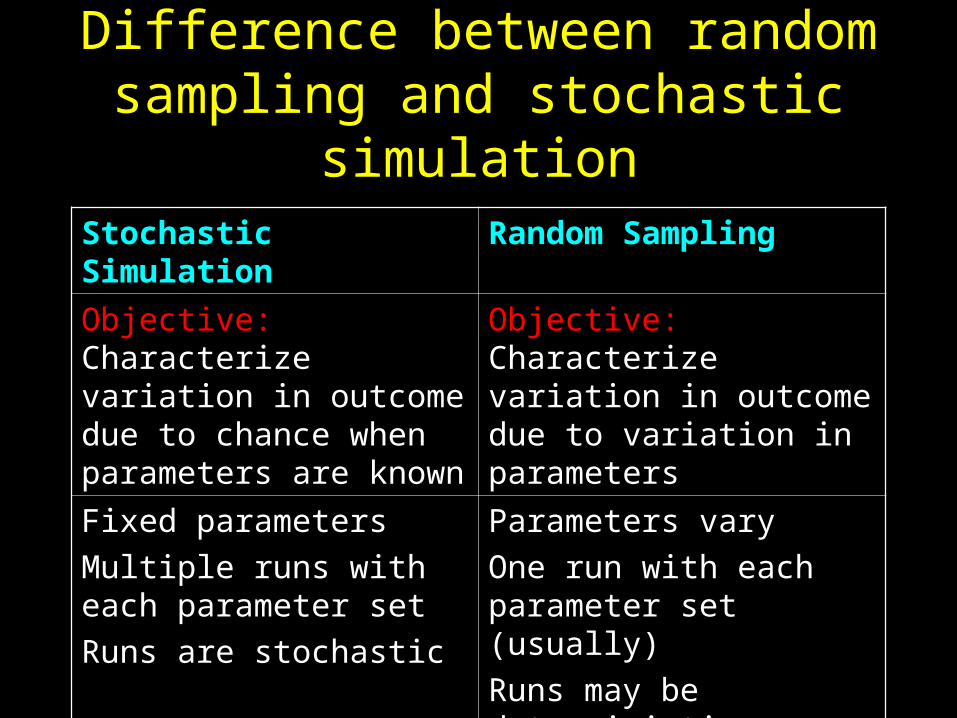
Difference between random sampling and stochastic simulation
Stochastic Simulation Random Sampling
Objective: Characterize variation in outcome due to chance when parameters are known
Objective: Characterize variation in outcome due to variation in parameters
Fixed parameters
Multiple runs with each parameter set
Runs are stochastic
Parameters vary
One run with each parameter set (usually)
Runs may be deterministic or stochastic
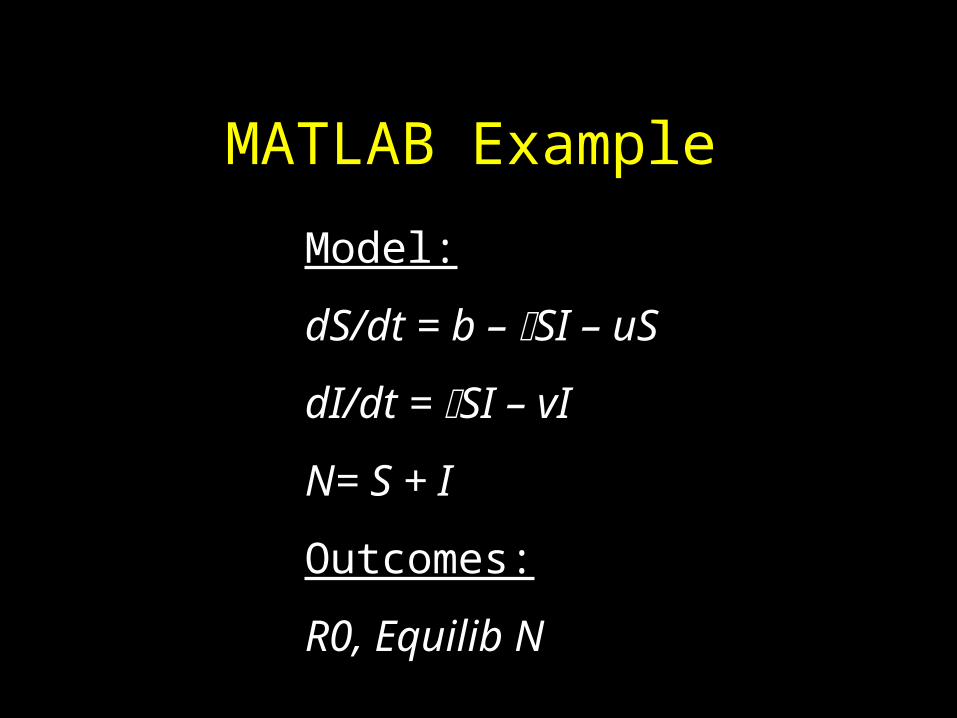
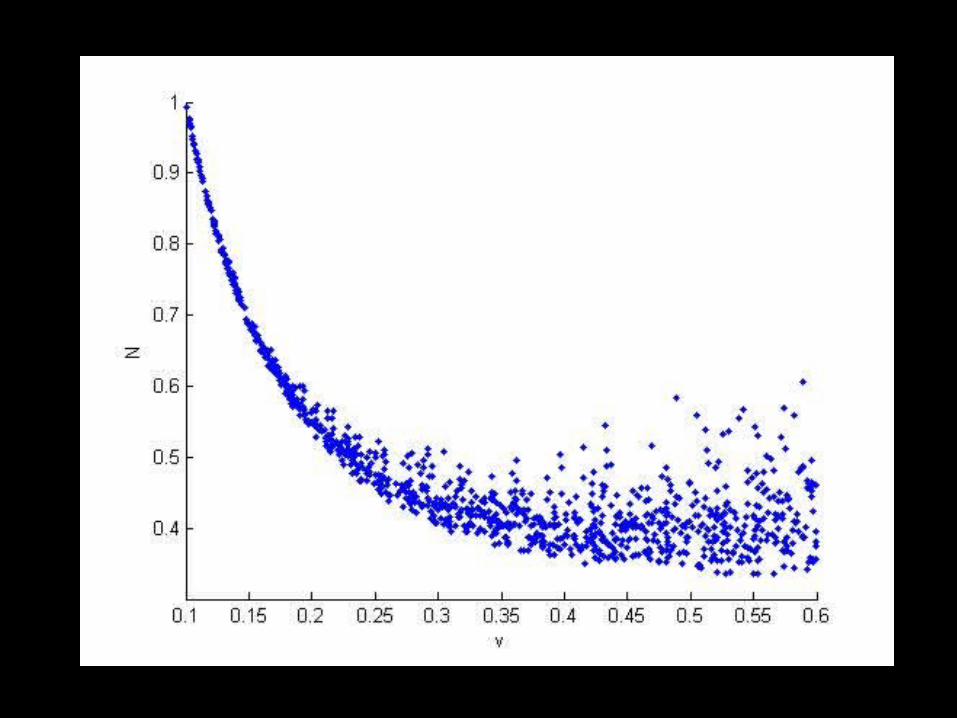
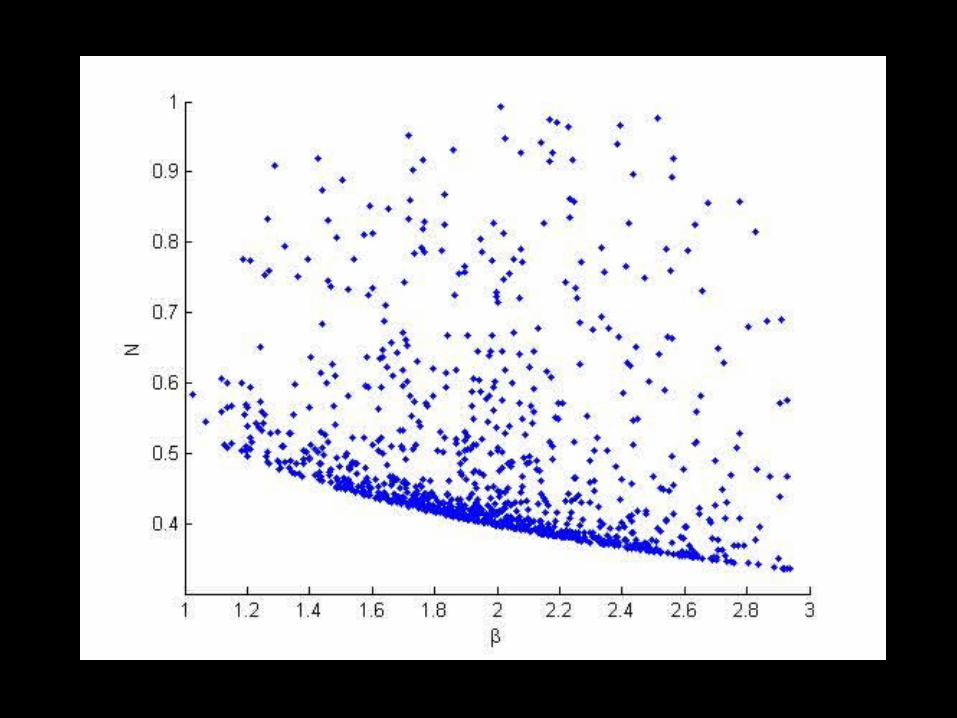
MATLAB Example
Model:
dS/dt = b – SI – uS
dI/dt = SI – vI
N= S + I
Outcomes:
R0, Equilib N
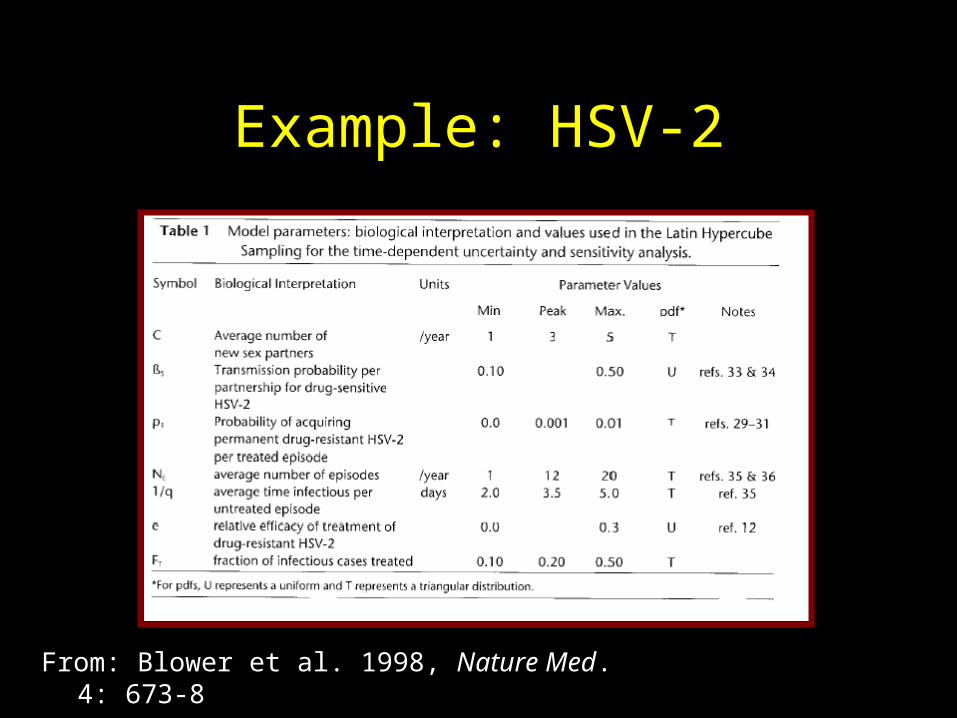
Example: HSV-2
From: Blower et al. 1998, Nature Med. 4: 673-8
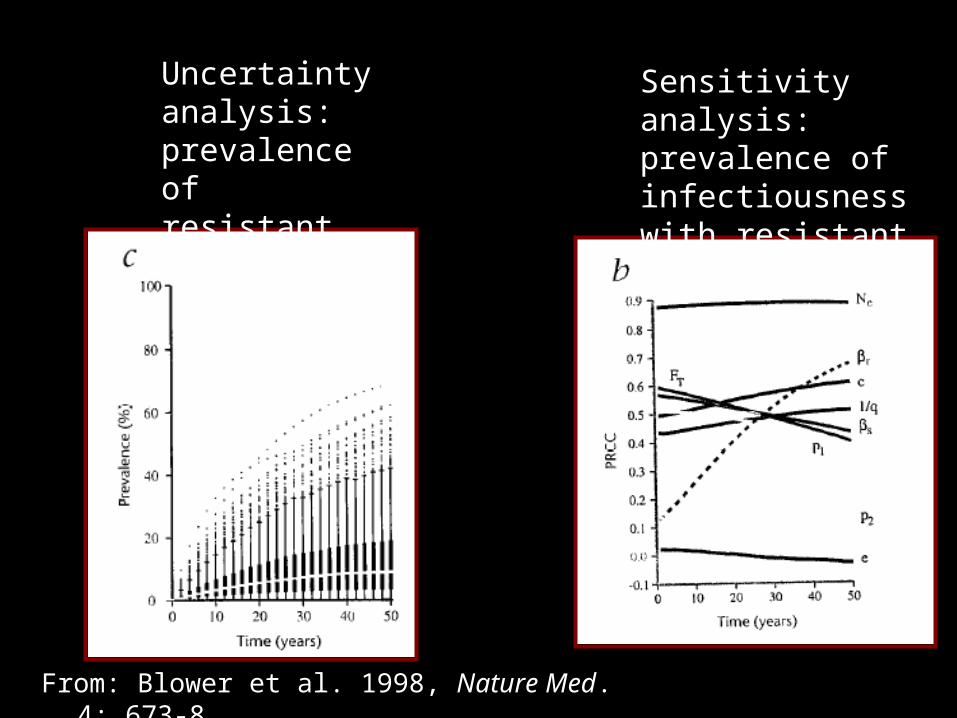
Sensitivity analysis: prevalence of infectiousness with resistant strain
Uncertainty analysis: prevalence of resistant strain
From: Blower et al. 1998, Nature Med. 4: 673-8
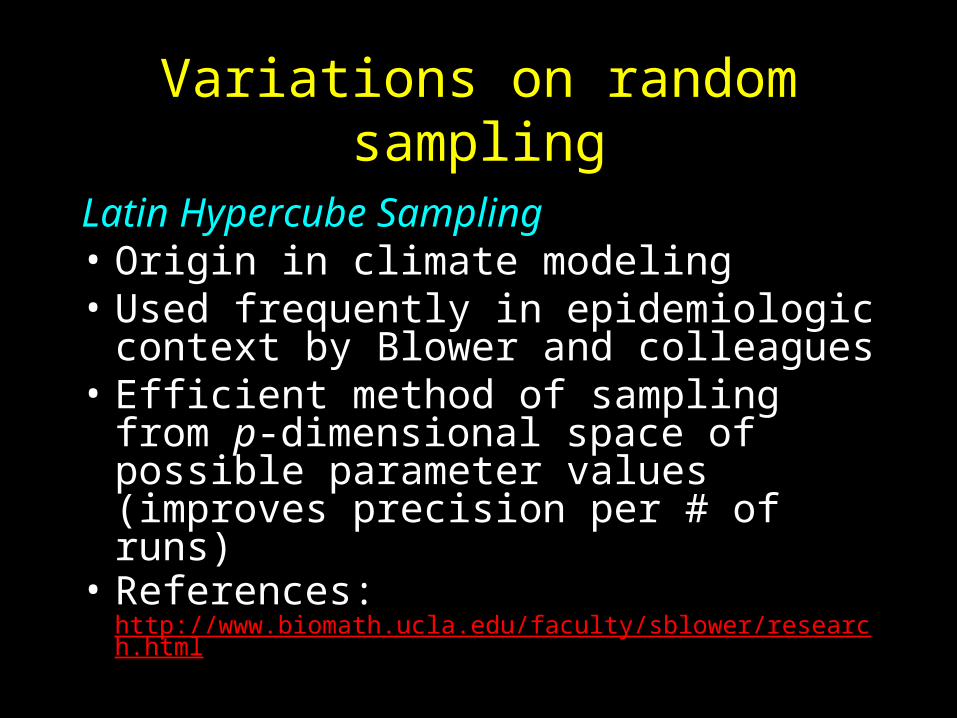
Variations on random sampling
Latin Hypercube Sampling• Origin in climate modeling• Used frequently in epidemiologic
context by Blower and colleagues• Efficient method of sampling from p-
dimensional space of possible parameter values (improves precision per # of runs)
• References: http://www.biomath.ucla.edu/faculty/sblower/research.html
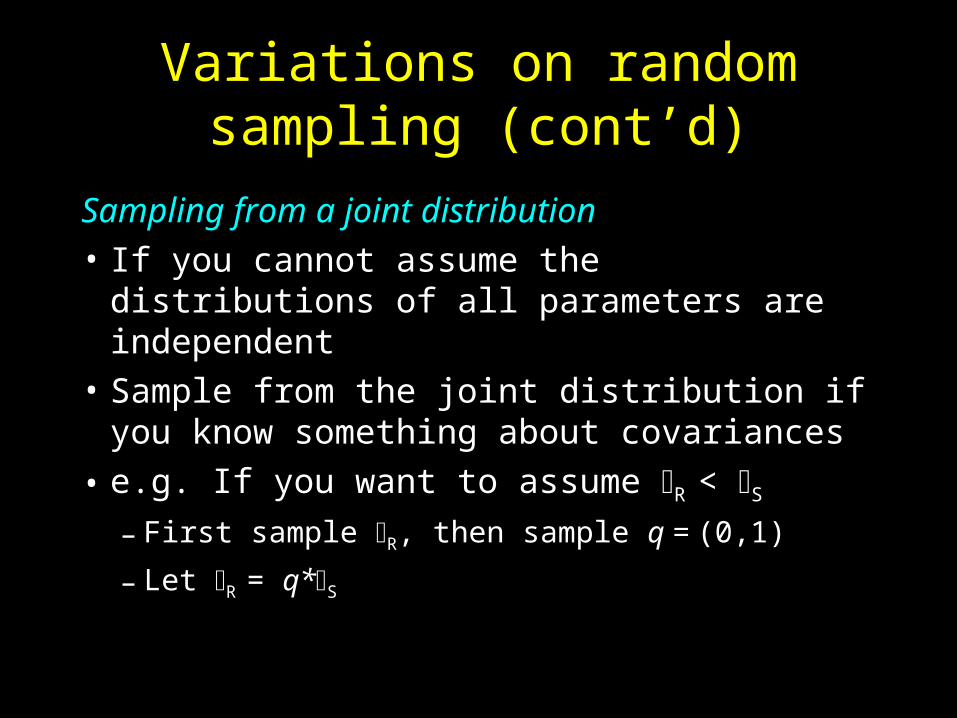
Variations on random sampling (cont’d)
Sampling from a joint distribution• If you cannot assume the distributions of
all parameters are independent• Sample from the joint distribution if you
know something about covariances
• e.g. If you want to assume R < S
– First sample R, then sample q = (0,1)
– Let R = q*S
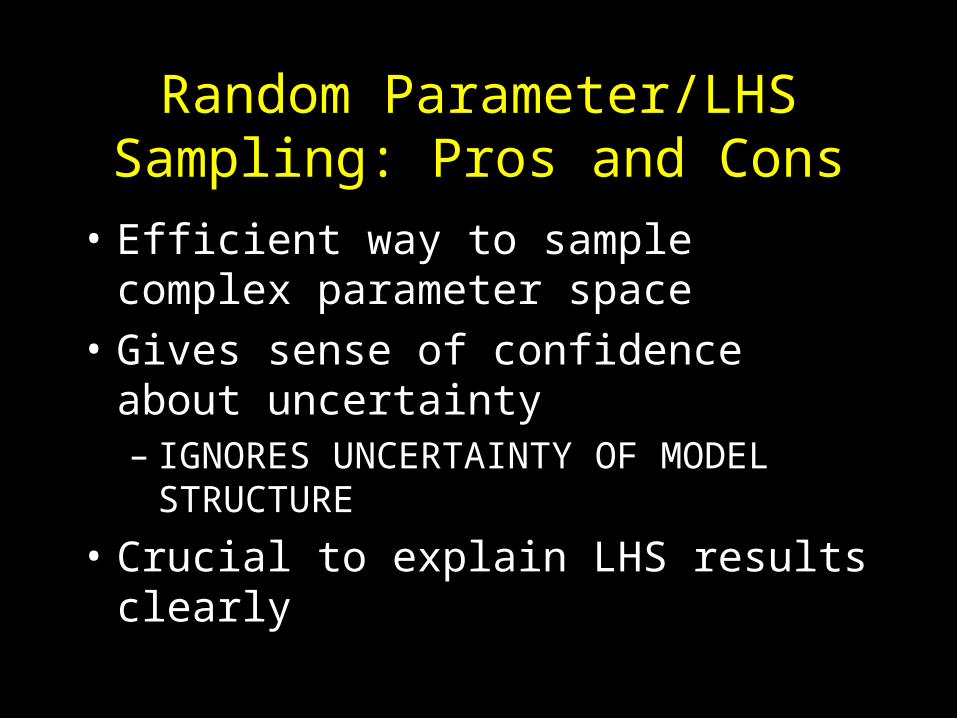
Random Parameter/LHS Sampling: Pros and Cons
• Efficient way to sample complex parameter space
• Gives sense of confidence about uncertainty– IGNORES UNCERTAINTY OF MODEL
STRUCTURE
• Crucial to explain LHS results clearly
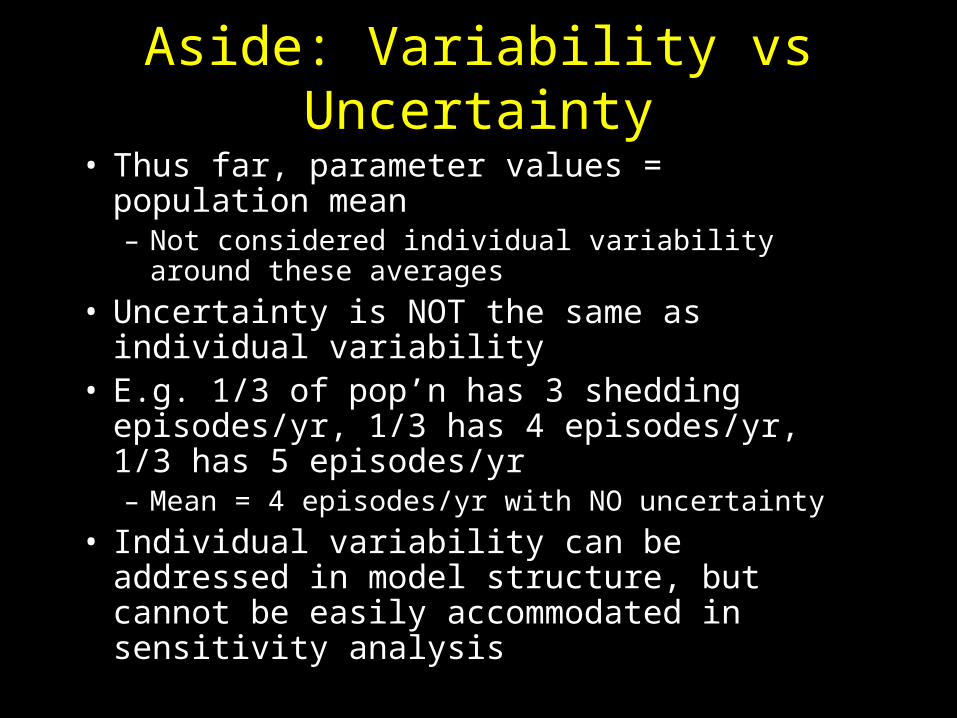
Aside: Variability vs Uncertainty
• Thus far, parameter values = population mean– Not considered individual variability around these
averages
• Uncertainty is NOT the same as individual variability
• E.g. 1/3 of pop’n has 3 shedding episodes/yr, 1/3 has 4 episodes/yr, 1/3 has 5 episodes/yr– Mean = 4 episodes/yr with NO uncertainty
• Individual variability can be addressed in model structure, but cannot be easily accommodated in sensitivity analysis
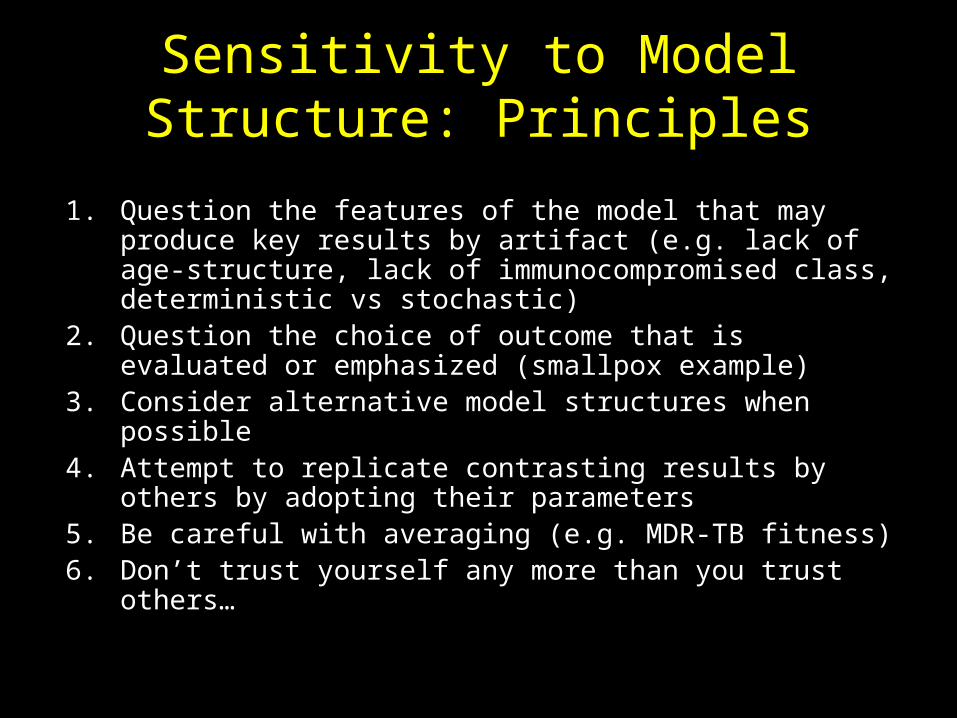
Sensitivity to Model Structure: Principles
1. Question the features of the model that may produce key results by artifact (e.g. lack of age-structure, lack of immunocompromised class, deterministic vs stochastic)
2. Question the choice of outcome that is evaluated or emphasized (smallpox example)
3. Consider alternative model structures when possible4. Attempt to replicate contrasting results by others by
adopting their parameters5. Be careful with averaging (e.g. MDR-TB fitness)6. Don’t trust yourself any more than you trust others…
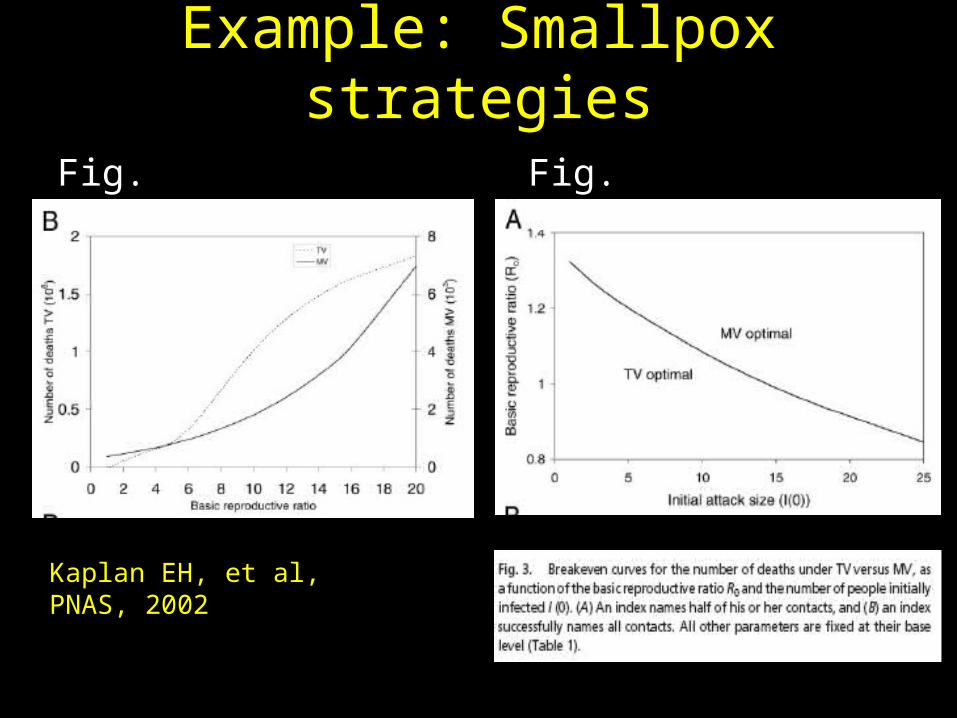
Example: Smallpox strategies
Fig. 2 Fig. 3
Kaplan EH, et al, PNAS, 2002
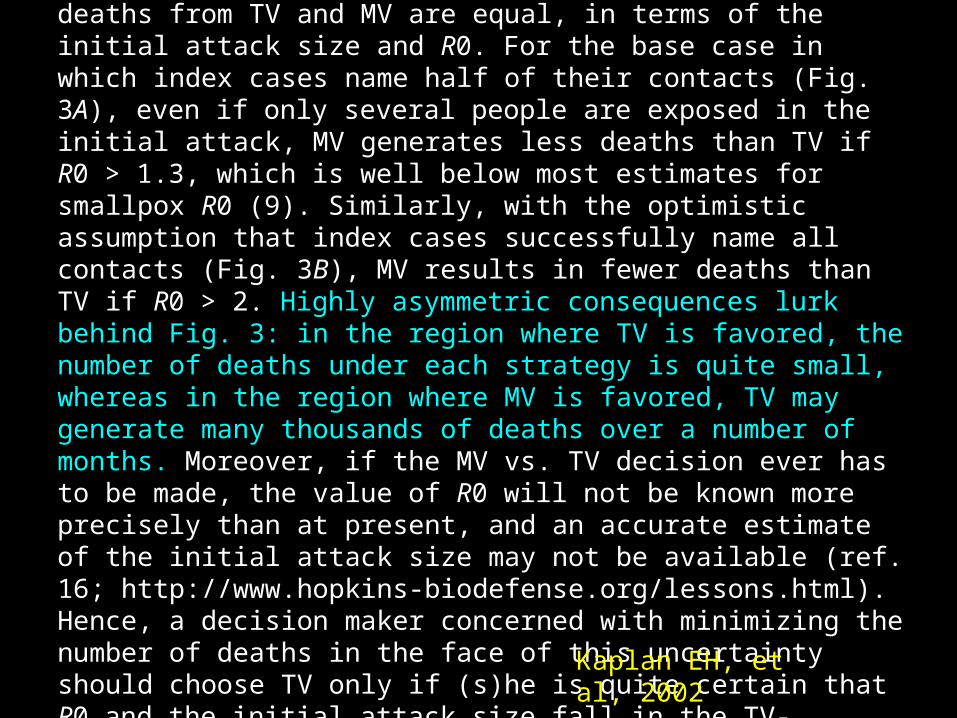
Comparing TV, MV, and the Interim CDC Policy. Fig. 3 shows breakeven curves, where the total number of deaths from TV and MV are equal, in terms of the initial attack size and R0. For the base case in which index cases name half of their contacts (Fig. 3A), even if only several people are exposed in the initial attack, MV generates less deaths than TV if R0 > 1.3, which is well below most estimates for smallpox R0 (9). Similarly, with the optimistic assumption that index cases successfully name all contacts (Fig. 3B), MV results in fewer deaths than TV if R0 > 2. Highly asymmetric consequences lurk behind Fig. 3: in the region where TV is favored, the number of deaths under each strategy is quite small, whereas in the region where MV is favored, TV may generate many thousands of deaths over a number of months. Moreover, if the MV vs. TV decision ever has to be made, the value of R0 will not be known more precisely than at present, and an accurate estimate of the initial attack size may not be available (ref. 16; http://www.hopkins-biodefense.org/lessons.html). Hence, a decision maker concerned with minimizing the number of deaths in the face of this uncertainty should choose TV only if (s)he is quite certain that R0 and the initial attack size fall in the TV-favorable region of Fig. 3.
Kaplan EH, et al, 2002
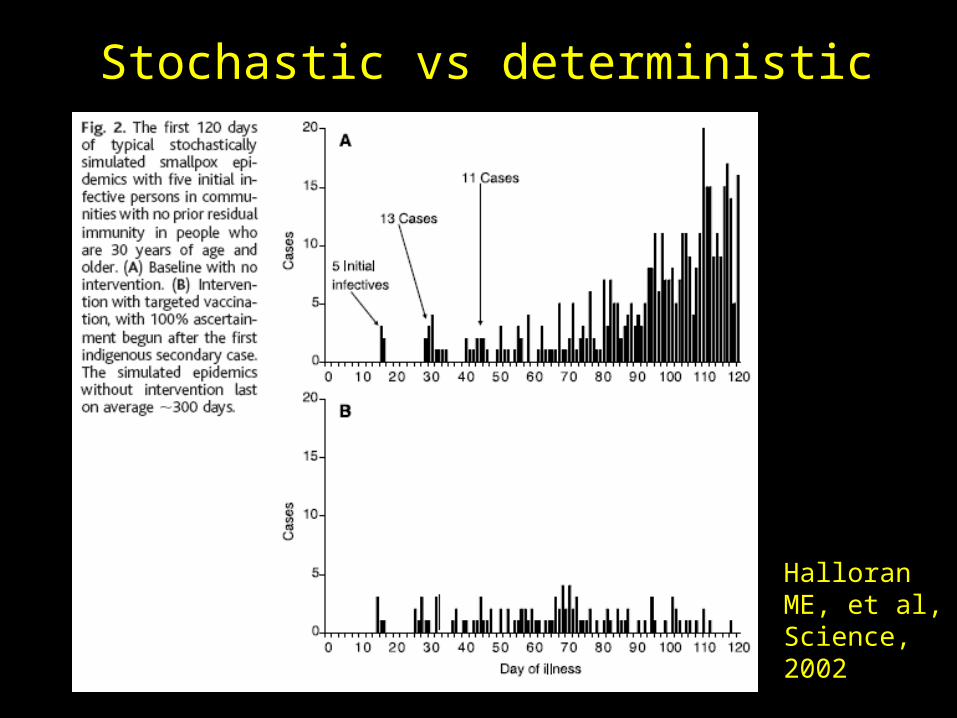
Stochastic vs deterministic
Halloran ME, et al, Science, 2002
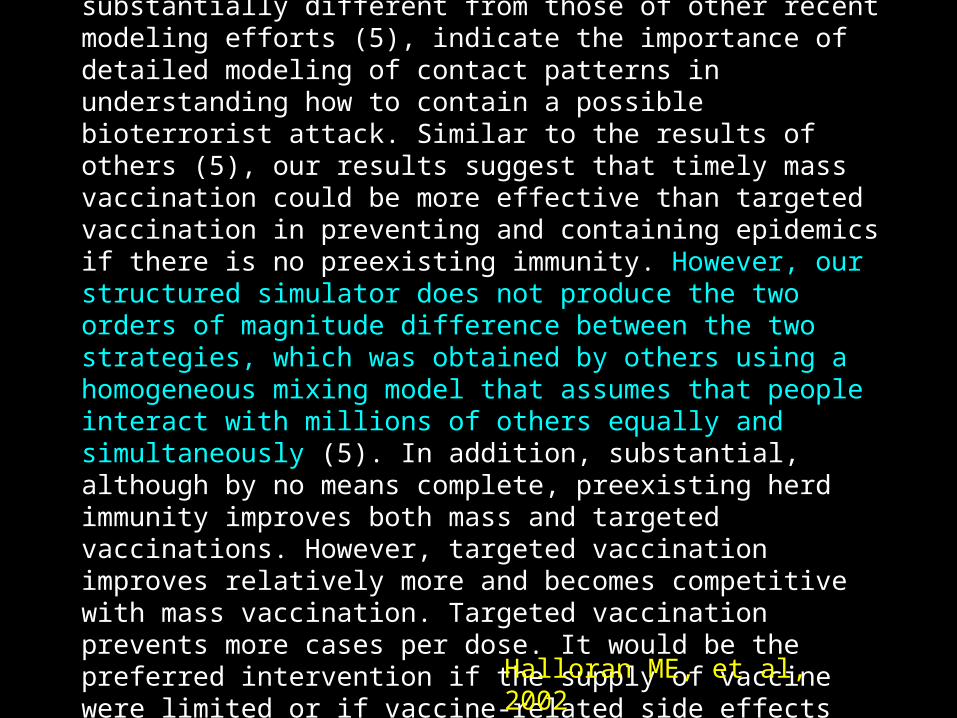
Although our stochastic simulator requires additional refinements to model a large U.S. community adequately, its findings, which are substantially different from those of other recent modeling efforts (5), indicate the importance of detailed modeling of contact patterns in understanding how to contain a possible bioterrorist attack. Similar to the results of others (5), our results suggest that timely mass vaccination could be more effective than targeted vaccination in preventing and containing epidemics if there is no preexisting immunity. However, our structured simulator does not produce the two orders of magnitude difference between the two strategies, which was obtained by others using a homogeneous mixing model that assumes that people interact with millions of others equally and simultaneously (5). In addition, substantial, although by no means complete, preexisting herd immunity improves both mass and targeted vaccinations. However, targeted vaccination improves relatively more and becomes competitive with mass vaccination. Targeted vaccination prevents more cases per dose. It would be the preferred intervention if the supply of vaccine were limited or if vaccine-related side effects were to be minimized. For all strategies, rapid response can make the difference between preventing and merely containing an epidemic.
Halloran ME, et al, 2002

Sensitivity to Model Structure: Principles
1. Question the features of the model that may produce key results by artifact (e.g. lack of age-structure, lack of immunocompromised class, deterministic vs stochastic)
2. Question the choice of outcome that is evaluated or emphasized (smallpox example)
3. Consider alternative model structures when possible4. Attempt to replicate contrasting results by others by
adopting their parameters5. Be careful with averaging (e.g. MDR-TB fitness)6. Don’t trust yourself any more than you trust others…
Example
Vaccination against Varicella-Zoster Virus (VZV)
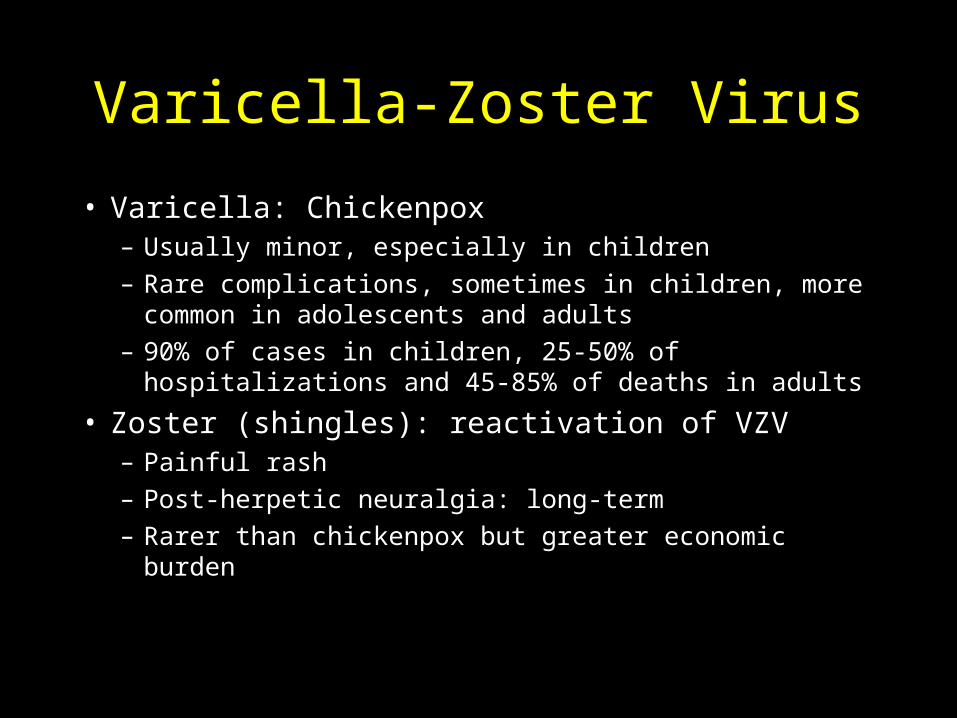
Varicella-Zoster Virus
• Varicella: Chickenpox– Usually minor, especially in children– Rare complications, sometimes in children, more
common in adolescents and adults– 90% of cases in children, 25-50% of hospitalizations
and 45-85% of deaths in adults
• Zoster (shingles): reactivation of VZV– Painful rash– Post-herpetic neuralgia: long-term – Rarer than chickenpox but greater economic burden
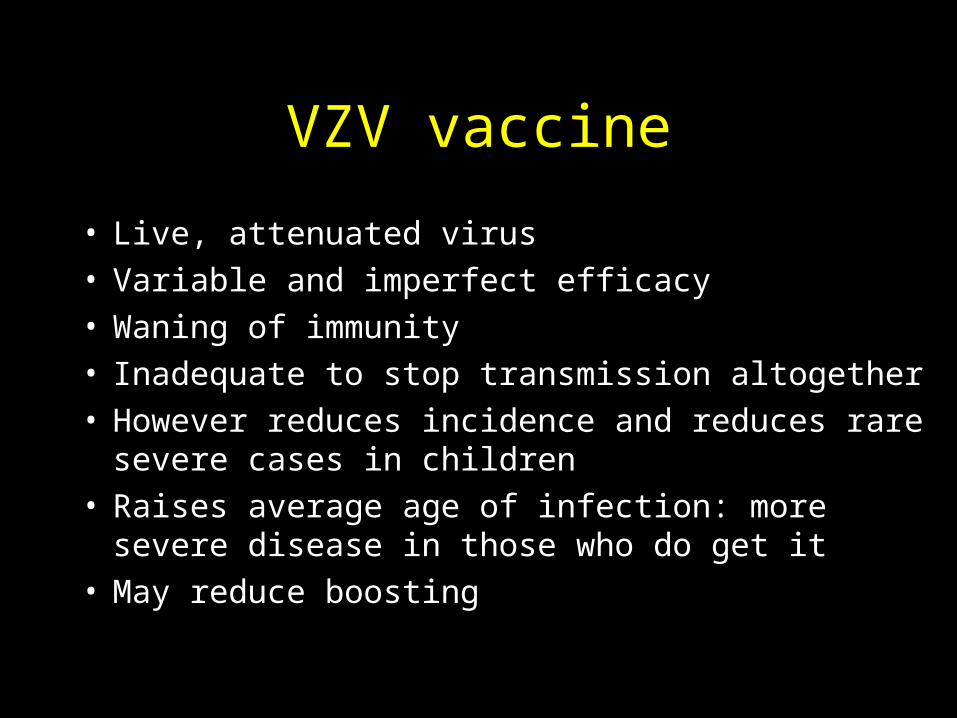
VZV vaccine
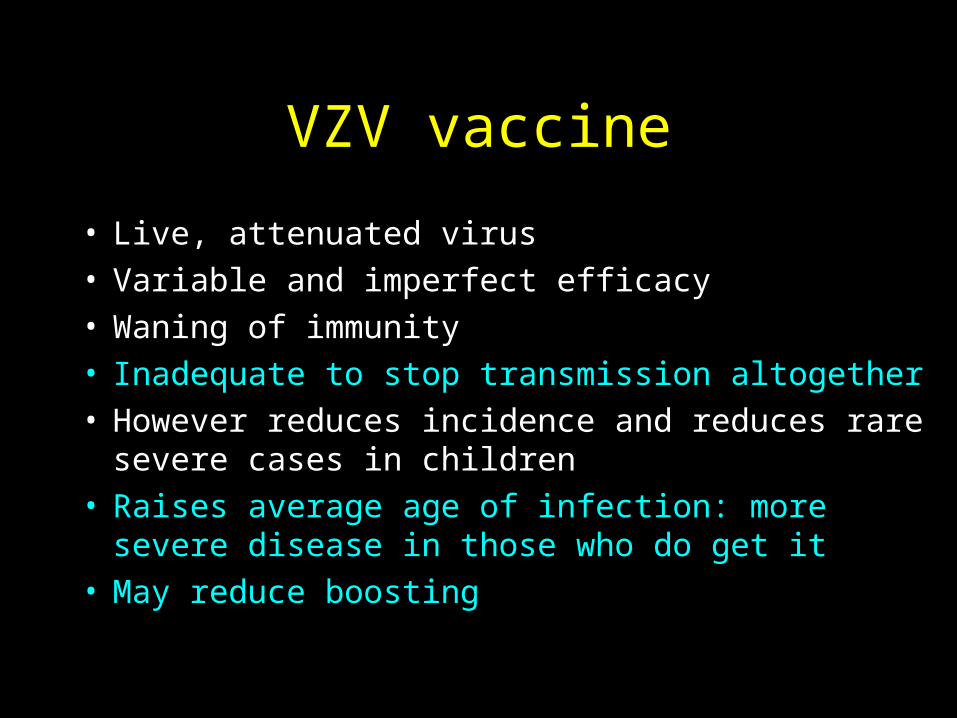
• Live, attenuated virus• Variable and imperfect efficacy• Waning of immunity• Inadequate to stop transmission altogether• However reduces incidence and reduces rare
severe cases in children• Raises average age of infection: more severe
disease in those who do get it• May reduce boosting
VZV vaccine
• Live, attenuated virus• Variable and imperfect efficacy• Waning of immunity• Inadequate to stop transmission altogether• However reduces incidence and reduces rare
severe cases in children• Raises average age of infection: more severe
disease in those who do get it• May reduce boosting
Boosting
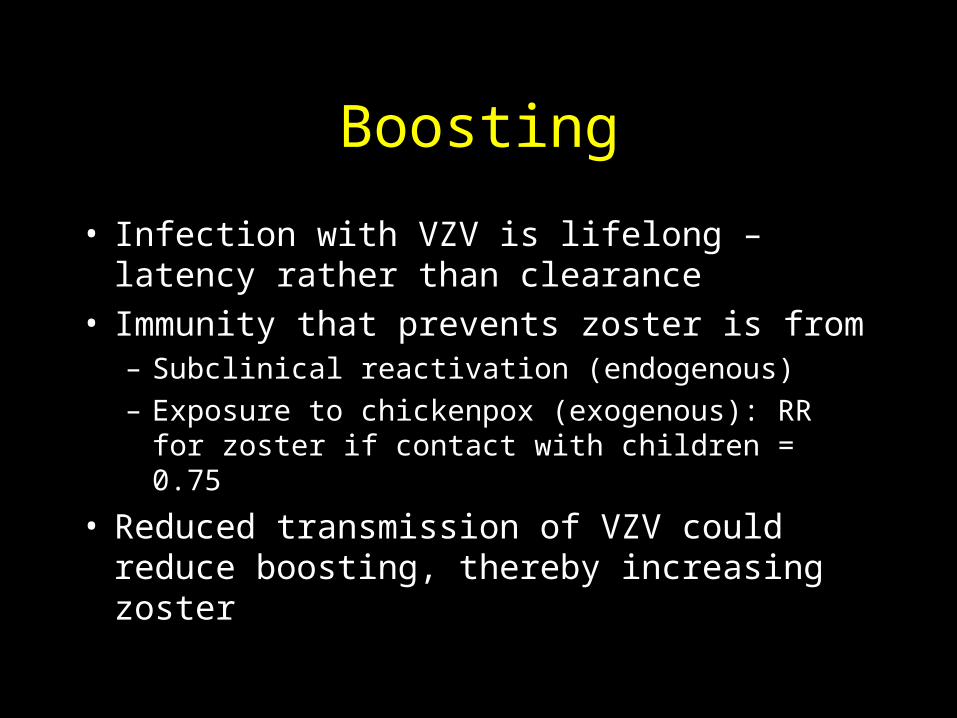
• Infection with VZV is lifelong – latency rather than clearance
• Immunity that prevents zoster is from– Subclinical reactivation (endogenous)– Exposure to chickenpox (exogenous): RR for
zoster if contact with children = 0.75
• Reduced transmission of VZV could reduce boosting, thereby increasing zoster
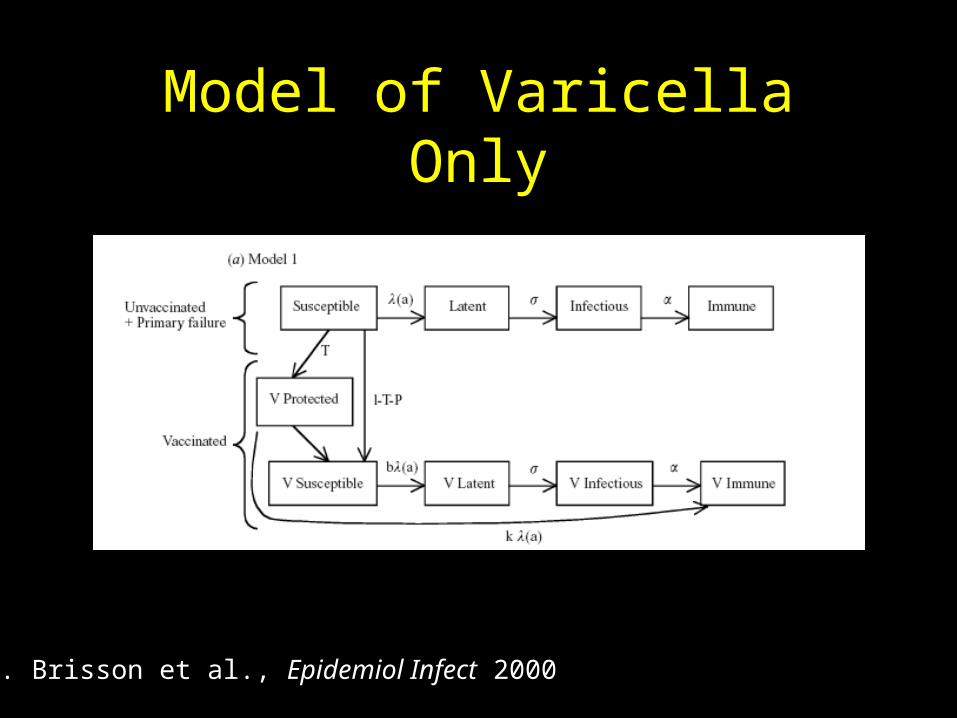
Model of Varicella Only
M. Brisson et al., Epidemiol Infect 2000
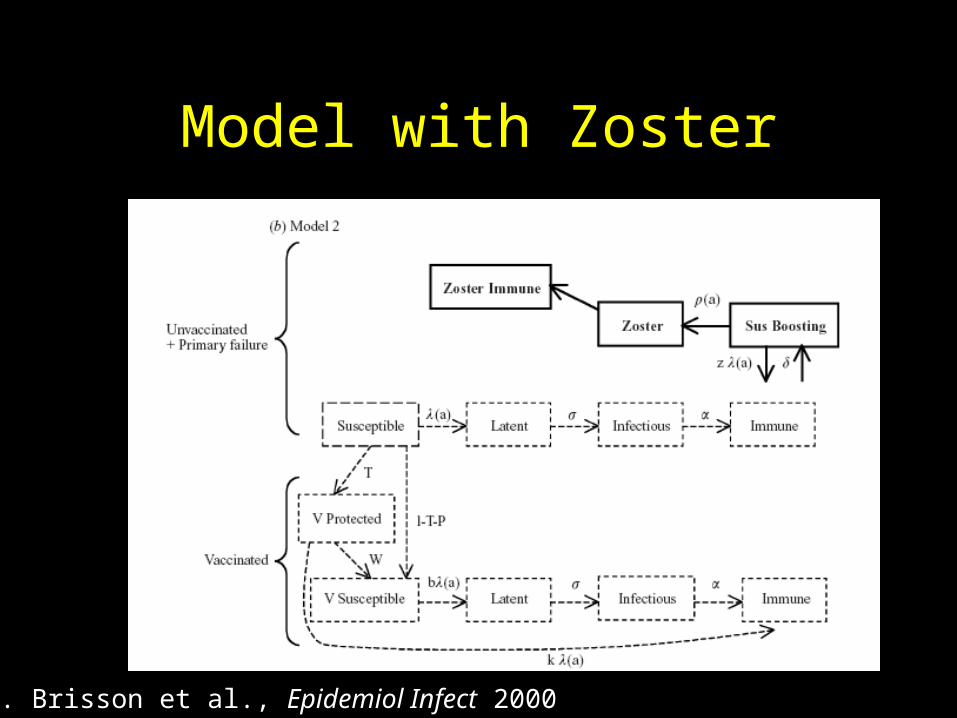
Model with Zoster
M. Brisson et al., Epidemiol Infect 2000
Age-structured
• Force (hazard) of infection to age I
• Depends on beta matrix: who acquires infection from whom (WAIFW)
i ij jj
I
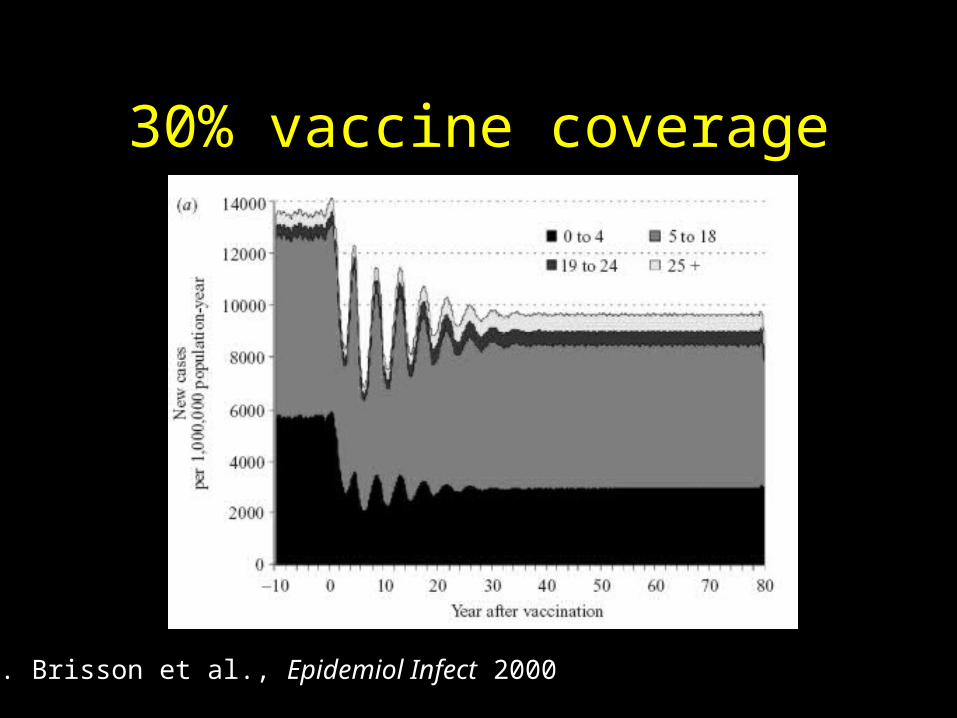
30% vaccine coverage
M. Brisson et al., Epidemiol Infect 2000
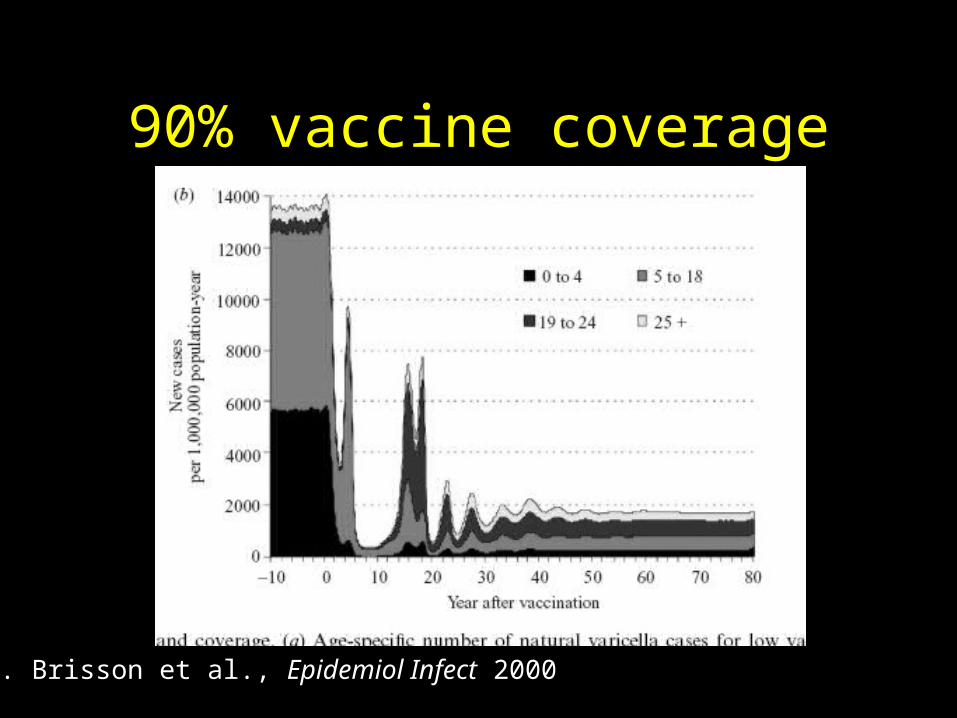
90% vaccine coverage
M. Brisson et al., Epidemiol Infect 2000
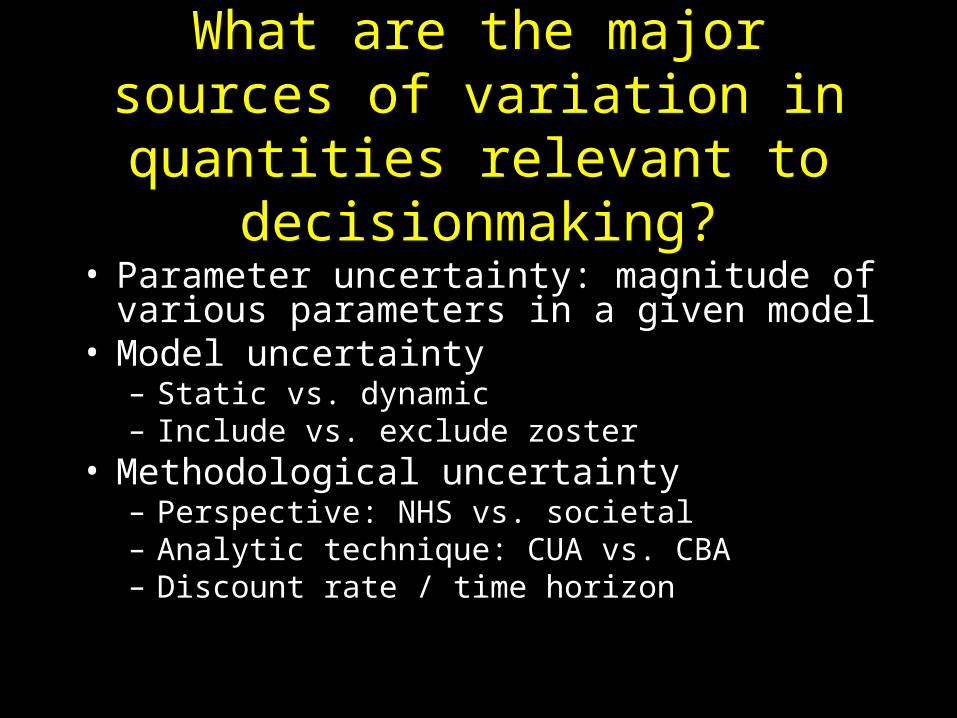
What are the major sources of variation in quantities relevant to
decisionmaking?
• Parameter uncertainty: magnitude of various parameters in a given model
• Model uncertainty– Static vs. dynamic– Include vs. exclude zoster
• Methodological uncertainty– Perspective: NHS vs. societal– Analytic technique: CUA vs. CBA– Discount rate / time horizon
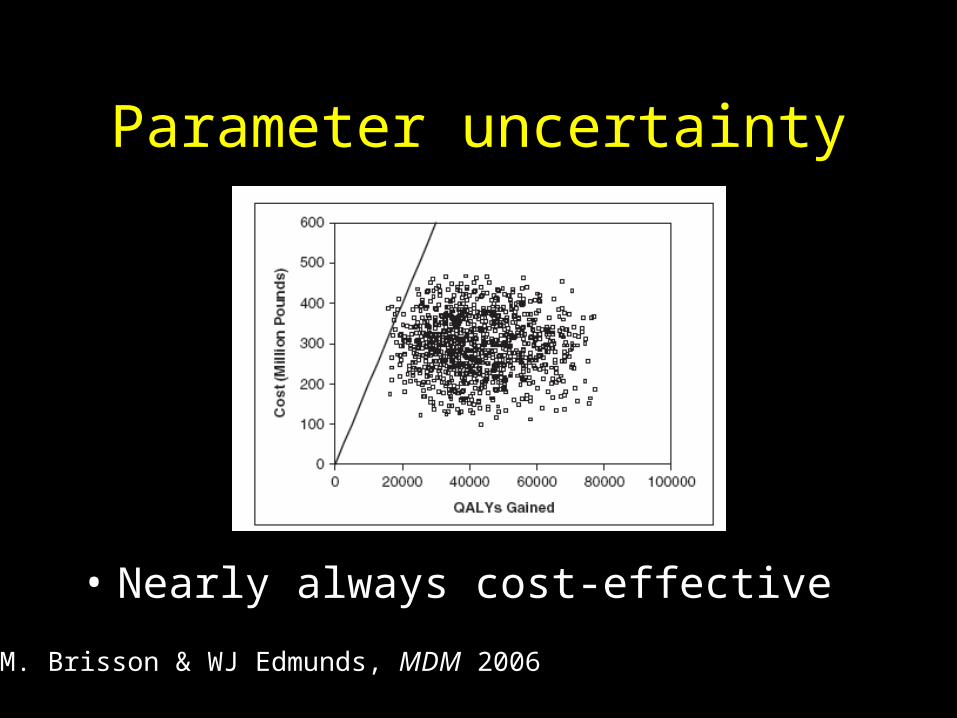
Parameter uncertainty
• Nearly always cost-effective
M. Brisson & WJ Edmunds, MDM 2006
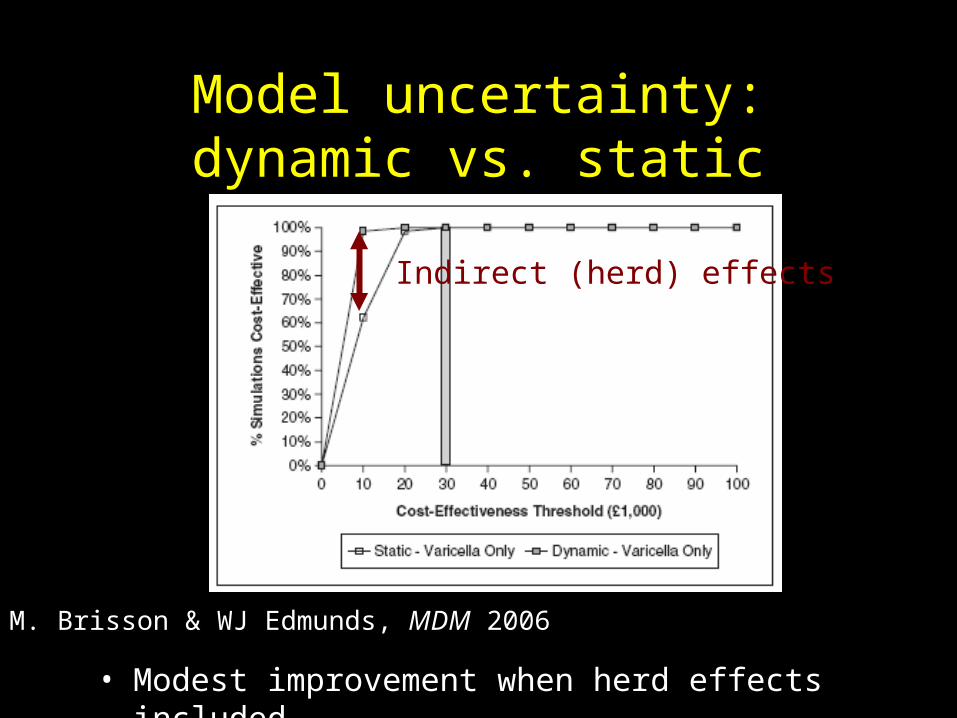
Model uncertainty: dynamic vs. static
Indirect (herd) effects
M. Brisson & WJ Edmunds, MDM 2006
• Modest improvement when herd effects included
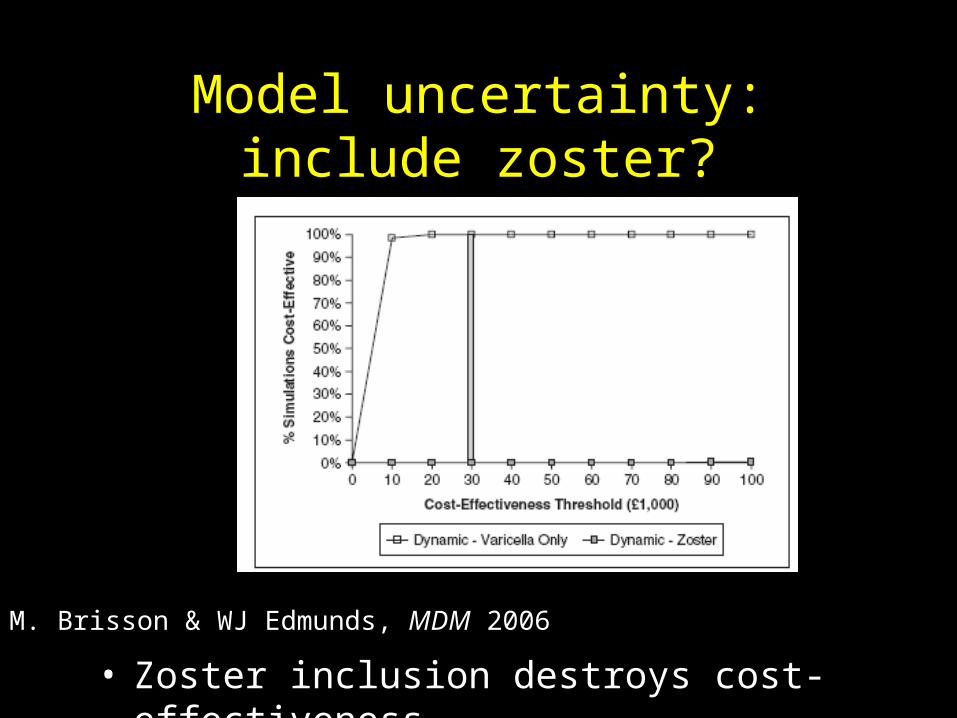
Model uncertainty: include zoster?
• Zoster inclusion destroys cost-effectiveness
M. Brisson & WJ Edmunds, MDM 2006
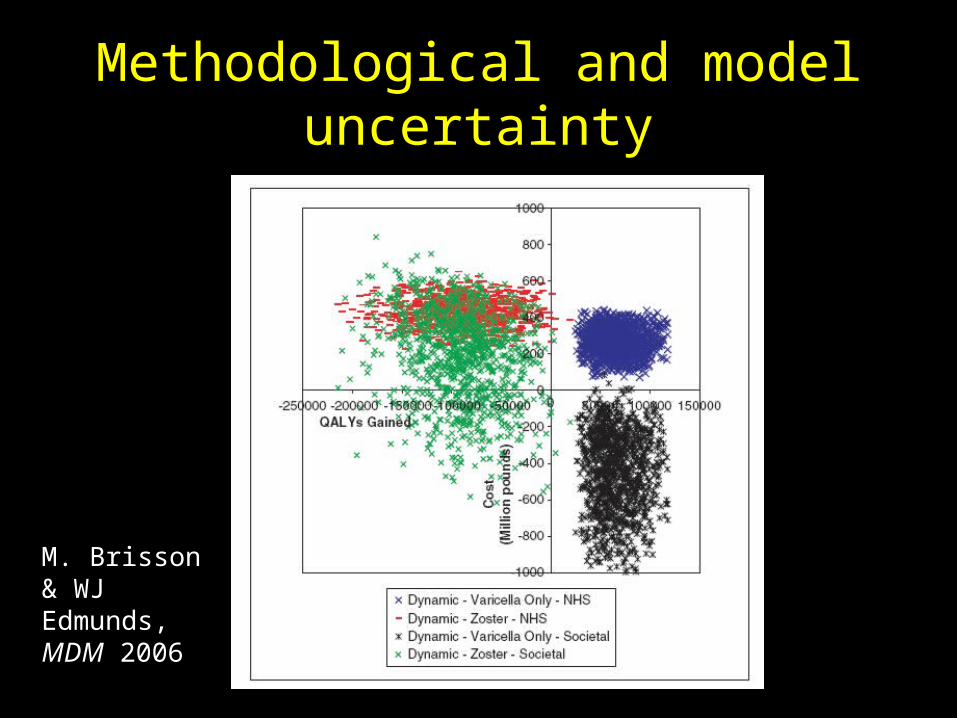
Methodological and model uncertainty
M. Brisson & WJ Edmunds, MDM 2006
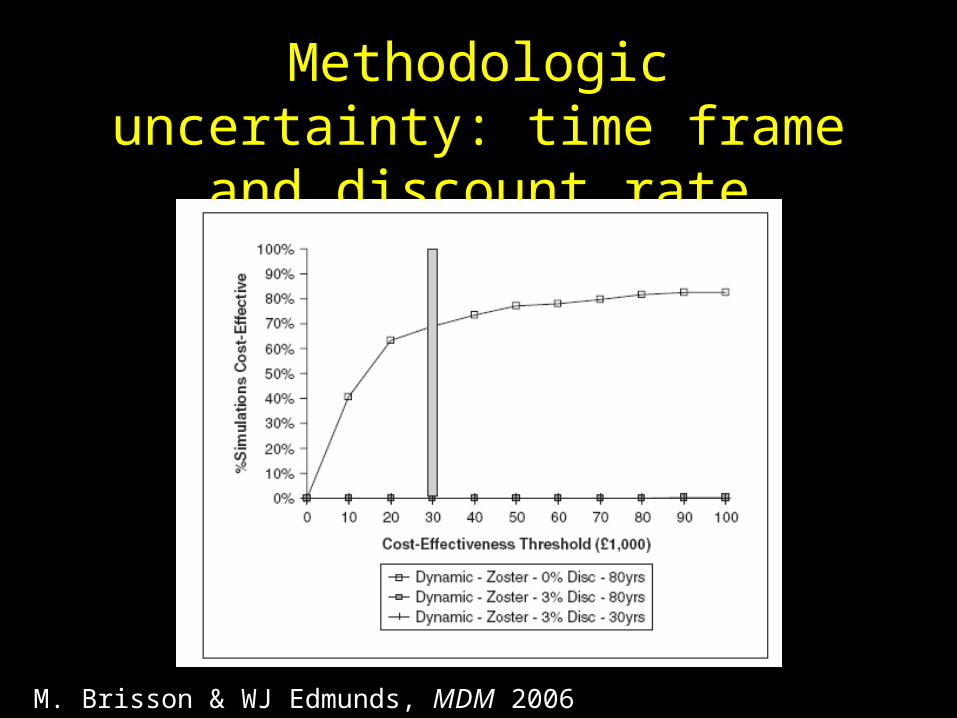
Methodologic uncertainty: time frame and discount rate
M. Brisson & WJ Edmunds, MDM 2006
Summary: VZV Example
• Three key points about VZV require dynamic models– Indirect benefits (+)– Increased age of infection (-)– Boosting and zoster (-)
• Use of static vs. dynamic models changes result quantitatively but not qualitatively
• Incorporation of zoster within dynamic model changes qualitative result: not beneficial!
• Perspective, time discounting, and model uncertainty >> parameter uncertainty in importance, but these are hardest to assess!
Summary: Overall
• Random Parameter Sampling quantifies uncertainty in deterministic framework– Parameter uncertainty, not structural
uncertainty
• Assumptions about model structure can often impact results more than uncertainty about parameter values