
SENSITIVITY ANALYSIS OF LATERAL BUCKLING - stuba.sk · HOT-ROLLED STEEL BEAMS Doc. Ing. Zdeněk...
6
9 SENSITIVITY ANALYSIS OF LATERAL BUCKLING STABILITY PROBLEMS OF ... Z. KALA, J. KALA SENSITIVITY ANALYSIS OF LATERAL BUCKLING STABILITY PROBLEMS OF HOT-ROLLED STEEL BEAMS Doc. Ing. Zdeněk KALA, PhD. Brno University of Technology, Faculty of Civil Engineering, Department of Structural Mechanics Veveří St. 95, 602 00 Brno, Czech Republic E-mail: [email protected] Tel: +420-541147382 Fax: +420-541240994 Ing. Jiří KALA, PhD. Brno University of Technology, Faculty of Civil Engineering, Department of Structural Mechanics Veveří St. 95, 602 00 Brno, Czech Republic E-mail: [email protected] Tel: +420-541147382 Fax: +420-541240994 1. INTRODUCTION Generally, a sensitivity analysis can be divided into two groups: (1) Deterministic sensitivity analysis (or also design sensitivity) is a relatively well known mean often applied in structure design. It accompanies the design process in which a calculation model is being used which enables the change, step-by-step, of the values of one input quantity, and to investigate, by means of a parametric study, how this change manifests itself in an output quantity (e.g., a load-carrying capacity). Although the studies are of high worth and provide quick orientation concerning a model behaviour, they do not always enable, in a satisfactory manner, any realistic finding out of the whole spectrum of possible cases which could really occur in an actual structure. The parametric study is mostly mentioned in this connection. (2) Stochastic sensitivity analysis provides more complete (and more quantified!) information on the effect of parameters. The procedure of sensitivity determination is, to a certain extent, similar to a deterministic sensitivity analysis. A parameter change is carried out, as well, and the manifestation of this change in the output quantity is studied. The input quantity change here, however, also takes into consideration the occurrence frequency, i.e., the realizations of input random quantities are simulated as if they were obtained by measurements. Usually, the experimental phase representing the calculation model is understood as the simulation stage. Its aim is the behaviour analysis of a system depending on the input quantities and parameter values. 2. SENSITIVITY ANALYSIS The analysis of the effect of input quantity variability on the ABSTRACT KEY WORDS • sensitivity, stability, • lateral beam buckling, • imperfections, • simulation method, • statistics The effect of the initial geometric and material imperfections on the load-carrying capacity of bending stressed beams made of an IPE profile solved including the lateral buckling effect is studied by means of sensitivity analysis. Several variants of beams with different degrees of slenderness are solved. Members are modelled, assuming a thin- walled effect. Imperfections are considered to be random quantities. The histograms of the main quantities (yield strength, e.g.) were determined experimentally. Random quantities which were not measured were taken over from specialized literature. For taking the variability of input quantities into consideration, the numerical simulation method (a method of the Monte Carlo type) has been used. The random load-carrying capacity is, in each simulation method run, solved by a geometricly and materially nonlinear FEM solution. 2005/2 PAGES 9 – 14 RECEIVED 18.10.2004 ACCEPTED 18.4.2005 kala.indd 9 2. 5. 2006 12:14:21
Transcript of SENSITIVITY ANALYSIS OF LATERAL BUCKLING - stuba.sk · HOT-ROLLED STEEL BEAMS Doc. Ing. Zdeněk...
9SENSITIVITY ANALYSIS OF LATERAL BUCKLING STABILITY PROBLEMS OF ...
Z. KALA, J. KALA
SENSITIVITY ANALYSIS OF LATERAL BUCKLING STABILITY PROBLEMS OF HOT-ROLLED STEEL BEAMS
Doc. Ing. Zdeněk KALA, PhD.
Brno University of Technology,Faculty of Civil Engineering,Department of Structural MechanicsVeveří St. 95, 602 00 Brno, Czech RepublicE-mail: [email protected]: +420-541147382Fax: +420-541240994
Ing. Jiří KALA, PhD.
Brno University of Technology,Faculty of Civil Engineering,Department of Structural MechanicsVeveří St. 95, 602 00 Brno, Czech RepublicE-mail: [email protected]: +420-541147382Fax: +420-541240994
1. INTRODUCTION
Generally, a sensitivity analysis can be divided into two groups:
(1) Deterministic sensitivity analysis(or also design sensitivity) is a relatively well known mean often applied in structure design. It accompanies the design process in which a calculation model is being used which enables the change, step-by-step, of the values of one input quantity, and to investigate, by means of a parametric study, how this change manifests itself in an output quantity (e.g., a load-carrying capacity). Although the studies are of high worth and provide quick orientation concerning a model behaviour, they do not always enable, in a satisfactory manner, any realistic finding out of the whole spectrum of possible cases which could really occur in an actual structure. The parametric study is mostly mentioned in this connection.
(2) Stochastic sensitivity analysis provides more complete (and more quantified!) information on the effect of parameters. The procedure of sensitivity determination is, to a certain extent, similar to a deterministic sensitivity analysis. A parameter change is carried out, as well, and the manifestation of this change in the output quantity is studied. The input quantity change here, however, also takes into consideration the occurrence frequency, i.e., the realizations of input random quantities are simulated as if they were obtained by measurements. Usually, the experimental phase representing the calculation model is understood as the simulation stage. Its aim is the behaviour analysis of a system depending on the input quantities and parameter values.
2. SENSITIVITY ANALYSIS
The analysis of the effect of input quantity variability on the
ABSTRACT KEY WORDS
• sensitivity, stability, • lateral beam buckling, • imperfections, • simulation method, • statistics
The effect of the initial geometric and material imperfections on the load-carrying capacity of bending stressed beams made of an IPE profile solved including the lateral buckling effect is studied by means of sensitivity analysis. Several variants of beams with different degrees of slenderness are solved. Members are modelled, assuming a thin-walled effect. Imperfections are considered to be random quantities. The histograms of the main quantities (yield strength, e.g.) were determined experimentally. Random quantities which were not measured were taken over from specialized literature. For taking the variability of input quantities into consideration, the numerical simulation method (a method of the Monte Carlo type) has been used. The random load-carrying capacity is, in each simulation method run, solved by a geometricly and materially nonlinear FEM solution.
2005/2 PAGES 9 – 14 RECEIVED 18.10.2004 ACCEPTED 18.4.2005
kala.indd 9 2. 5. 2006 12:14:21

10 SENSITIVITY ANALYSIS OF LATERAL BUCKLING STABILITY PROBLEMS OF ...
2005/2 PAGES 9 — 14
output quantity variability will be called the ”sensitivity analysis” (Novák 1993, Kala 2004). In other words, it will be studied as to how the random variability of a certain input quantity affects (compared to the others) the scattering of structure response, and how it participates, e.g., in the resulting probability of failure. So, the sensitivity analysis also answers the question as to which quantities are dominant, and therefore they have to be paid particular attention to when (i) preparing the input values; (ii) considering and deciding on improvement of technological procedures; (iii) conceiving and organizing the control activities. Also, economic criteria are usually included into cases (ii) and (iii). Moreover, it is possible to distinguish by means of the sensitivity analysis which quantities are in a rather low influential position; therefore they can be considered only in a deterministic way (as non-random ones). This can contribute to simplification and acceleration both of the calculations and modelling. This approach is applied abroad but rather in a marginal manner. In the majority of cases, contemporary models are based on FEM (geometricly and materially nonlinear) and processed on behalf of simulation technologies - Monte Carlo, Latin Hypercube Sampling, Importance Sampling, etc.In recent years, numerous methods of stochastic sensitivity analysis have been developed and many possibilities for its practical application have been introduced. For our purposes, the procedures to be possibly applied for evaluating a sensitivity analysis can be divided as follows:• A method based on studying the correlation coefficient.• A method based on studying the proportion of variation
coefficients.• Special methods of probability analysis.
The first method mentioned can be applied practically for all numerical simulation methods of the Monte Carlo type. The procedure described is based on the assumption that for the quantities to which the output is relatively more sensitive, the correlation degree with the output will be higher. Within the framework of the simulation method, the so-called Spearman rank-order correlation coefficient ri is being used:
, (1)
where mji is the layer number in the jth simulation run for the ith
input quantity, nj is the order of y output values in an ordered set y1<y2<…
<yN.
3. INPUT RANDOM QUANTITIES
(1) Material characteristicsStatistical characteristics of strength and material quantities represent the major basis for many research activities. When changing these characteristics over the course of time, even a change in the results of relative studies can take place. It is always necessary to be actually based on topical experimentally found data and to study their development over time. Statistical characteristics obtained by evaluating the data of experimental research into rolled steel IPE profiles are given in Tab.1.
Table 1 Material characteristics of steel grade S235
Quantity MeanStandard deviation
Skew-ness Kurtosis
Yield strength
297.3 MPa 16.8 MPa 0.325 2.541
Tensile strength
403.8 MPa 11.3 MPa 0.326 2.845
Ductility 37.8 % 2.9 % -0.753 5.180
Fig.1 Histogram of yield strength (IPE160 to IPE240)
kala.indd 10 2. 5. 2006 12:14:23

2005/2 PAGES 9 — 14
11SENSITIVITY ANALYSIS OF LATERAL BUCKLING STABILITY PROBLEMS OF ...
Mechanical characteristics of these beams are evaluated, based on 562 samples taken from one third of a flange (Melcher 2004).
(2) Geometric characteristicsGeometric imperfections of cross-section dimensions are presented in Fig. 2. The quantities h, b, t1, t2 were measured experimentally for 562 samples IPE160 to IPE240, see Fig. 2a and Tab. 2.Relative statistical characteristics are given in Tab.2. For the solved case of a beam made of an IPE270 profile, it is necessary to multiply them again by the nominal values h=270mm, b=135mm, t1=6.6, t2=10.2mm.
For unmeasured random quantities k1, k2, f, m, the determination of statistical characteristics was based on the tolerance range of the European international standard Tolerance Standard EN 10034:1993.
(3) Model of input random quantitiesAmong the other significant quantities which were not measured is residual stress. The residual stress was introduced with a mean value mrs=60 MPa and standard deviation Srs=30 MPa, with a triangular distribution both on the flanges and web (Daddi 1974). The initial curvature of the beam axis with length L was considered both in the direction of axis y and axis z (see Fig.2d) in sine shape curves with maximum amplitudes, the uniform distribution being within the interval <0; L/1000>. These statistical characteristics comply well with Tolerance Standard EN 10034: 1993.
The last random quantity which - as will be shown below – cannot be considered in a deterministic way is the Young’s modulus E. The effect of deviations of both the physical and mechanical material characteristics, heterogeneity above all, is taken into consideration by the variability of the quantity. The Gaussian distribution with a mean value mE =210 GPa and standard deviation SE = 12.6 GPa was considered. These statistical characteristics comply well with the experimental results (Fukumoto 1976 and Soares 1988).
Fig.2 IPE profile geometric characteristics
Table 2 Relative statistical geometric characteristics
Quantity MeanStandard deviation
Skew- ness Kurtosis
h 1.0010 0.0044 -0.4063 3.0150b 1.0138 0.0100 -0.4766 4.0400t1 1.0550 0.0418 1.0545 7.4730t2 0.9929 0.0461 -0.0763 2.8188
Table 3 Input random quantities
Random variablesProb. func.
Mean mXStandard deviation SX
Yield strength fy * 297.3 MPa 16.8 MPaYoung’s modulus E ** 210 GPa 12.6 GPaCross-sectional depth h * 270.27mm 1.19mmCross-sectional width b * 136.86mm 1.35mmWeb thickness t1 * 6.96mm 0.28mmFlange thickness t2 * 10.13mm 0.47mmUpper flange displ. k1 ** 0 mm 0.09 mmLower flange displ. k2 ** 0 mm 0.09 mmInitial web deflection f ** 0 mm 0.75 mmInitial web no central axis
m ** 0 mm 1.25 mm
Residual stress rs ** 60 MPa 30 MPaAmplitude of bar initial axis curvature
e1,2Rectangular in the interval <0 ; L/1000 >
* Histogram; ** Gauss
kala.indd 11 2. 5. 2006 12:14:25
12 SENSITIVITY ANALYSIS OF LATERAL BUCKLING STABILITY PROBLEMS OF ...
2005/2 PAGES 9 — 14
4. STOCHASTIC MODEL
(1) Simulation methodThe realizations of input random quantities were simulated by the numerical simulation method Latin Hypercube Sampling (LHS) for 200 simulation runs. The LHS method is an improved version of the Monte Carlo method. By means of the LHS method, the realizations of random imperfections were simulated as if they were obtained by measurements on real members.
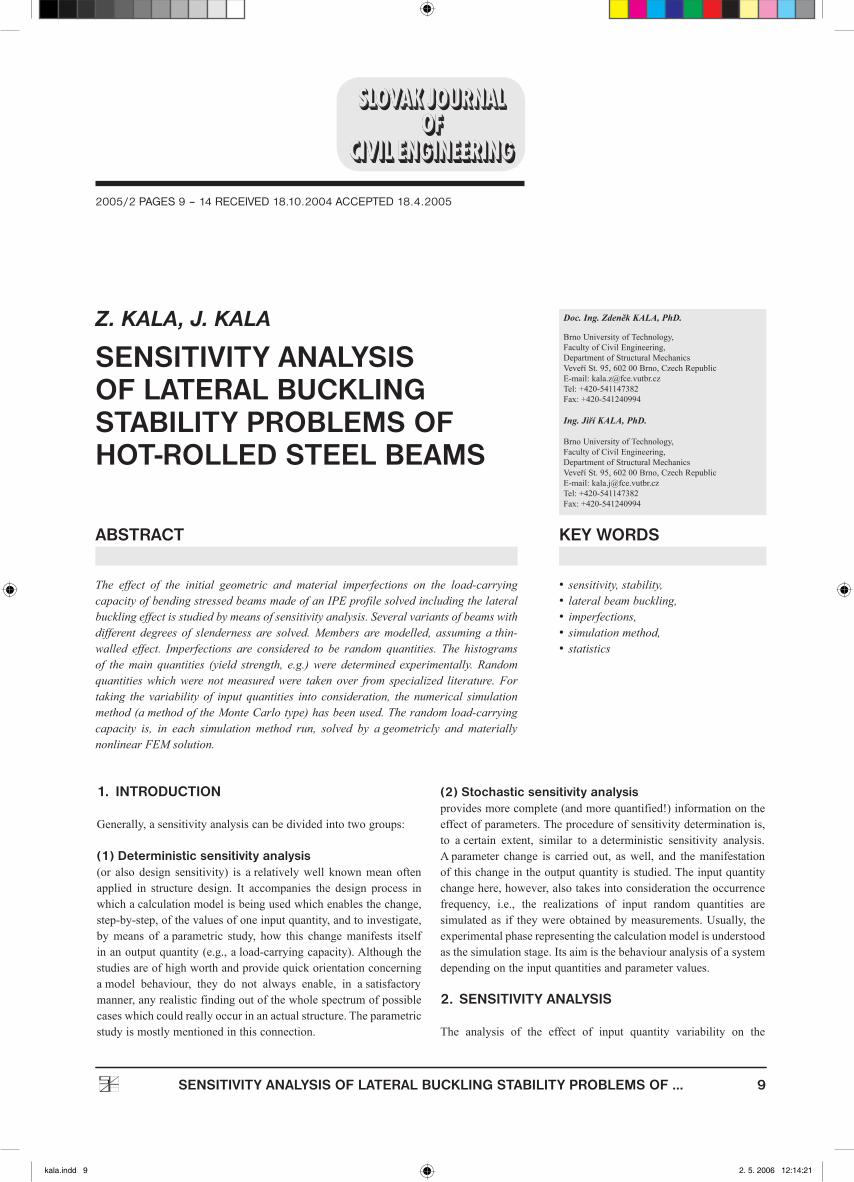
(2) Nonlinear computer modelThe load-carrying capacity of a hot-rolled steel beam simply bending stressed and solved with the effect of lateral beam buckling was calculated in each simulation run. The load-carrying capacity was calculated in each simulation run. The member was modelled by the Ansys programming system and by means of Shell 43 elements, see Fig. 3. Both upper and lower flanges and web, as well, were divided into 12 segments. The loading tests were computer simulated. The geometricly and physically nonlinear solution by the Newton-Raphson method was applied in combination with the Euler method; an automatic decreasing of the loading step was applied. The force at which the determinant of the tangential stiffness approached zero, was considered as the limit load. The accurateness of 0.1 % was taken into account.With regard to the large numerical exacting character of the problem solved, the use of symmetry was taken. The prevention of shifts in all the cross-section nodes in the direction of axis x and by rotation around axis y was assumed in the beam half within the symmetry plane. On the other margin of the half solved beam, the shift of nodes in the direction of axis y was prevented on the web of an IPE270 profile. The shifts in direction of axis y were prevented on the lower flange of this margin. The upper flange was left free.
5. RESULTS OF SENSITIVITY ANALYSIS
The manifestation of input random quantities in the load-carrying capacity variability was analyzed by sensitivity analysis. The sensitivity was evaluated in the form of Spearman rank-order correlation coefficients (1). Before presenting the sensitivity analysis results for a slender beam solved with the effect of lateral buckling, let us analyze a standard example of simple bending.
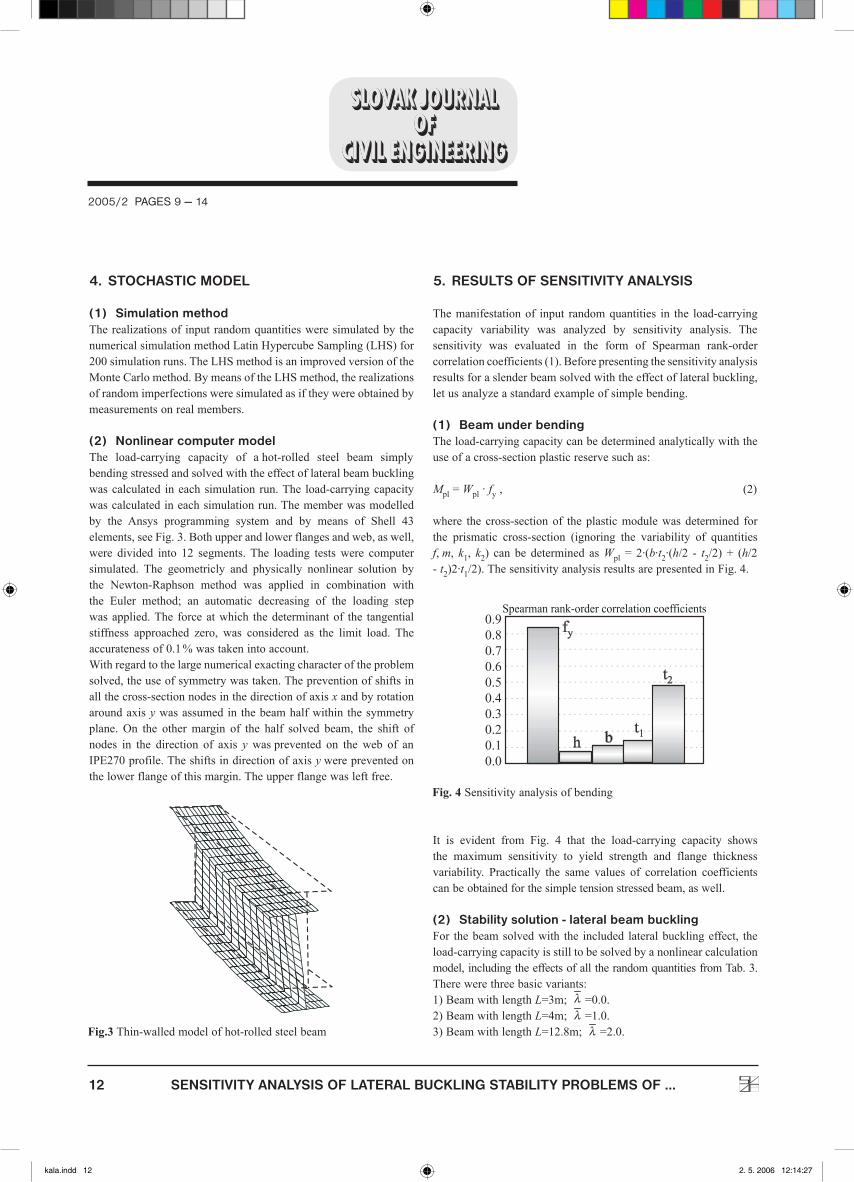
(1) Beam under bendingThe load-carrying capacity can be determined analytically with the use of a cross-section plastic reserve such as:
Mpl = Wpl · fy , (2)
where the cross-section of the plastic module was determined for the prismatic cross-section (ignoring the variability of quantities f, m, k1, k2) can be determined as Wpl = 2·(b·t2·(h/2 - t2/2) + (h/2 - t2)2·t1/2). The sensitivity analysis results are presented in Fig. 4.
It is evident from Fig. 4 that the load-carrying capacity shows the maximum sensitivity to yield strength and flange thickness variability. Practically the same values of correlation coefficients can be obtained for the simple tension stressed beam, as well.
(2) Stability solution - lateral beam bucklingFor the beam solved with the included lateral buckling effect, the load-carrying capacity is still to be solved by a nonlinear calculation model, including the effects of all the random quantities from Tab. 3. There were three basic variants:1) Beam with length L=3m; =0.0.2) Beam with length L=4m; =1.0.3) Beam with length L=12.8m; =2.0.Fig.3 Thin-walled model of hot-rolled steel beam
Fig. 4 Sensitivity analysis of bending
kala.indd 12 2. 5. 2006 12:14:27

2005/2 PAGES 9 — 14
13SENSITIVITY ANALYSIS OF LATERAL BUCKLING STABILITY PROBLEMS OF ...
For variant 1, lateral buckling was wholly prevented by the lateral boundary conditions at the margin of the compression flange. The sensitivity analysis results are given in Figs. 5, 6, and 7.The correlation coefficient’s positive value also means that the load–carrying capacity increases with the increase in the input quantity value. The correlation coefficient 1 (and/or –1) would mean the functional dependence between input and output.
6. CONCLUSION
(1) Summary of the most important resultsIt is evident from Figs 5-7 that the sensitivity coefficients change depending on the beam’s slenderness.Fig. 5 shows that the variability of the load-carrying capacity of the beam with nondimensional slenderness =0.0 is very sensitive to the variability of flange thickness t2 above all, and further on, also on the yield strength ‘s variability.In the case of a beam with a nondimensional slenderness =1.0, the load-carrying capacity‘s variability is sensitive to the variability of the flange thickness t2 , the amplitude e1 of the initial curvature in the direction of axis y (see Fig. 2d), yield stress fy, see Fig. 6. The effect of residual stress rs is also relatively large. The differentiation of the load-carrying capacity of the compressed beams is derived from the effects of the residual stresses above all. For the value approximately for =1.0, the curves of the normative buckling strength a, b, c, d of the standards for steel structure design (national standards or Eurocodes) are the most different and, at the same time, they sink the most rapidly, too.For a beam with the nondimensional slenderness =2.0, the change in the load-carrying capacity is the most sensitive to flange thickness t2, and to Young’s modulus E changes.The sensitivity coefficient of the flange thickess t2, is more important than the sensitivity coefficient of the flange width ”b”, as its relative change has a more significant effect on the flange area affecting the stability resistance of a slender beam under bending. An analysis in more detail, see (Kala 2005). The comparison of the deterministic and of the stochastic sensitivity analysis was published in (Kala 2002).
(2) Conclusions and recommendations for industrial manufacturing
The input random imperfections can be divided into approximately two basic groups – those the statistical characteristics of which can be favorably affected by manufacturing (yield strength, geometrical characteristics, residual stress), and those which are not sensitive to changes in manufacturing technology (e.g., variability of Young’s modulus E) to a satisfactory extent. The first group of quantities can be additionally subdivided into two subgroups: (i) the mean value
Fig.5 Sensitivity analysis of the beam =0.0
Fig.6 Sensitivity analysis of the beam =1.0
Fig.7 Sensitivity analysis of the beam = 2.0
kala.indd 13 2. 5. 2006 12:14:31

14 SENSITIVITY ANALYSIS OF LATERAL BUCKLING STABILITY PROBLEMS OF ...
2005/2 PAGES 9 — 14
and standard deviation quantities can be changed by increasing the manufacturing quality. The quantity in question is, e.g., yield strength; (ii) quantities the mean value of which cannot be changed significantly because it would approximately correspond with nominal value (geometric characteristics of the cross-section dimensions).An important quantity, the variability of which affects the load-carrying capacity variability to a remarkably large extent, is the
flange thickness t2, see Figs. 5-7. The lowering of variability of this quantity can be positively affected by changing the manufacturing technology. The lowering of the yield strength by variability can be recommended for beams with a lower relative slenderness above all.ACKNOWLEDGMENTS: This paper has been developed under partial support by the GACzR projects 103/03/0233 and also within the Research Centre Project Reg.No.1M6840770001.
REFERENCES
• BALUT, N. and MOLDOVAN, A.: Sensitivity of Steel Structures to Different Categories of Imperfections, In Proc. of SDSS´99 (Dubina and Iványi, eds.), Elsevier Science 1999.
• DADDI, I. and MAZZOLANI, F.M.: Détermination expérimentale des imperfections structurales des profilés en acier, Construction métallique, n. 1, 1974, pp.24-45.
• FUKUMOTO, Y., KAJITA, N. and AOKI, T.: Evaluation of Column Curves Based on Probabilistic Concept, In Proc. of Int. Conference on Stability, Prelim. Rep., publ. by Gakujutsu Bunken Fukyu – Kai, Tokyo, 1976, pp.1-37.
• KALA, Z.: Sensitivity Analysis of the Stability Problems of Thin-Walled Structures, Journal of Constructional Steel Research 61 (2005), pp.415-422, ISSN 0143-974X.
• KALA, Z.: Verification of the criteria for steel structures design by reliability analysis methods, Assoc. Prof. Thesis, Brno University of Technology – Faculty of Civil Engineering, 2002.
• KALA, Z., KALA, J., ŠKALOUD, M. and TEPLÝ, B.: Sensitivity Analysis of the Effect of Initial Imperfections on the Stress State in the Crack-Prone Areas of Breathing Webs, In Proc. of the Fourth Int. Conf. on Thin-Walled Structures, Loughborough (England, UK), 2004, pp.499-506, ISBN 0 7503 1006-5.
• KALA, Z., KALA, J., ŠKALOUD, M., TEPLÝ, B., MELCHER, J., NOVÁK, D.: Sensitivity Analysis of Engineering Structures, In CD Proc. of the European Congress on Computational Methods in Applied Sciences and Engineering - ECCOMAS 2004, Jyväskylä (Finland), 2004, ISBN 951-39-1868-8.
• MELCHER, J., KALA, Z., HOLICKÝ, M., FAJKUS, M., and ROZLÍVKA, L.: Design Characteristics of Structural Steels Based on Statistical Analysis of Metallurgical Products, Journal of Constructional Steel Research 60 (2004), pp.795-808, ISSN 0143-974X.
• NOVÁK, D., TEPLÝ, B. and SHIRAISHI, N.: Sensitivity Analysis of Structures: A Review, In Proc. 5th International Conference on Civil and Structural Engng. Computing, Edinburgh (UK), 1993, p.201-207.
• GUEDES SOARES, C.: Uncertainty Modelling in Plate Buckling, Journal Structural Safety, 1988, (5), pp.17 34.
• ANSYS Element Reference, Release 5.5, Inc. 1998.• EN 10034: Bars with I and H cross-sections made of structural
steels – Limit deviations of dimensions and form tolerance, September 1995.
kala.indd 14 2. 5. 2006 12:14:34


![PROG1 - UIMPROG1 Prednášajúci: Tomáš Fabšič, tomas.fabsic[at]stuba.sk (dnes zastupuje Viliam Hromada) Cvičiaci: Viliam Hromada, viliam.hromada[at]stuba.sk Tomáš Fabšič](https://static.fdocuments.us/doc/165x107/603e7160ccd67d59c2589a8e/prog1-uim-prog1-prednajci-tom-fabi-tomasfabsicatstubask-dnes.jpg)

