Sensitivity Analysis: Comparing the Impact of...
81
Sensitivity Analysis: Comparing the Impact of Design, Operation, and Tenant Behavior on Building Energy Performance Jonathan Heller and Morgan Heater, Ecotope Mark Frankel, New Buildings Institute white paper July 2011 This work supported the California Energy Commission Evidence-based Design and Operations Research Program managed by NBI.
Transcript of Sensitivity Analysis: Comparing the Impact of...
Sensitivity Analysis: Comparing the Impact of Design, Operation, and Tenant Behavior on Building Energy Performance
Jonathan Heller and Morgan Heater, EcotopeMark Frankel, New Buildings Institute
white paperJuly 2011
This work supported the California Energy Commission Evidence-based Design and Operations Research Program managed by NBI.
This work supported the California Energy Commission Evidence-based Design and Operations Research Program managed by NBI.
i nbi: new buildings institute | Sensitivity Analysis
Introduction ............................................................................................1
Overview ................................................................................................2
Energy Modeling .................................................................................3
Codes .................................................................................................3
Operation/Occupancy .........................................................................3
Climate Response ...............................................................................4
Defi ning the Measures .........................................................................4
Sample Results Summary ...................................................................9
Application to Existing Buildings ..........................................................9
Setting Up The Analysis ........................................................................11
Variable Selection and Modeling Procedure .......................................11
Prototype Description And Variable Range ........................................14
Modeling Limitations .........................................................................18
Recommended Additional Research .................................................19
Observations on Results .......................................................................21
Building and System Designers .........................................................21
Bundling Design Impacts ..................................................................24
Occupant, Operations and Commissioning Effects............................25
Building Operations .......................................................................27
Tenant Impacts ..............................................................................27
Combined Post-Construction Impacts ...........................................27
Climate-Responsive Approach ..........................................................29
Seattle – Moderate Heating Climate ..............................................30
Phoenix: Hot Dry Climate ..............................................................36
Atlanta: Warm Moist Climate .........................................................40
Chicago: Cold Climate ...................................................................42
Measure Interactions .........................................................................44
Energy Use Index (EUI): KBtu/SF/yr...................................................45
Energy Codes ...................................................................................46
Summary ..............................................................................................50
Appendices A-D ...................................................................................51
Contents
nbi: new buildings institute | Sensitivity Analysis1
Introduction The goal of this study is to compare the magnitude of energy impact that
modifi cations to design, operation and tenant behavior characteristics
have on total building energy use. The DOE/NREL mid-size offi ce
prototype was used as a representative building type for this analysis. A
set of 28 distinct building features was identifi ed representing physical and
operational characteristics of buildings that affect total building energy
use. For each characteristic, a range of performance values was identifi ed
representing poor, baseline and good practice with respect to building
energy performance. These values were determined from a range of
published building characteristic studies, fi eld research currently underway
and professional judgment. The impact on total building energy use was
evaluated as each variable was modifi ed from low to high performance
individually, while all other characteristics were kept at the baseline
performance level. To more accurately represent interactive effects, good
and poor practice packages of measures were also analyzed to represent
various combinations of these strategies. The analysis was conducted
using weather data from 16 different cities to represent the range of
climate types identifi ed by DOE/ASHRAE for US design criteria. The work
was completed jointly by Ecotope and New Buildings Institute (NBI).
Results of this analysis are summarized in the overview below and in the
accompanying report.
2 nbi: new buildings institute | Sensitivity Analysis
OverviewAlthough nearly everyone interacts with buildings on a daily basis, if
you were to ask most people about building energy effi ciency, the vast
majority would describe physical features like insulation, effi cient HVAC
and lighting, or alternative energy systems. The perception in the market
is that the responsibility for building energy performance is in the hands
of architects and engineers and is relatively set once the building is
constructed. This perception represents a signifi cant barrier to broad
societal goals to substantially improve building energy performance and
refl ects an extremely inaccurate perception of how buildings work. In
fact, a signifi cant percentage of building energy use is driven directly
by operational and occupant habits that are completely independent of
building design, and in many cases these post-design characteristics can
have a larger impact on total energy use than many common variations in
the design of the building itself.
This study was designed to try to quantify the degree to which operational
energy-use characteristics affect building energy use and compare these
variables to the relative impact of what are typically considered building
design characteristics. While the results of this study are informative to
the design community in prioritizing energy strategies for buildings, they
have even more signifi cant implications on how buildings are operated
and occupied and on how design teams should communicate information
about building performance to building owners, operators and occupants.
The results of this study can provide a broader perspective on how
buildings use energy and on what aspects of building energy performance
deserve more attention in design, operation and policy strategies.
The analysis demonstrates the relative impact of a range of variables
affecting building design and operation on building energy performance.
These variables include physical features of the building; HVAC, lighting
and control system characteristics and effi ciencies; operational strategies;
tenant behavior characteristics; and climate, all of which affect building
energy use. For each variable, a baseline condition was defi ned based on
typical building characteristics. A range of outcomes that represent good
and poor responses to these variables was identifi ed. All of the variable
ranges used in this study are based on research and fi eld observations
of actual building performance characteristics that can be found in
the building stock today; they do not represent extreme or theoretical
conditions.
nbi: new buildings institute | Sensitivity Analysis3
Energy Modeling One of the most important design tools used to make informed decisions
about energy effi cient design strategies is energy modeling software.
Energy models are used to decide between energy performance features
and options, to demonstrate code compliance, to qualify for utility
incentive payments, to target specifi c high-performance goals and even to
distribute responsibility for energy bills among tenants. Energy modeling
was used in this study to compare the signifi cance of the building
characteristics evaluated here. However, in practice, energy modeling is
seldom an accurate prediction of actual building energy use outcome.
Conventional energy modeling is typically only used to tell part of the
story of building performance, and the results of energy modeling are
often misinterpreted in the context of actual outcome. The results of this
study demonstrate that energy modeling can be more accurate and more
informative if greater attention is paid to the operational characteristics of
the building. The study therefore has implications for improving modeling
accuracy. These results also serve as a way to prioritize various building
performance upgrades even before a modeling exercise is undertaken.
Energy codes have been widely adopted to set a minimum performance
level for building energy effi ciency. Recently, a great deal of attention and
effort has gone into developing and adopting increasingly stringent energy
code requirements. However, energy codes only regulate certain aspects
of building performance; this study demonstrates that there are signifi cant
opportunities for building performance improvement in aspects of building
energy use not currently regulated by code. The study also demonstrates
that there are opportunities for climate-based improvements in code
strategies that would be more effective than some of the current climate-
neutral regulations in the codes. The results of the study also highlight
areas where additional code improvements in currently regulated areas
might be effective.
The design community (architects, engineers, government and supporting
organizations) has widely adopted aggressive goals for building
performance improvement over time. For example, the 2030 Challenge
prescribes that all new commercial buildings will achieve net-zero annual
energy use by 2030, with signifi cant improvements in the existing building
stock in the same time frame. These goals have led to signifi cant attention
on high-performance building design strategies, along with the growing
realization that building design characteristics alone cannot achieve
these goals. A key focus of this study is on the ‘operational variables’
Codes
Operation/Occupancy
4 nbi: new buildings institute | Sensitivity Analysis
that affect building performance after the building is designed, built
and occupied. While design characteristics have a signifi cant impact
on long-term building energy use, building maintenance, operation and
occupancy strategies are absolutely critical to the long-term performance
characteristics of buildings. The results of this study show that a range
of occupancy factors can result in a range of impacts on energy use that
equal or exceed the signifi cance of many design decisions on building
energy use. This demonstrates how critical it is to engage building
operators and tenants in any long-term strategy to manage and improve
building energy performance.
It is intuitive that climate and weather conditions affect building energy
use, but the degree to which climate itself is impacting building
performance characteristics is not always obvious in the design process.
For example, designers often target reduced lighting loads as an energy
effi ciency strategy but seldom recognize how much more critical this
strategy is when buildings are located in a cooling climate as opposed to
a heating-dominated building where the lights are contributing useable
heat to the building. This analysis was conducted for 16 different climate
zones, representing the range of climates identifi ed by ASHRAE as
distinct. The results of this study provide perspective on how the relative
importance of different effi ciency strategies varies by climate. This
information not only serves to focus design strategies on more critical
issues but can also inform improvements to code and incentive programs
that support improved building performance.
A set of 28 building characteristics was identifi ed to represent the
variables analyzed in this study. These characteristics represent a key
set of features and operational characteristics that impact building
energy use and can be broken down into three categories: design
variables, operating characteristics and tenant behavior impacts. In
the operating characteristics category, some of the variables identifi ed
represent proxies for the anticipated impacts of a set of operation and
maintenance practices on system performance. In these cases proxies
were used because the modeling software could not specifi cally address
O&M issues. For example, a variation in duct static pressure was used
to represent the impact of clogged air fi lters from poor maintenance
practices as well as duct design characteristics.
For each performance variable, a baseline condition was identifi ed to
represent a typical building stock characteristic. A low and high range was
Climate Response
Defi ning the Measures
nbi: new buildings institute | Sensitivity Analysis5
also identifi ed for each variable to represent relatively poor and very good
design/operating practices for each case. These performance values were
gathered from a variety of reference sources, including CBECS, the Pacifi c
Northwest Baseline Analysis, ongoing PIER research and other research
and fi eld studies. (Additional information about sources can be found in
Appendix A.)
Defi ning the low- and high-performance ranges for each variable is a
key aspect of this study. In the case of variables with large impacts, the
defi nition of the range itself can signifi cantly alter the conclusion, while for
other variables the results are less dependent on the range assumptions.
For example, the presence of even a small data center has a huge impact
on total building energy use, so assumptions about data center operating
characteristics become critical to the analysis. On the other hand, the
range of outcome for heating equipment effi ciency is less signifi cant and
bound by the availability of equipment in the marketplace. The relative
range of outcome shown for each variable therefore represents not only
the importance of this variable to overall building performance but also the
importance of understanding the nature of these loads and characteristics
in the design process.
6 nbi: new buildings institute | Sensitivity Analysis
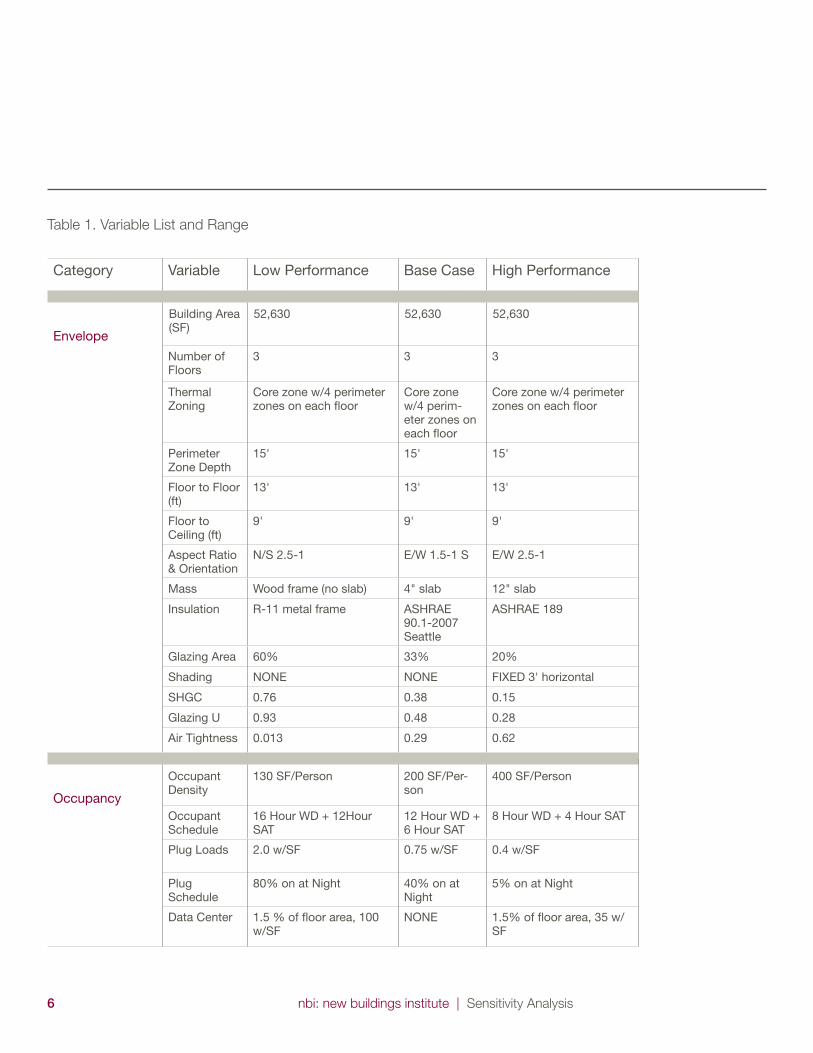
Table 1. Variable List and Range
Category Variable Low Performance Base Case High Performance
Envelope
Building Area (SF)
52,630 52,630 52,630
Number of Floors
3 3 3
Thermal Zoning
Core zone w/4 perimeter zones on each fl oor
Core zone w/4 perim-eter zones on each fl oor
Core zone w/4 perimeter zones on each fl oor
Perimeter Zone Depth
15' 15' 15'
Floor to Floor (ft)
13' 13' 13'
Floor to Ceiling (ft)
9' 9' 9'
Aspect Ratio & Orientation
N/S 2.5-1 E/W 1.5-1 S E/W 2.5-1
Mass Wood frame (no slab) 4" slab 12" slab
Insulation R-11 metal frame ASHRAE 90.1-2007 Seattle
ASHRAE 189
Glazing Area 60% 33% 20%
Shading NONE NONE FIXED 3' horizontal
SHGC 0.76 0.38 0.15
Glazing U 0.93 0.48 0.28
Air Tightness 0.013 0.29 0.62
Occupancy
Occupant Density
130 SF/Person 200 SF/Per-son
400 SF/Person
Occupant Schedule
16 Hour WD + 12Hour SAT
12 Hour WD + 6 Hour SAT
8 Hour WD + 4 Hour SAT
Plug Loads 2.0 w/SF 0.75 w/SF 0.4 w/SF
Plug Schedule
80% on at Night 40% on at Night
5% on at Night
Data Center 1.5 % of fl oor area, 100 w/SF
NONE 1.5% of fl oor area, 35 w/SF
nbi: new buildings institute | Sensitivity Analysis7
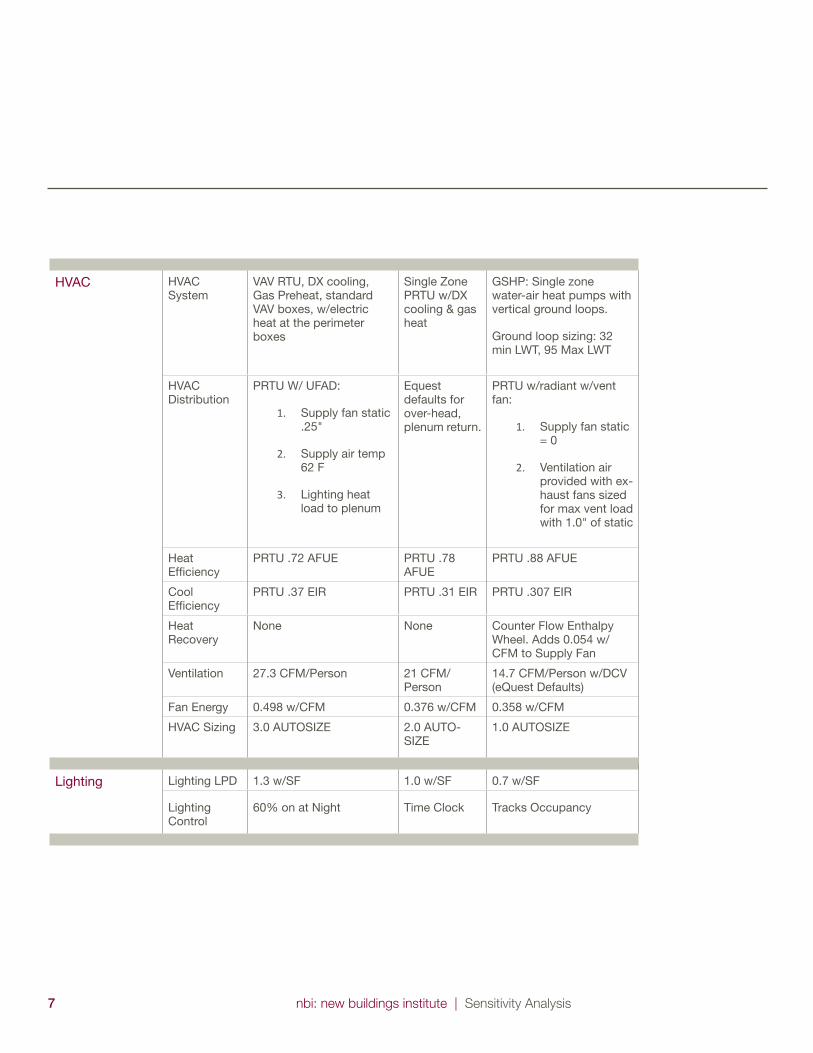
HVAC HVAC System
VAV RTU, DX cooling, Gas Preheat, standard VAV boxes, w/electric heat at the perimeter boxes
Single Zone PRTU w/DX cooling & gas heat
GSHP: Single zone water-air heat pumps with vertical ground loops.
Ground loop sizing: 32 min LWT, 95 Max LWT
HVAC Distribution
PRTU W/ UFAD:
1. Supply fan static .25"
2. Supply air temp 62 F
3. Lighting heat load to plenum
Equest defaults for over-head, plenum return.
PRTU w/radiant w/vent fan:
1. Supply fan static = 0
2. Ventilation air provided with ex-haust fans sized for max vent load with 1.0" of static
Heat Effi ciency
PRTU .72 AFUE PRTU .78 AFUE
PRTU .88 AFUE
Cool Effi ciency
PRTU .37 EIR PRTU .31 EIR PRTU .307 EIR
Heat Recovery
None None Counter Flow Enthalpy Wheel. Adds 0.054 w/CFM to Supply Fan
Ventilation 27.3 CFM/Person 21 CFM/Person
14.7 CFM/Person w/DCV (eQuest Defaults)
Fan Energy 0.498 w/CFM 0.376 w/CFM 0.358 w/CFM
HVAC Sizing 3.0 AUTOSIZE 2.0 AUTO-SIZE
1.0 AUTOSIZE
Lighting Lighting LPD 1.3 w/SF 1.0 w/SF 0.7 w/SF
Lighting Control
60% on at Night Time Clock Tracks Occupancy
8 nbi: new buildings institute | Sensitivity Analysis
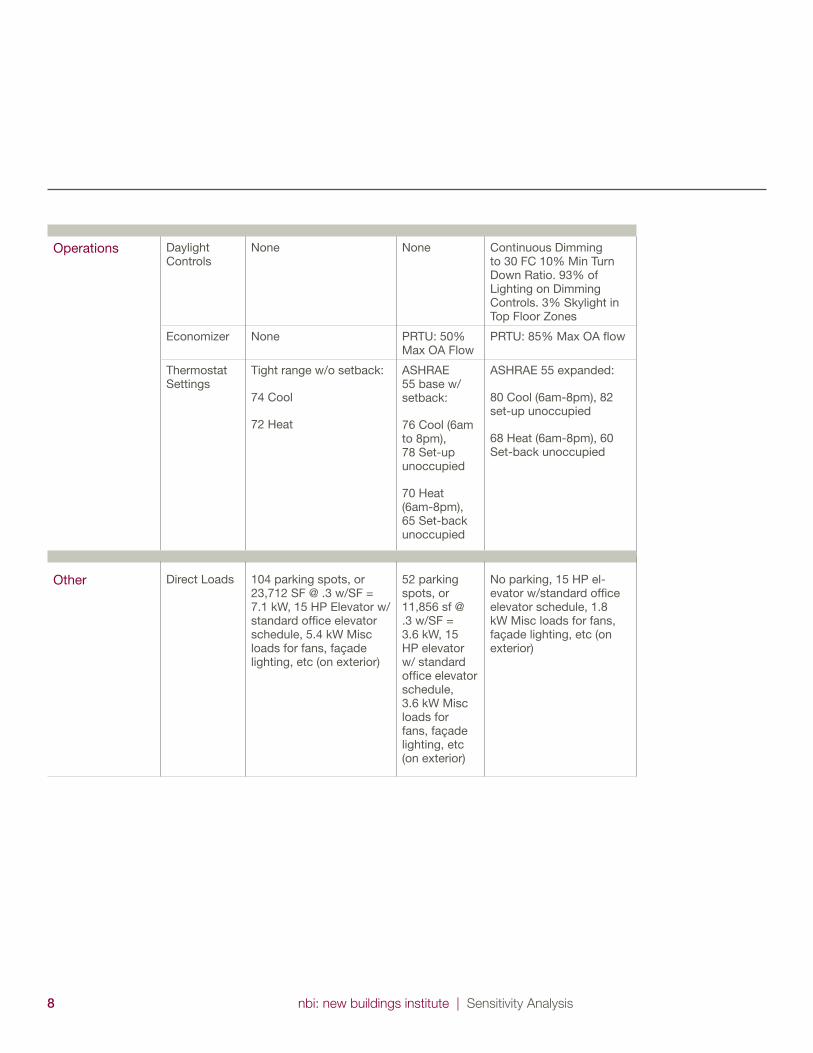
Operations Daylight Controls
None None Continuous Dimming to 30 FC 10% Min Turn Down Ratio. 93% of Lighting on Dimming Controls. 3% Skylight in Top Floor Zones
Economizer None PRTU: 50% Max OA Flow
PRTU: 85% Max OA fl ow
Thermostat Settings
Tight range w/o setback:
74 Cool
72 Heat
ASHRAE 55 base w/setback:
76 Cool (6am to 8pm), 78 Set-up unoccupied
70 Heat (6am-8pm), 65 Set-back unoccupied
ASHRAE 55 expanded:
80 Cool (6am-8pm), 82 set-up unoccupied
68 Heat (6am-8pm), 60 Set-back unoccupied
Other Direct Loads 104 parking spots, or 23,712 SF @ .3 w/SF = 7.1 kW, 15 HP Elevator w/ standard offi ce elevator schedule, 5.4 kW Misc loads for fans, façade lighting, etc (on exterior)
52 parking spots, or 11,856 sf @ .3 w/SF = 3.6 kW, 15 HP elevator w/ standard offi ce elevator schedule, 3.6 kW Misc loads for fans, façade lighting, etc (on exterior)
No parking, 15 HP el-evator w/standard offi ce elevator schedule, 1.8 kW Misc loads for fans, façade lighting, etc (on exterior)
nbi: new buildings institute | Sensitivity Analysis9
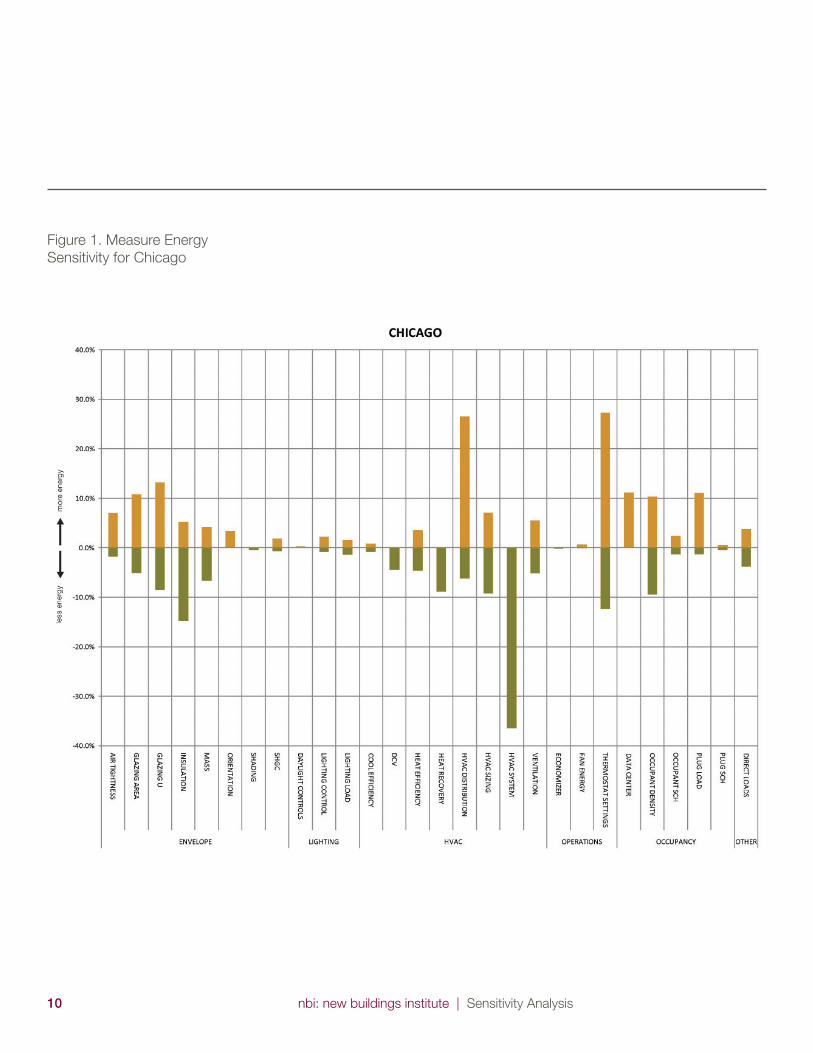
When viewed graphically, the results of this analysis provide a quick,
intuitive understanding of the relative signifi cance of the building
characteristics considered. Figure 1 (page 10) shows an example of
the data output for a single city, Chicago. Each building characteristic
is represented by a single bar on the chart, listed individually along the
X-axis. Values on the Y-axis represent the impact on total building energy
use of the changes to the measure listed at the bottom of the graph.
Values below zero (green bars) on the Y-axis represent reduced energy
use from the high-performance option for that variable, while values
above zero (gold bars) represent increased energy use associated with
the low performance option. For certain building variables, such as shade
coeffi cient, the sign of the energy savings may change from positive to
negative between climate types. Subsets of this graph, and those for other
cities, are presented throughout this report. (A full set of graphs for all of
the cities analyzed can be found in Appendix B.)
This analysis describes the energy impacts of a range of building
physical features and operational practices, representing the energy
use characteristics of buildings in use. It is therefore anticipated that the
performance of existing buildings could also be considered in the context
of this analysis. More specifi cally, it might be possible to use this analysis
to predict what aspects of existing buildings are having a signifi cant effect
on total building energy use. This information might also help inform the
priorities of fi eld investigation into performance of existing buildings. An
exploration of this applicability is being conducted by NBI under a separate
research project.
Sample Results Summary
Application to Existing Buildings
10 nbi: new buildings institute | Sensitivity Analysis
Fi gure 1. Measure Energy
Sensitivity for Chicago
nbi: new buildings institute | Sensitivity Analysis11
This project began as an attempt to quantify the impact of building
performance variables that are outside the scope of the typical design
process and to demonstrate the relative impact of these factors on
annual energy use in buildings. The analysis grew in part out of frustration
with the disparity between energy modeling performance predictions
by construction industry design professionals in forums like LEED and
real-life energy use data reported in various databanks such as CBECs.
Additionally, published energy simulations of the impact of improvements
in various energy codes have tended to predict very low average energy
use intensities compared to actual performance outcome. Another goal of
the analysis is to better understand which aspects of building performance
that are within the scope of the design team have the greatest impacts on
energy use. These issues lead to several fundamental questions:
1. What building performance factors, including design, operational
and tenant variables, represent the most signifi cant impacts on
potential building energy use?
2. How do these impacts vary by climate?
3. Which of these impacts are typically considered in the design and
modeling process, and which are not?
4. What does the relative magnitude of the measure impacts
evaluated suggest about processes and priorities in design,
modeling and building operation?
By better understanding the energy impacts of design variables, it is
possible to focus design efforts and resources on issues with the largest
potential energy benefi t. At the same time, energy modeling could be
improved if some common reasons why energy models fail to accurately
predict performance outcome can be identifi ed. And better understanding
of the potential impacts of operation strategies and tenant behavior can
inform changes in the industry to help buildings perform better.
A set of 28 variables was identifi ed to represent the range of building
features in this analysis. The variables represented a series of building
characteristics that can be affected by design strategies, operational
practices and tenant behavior. The impact of climate was also represented
by comparing results in different cities.
In selecting the modeling inputs to mimic various aspects of building
systems, an effort was made to bracket the range of values found in real-
world buildings. The sensitivity of building energy use for each variable
was determined by establishing a baseline, high-performance and low-
Setting up the analysis
Variable Selection and Modeling Procedure
12 nbi: new buildings institute | Sensitivity Analysis
performance condition for each variable. Some variables, such as Solar
Heat Gain Coeffi cient, actually switched from high to low performance
depending on the climate. The ranges for each variable were modeled
individually, across each of the 16 climates. For instance, to determine the
effect of glazing area on building energy use, the model was run with a
low value for the window-to-wall ratio (20%) and a high value (60%) while
keeping the rest of the baseline inputs constant. With 28 variables, some
of which only had a “low” or a “high” option, the fi nal simulation ended up
requiring 848 individual runs. This would be an onerous task if performed
manually, so the DOE2.1E batch processing tool was used along with a
spreadsheet automation tool developed for use with eQUEST.
The fi rst goal of the analysis was to identify the relative impact of each
variable in isolation. (Although the modeling analysis did account for
the impact of each change on the performance of other systems.) This
approach doesn’t capture the full range of possible combinations of
modeling inputs, as each variable is compared individually to the baseline.
Because some synergistic combinations of variables might be missed with
this approach, several packages of variables were modeled to address
each of the following areas directly1:
Commissioning And Maintenance
� Heat Effi ciency
� Cool Effi ciency
� Ventilation
� Fan Energy
� Economizer
� Combined Setpoint Range & Setback
Commissioning, Maintenance And Operations
� Occupant Schedule
� Plug Loads
� Plug Schedule
� Heat Effi ciency
� Cool Effi ciency
� Ventilation
� Fan Energy
� Economizer
1 Appendix D shows the values used for modeling schedule inputs for the base-
line runs.
nbi: new buildings institute | Sensitivity Analysis13
� Lighting Control
� Combined Setpoint Range & Setback
Operations Only
� Occupant Schedule
� Plug Loads
� Plug Schedule
� Lighting Control
Daylighting
� Orientation/Aspect
� Glazing Area
� Shading
� Glazing U
� Daylight Controls
Design and HVAC System
� Orientation/Aspect
� Mass
� Envelope Insulation
� Glazing Area
� Shading
� Glazing U
� Air Tightness
� Lighting LPD
� R Glazing, controls
� System/Distribution
� DCV
� Fan Energy
� HVAC Sizing
HVAC System Only
� System/Distribution
� DCV
� Fan Energy
� HVAC Sizing
14 nbi: new buildings institute | Sensitivity Analysis
The packages were developed by splitting the different modeling inputs
into groups that were defi ned by whether they were controlled by the
design team, the mechanical engineer specifi cally, occupant behavior
patterns, or operator maintenance practices and commissioning. Some
of the inputs overlapped between the packages, as they could be used
to represent multiple areas. For instance, fan power was adjusted in both
the Design packages and the CX+M packages as it could represent either
duct design or maintenance practices.
The variables analyzed, and the range of values for each are shown in
Table 1 in the Overview section above, and in Appendix A.
Defi ning the baseline was a relatively straightforward process. The
National Renewable Energy Laboratory (NREL) has developed a suite
of 16 “benchmark” Energy Plus models that cover a range of building
types, from small offi ces to fast food restaurants, that are intended to
represent 70% of the commercial building stock in the U.S.2 Updates to
the original benchmark buildings were released in 2009, adjusting some of
the inputs to the models. These prototypes have been developed to allow
comparisons between results of different simulation studies. For this study,
the medium offi ce prototype was selected as a basis for the analysis. This
prototype aligns with previous work done by NBI in developing the Core
Performance Guide and with recent code performance analysis work.
Although this analysis used the NREL Benchmark prototype as a starting
point, baseline variables were modifi ed in some cases to align with other
data sets we consulted as representative of standard practice.
The basic geometry of the benchmark medium offi ce building is shown in
Table 23 and was held constant throughout the simulation process except
for the aspect ratio and window-to-wall ratio, which were varied for two of
the sensitivity runs.
2 P. Torcellini, M. Deru, B. Griffi th, K. Benne, DOE Commercial Building Bench-
mark Models. ACEEE Summer Study on Energy Effi ciency in Buildings, 2008.
3 NREL, Building Summary Medium Offi ce New Construction (benchmark-new-
v1.2_4.0-medium_offi ce_si).
Prototype Description And Variable Range
nbi: new buildings institute | Sensitivity Analysis15
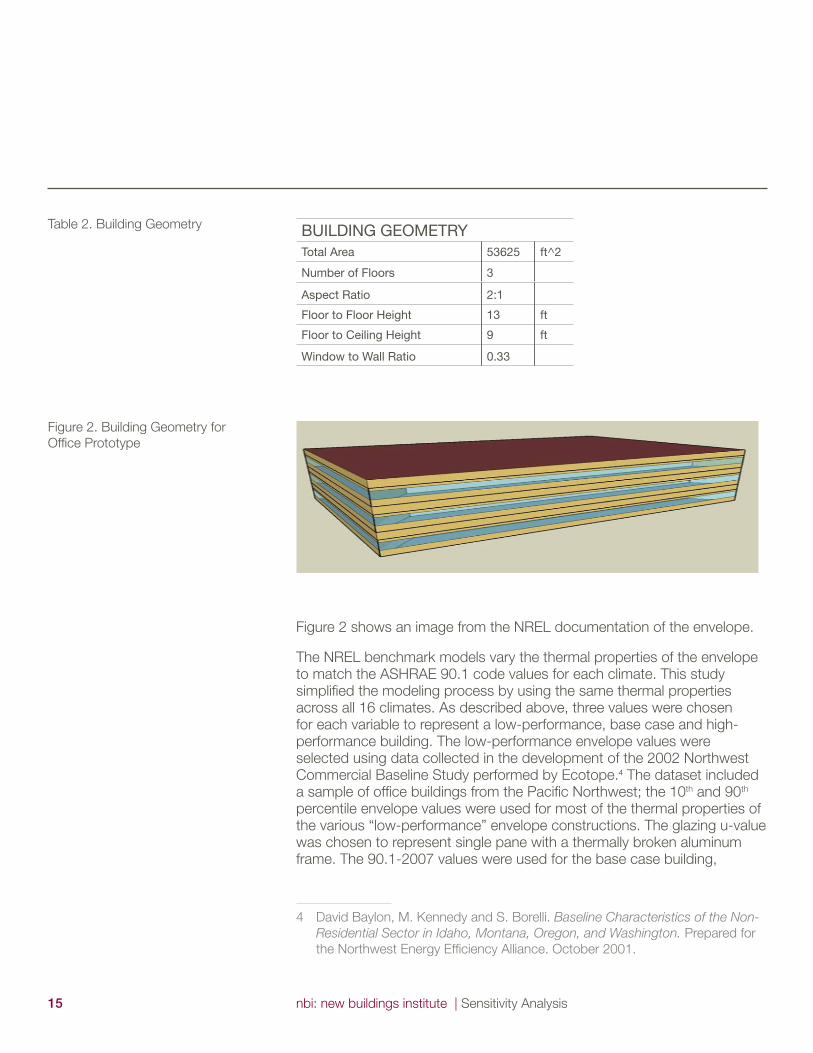
BUILDING GEOMETRYTotal Area 53625 ft^2
Number of Floors 3 Aspect Ratio 2:1 Floor to Floor Height 13 ft
Floor to Ceiling Height 9 ft
Window to Wall Ratio 0.33
Figure 2 shows an image from the NREL documentation of the envelope.
The NREL benchmark models vary the thermal properties of the envelope
to match the ASHRAE 90.1 code values for each climate. This study
simplifi ed the modeling process by using the same thermal properties
across all 16 climates. As described above, three values were chosen
for each variable to represent a low-performance, base case and high-
performance building. The low-performance envelope values were
selected using data collected in the development of the 2002 Northwest
Commercial Baseline Study performed by Ecotope.4 The dataset included
a sample of offi ce buildings from the Pacifi c Northwest; the 10th and 90th
percentile envelope values were used for most of the thermal properties of
the various “low-performance” envelope constructions. The glazing u-value
was chosen to represent single pane with a thermally broken aluminum
frame. The 90.1-2007 values were used for the base case building,
4 David Baylon, M. Kennedy and S. Borelli. Baseline Characteristics of the Non-
Residential Sector in Idaho, Montana, Oregon, and Washington. Prepared for
the Northwest Energy Effi ciency Alliance. October 2001.
Ta ble 2. Building Geometry
F igure 2. Building Geometry for
Offi ce Prototype
16 nbi: new buildings institute | Sensitivity Analysis
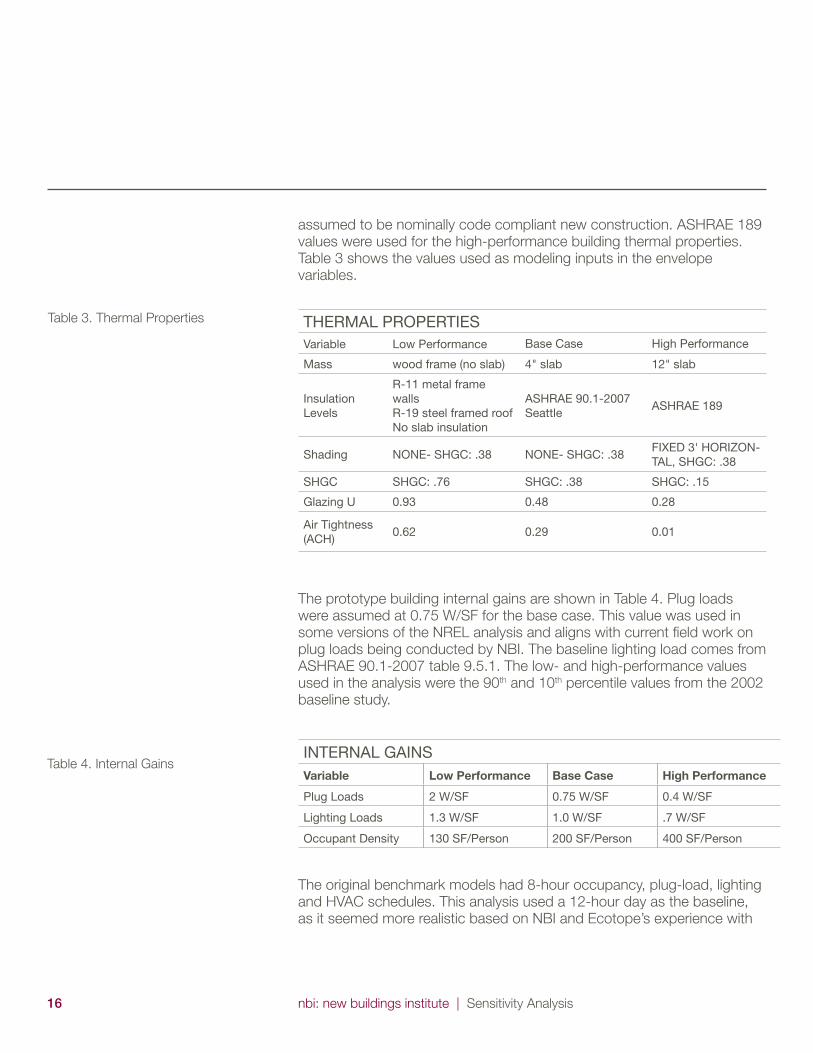
assumed to be nominally code compliant new construction. ASHRAE 189
values were used for the high-performance building thermal properties.
Table 3 shows the values used as modeling inputs in the envelope
variables.
THERMAL PROPERTIESVariable Low Performance Base Case High Performance
Mass wood frame (no slab) 4" slab 12" slab
Insulation Levels
R-11 metal frame wallsR-19 steel framed roofNo slab insulation
ASHRAE 90.1-2007 Seattle
ASHRAE 189
Shading NONE- SHGC: .38 NONE- SHGC: .38FIXED 3' HORIZON-TAL, SHGC: .38
SHGC SHGC: .76 SHGC: .38 SHGC: .15
Glazing U 0.93 0.48 0.28
Air Tightness (ACH)
0.62 0.29 0.01
The prototype building internal gains are shown in Table 4. Plug loads
were assumed at 0.75 W/SF for the base case. This value was used in
some versions of the NREL analysis and aligns with current fi eld work on
plug loads being conducted by NBI. The baseline lighting load comes from
ASHRAE 90.1-2007 table 9.5.1. The low- and high-performance values
used in the analysis were the 90th and 10th percentile values from the 2002
baseline study.
INTERNAL GAINSVariable Low Performance Base Case High Performance
Plug Loads 2 W/SF 0.75 W/SF 0.4 W/SF
Lighting Loads 1.3 W/SF 1.0 W/SF .7 W/SF
Occupant Density 130 SF/Person 200 SF/Person 400 SF/Person
The original benchmark models had 8-hour occupancy, plug-load, lighting
and HVAC schedules. This analysis used a 12-hour day as the baseline,
as it seemed more realistic based on NBI and Ecotope’s experience with
T able 3. Thermal Properties
Table 4. Internal Gains
nbi: new buildings institute | Sensitivity Analysis17
real-world buildings. In the version 1.3_5.0 medium offi ce models, the
benchmark operating hours were also increased to 12, in part to address
the difference between the benchmark modeling EUI predictions and
actual billing data.5 A “low” energy use variant was included for the plug,
lighting and occupancy schedules based on 8 daily hours of operation;
a “high” energy use option used 16 hours of operation. Plug-load and
lighting schedules were also modeled independently to determine the
impact of leaving lights and computers on at night. Space temperature
schedules were varied to show the impact of night setback and
temperature settings. (Appendix D can be referenced for more detail on
the various schedules used in this analysis.)
This analysis also focused on the effect of system type on EUI in addition
to various other energy effi ciency measures. Three systems were included
as one of the sensitivity variables:
1. Single-zone packaged rooftop units with DX cooling and gas heat
2. VAV system with DX cooling and gas heat in the rooftop unit with
electric heat in the boxes
3. Single-zone water to air heat pumps with ground loop heat
exchanger
After looking at the most common system in the Commercial Baseline
study, the single-zone packaged rooftop unit system was chosen to
represent the baseline system, as it was the most common in the
commercial sample for buildings similar in size to the benchmark medium
offi ce building.6
Table 5 shows the basic modeling inputs for the system. Appendix A has
additional detail for low and high performance input ranges, and includes
data sources for the modeling inputs.
5 Email correspondence dated 12/13/2010 between Kristin Field @ NREL and
Morgan Heater @ Ecotope.
6 David Baylon, M. Kennedy and S. Borelli. Baseline Characteristics of the Non-
Residential Sector in Idaho, Montana, Oregon, and Washington. Prepared for
the Northwest Energy Effi ciency Alliance. October 2001.
18 nbi: new buildings institute | Sensitivity Analysis
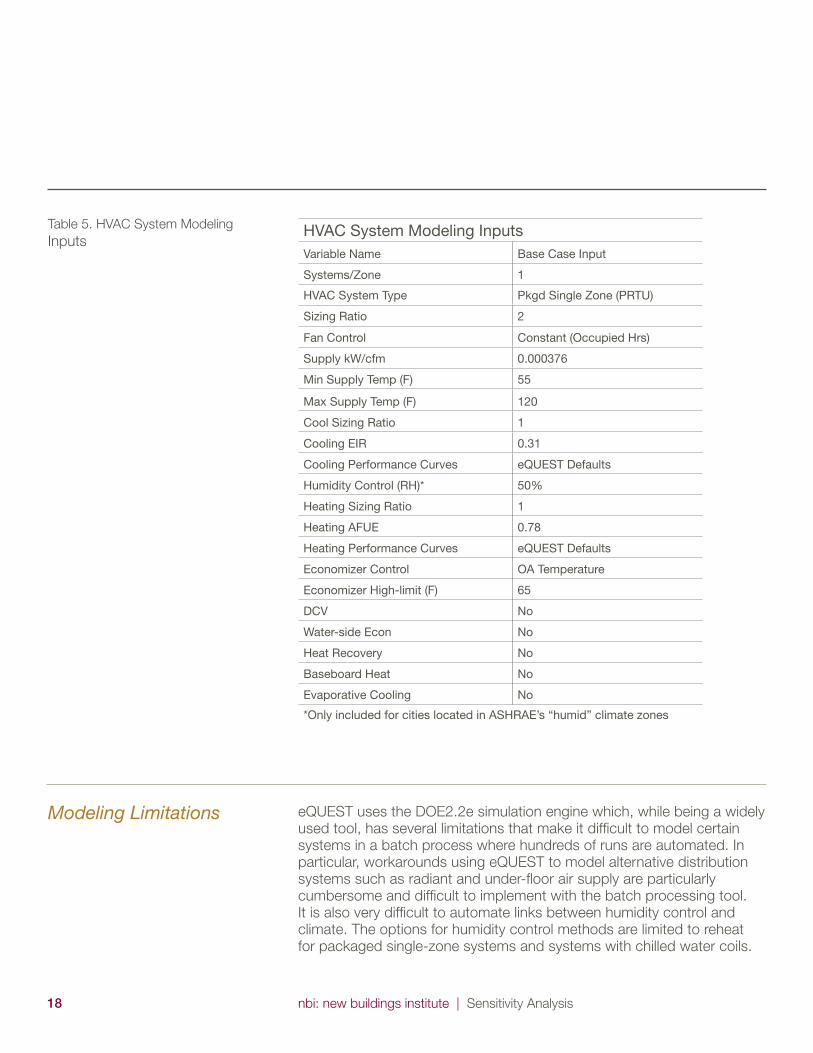
HVAC System Modeling InputsVariable Name Base Case Input
Systems/Zone 1
HVAC System Type Pkgd Single Zone (PRTU)
Sizing Ratio 2
Fan Control Constant (Occupied Hrs)
Supply kW/cfm 0.000376
Min Supply Temp (F) 55
Max Supply Temp (F) 120
Cool Sizing Ratio 1
Cooling EIR 0.31
Cooling Performance Curves eQUEST Defaults
Humidity Control (RH)* 50%
Heating Sizing Ratio 1
Heating AFUE 0.78
Heating Performance Curves eQUEST Defaults
Economizer Control OA Temperature
Economizer High-limit (F) 65
DCV No
Water-side Econ No
Heat Recovery No
Baseboard Heat No
Evaporative Cooling No
*Only included for cities located in ASHRAE’s “humid” climate zones
eQUEST uses the DOE2.2e simulation engine which, while being a widely
used tool, has several limitations that make it diffi cult to model certain
systems in a batch process where hundreds of runs are automated. In
particular, workarounds using eQUEST to model alternative distribution
systems such as radiant and under-fl oor air supply are particularly
cumbersome and diffi cult to implement with the batch processing tool.
It is also very diffi cult to automate links between humidity control and
climate. The options for humidity control methods are limited to reheat
for packaged single-zone systems and systems with chilled water coils.
Table 5. HVAC System Modeling
Inputs
Modeling Limitations
nbi: new buildings institute | Sensitivity Analysis19
Heat recovery systems are applied to 100% of the supply air fl ow, which
makes modeling heat recovery on exhaust and outside air diffi cult.
The single most glaring lack when developing the models was the diffi culty
in locating good baseline data to determine the range of modeling inputs
for each modeling variable. Modelers without access to Ecotope’s various
sources of information, from industry contacts to baseline audit data,
would fi nd it very diffi cult to determine the correct values for their building.
There were several steps taken in this analysis to limit the scope to
simplify the amount of data produced and make the modeling more
straightforward. This was due partly to time constraints, but it was also
because it was unclear if the approach would generate interesting results.
One of the most fundamental simplifi cations was only comparing each
variable’s impact to the baseline rather than modeling every combination
of inputs. It is possible that interesting synergies of inputs that create
lower energy options than the “package” models have been missed. Also,
there is a chance that educational synergistic high energy use options
haven’t been addressed. The output data from a full range of possible
combinations could also be used to produce a web-based tool that would
allow design teams or building occupants to play with various building
energy variables to get a sense of what combinations of measures would
have the most impact on reducing energy use.
A few things became clear during the energy model development process
for the sensitivity analysis:
1. Energy modeling HVAC system defaults can have drastic impacts
on energy use.
2. Data on real-world ranges for schedules, occupancy and internal
gains in buildings, particularly plugs loads, is diffi cult to come by and
not widely agreed upon.
3. Broad data sets on real-world energy end-uses in buildings are also
not current or widely available.
4. The DOE 2.2 simulation engine does not deal well with non-
standard distribution systems for batch processing analysis.
Energy modeling software default assumptions can have large impacts
on energy end-use. A useful second sensitivity analysis would focus on
modeling defaults to determine which can potentially have the largest
effect on outcome if the values used are incorrect.
Recommended Additional Research
20 nbi: new buildings institute | Sensitivity Analysis
Regular research needs to be performed for a large sample of offi ce
buildings in a widespread range of climates with several different HVAC
system types to determine accurate plug loads and end-use breakdowns.
This data could be used to improve energy modeling accuracy and
also help explain the widespread differences between energy modeling
predictions and billing data. This data needs to be distributed in a
format and forum that is easy for energy modelers and building science
researchers to access.
Fan energy is a large portion of annual HVAC energy use, especially in mild
and cooling-dominated climates. Alternative distribution systems such as
raised fl oor or radiant systems can reduce or nearly eliminate this portion
of the HVAC energy end-use. These variations are not well supported by
this modeling tool; in order to determine the real potential impact of these
technologies, the simulation must be performed with software that can
accurately predict performance.
nbi: new buildings institute | Sensitivity Analysis21
Observations on Results
Building and System Designers
There are many implications of an analysis of this type on building design
and operation, code and policy, and performance analysis strategies. This
report has chosen to focus on a subset of these implications for a more
thorough discussion. In particular, a key aspect of this work is to identify
the degree to which different parties are responsible for on-going building
energy performance. Although the market generally assigns responsibility
for building energy performance to the design team, this study shows that
operational and tenant practices have a very signifi cant impact on building
energy use, and this issue is discussed more fully in the following section.
The analysis also suggests there are a range of climate-driven performance
features that are not fully recognized in current design practice or in the
energy codes that regulate these features. A more thorough discussion of
some of these climate-based design implications is also provided below.
Generally, primary responsibility for building energy performance
is ascribed to the design team, and it is true that the features and
systems designed into the building have a critical role in overall building
performance. In this analysis, design variables can be broken into three
categories: envelope, HVAC system and lighting system features. The
design team is responsible for determining the characteristics of these
variables and thus sets the stage for the long-term performance of the
building. But many of the features designed into the building must also
be operated and maintained properly, so there is overlap between design
variables and operational impacts.
The envelope variables modeled in this analysis are generally in the control
of the architect. For this analysis, these included insulation levels, glazing
amount and glazing properties, as well as thermal mass. Also in this
category is building air tightness, since careful construction details need
to be developed in order to produce an airtight building. The commonly
accepted industry belief is that offi ce buildings are dominated by internal
loads, even in heating climates, and envelope improvements beyond code
aren’t cost effective. In actuality, this study shows that envelope effi ciency
can have a dramatic impact on overall energy use in all climates. Wall, roof
and fl oor insulation levels alone can have large impacts on overall energy
use in heating-dominated climates (±10%).
Glazing U-value improvements and glazing area reductions show savings
across all climates. Glazing area has a particularly large impact. Increasing
glazing from a base case of 33% to 60% of the wall area increases overall
energy use by more than 10% in all climates. Glazing U-value is very
important in heating climates, causing energy use to increase by about
22 nbi: new buildings institute | Sensitivity Analysis
15% by going from a high quality double glazed window to a single-pane
window. Glazing U-value is less important in cooling-dominated climates
(Phoenix, Atlanta, etc.). Decreasing the SHGC only saves energy in
cooling-dominated climates and actually increases energy use in heating-
dominated climates by limiting useful solar gain. This indicates that energy
code regulations enforcing low SHGC values across all climates may be
counterproductive.
Increasing mass in buildings surprisingly saves energy in all climates, even
if there isn’t a large diurnal temperature swing in the heating season (e.g.
Seattle, San Francisco). Mass extends the amount of time before the
systems have to turn on to maintain the setback temperatures and buffers
the extreme daily temperatures, thus reducing HVAC energy use.
Building air tightness also saves energy in all climate zones. Tight building
construction has received a great deal of attention in the residential sector
in the last 20 years, and a signifi cant amount of research has been done
to understand the issue. However, this aspect of building effi ciency has yet
to gain much attention in the commercial building industry. The common
belief is that the mechanical systems in offi ce buildings are typically
balanced to create a small amount of positive pressure in the building,
thus eliminating infi ltration as an energy issue. This is almost certainly not
the case in practice, but there is very little existing research upon which
to draw. This analysis used high and low infi ltration values from a yet-
to-be-published study currently underway in the Pacifi c Northwest.7 It is
unclear to what degree this range represents common practice, because
widespread representative data simply does not exist.
Finally, in the category of factors controlled by the architect, this study
examined the effect of orientation and massing, or aspect ratio. When
modeled in isolation, the ideal aspect ratio is 1 to 1, or a square, because
the surface-area-to-fl oor area ratio is the smallest (smallest UA). Solar
gain and daylight utilization can have signifi cant impacts on building
performance, but in order for the orientation of the glazing and the aspect
ratio of the building to save energy, the measure has to be implemented in
concert with other measures such as daylighting and glazing optimization
or passive solar design. Therefore changes to the aspect ratio in isolation
do not accurately refl ect the anticipated energy impact of this variable. To
address this, some packages representing measure combinations were
evaluated, as discussed in the following section.
7 Gowri, Winiarski, Jarnagin. “Infi ltration Modeling Guidelines for Commercial
Building Energy Analysis” Sept. 2009.
nbi: new buildings institute | Sensitivity Analysis23
While modeling of building envelope variables is relatively simple, well
developed and well understood, modeling of HVAC system effects
is much less reliable. Modeling programs include numerous hidden
assumptions and shortcuts for attempting to describe the control and
performance of these systems under varying conditions. There is a trade-
off between keeping the modeling input requirements simple enough to
be understood and manageable by a wide range of modelers and making
them detailed enough to more closely capture the actual performance.
In an analysis such as this which specifi cally tries to attribute impacts to
individual measures, these hidden assumptions can have unanticipated
impacts on the results. Much more research is needed to fully develop the
performance curves and ideal modeling parameters for a wide range of
system and equipment types.
The selection of HVAC system type, distribution type, equipment and
duct sizing, system effi ciency, and ventilation damper settings and control
strategies are all controlled by the HVAC system designer and have a huge
impact on the energy use of the building. This study included comparison
of a baseline packaged rooftop single-zone gas system (PRTU) compared
to a high-effi ciency ground source heat pump system (GSHP) and a
variable air volume system with terminal electric reheat (VAV). In addition, it
examined the relative distribution effi ciency of overhead ducts, under-fl oor
air distribution or radiant hydronic distribution with natural ventilation.
The impact of HVAC system variables is very sensitive to other variables
such as fan power, internal heat gain and occupancy levels. Ground-loop
heat exchanger systems with water-to-air heat pumps saved energy in
all climates, but the effect was greater in heating climates. VAV systems
increased the energy use in all dry climates due to increased re-heating
demands and fan energy. Energy use for VAV systems shows a savings in
humid climates due to the ability of VAV systems to be set up to capture
heat from the air conditioning system to reheat air during dehumidifi cation.
The greatest increase is shown in hot dry climates where fan heat from
VAV operation increases cooling loads. However, this result is very
sensitive to fan power, internal gain, humidity setpoint and minimum
primary air-fl ow settings. Note also that this analysis treats gas and electric
heat equally so it does not address energy cost or carbon impacts of fuel
and system choices.
Heating and cooling equipment effi ciency improvements caused the
expected energy savings across all climates. This is a relatively small
impact on overall energy use of the building except in the extreme
climates. Increasing the ventilation rate also predictably uses more energy
across all climates, but more so where outside air needs tempering to
match interior conditions.
24 nbi: new buildings institute | Sensitivity Analysis
Duct sizing or fan power mimicked the internal gain variable results with
increased fan power using more energy except in extremely cold climates
where the fan heat was off-setting the relatively less effi cient gas heating.
Right-sizing HVAC equipment saved energy across all climates. Larger
HVAC systems use more fan energy and have reduced part-load effi ciency
impacts for heating and cooling. This result is sensitive to system type. On
a VAV system with variable speed fan control, over-sized fans have smaller
impacts on the energy use.
Lighting measures modeled included reduced installed lighting power as
well as lighting controls from occupancy and daylight sensors. Lighting
energy impact differs greatly in different climates. In cooling climates, extra
energy used for lighting not only increases the lighting energy budget,
but also increases the HVAC cooling energy budget. In heating climates,
lighting savings are signifi cantly diminished because savings in lighting
energy require an increase in heating energy. The lighting power measures
are relatively easy to model; however, daylight availability and controls are
not well developed within eQUEST, and there is disagreement about the
accuracy of results.
Decisions about lighting power density are fully under the control of the
designers, but while the existence of control systems are the responsibility
of the designers, the ultimate effectiveness of the lighting controls are
more in the hands of building operators and occupants. While the
absence of good lighting controls certainly reduces the potential for
effi cient building operation, the presence of controls alone is no guarantee
of effi ciency.
Although this analysis focuses on the impact of individual measures
relative to each other, it is also useful to consider the cumulative
impacts of variables within the control of different building performance
participants. To address this, certain packages of measures were
combined to represent the range of performance that might be expected
from a combination of design, operating or tenant behavior decisions (see
description of measure bundles beginning on page 12).
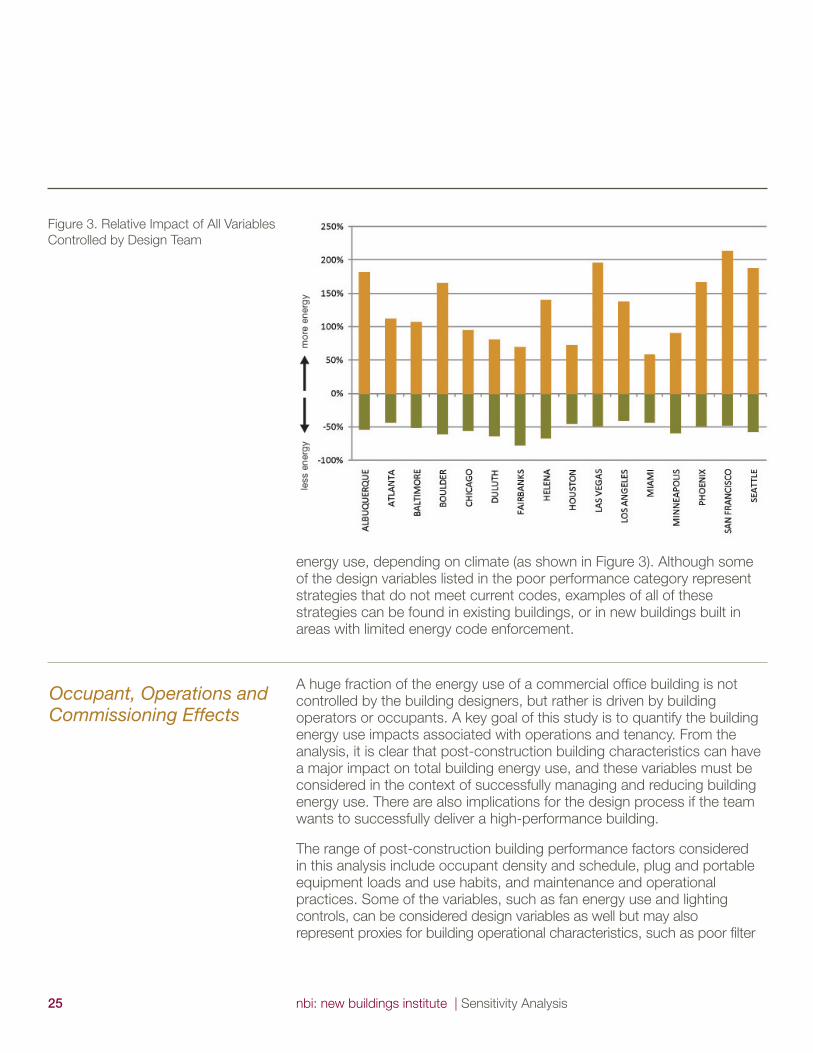
Building envelope, HVAC and lighting systems are the primary areas
where the design team can impact the building effi ciency. Taken together
as a package, best practices in envelope and lighting design can save
about 40% of total building energy use; poor practices can increase
energy use by about 90% in all climate zones. When the effects of HVAC
system selection are added, best design practices can lead to about a
50% savings, and worst practices can lead to a 60-210% increase in
Bundling Design Impacts
nbi: new buildings institute | Sensitivity Analysis25
Occupant, Operations and Commissioning Effects
Figure 3. Relative Impact of All Variables
Controlled by Design Team
energy use, depending on climate (as shown in Figure 3). Although some
of the design variables listed in the poor performance category represent
strategies that do not meet current codes, examples of all of these
strategies can be found in existing buildings, or in new buildings built in
areas with limited energy code enforcement.
A huge fraction of the energy use of a commercial offi ce building is not
controlled by the building designers, but rather is driven by building
operators or occupants. A key goal of this study is to quantify the building
energy use impacts associated with operations and tenancy. From the
analysis, it is clear that post-construction building characteristics can have
a major impact on total building energy use, and these variables must be
considered in the context of successfully managing and reducing building
energy use. There are also implications for the design process if the team
wants to successfully deliver a high-performance building.
The range of post-construction building performance factors considered
in this analysis include occupant density and schedule, plug and portable
equipment loads and use habits, and maintenance and operational
practices. Some of the variables, such as fan energy use and lighting
controls, can be considered design variables as well but may also
represent proxies for building operational characteristics, such as poor fi lter
26 nbi: new buildings institute | Sensitivity Analysis
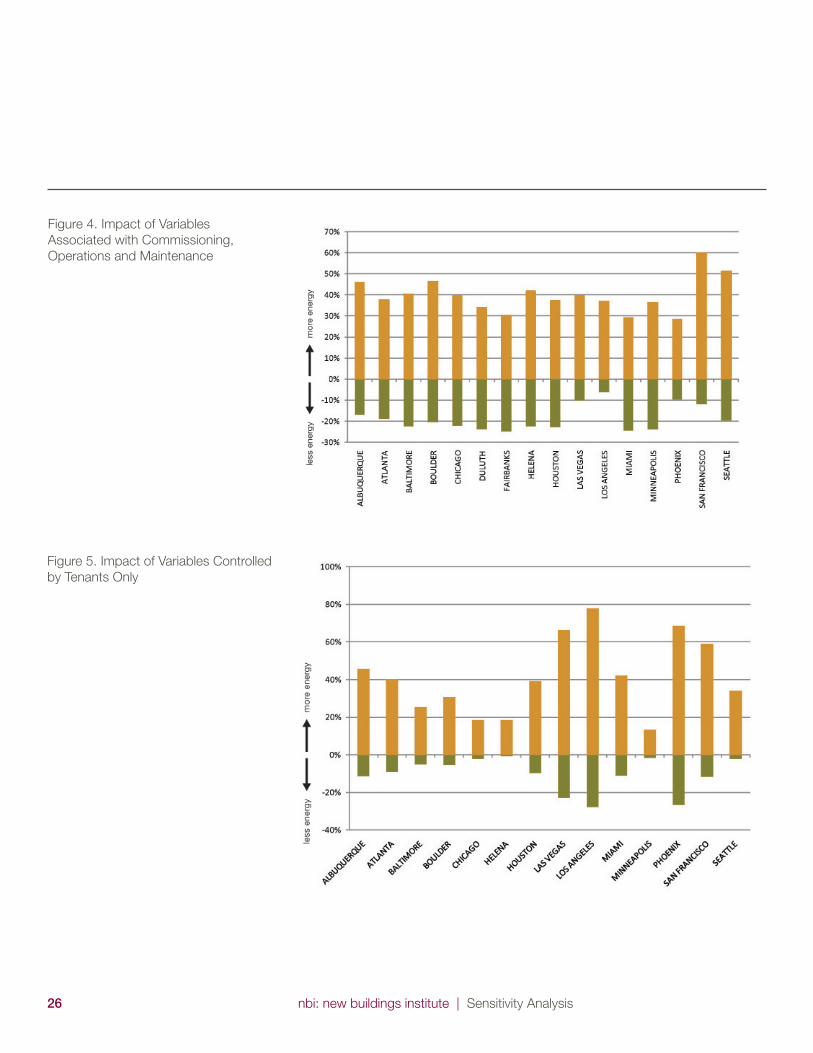
Figure 4. Impact of Variables
Associated with Commissioning,
Operations and Maintenance
Fig ure 5. Impact of Variables Controlled
by Tenants Only
nbi: new buildings institute | Sensitivity Analysis27
maintenance. In general, these variables can be further divided into those
impacted primarily by operational practices, like fan energy, and those
impacted by occupant behavior, such as plug-load density and night use. In
some cases such as occupant schedule, temperature setpoints and lighting
control effectiveness, the variables can be affected by both groups.
While some non-design aspects of buildings are controlled primarily by the
occupants, others are controlled by the building operators, maintenance
staff, the controls programmer or commissioning (or lack thereof). The
variables assumed by this study to be in this category include HVAC
systems setpoints and schedules, economizer operation, ventilation
controls and settings, and to some degree HVAC system effi ciency and
fan power (in that these variables can act as surrogates for adequate
maintenance and balancing of the HVAC system).
As shown in Figure 4, best practices in this area are shown to reduce
energy use 10-20% across all climate zones. In contrast, bad practices in
this area can increase energy use 30-60%.
The design team may be able to affect these loads by incorporating
building operations and maintenance staff into the design process so
they better understand building operation, or by developing effective
building operations and training programs in conjunction with building
commissioning and start-up procedures.
On the tenant side, the behavior of building tenants also has a signifi cant
impact on overall building energy use. Figure 5 below shows the impact
on total building energy use of variables directly controlled by the tenants
such as schedules, increased plug loads, poor management of night plug
loads and lighting controls. Tenants are seldom in a position to recognize
the direct impact they have on total building energy use. The installation
of submetering and energy-use dashboards can contribute to effective
strategies to help tenants understand and reduce their energy use.
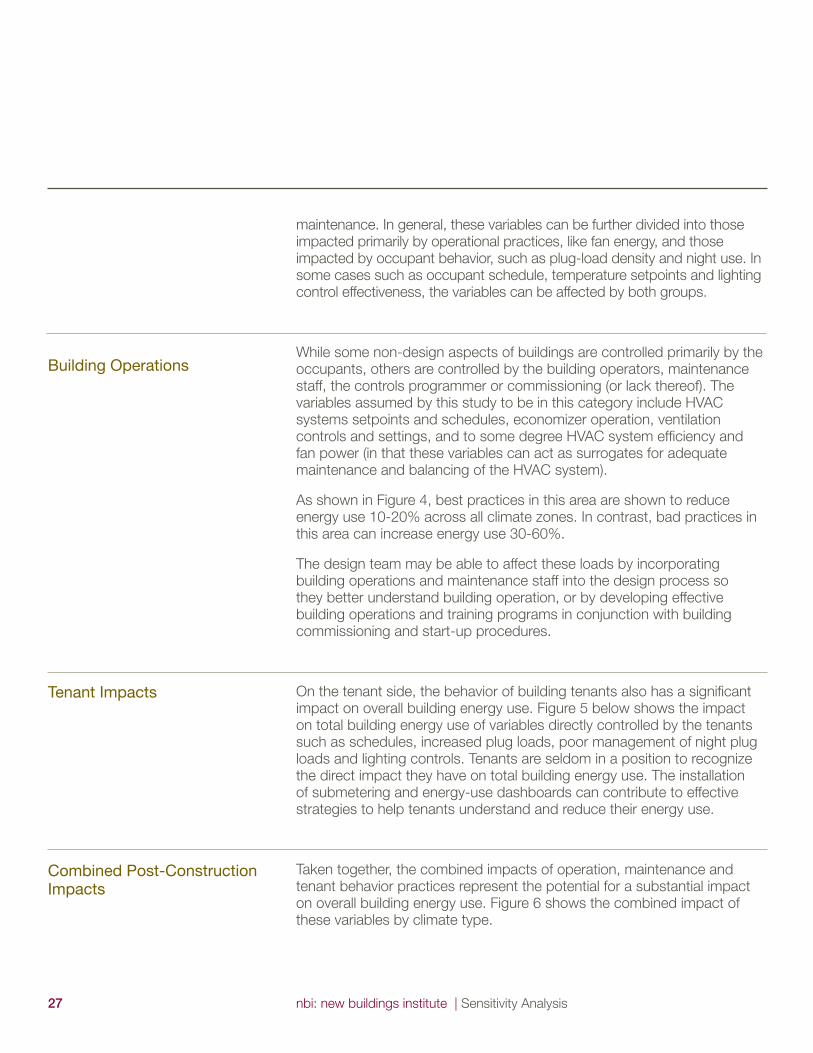
Taken together, the combined impacts of operation, maintenance and
tenant behavior practices represent the potential for a substantial impact
on overall building energy use. Figure 6 shows the combined impact of
these variables by climate type.
Tenant Impacts
Combined Post-Construction Impacts
Building Operations
28 nbi: new buildings institute | Sensitivity Analysis
Figure 6. Impact of All Variables of
Operation and Tenants Combined
As with other internal gain type loads, occupant and operator factors are
less important in signifi cantly colder climates (Fairbanks, Duluth, Chicago,
Minneapolis) since the loads themselves offset some of the energy needed
to heat the building. The impact of these factors is greatest in cooling
climates since, like lighting energy, the increase in internal loads requires
additional HVAC energy. In cooling climates, the occupant and operations
effects together can increase building energy use from 80-140%, or
conversely reduce energy use by about 30% in comparison to the typical
baseline building.
The design team has the largest potential impact on total building energy
use, and many of the decisions by the design team about building features
also determine the degree to which operators, and to a lesser degree
tenants, can successfully manage their own behaviors to achieve effi cient
building performance. It is also clear from the graph that once the building
is constructed, the potential impact of operations and tenants has a much
greater potential to adversely impact building energy use than to improve
upon the original design characteristics.
nbi: new buildings institute | Sensitivity Analysis29
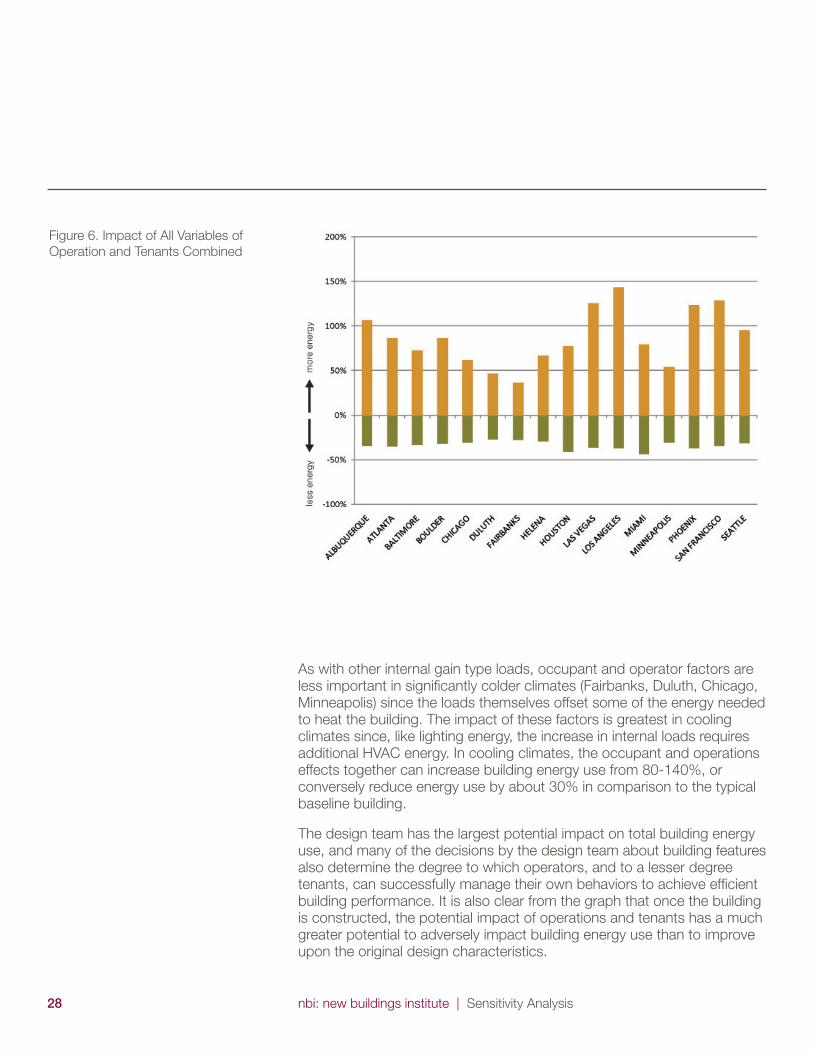
To deliver high levels of energy effi ciency, building design and operations
must be refl ective of the particular climate. The results of the modeling
runs offer important insights into the impact of various measures in
different climates. The following sections discuss the results of the study
in four different climate zones: Seattle as a mild maritime climate, Chicago
as a cold climate, Phoenix as a dry hot climate, and Atlanta as a moist
hot climate. The following pie charts show the distribution of energy end
uses in the base case building model in the various climates. The most
obvious difference is in the fraction of energy going to space heating and
space cooling. Note that the amount of energy going to plug loads or
miscellaneous electric loads (MELs) and lights is nearly identical, but the
percentages vary somewhat due to a varying total.
Climate-Responsive Approach
PHOENIX: BASE
28.0%21.1%
22.2%
6.7%0.1%
20.3%1.1%
0.6%
Figure 7. Base Case Energy End Use
Breakdowns for Four Representative
Climates
SEATTLE: BASE
3.3%
21.5%
22.5%
6.8%
0.3%
16.6%
27.5%
1.5%
Space Cooling
Space Hea�ng
DHW
Vent Fan
Pumps & Aux
Ext. Lights
MELs
Lights
ATLANTA: BASE
16.8%19.8%
20.8%
6.3%
0.2%13.6% 1.3%
21.3%
CHICAGO: BASE
7.9%16.0%
16.8%
5.1%
0.3%
11.6%0.3%
41.2%
30 nbi: new buildings institute | Sensitivity Analysis
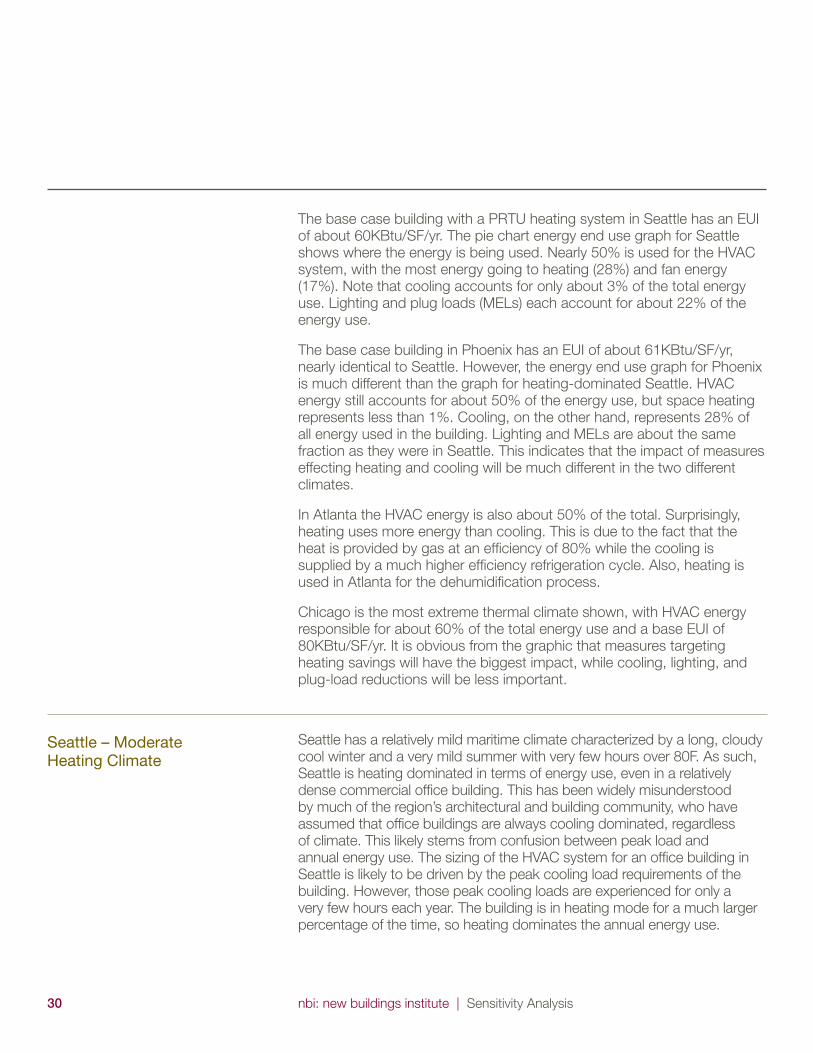
The base case building with a PRTU heating system in Seattle has an EUI
of about 60KBtu/SF/yr. The pie chart energy end use graph for Seattle
shows where the energy is being used. Nearly 50% is used for the HVAC
system, with the most energy going to heating (28%) and fan energy
(17%). Note that cooling accounts for only about 3% of the total energy
use. Lighting and plug loads (MELs) each account for about 22% of the
energy use.
The base case building in Phoenix has an EUI of about 61KBtu/SF/yr,
nearly identical to Seattle. However, the energy end use graph for Phoenix
is much different than the graph for heating-dominated Seattle. HVAC
energy still accounts for about 50% of the energy use, but space heating
represents less than 1%. Cooling, on the other hand, represents 28% of
all energy used in the building. Lighting and MELs are about the same
fraction as they were in Seattle. This indicates that the impact of measures
effecting heating and cooling will be much different in the two different
climates.
In Atlanta the HVAC energy is also about 50% of the total. Surprisingly,
heating uses more energy than cooling. This is due to the fact that the
heat is provided by gas at an effi ciency of 80% while the cooling is
supplied by a much higher effi ciency refrigeration cycle. Also, heating is
used in Atlanta for the dehumidifi cation process.
Chicago is the most extreme thermal climate shown, with HVAC energy
responsible for about 60% of the total energy use and a base EUI of
80KBtu/SF/yr. It is obvious from the graphic that measures targeting
heating savings will have the biggest impact, while cooling, lighting, and
plug-load reductions will be less important.
Seattle has a relatively mild maritime climate characterized by a long, cloudy
cool winter and a very mild summer with very few hours over 80F. As such,
Seattle is heating dominated in terms of energy use, even in a relatively
dense commercial offi ce building. This has been widely misunderstood
by much of the region’s architectural and building community, who have
assumed that offi ce buildings are always cooling dominated, regardless
of climate. This likely stems from confusion between peak load and
annual energy use. The sizing of the HVAC system for an offi ce building in
Seattle is likely to be driven by the peak cooling load requirements of the
building. However, those peak cooling loads are experienced for only a
very few hours each year. The building is in heating mode for a much larger
percentage of the time, so heating dominates the annual energy use.
Seattle – Moderate Heating Climate
nbi: new buildings institute | Sensitivity Analysis31
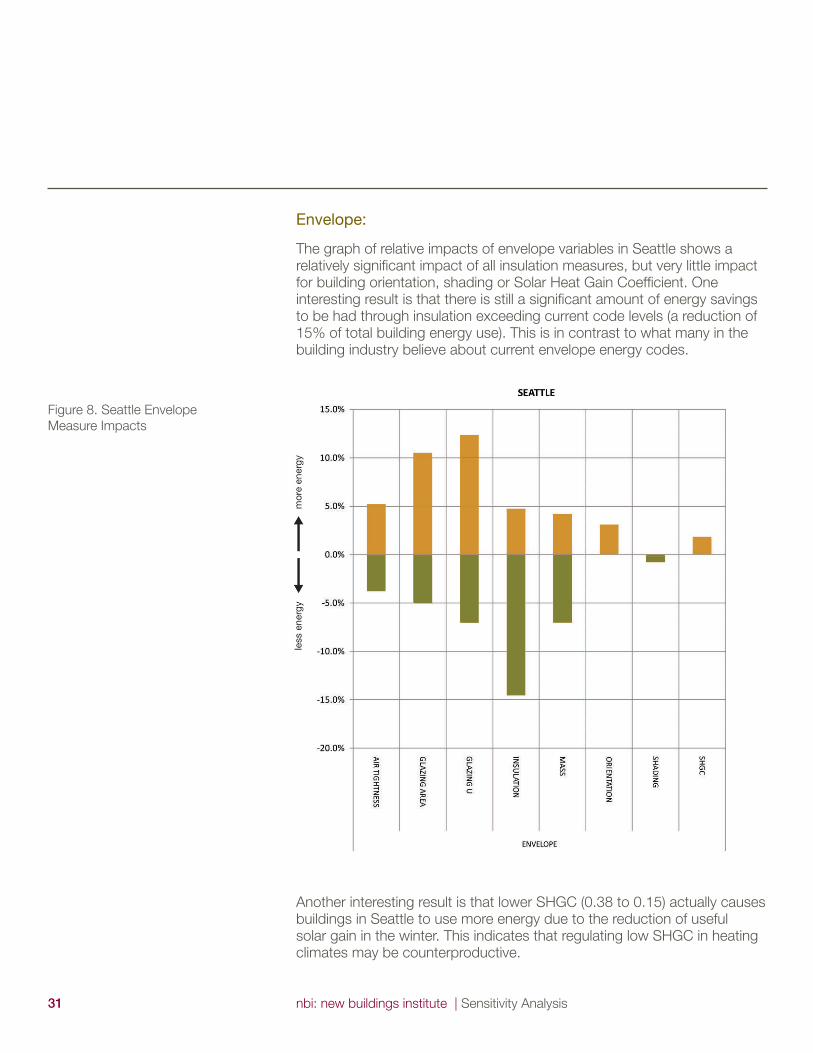
Envelope:
The graph of relative impacts of envelope variables in Seattle shows a
relatively signifi cant impact of all insulation measures, but very little impact
for building orientation, shading or Solar Heat Gain Coeffi cient. One
interesting result is that there is still a signifi cant amount of energy savings
to be had through insulation exceeding current code levels (a reduction of
15% of total building energy use). This is in contrast to what many in the
building industry believe about current envelope energy codes.
Figure 8. Seattle Envelope
Measure Impacts
Another interesting result is that lower SHGC (0.38 to 0.15) actually causes
buildings in Seattle to use more energy due to the reduction of useful
solar gain in the winter. This indicates that regulating low SHGC in heating
climates may be counterproductive.
32 nbi: new buildings institute | Sensitivity Analysis
Lighting:
Since Seattle is a heating climate, there are no large gains to be made
from better lighting or lighting controls beyond current code. This is
because lighting savings during the heating season must be made up with
additional heating energy. Signifi cant lighting savings are only achieved
during the non-heating season.8
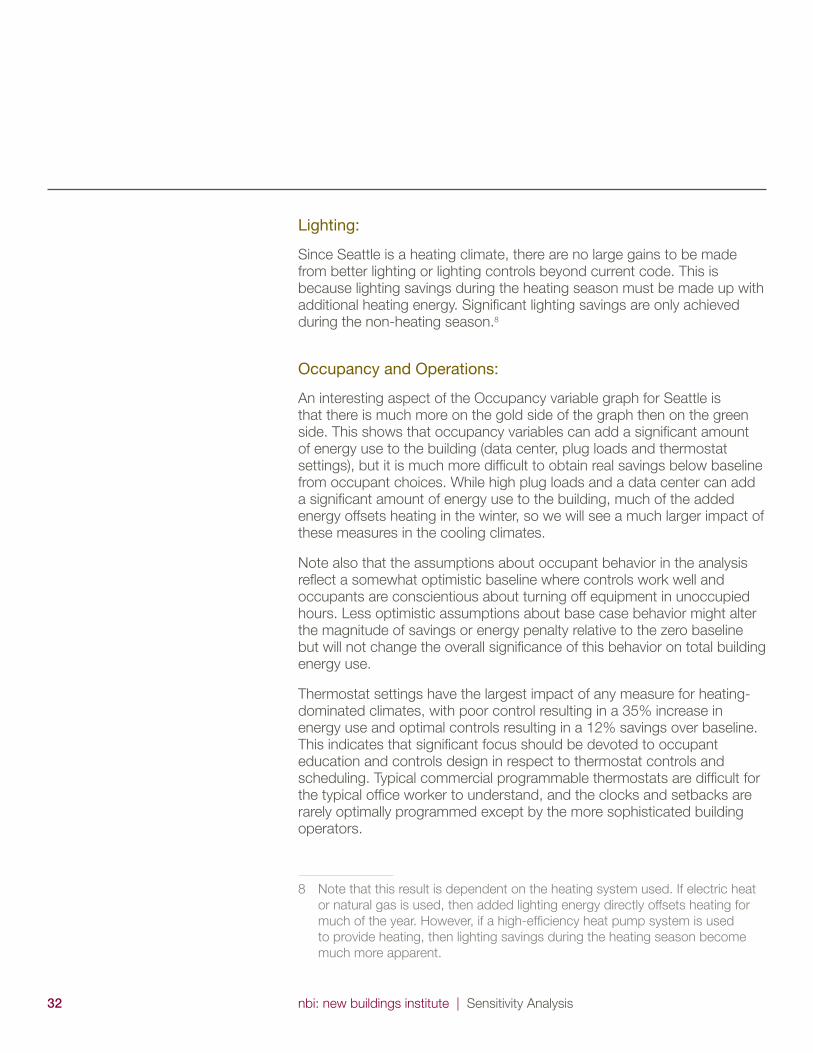
Occupancy and Operations:
An interesting aspect of the Occupancy variable graph for Seattle is
that there is much more on the gold side of the graph then on the green
side. This shows that occupancy variables can add a signifi cant amount
of energy use to the building (data center, plug loads and thermostat
settings), but it is much more diffi cult to obtain real savings below baseline
from occupant choices. While high plug loads and a data center can add
a signifi cant amount of energy use to the building, much of the added
energy offsets heating in the winter, so we will see a much larger impact of
these measures in the cooling climates.
Note also that the assumptions about occupant behavior in the analysis
refl ect a somewhat optimistic baseline where controls work well and
occupants are conscientious about turning off equipment in unoccupied
hours. Less optimistic assumptions about base case behavior might alter
the magnitude of savings or energy penalty relative to the zero baseline
but will not change the overall signifi cance of this behavior on total building
energy use.
Thermostat settings have the largest impact of any measure for heating-
dominated climates, with poor control resulting in a 35% increase in
energy use and optimal controls resulting in a 12% savings over baseline.
This indicates that signifi cant focus should be devoted to occupant
education and controls design in respect to thermostat controls and
scheduling. Typical commercial programmable thermostats are diffi cult for
the typical offi ce worker to understand, and the clocks and setbacks are
rarely optimally programmed except by the more sophisticated building
operators.
8 Note that this result is dependent on the heating system used. If electric heat
or natural gas is used, then added lighting energy directly offsets heating for
much of the year. However, if a high-effi ciency heat pump system is used
to provide heating, then lighting savings during the heating season become
much more apparent.
nbi: new buildings institute | Sensitivity Analysis33
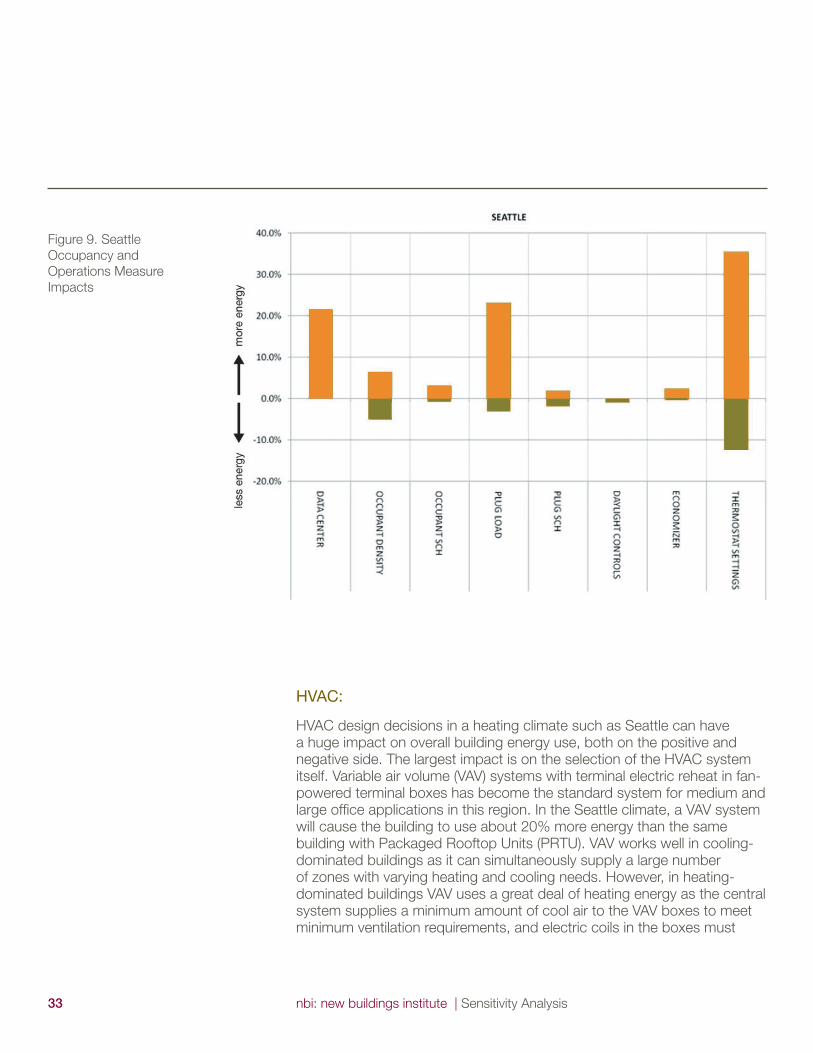
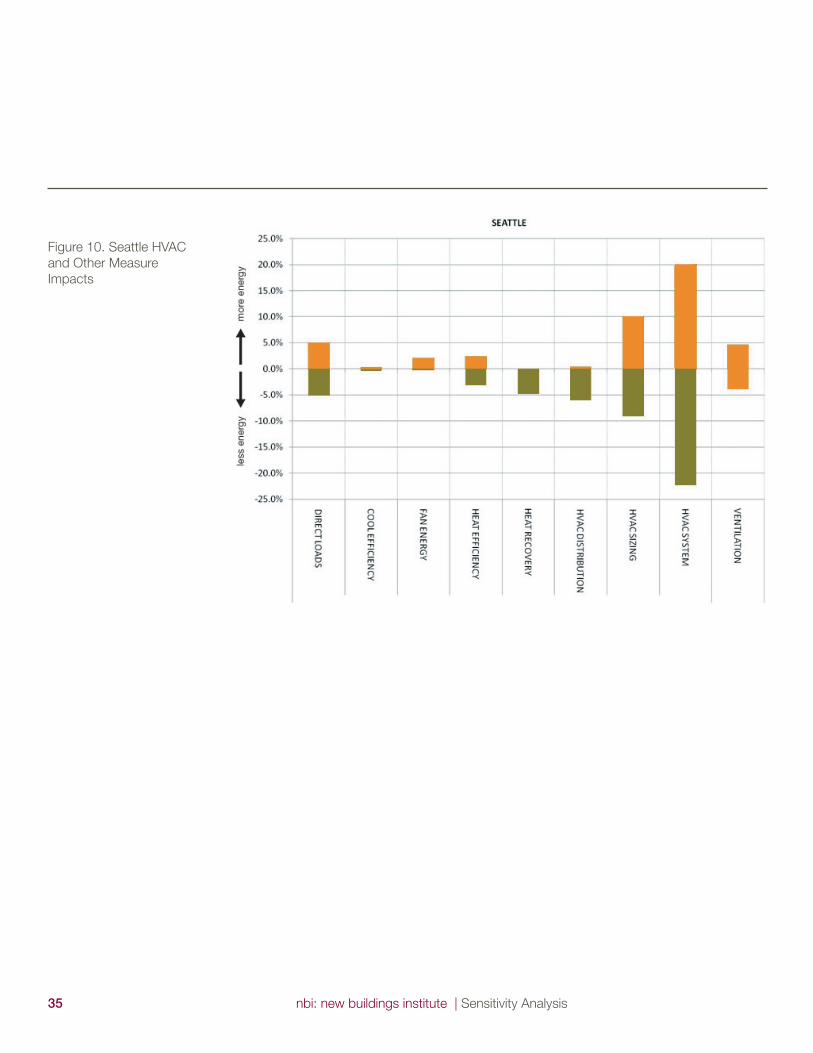
HVAC:
HVAC design decisions in a heating climate such as Seattle can have
a huge impact on overall building energy use, both on the positive and
negative side. The largest impact is on the selection of the HVAC system
itself. Variable air volume (VAV) systems with terminal electric reheat in fan-
powered terminal boxes has become the standard system for medium and
large offi ce applications in this region. In the Seattle climate, a VAV system
will cause the building to use about 20% more energy than the same
building with Packaged Rooftop Units (PRTU). VAV works well in cooling-
dominated buildings as it can simultaneously supply a large number
of zones with varying heating and cooling needs. However, in heating-
dominated buildings VAV uses a great deal of heating energy as the central
system supplies a minimum amount of cool air to the VAV boxes to meet
minimum ventilation requirements, and electric coils in the boxes must
Figure 9. Seattle
Occupancy and
Operations Measure
Impacts

34 nbi: new buildings institute | Sensitivity Analysis
then reheat the air to provide heating in the zones.9 In contrast to the 20%
increase due to a VAV system, a ground-source heat pump-based system
(or inverter-driven air source heat pump) can cause the building to use
over 20% less energy than the base case building due to the high COP of
a heat pump system.
HVAC system sizing can also have a signifi cant impact on energy use
in a heating climate, causing a 10% increase or decrease in the overall
energy use. This is primarily the result of increased fan energy associated
with larger equipment. Note that this has less of an effect in a heating-
dominated climate using a standard 80% effi cient gas furnace since
increases in fan energy provide useful heating energy during the heating
season.
Ventilation quantity and heat recovery also show small but signifi cant
impacts in this heating-dominated climate, as does HVAC distribution and
heating effi ciency.
Other:
Miscellaneous direct loads were used to model exterior lighting for parking
lots or parking garages, elevators, fans, etc. These loads can have
about a +/-5% impact on the energy use of a building in Seattle for our
assumptions about typical loads.10
9 Note that the predicted performance of the VAV system is very sensitive to
modeling inputs related to minimum air settings on the VAV boxes, supply air
reset temperaturesand internal gains.10 Note that with poor design or specialized equipment requirements these mis-
cellaneous loads could be quite large. For example a landscape water feature
with large pumping requirements or a cell tower or satellite repeater on the
roof.
nbi: new buildings institute | Sensitivity Analysis35
Figure 10. Seattle HVAC
and Other Measure
Impacts
36 nbi: new buildings institute | Sensitivity Analysis
Phoenix is used to demonstrate the impact of measures in a hot and
dry climate. The weather is very sunny with a long hot summer. Phoenix
typically experiences very large diurnal swings between daytime and
nighttime temperatures. Temperatures can drop in the winter, but the vast
majority of the very cold hours are at night when the ventilation systems
are turned off.
Phoenix: Hot Dry Climate
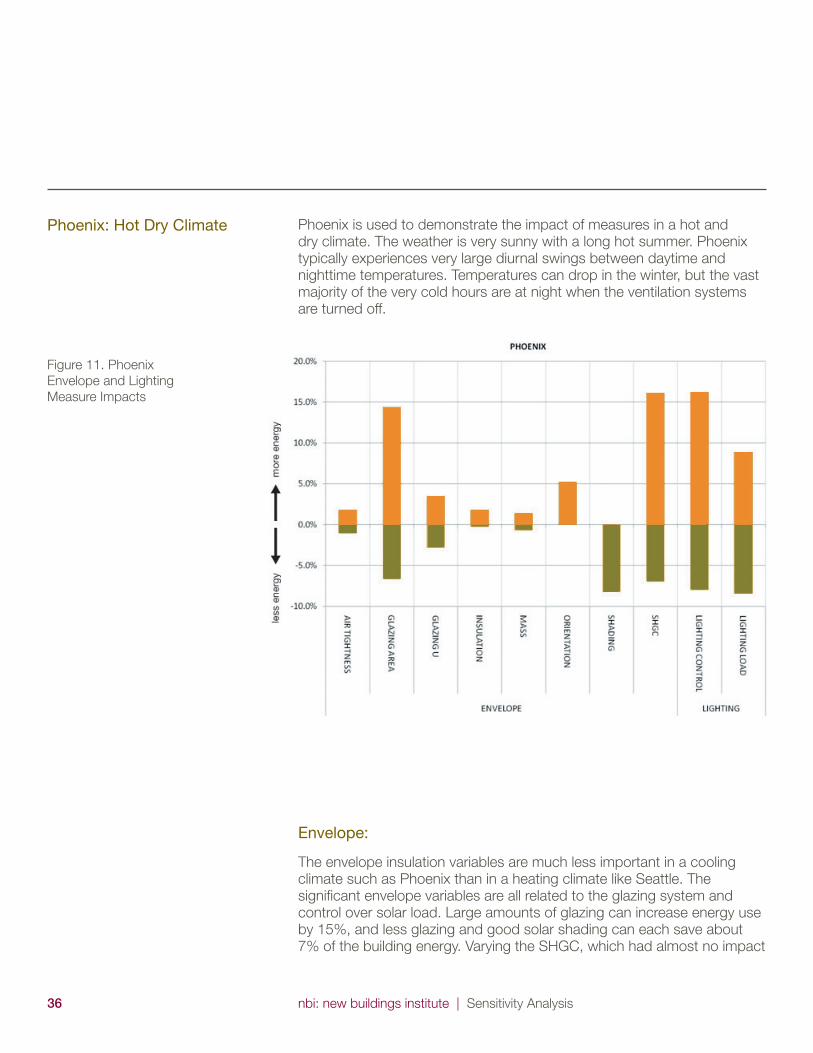
Figure 11. Phoenix
Envelope and Lighting
Measure Impacts
Envelope:
The envelope insulation variables are much less important in a cooling
climate such as Phoenix than in a heating climate like Seattle. The
signifi cant envelope variables are all related to the glazing system and
control over solar load. Large amounts of glazing can increase energy use
by 15%, and less glazing and good solar shading can each save about
7% of the building energy. Varying the SHGC, which had almost no impact
nbi: new buildings institute | Sensitivity Analysis37
in Seattle, can affect the energy use by about +16 to -7% in Phoenix
due to the impact on solar heat gain. High mass construction, which
yielded signifi cant gains in Seattle, did not show large savings in Phoenix
due to the lack of heating load. However, the model did not attempt to
capture the effect of night venting, which could effectively reduce cooling
load in Phoenix with a high mass building due to typical low nighttime
temperatures.
Lighting:
Lighting measures have a much larger impact in Phoenix than in colder
climates. Not only do they not provide any useful heating energy to the
building, but almost every BTU of lighting energy put into the building
becomes heat energy which must be removed with the cooling system.
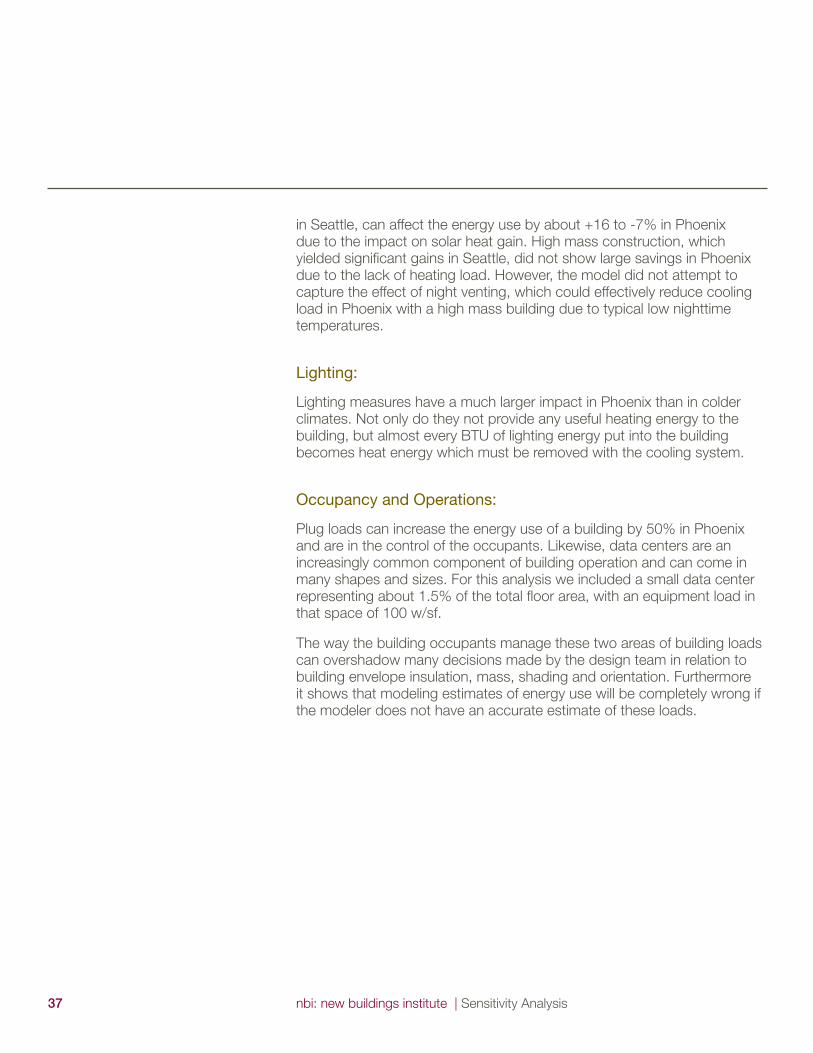
Occupancy and Operations:
Plug loads can increase the energy use of a building by 50% in Phoenix
and are in the control of the occupants. Likewise, data centers are an
increasingly common component of building operation and can come in
many shapes and sizes. For this analysis we included a small data center
representing about 1.5% of the total fl oor area, with an equipment load in
that space of 100 w/sf.
The way the building occupants manage these two areas of building loads
can overshadow many decisions made by the design team in relation to
building envelope insulation, mass, shading and orientation. Furthermore
it shows that modeling estimates of energy use will be completely wrong if
the modeler does not have an accurate estimate of these loads.
38 nbi: new buildings institute | Sensitivity Analysis
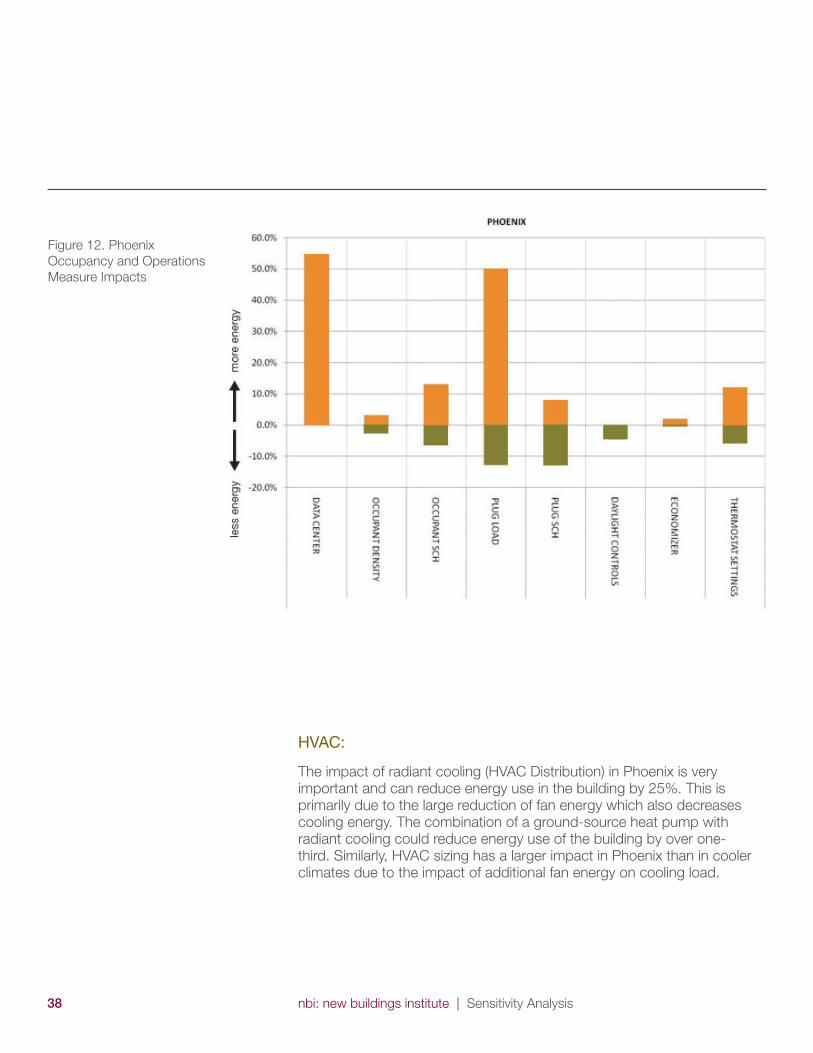
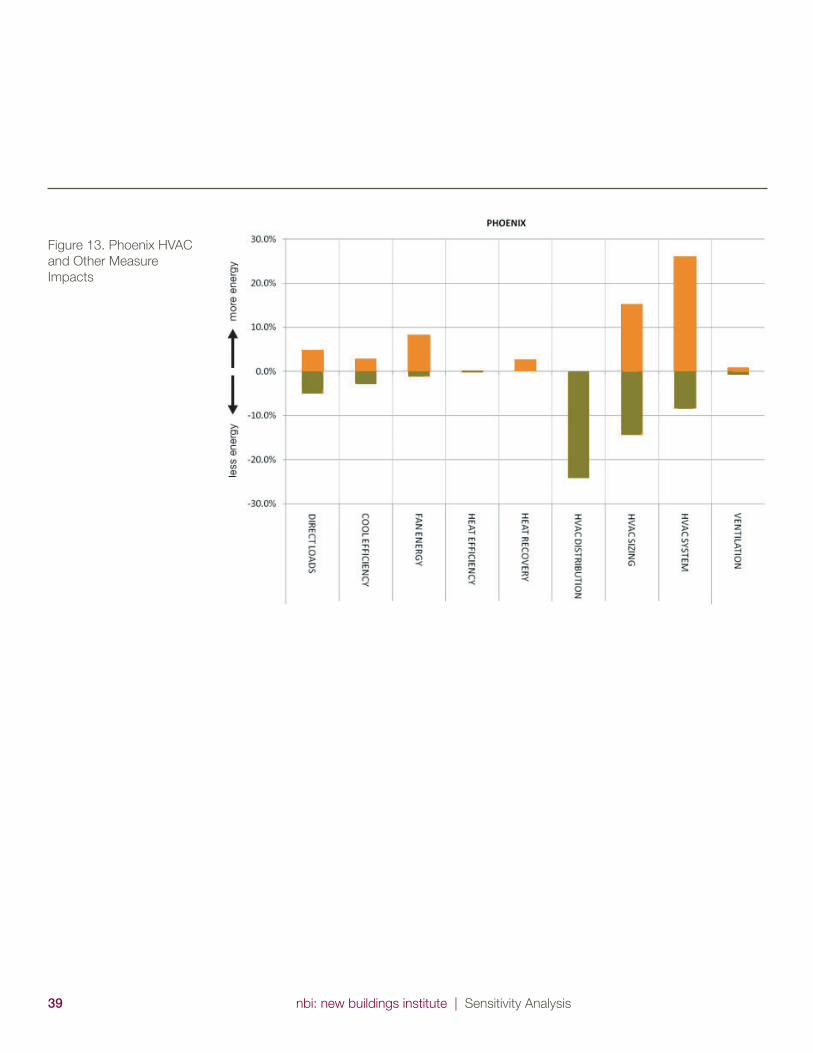
HVAC:
The impact of radiant cooling (HVAC Distribution) in Phoenix is very
important and can reduce energy use in the building by 25%. This is
primarily due to the large reduction of fan energy which also decreases
cooling energy. The combination of a ground-source heat pump with
radiant cooling could reduce energy use of the building by over one-
third. Similarly, HVAC sizing has a larger impact in Phoenix than in cooler
climates due to the impact of additional fan energy on cooling load.
Figure 12. Phoenix
Occupancy and Operations
Measure Impacts
nbi: new buildings institute | Sensitivity Analysis39
Figure 13. Phoenix HVAC
and Other Measure
Impacts

40 nbi: new buildings institute | Sensitivity Analysis
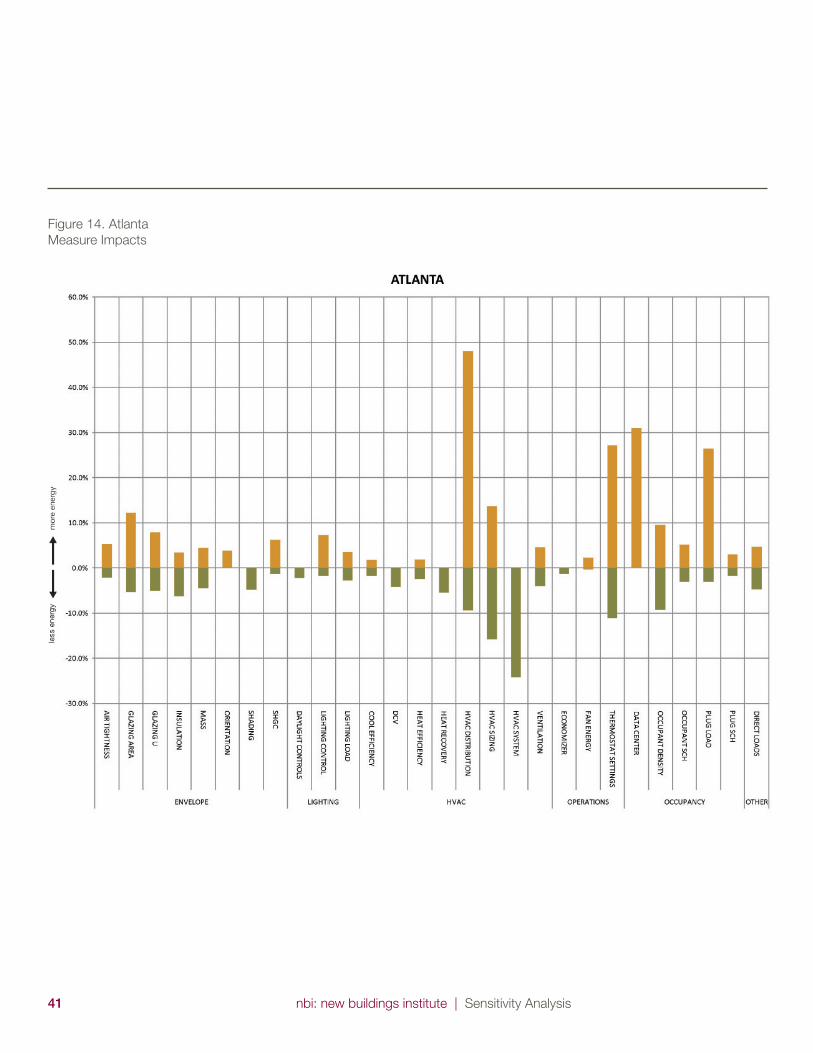
Since Atlanta does have a signifi cant heating load and requires
dehumidifi cation, measures to reduce heating load and infi ltration show
up as important. Note that this is driven strongly by the choice of HVAC
system. The base case PRTU does not perform well in a climate requiring
signifi cant dehumidifi cation; for the PRTU to dehumidify it must cool the
entire airstream and then reheat it as needed (with gas in this analysis)
to serve the space. The VAV system functions much better in Atlanta
because the air conditioning system can be arranged to recapture the
heat from the dehumidifi cation process to reheat the air. This can be seen
in the following graphic of the measure impacts in the Atlanta climate. The
HVAC System variable shows only positive impacts because the base
case system is the least effi cient.
The HVAC Distribution variable shows a huge negative impact associated
with going to an under-fl oor air system. This is due to the fact that the
under-fl oor air is delivered at a higher temperature, so much more energy
is needed to reheat the air during dehumidifi cation. This anomaly is a result
of the selection of a PRTU as the base case system. It can be ignored in
this case since it is unlikely that under-fl oor air would be used with PRTUs
in a humid climate such as Atlanta. Note that the energy use of the HVAC
systems is very sensitive to the humidity setpoint. 50% RH was selected
here as the industry standard, but large savings are available by increasing
this setpoint to 60-75%RH.
Where insulation, airtightness and mass had almost no impact in Phoenix,
they have a notable impact in Atlanta because of the heat load of the
base case building. In the areas of occupant and operator control, the
two climates look similar except that thermostat settings are much more
important in Atlanta than in Phoenix, again due to the impact of the
heating load.
Atlanta: Warm Moist Climate
nbi: new buildings institute | Sensitivity Analysis41
Figure 14. Atlanta
Measure Impacts
42 nbi: new buildings institute | Sensitivity Analysis
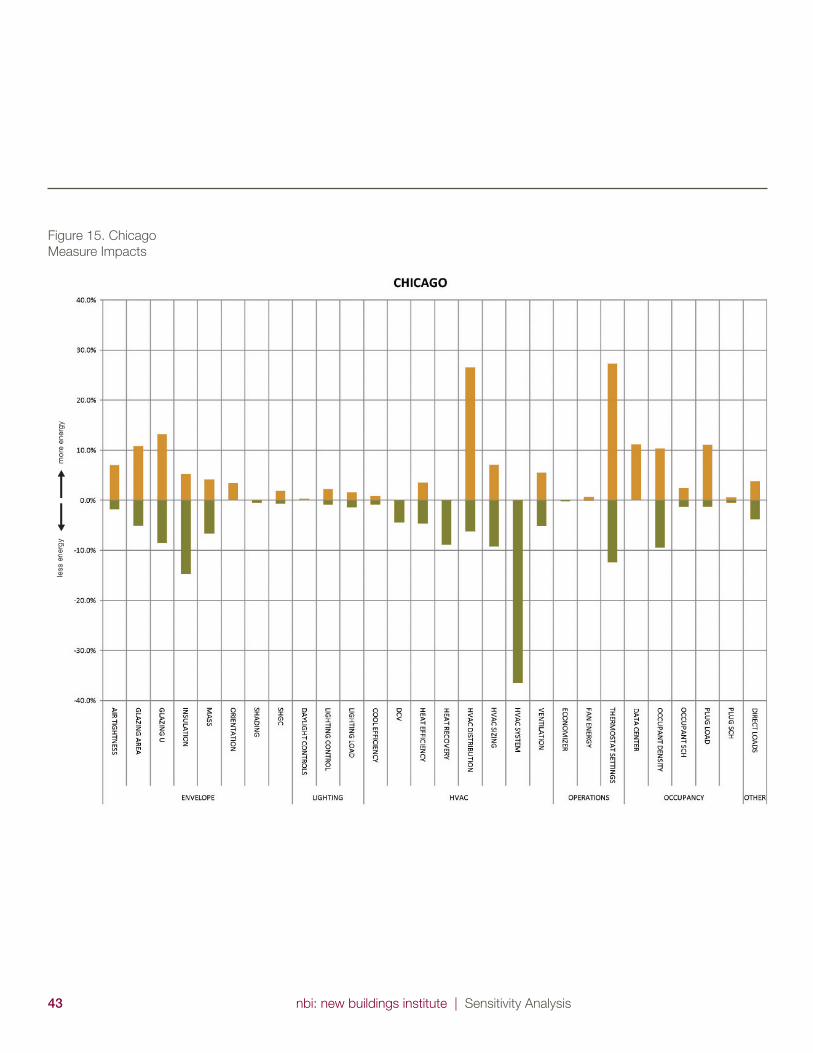
Chicago is a much more extreme heating climate than any of the others,
with nearly 6,500 heating degree days. As shown in the earlier pie charts
of energy end uses, heating is 40% of the base building energy use in
Chicago. As a result, the measures affecting heating energy will potentially
have the greatest savings. The graph of measure impacts for Chicago is
similar to the graphs for Seattle, the other heating climate shown. Some
of the pronounced differences are that heat recovery and airtightness are
much more important, and controlling data center and plug loads is less
important due to the colder winter temperatures and higher heating loads.
The HVAC Distribution variable shows a large negative impact of under-
fl oor air in Chicago. This is again due to the large cost of reheating air to a
warmer delivery temperature for dehumidifi cation with the PRTU system.
Note that while VAV is a poor energy choice in Seattle, it is a better system
in Chicago due to the ability to reheat with the air conditioning system for
dehumidifi cation.
Chicago: Cold Climate
nbi: new buildings institute | Sensitivity Analysis43
Figure 15. Chicago
Measure Impacts
44 nbi: new buildings institute | Sensitivity Analysis
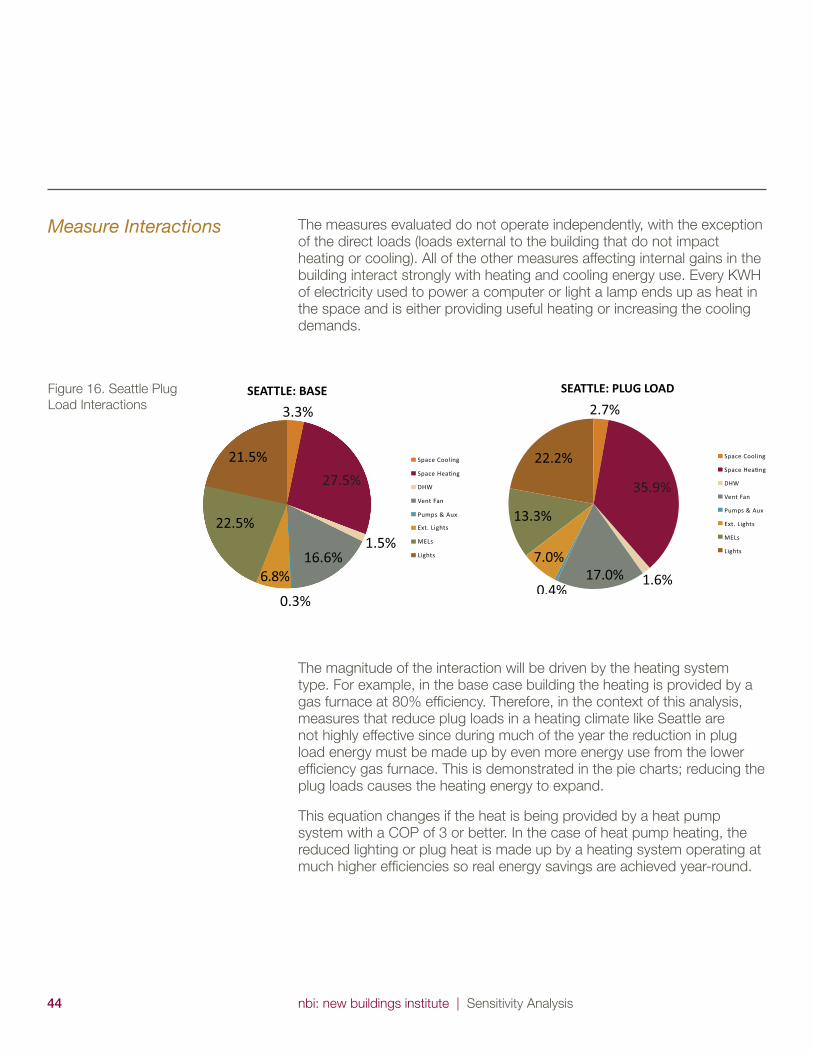
The measures evaluated do not operate independently, with the exception
of the direct loads (loads external to the building that do not impact
heating or cooling). All of the other measures affecting internal gains in the
building interact strongly with heating and cooling energy use. Every KWH
of electricity used to power a computer or light a lamp ends up as heat in
the space and is either providing useful heating or increasing the cooling
demands.
Measure Interactions
SEATTLE: BASE
3.3%
21.5%
22.5%
6.8%
0.3%
16.6%
27.5%
1.5%
Figure 16. Seattle Plug
Load Interactions
The magnitude of the interaction will be driven by the heating system
type. For example, in the base case building the heating is provided by a
gas furnace at 80% effi ciency. Therefore, in the context of this analysis,
measures that reduce plug loads in a heating climate like Seattle are
not highly effective since during much of the year the reduction in plug
load energy must be made up by even more energy use from the lower
effi ciency gas furnace. This is demonstrated in the pie charts; reducing the
plug loads causes the heating energy to expand.
This equation changes if the heat is being provided by a heat pump
system with a COP of 3 or better. In the case of heat pump heating, the
reduced lighting or plug heat is made up by a heating system operating at
much higher effi ciencies so real energy savings are achieved year-round.
SEATTLE: PLUG LOAD
2.7%
22.2%
13.3%
7.0%
0.4%17.0% 1.6%
35.9%
Space Cooling
Space Hea�ng
DHW
Vent Fan
Pumps & Aux
Ext. Lights
MELs
Lights
Space Cooling
Space Hea�ng
DHW
Vent Fan
Pumps & Aux
Ext. Lights
MELs
Lights
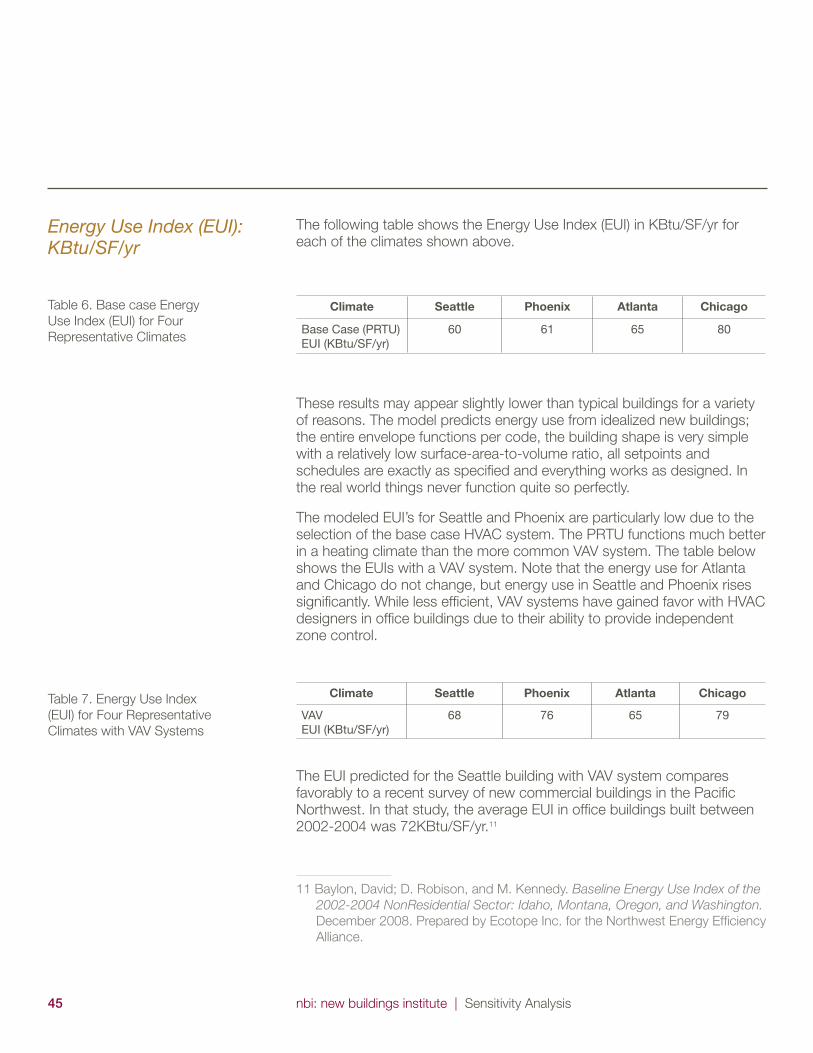
nbi: new buildings institute | Sensitivity Analysis45
The following table shows the Energy Use Index (EUI) in KBtu/SF/yr for
each of the climates shown above.
Climate Seattle Phoenix Atlanta Chicago
Base Case (PRTU) EUI (KBtu/SF/yr)
60 61 65 80
These results may appear slightly lower than typical buildings for a variety
of reasons. The model predicts energy use from idealized new buildings;
the entire envelope functions per code, the building shape is very simple
with a relatively low surface-area-to-volume ratio, all setpoints and
schedules are exactly as specifi ed and everything works as designed. In
the real world things never function quite so perfectly.
The modeled EUI’s for Seattle and Phoenix are particularly low due to the
selection of the base case HVAC system. The PRTU functions much better
in a heating climate than the more common VAV system. The table below
shows the EUIs with a VAV system. Note that the energy use for Atlanta
and Chicago do not change, but energy use in Seattle and Phoenix rises
signifi cantly. While less effi cient, VAV systems have gained favor with HVAC
designers in offi ce buildings due to their ability to provide independent
zone control.
Climate Seattle Phoenix Atlanta Chicago
VAV EUI (KBtu/SF/yr)
68 76 65 79
The EUI predicted for the Seattle building with VAV system compares
favorably to a recent survey of new commercial buildings in the Pacifi c
Northwest. In that study, the average EUI in offi ce buildings built between
2002-2004 was 72KBtu/SF/yr.11
11 Baylon, David; D. Robison, and M. Kennedy. Baseline Energy Use Index of the
2002-2004 NonResidential Sector: Idaho, Montana, Oregon, and Washington.
December 2008. Prepared by Ecotope Inc. for the Northwest Energy Effi ciency
Alliance.
Energy Use Index (EUI): KBtu/SF/yr
Table 6. Base case Energy
Use Index (EUI) for Four
Representative Climates
Table 7. Energy Use Index
(EUI) for Four Representative
Climates with VAV Systems
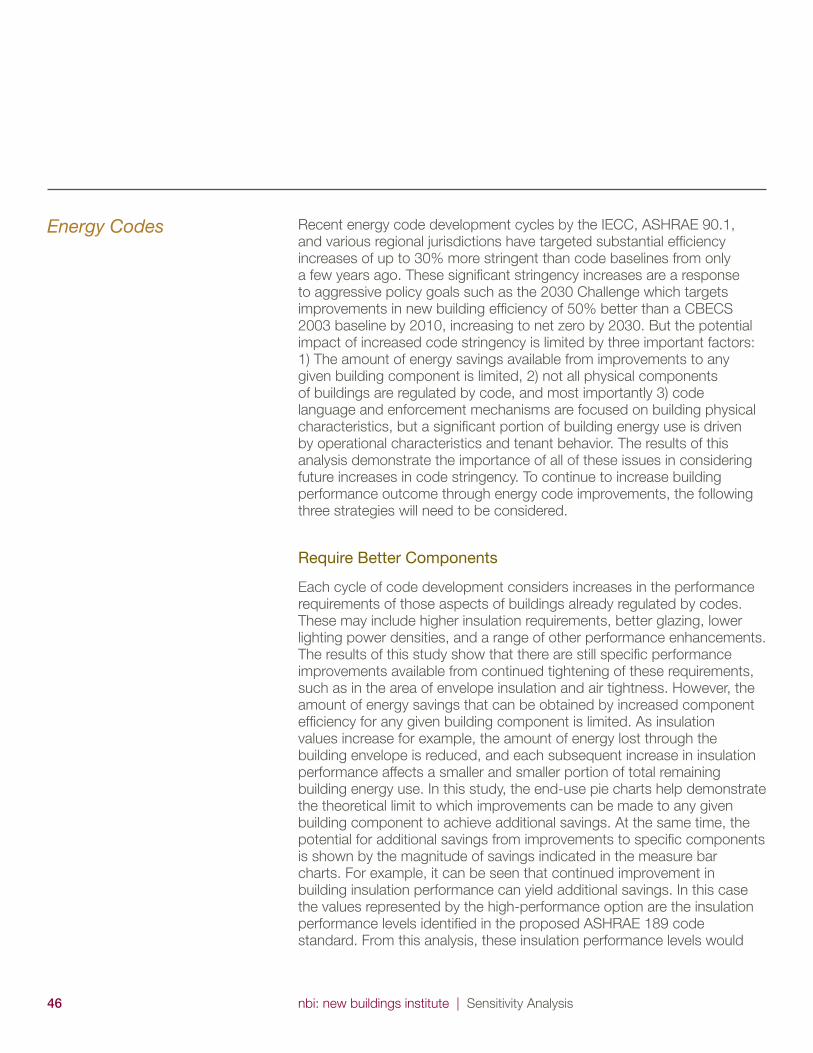
46 nbi: new buildings institute | Sensitivity Analysis
Recent energy code development cycles by the IECC, ASHRAE 90.1,
and various regional jurisdictions have targeted substantial effi ciency
increases of up to 30% more stringent than code baselines from only
a few years ago. These signifi cant stringency increases are a response
to aggressive policy goals such as the 2030 Challenge which targets
improvements in new building effi ciency of 50% better than a CBECS
2003 baseline by 2010, increasing to net zero by 2030. But the potential
impact of increased code stringency is limited by three important factors:
1) The amount of energy savings available from improvements to any
given building component is limited, 2) not all physical components
of buildings are regulated by code, and most importantly 3) code
language and enforcement mechanisms are focused on building physical
characteristics, but a signifi cant portion of building energy use is driven
by operational characteristics and tenant behavior. The results of this
analysis demonstrate the importance of all of these issues in considering
future increases in code stringency. To continue to increase building
performance outcome through energy code improvements, the following
three strategies will need to be considered.
Require Better Components
Each cycle of code development considers increases in the performance
requirements of those aspects of buildings already regulated by codes.
These may include higher insulation requirements, better glazing, lower
lighting power densities, and a range of other performance enhancements.
The results of this study show that there are still specifi c performance
improvements available from continued tightening of these requirements,
such as in the area of envelope insulation and air tightness. However, the
amount of energy savings that can be obtained by increased component
effi ciency for any given building component is limited. As insulation
values increase for example, the amount of energy lost through the
building envelope is reduced, and each subsequent increase in insulation
performance affects a smaller and smaller portion of total remaining
building energy use. In this study, the end-use pie charts help demonstrate
the theoretical limit to which improvements can be made to any given
building component to achieve additional savings. At the same time, the
potential for additional savings from improvements to specifi c components
is shown by the magnitude of savings indicated in the measure bar
charts. For example, it can be seen that continued improvement in
building insulation performance can yield additional savings. In this case
the values represented by the high-performance option are the insulation
performance levels identifi ed in the proposed ASHRAE 189 code
standard. From this analysis, these insulation performance levels would
Energy Codes
nbi: new buildings institute | Sensitivity Analysis47
result in signifi cant additional energy savings. However it is also clear from
these results that continued increases in the stringency requirements on
components currently regulated by the code may not represent the largest
potential energy performance improvements available.
Regulate More Components
Not all physical components of the buildings are regulated under current
code practice. Figure 17 below highlights those components analyzed
in this study which are currently within the scope of codes, and those
which are not. For example, there are signifi cant savings to be had from
better HVAC system selection, but current codes tend to be system-
neutral, allowing the design team to select from HVAC systems with
higher or lower effi ciency without penalty. Even when projects are using
energy modeling to compare their design strategy to a baseline building,
system alternatives are often not considered as a basis for performance
improvements beyond code.12 In the case of glazing area, codes do tend
to require increased thermal performance as window area increases,
but they do not specifi cally limit glazing areas, nor do the increases in
thermal performance in current codes fully make up for the adverse energy
performance impact of increased glazing area.
12 A more comprehensive discussion of these issues can be found at http://new-
buildings.org/sites/default/fi les/Future_of_Codes-ACEEE_Paper.pdf
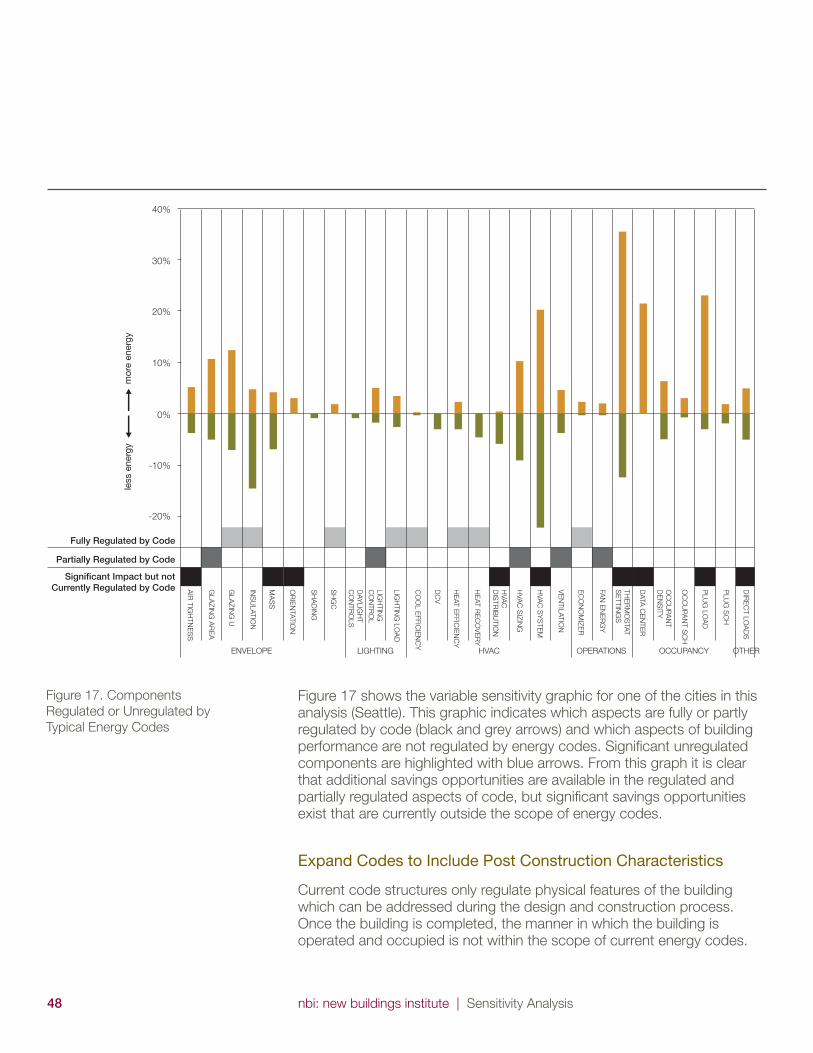
48 nbi: new buildings institute | Sensitivity Analysis
Figure 17 shows the variable sensitivity graphic for one of the cities in this
analysis (Seattle). This graphic indicates which aspects are fully or partly
regulated by code (black and grey arrows) and which aspects of building
performance are not regulated by energy codes. Signifi cant unregulated
components are highlighted with blue arrows. From this graph it is clear
that additional savings opportunities are available in the regulated and
partially regulated aspects of code, but signifi cant savings opportunities
exist that are currently outside the scope of energy codes.
Expand Codes to Include Post Construction Characteristics
Current code structures only regulate physical features of the building
which can be addressed during the design and construction process.
Once the building is completed, the manner in which the building is
operated and occupied is not within the scope of current energy codes.
Figure 17. Components
Regulated or Unregulated by
Typical Energy Codes
mor
e en
ergy
less
ene
rgy
40%
30%
20%
10%
0%
-10%
-20%
AIR
TIG
HT
NE
SS
GLA
ZIN
G A
RE
A
GLA
ZIN
G U
INS
ULA
TIO
N
ENVELOPE LIGHTING HVAC OPERATIONS OCCUPANCY OTHER
OR
IEN
TA
TIO
N
SH
AD
ING
SH
GC
DA
YLIG
HT
CO
NT
RO
LS
LIG
HT
ING
CO
NT
RO
L
LIG
HT
ING
LO
AD
CO
OL E
FFIC
IEN
CY
DC
V
HE
AT
EFFIC
IEN
CY
HE
AT
RE
CO
VE
RY
HVA
C
DIS
TR
IBU
TIO
N
HVA
C S
IZIN
G
HVA
C S
YS
TE
M
EC
ON
OM
IZE
R
FA
N E
NE
RG
Y
TH
ER
MO
STA
T
SE
TT
ING
S
DA
TA
CE
NT
ER
OC
CU
PA
NT
DE
NS
ITY
OC
CU
PA
NT
SC
H
PLU
G L
OA
D
PLU
G S
CH
DIR
EC
T L
OA
DS
VE
NT
ILA
TIO
N
MA
SS
Fully Regulated by Code
Partially Regulated by Code
Signifi cant Impact but not Currently Regulated by Code
nbi: new buildings institute | Sensitivity Analysis49
This represents an increasingly signifi cant limitation to the ability of
energy codes to affect building energy use, especially at the aggressive
performance targets being set for codes.
In this analysis, the relative impact of post-construction variables is
compared to the kinds of effi ciency strategies more commonly considered
in the design process. A key fi nding of this study is just how signifi cant
occupancy factors are relative to design features. It is clear that in order
to achieve more aggressive code targets, codes will increasingly need to
address post-construction energy loads. This represents a substantial
change to code and enforcement structures as increasingly higher building
performance outcomes are targeted.
50 nbi: new buildings institute | Sensitivity Analysis
While the set of building features and characteristics generated in
the design process have a major impact on total building energy use,
operational and tenant characteristics also have signifi cant impact.
This analysis shows that long-term, signifi cant reductions in building
energy use will require signifi cant attention to post-construction building
characteristics and operation that are currently outside the scope of
energy codes, policy initiatives, and general perceptions in the building
industry.
The study also demonstrates that while there remain opportunities for
further improvement in energy code stringency within current code
structure, new mechanisms and code structures will be needed to capture
savings from some of the larger remaining savings streams in building
performance.
There is also an opportunity for more attention to climate-specifi c impacts
on building performance, with a goal of improving the degree to which
building design and operation responds to specifi c climate conditions.
The information generated by this work can be used to guide design and
energy modeling priorities, and to help educate the design community
about strategies to improve long-term building operation. At the same
time the information can serve to educate building operators and tenants
on strategies to reduce building energy use, and as a basis for codes and
policies that focus on signifi cant energy savings opportunities that exist
downstream of the building design process.
Summary
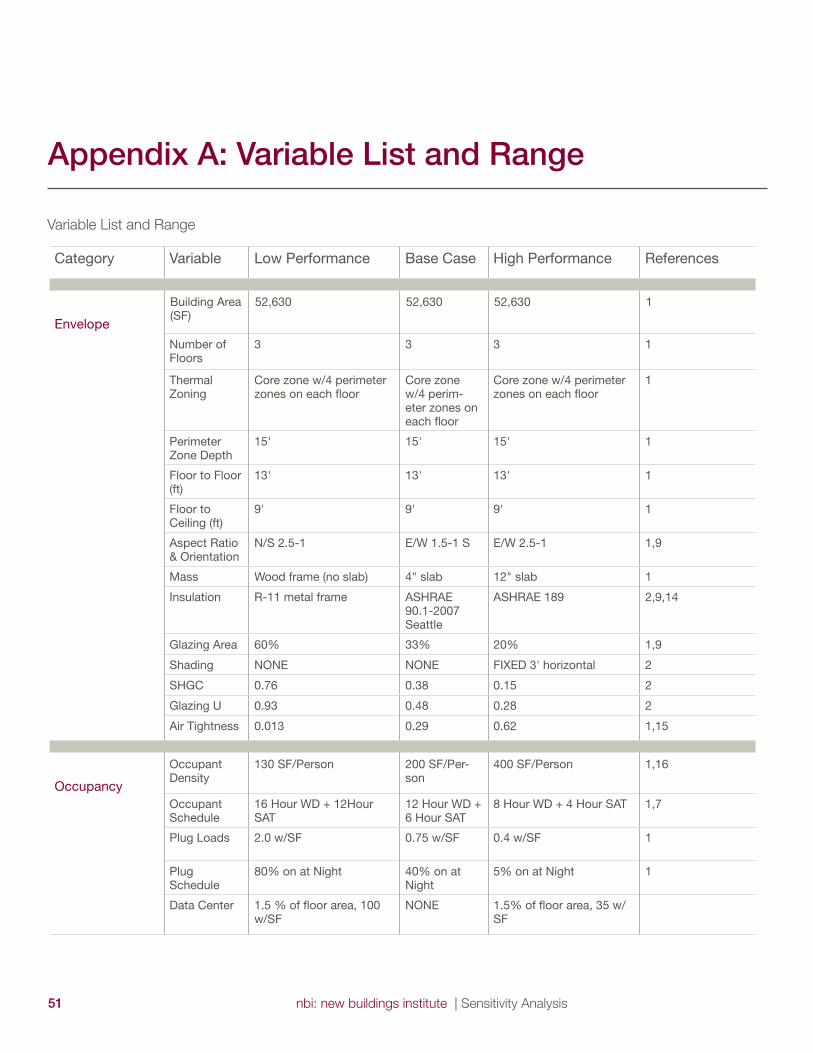
nbi: new buildings institute | Sensitivity Analysis51
Variable List and Range
Appendix A: Variable List and Range
Category Variable Low Performance Base Case High Performance References
Envelope
Building Area (SF)
52,630 52,630 52,630 1
Number of Floors
3 3 3 1
Thermal Zoning
Core zone w/4 perimeter zones on each fl oor
Core zone w/4 perim-eter zones on each fl oor
Core zone w/4 perimeter zones on each fl oor
1
Perimeter Zone Depth
15' 15' 15' 1
Floor to Floor (ft)
13' 13' 13' 1
Floor to Ceiling (ft)
9' 9' 9' 1
Aspect Ratio & Orientation
N/S 2.5-1 E/W 1.5-1 S E/W 2.5-1 1,9
Mass Wood frame (no slab) 4" slab 12" slab 1
Insulation R-11 metal frame ASHRAE 90.1-2007 Seattle
ASHRAE 189 2,9,14
Glazing Area 60% 33% 20% 1,9
Shading NONE NONE FIXED 3' horizontal 2
SHGC 0.76 0.38 0.15 2
Glazing U 0.93 0.48 0.28 2
Air Tightness 0.013 0.29 0.62 1,15
Occupancy
Occupant Density
130 SF/Person 200 SF/Per-son
400 SF/Person 1,16
Occupant Schedule
16 Hour WD + 12Hour SAT
12 Hour WD + 6 Hour SAT
8 Hour WD + 4 Hour SAT 1,7
Plug Loads 2.0 w/SF 0.75 w/SF 0.4 w/SF 1
Plug Schedule
80% on at Night 40% on at Night
5% on at Night 1
Data Center 1.5 % of fl oor area, 100 w/SF
NONE 1.5% of fl oor area, 35 w/SF
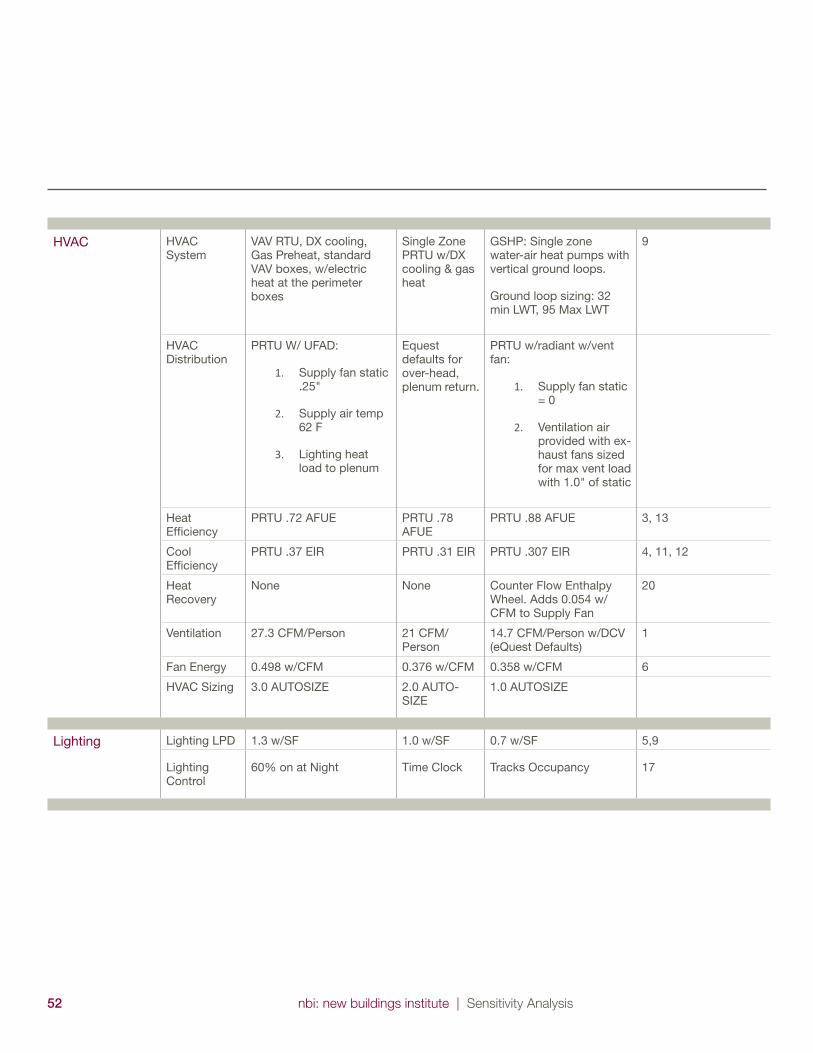
52 nbi: new buildings institute | Sensitivity Analysis
HVAC HVAC System
VAV RTU, DX cooling, Gas Preheat, standard VAV boxes, w/electric heat at the perimeter boxes
Single Zone PRTU w/DX cooling & gas heat
GSHP: Single zone water-air heat pumps with vertical ground loops.
Ground loop sizing: 32 min LWT, 95 Max LWT
9
HVAC Distribution
PRTU W/ UFAD:
1. Supply fan static .25"
2. Supply air temp 62 F
3. Lighting heat load to plenum
Equest defaults for over-head, plenum return.
PRTU w/radiant w/vent fan:
1. Supply fan static = 0
2. Ventilation air provided with ex-haust fans sized for max vent load with 1.0" of static
Heat Effi ciency
PRTU .72 AFUE PRTU .78 AFUE
PRTU .88 AFUE 3, 13
Cool Effi ciency
PRTU .37 EIR PRTU .31 EIR PRTU .307 EIR 4, 11, 12
Heat Recovery
None None Counter Flow Enthalpy Wheel. Adds 0.054 w/CFM to Supply Fan
20
Ventilation 27.3 CFM/Person 21 CFM/Person
14.7 CFM/Person w/DCV (eQuest Defaults)
1
Fan Energy 0.498 w/CFM 0.376 w/CFM 0.358 w/CFM 6
HVAC Sizing 3.0 AUTOSIZE 2.0 AUTO-SIZE
1.0 AUTOSIZE
Lighting Lighting LPD 1.3 w/SF 1.0 w/SF 0.7 w/SF 5,9
Lighting Control
60% on at Night Time Clock Tracks Occupancy 17
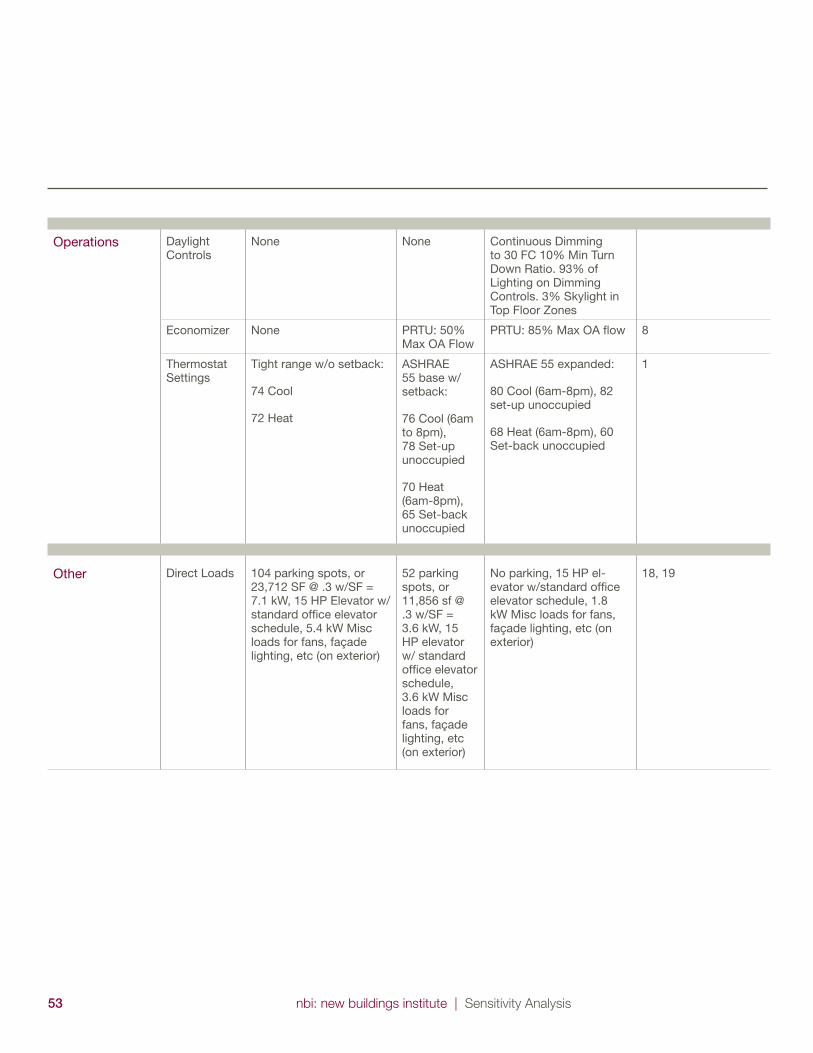
nbi: new buildings institute | Sensitivity Analysis53
Operations Daylight Controls
None None Continuous Dimming to 30 FC 10% Min Turn Down Ratio. 93% of Lighting on Dimming Controls. 3% Skylight in Top Floor Zones
Economizer None PRTU: 50% Max OA Flow
PRTU: 85% Max OA fl ow 8
Thermostat Settings
Tight range w/o setback:
74 Cool
72 Heat
ASHRAE 55 base w/setback:
76 Cool (6am to 8pm), 78 Set-up unoccupied
70 Heat (6am-8pm), 65 Set-back unoccupied
ASHRAE 55 expanded:
80 Cool (6am-8pm), 82 set-up unoccupied
68 Heat (6am-8pm), 60 Set-back unoccupied
1
Other Direct Loads 104 parking spots, or 23,712 SF @ .3 w/SF = 7.1 kW, 15 HP Elevator w/ standard offi ce elevator schedule, 5.4 kW Misc loads for fans, façade lighting, etc (on exterior)
52 parking spots, or 11,856 sf @ .3 w/SF = 3.6 kW, 15 HP elevator w/ standard offi ce elevator schedule, 3.6 kW Misc loads for fans, façade lighting, etc (on exterior)
No parking, 15 HP el-evator w/standard offi ce elevator schedule, 1.8 kW Misc loads for fans, façade lighting, etc (on exterior)
18, 19
54 nbi: new buildings institute | Sensitivity Analysis
References 1. NREL Benchmark Medium Offi ce Version 1.2_4.0: “Establishing
Benchmarks for DOE Commercial Building R&D and Program Evaluation”
2. P. Tocellini, B. Griffi th, M. Deru 2006
3. ASHRAE Standard 90.1 2007 table 5.5 4
4. ASHRAE Standard 90.1 2007 table 6.8.1E
5. ASHRAE Standard 90.1 2007 table 6.8.1B
6. ASHRAE Standard 90.1 2007 table 9.5.1
7. Trane Precedent Product Catalogue: “RT PRC023 EN”, June 2010
refbldg_mediumoffi ce_new2004_v1.3_5.0_SI input spreadsheet
8. Robert Davis, et. al. “Enhanced Operations & Maintenance Procedures
for Small Packaged Rooftop HVAC Systems”. 2002. Ecotope Inc.
Prepared for Eugene Water and Electric Board
9. Ecotope. Non residential data from “2002 commercial baseline study
for Pacifi c NW,”10% 90% range of offi ce buildings > 7500 square feet,
none of the offi ce buildings less than 100,000 square feet had multi-zone
systems
10. ASHRAE 62.1 2001, table 2, Estimated max occupancy
11. ASHRAE 189 2009, Table C 2
12. ASHRAE Standard 90.1 2004 table 6.8.1B
13. Discussions with several manufacturers, this is the highest effi ciency
available
14. ASHRAE 189 2009, Table A 4
15. Gowri, Winiarski, Jarnagin. “Infi ltration Modeling Guidelines for
Commercial Building Energy Analysis” Sept 2009.
16. Communication from Seattle Offi ce Building Developer
17. Communication from Christopher Meek of Seattle Integrated Design Lab
18. Seattle Municipal Code 23.54.015
19. Elevator Manufacturer’s Data
20. ERV Manufacturer’s Data for 6,000 CFM unit
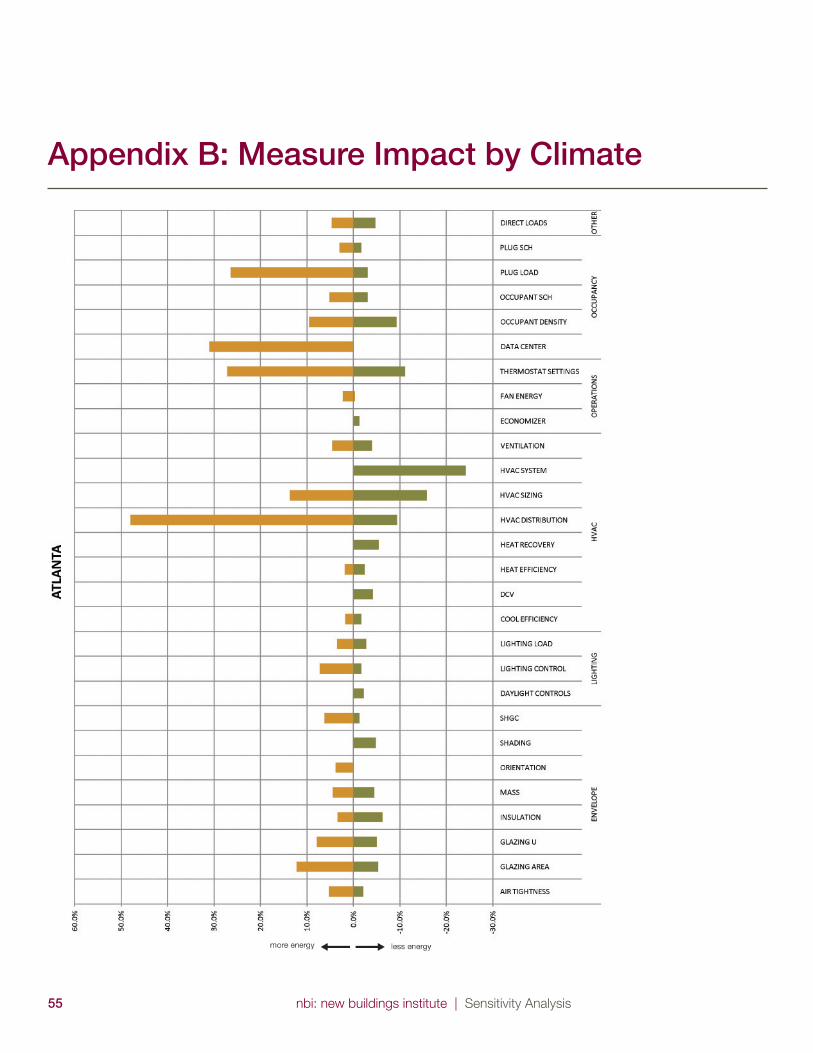
nbi: new buildings institute | Sensitivity Analysis55
Appendix B: Measure Impact by Climate
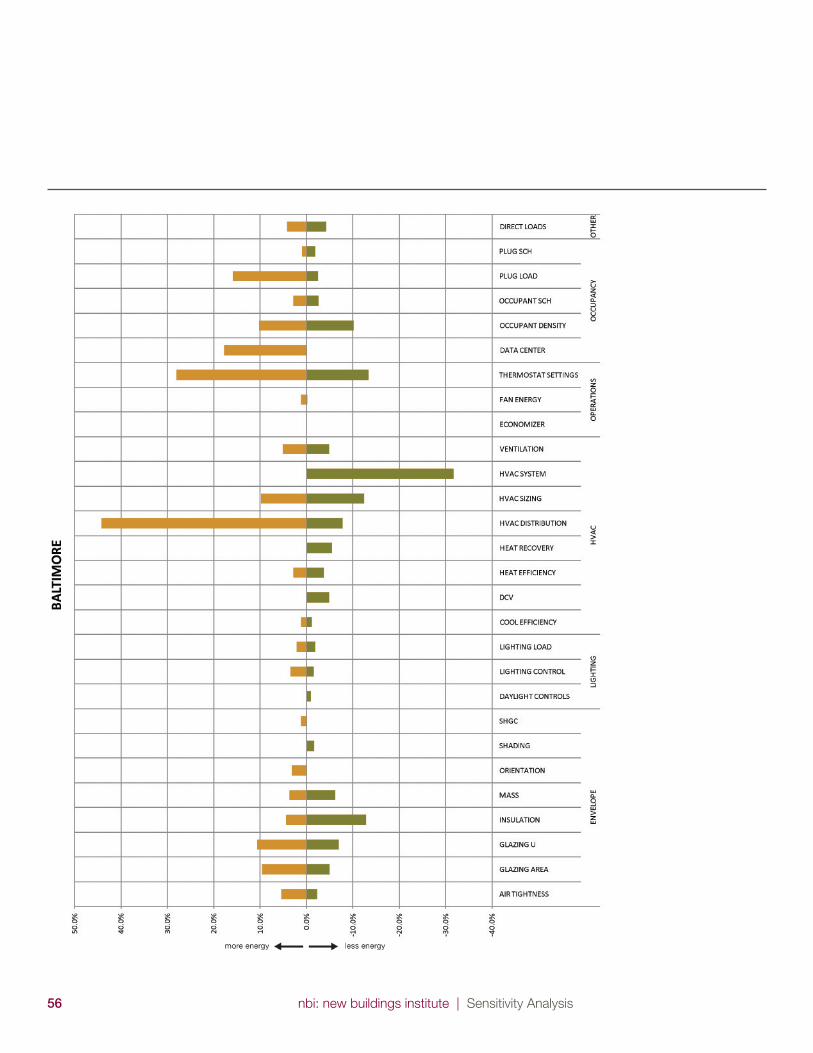
56 nbi: new buildings institute | Sensitivity Analysis
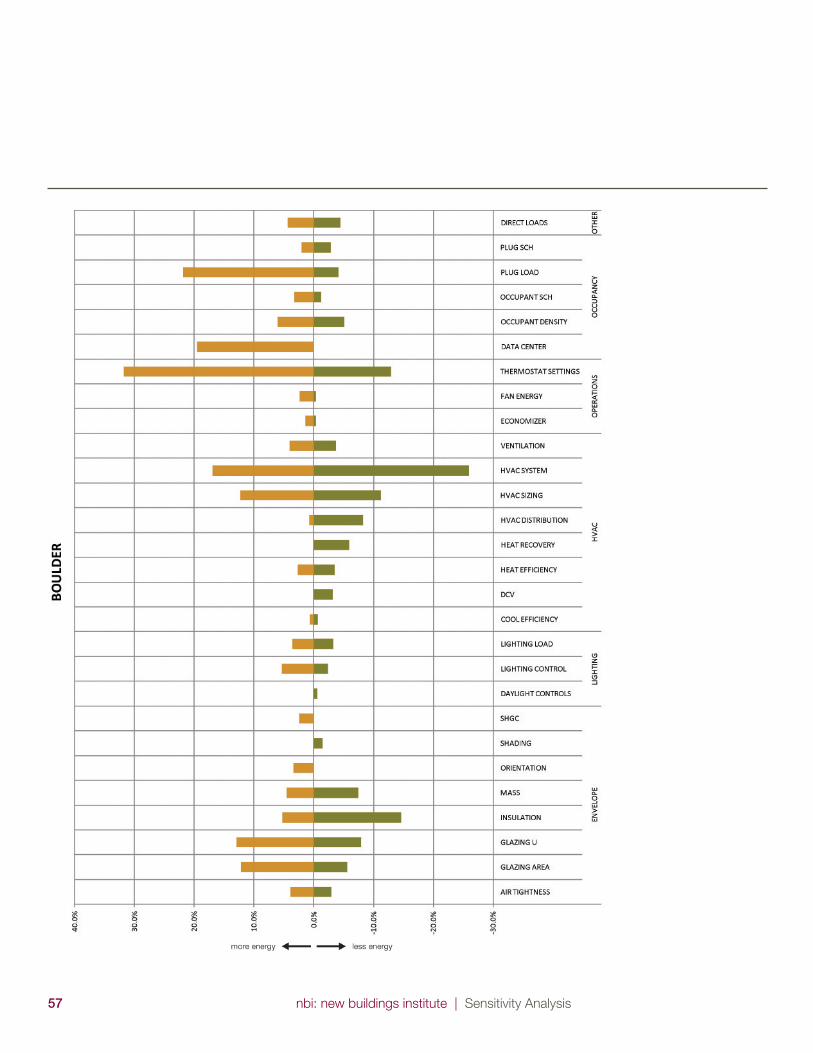
nbi: new buildings institute | Sensitivity Analysis57
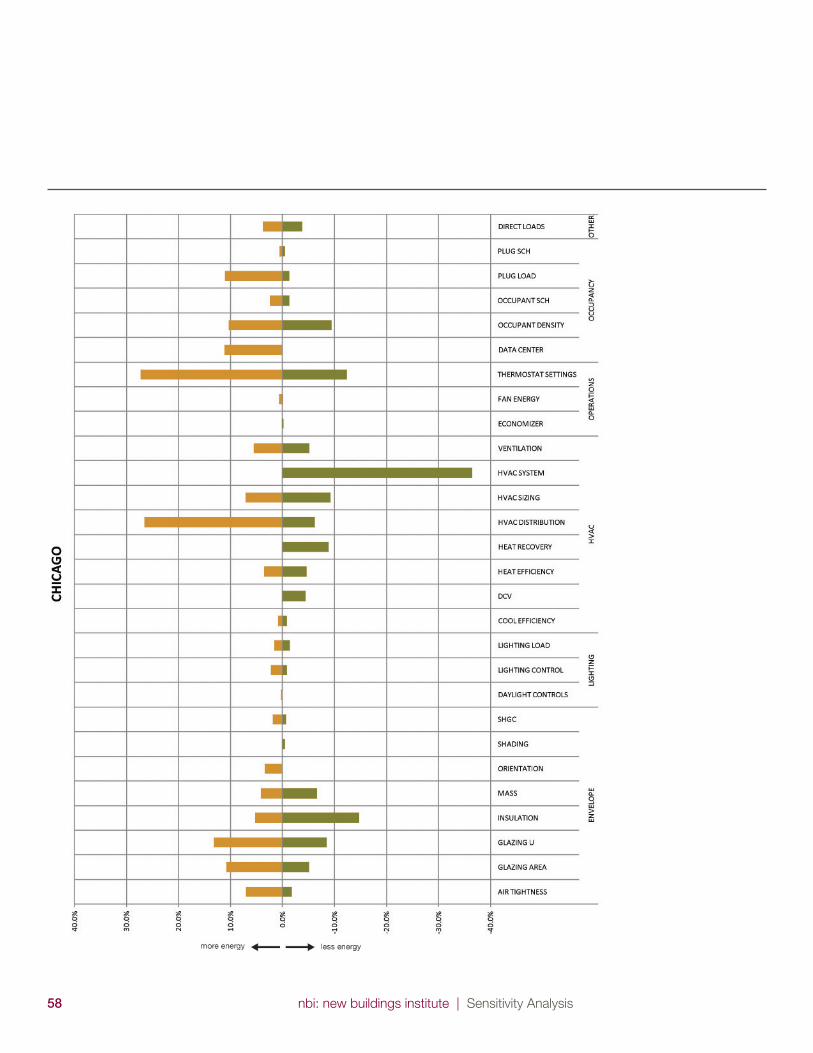
58 nbi: new buildings institute | Sensitivity Analysis

nbi: new buildings institute | Sensitivity Analysis59
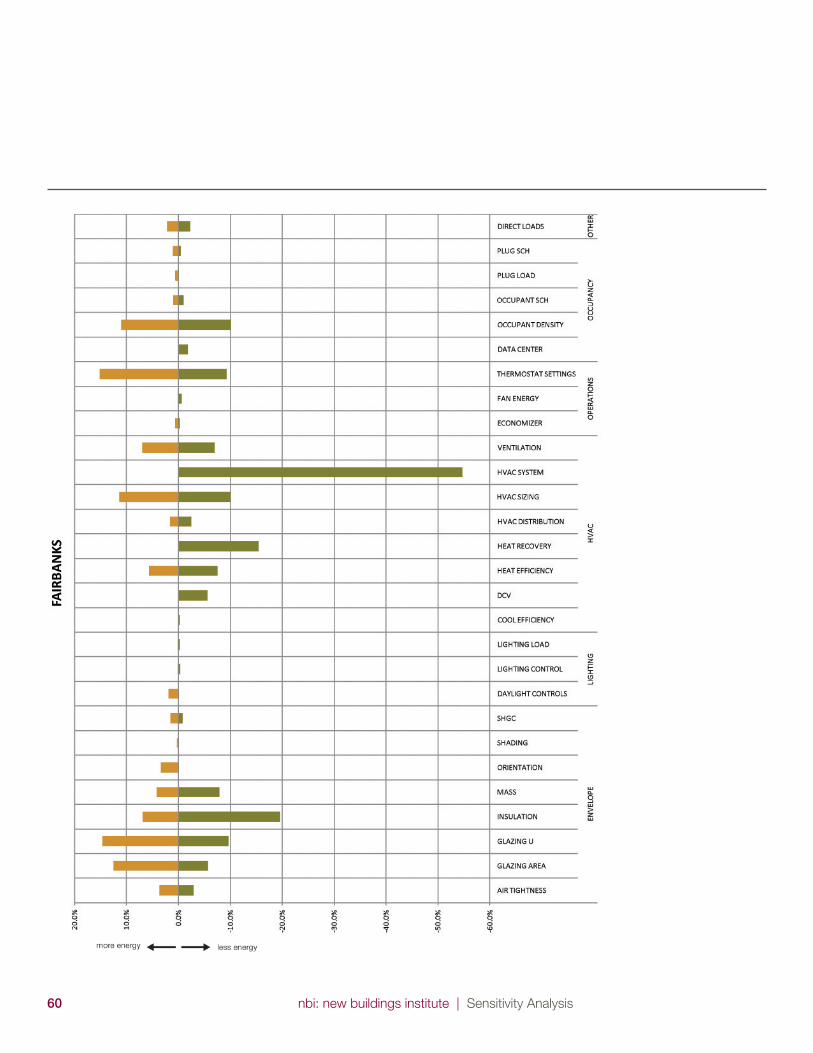
60 nbi: new buildings institute | Sensitivity Analysis
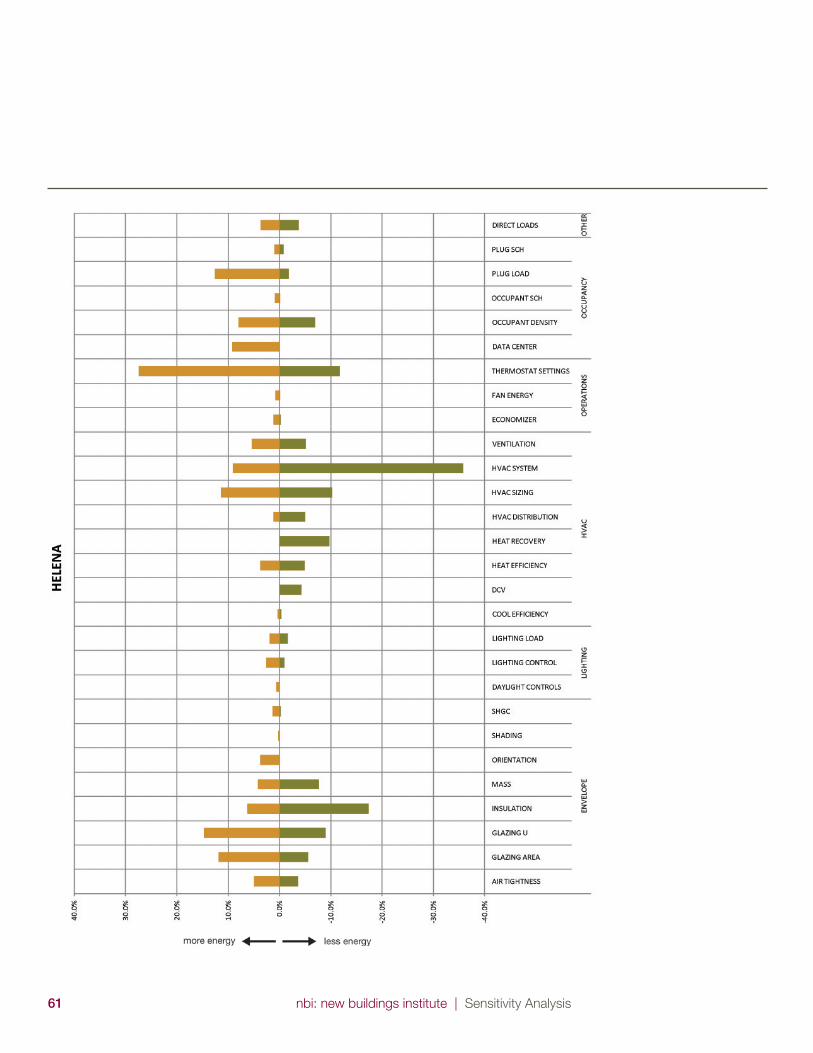
nbi: new buildings institute | Sensitivity Analysis61
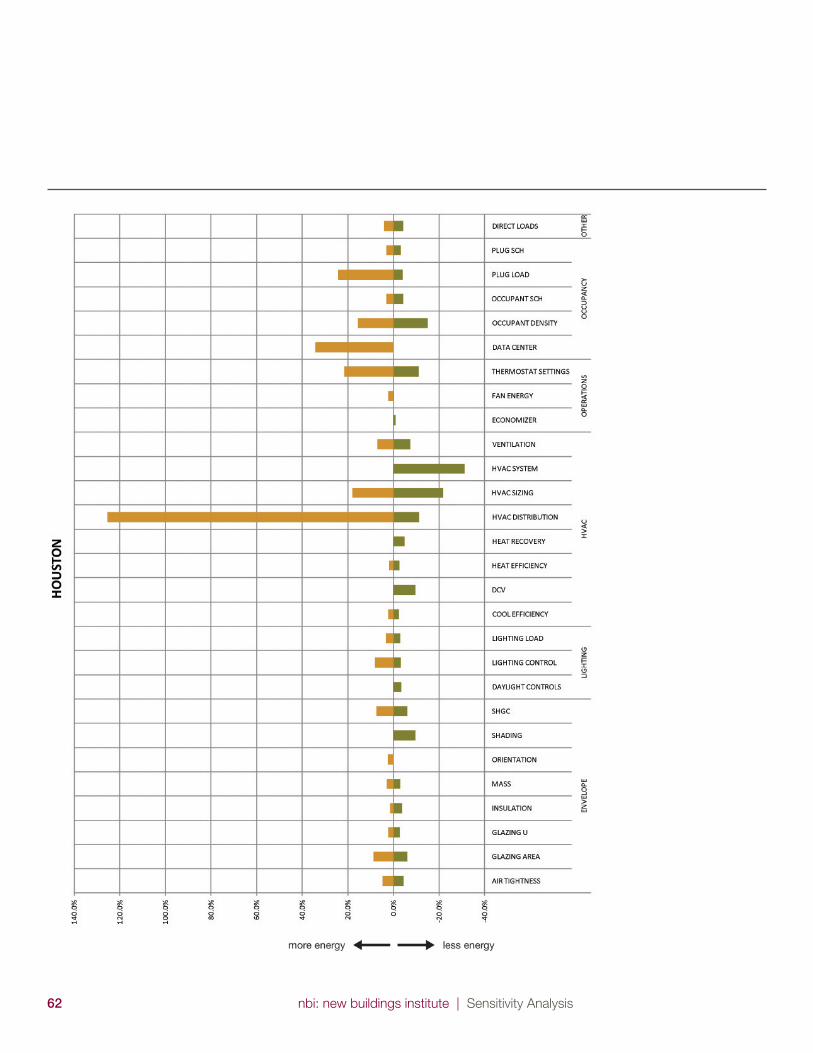
62 nbi: new buildings institute | Sensitivity Analysis
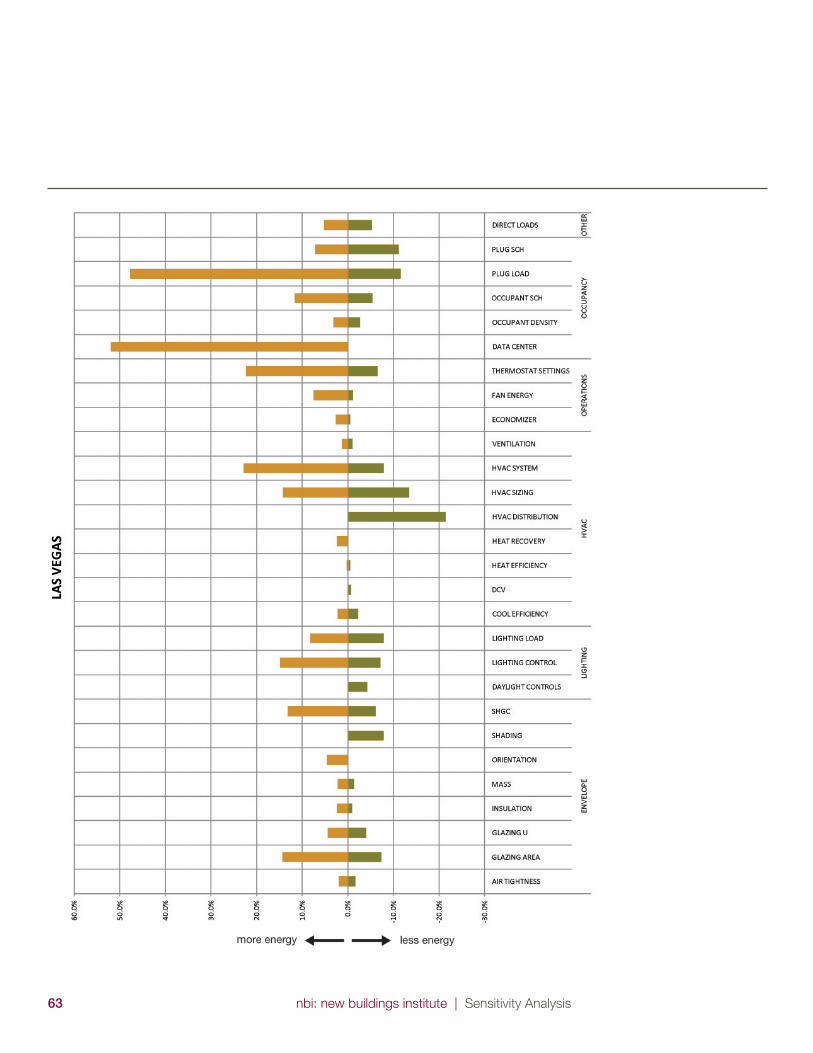
nbi: new buildings institute | Sensitivity Analysis63
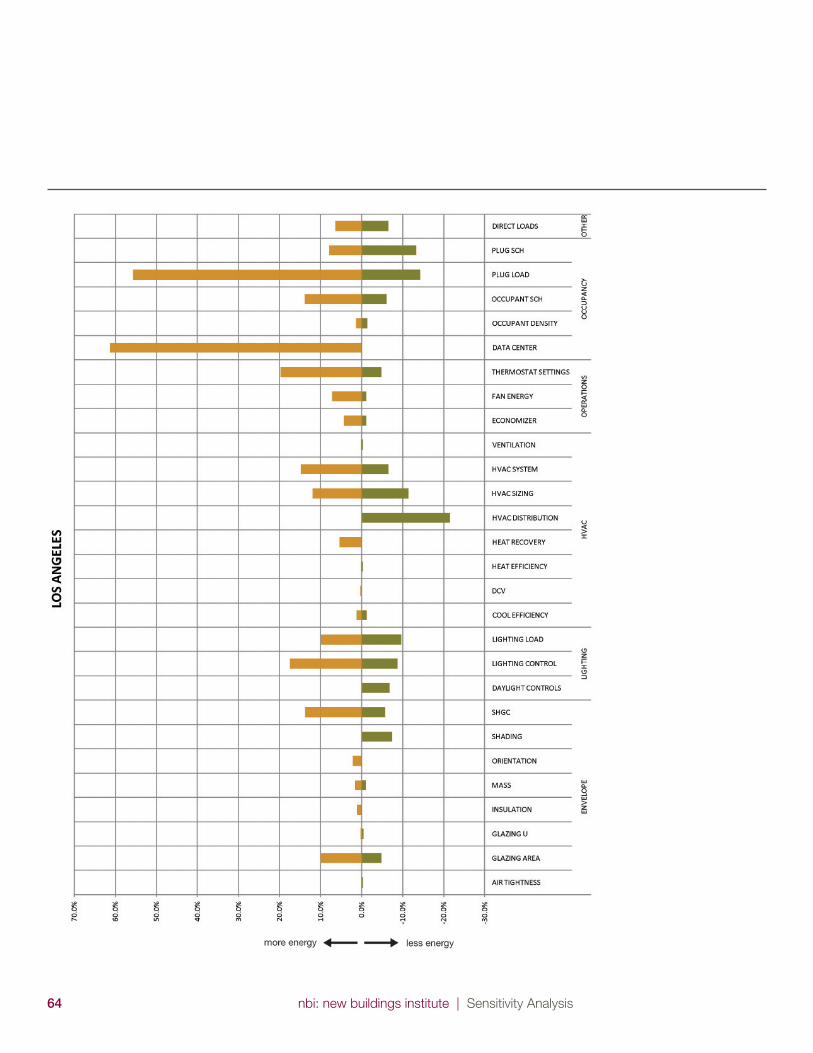
64 nbi: new buildings institute | Sensitivity Analysis
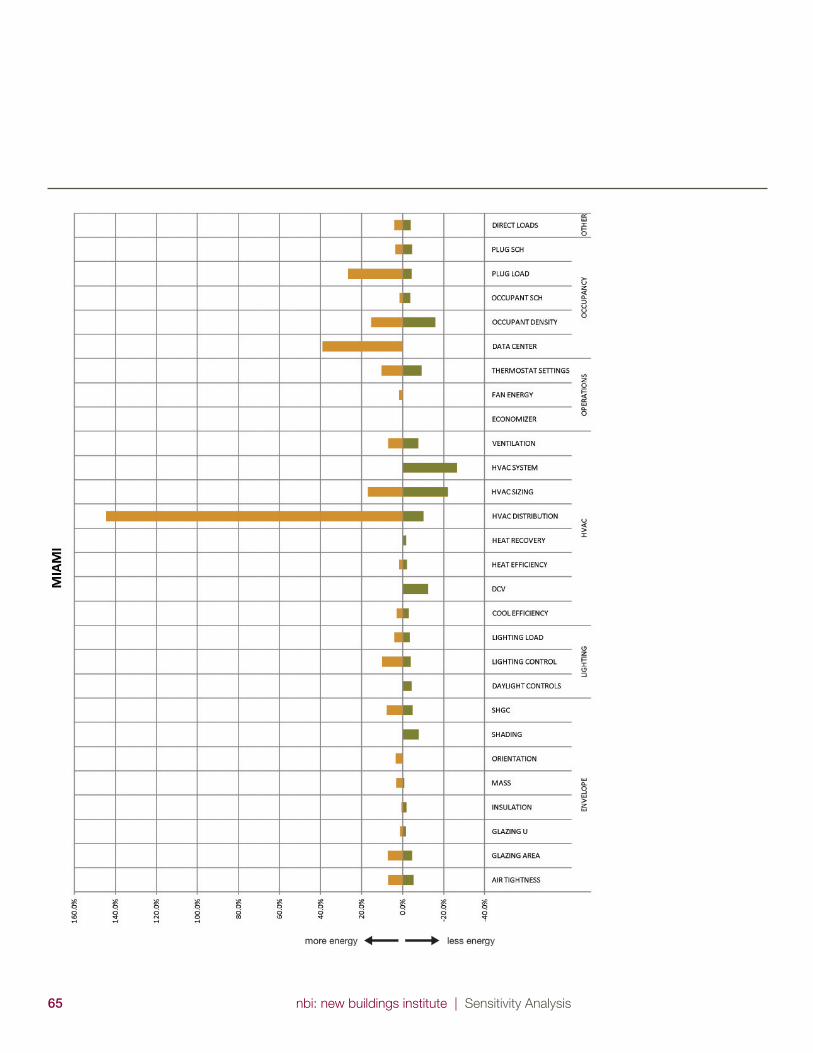
nbi: new buildings institute | Sensitivity Analysis65
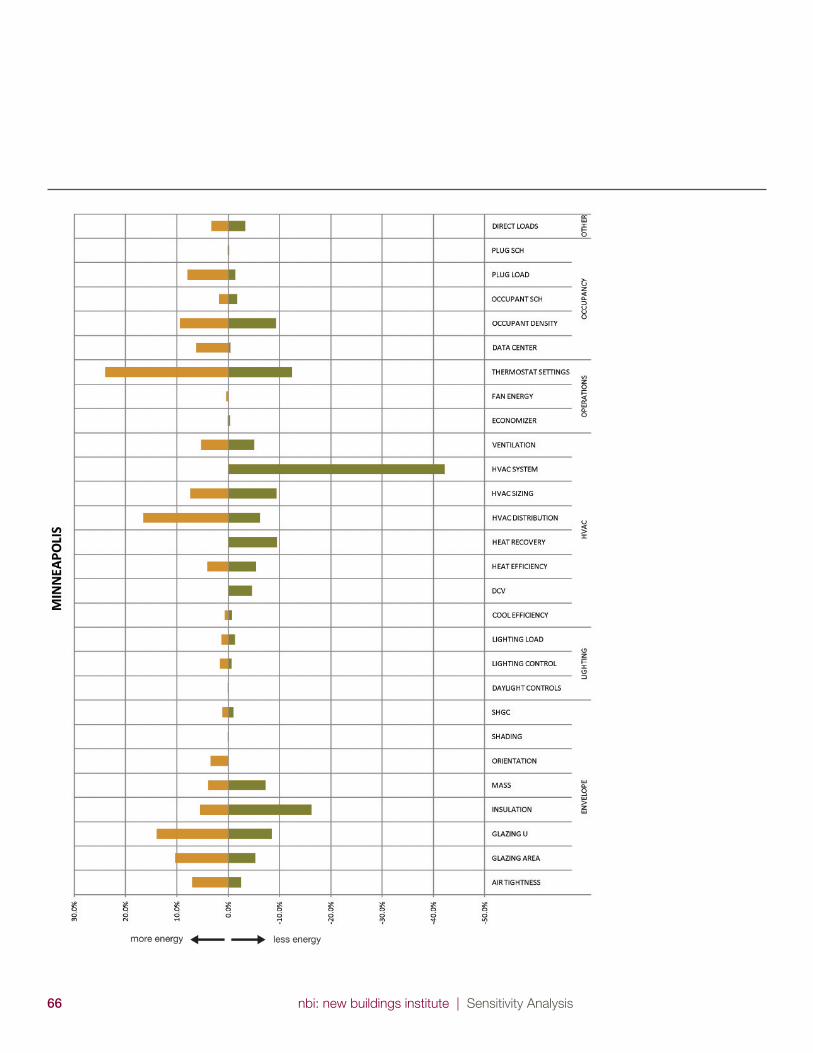
66 nbi: new buildings institute | Sensitivity Analysis
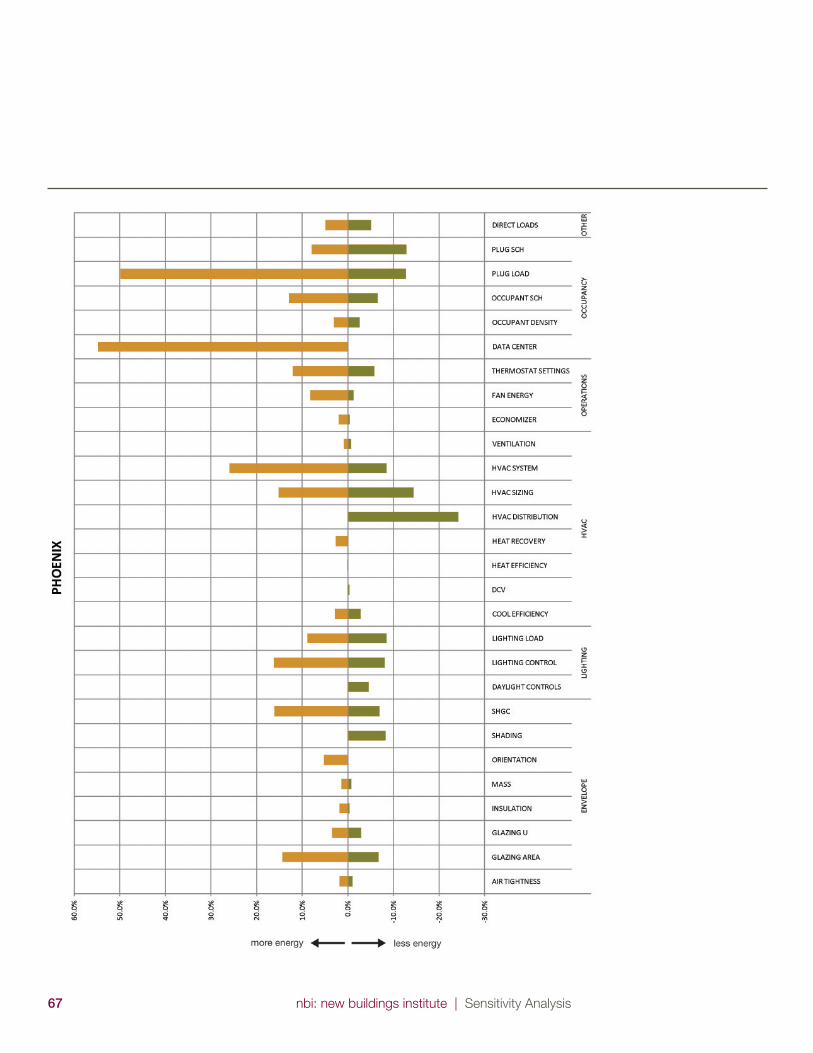
nbi: new buildings institute | Sensitivity Analysis67
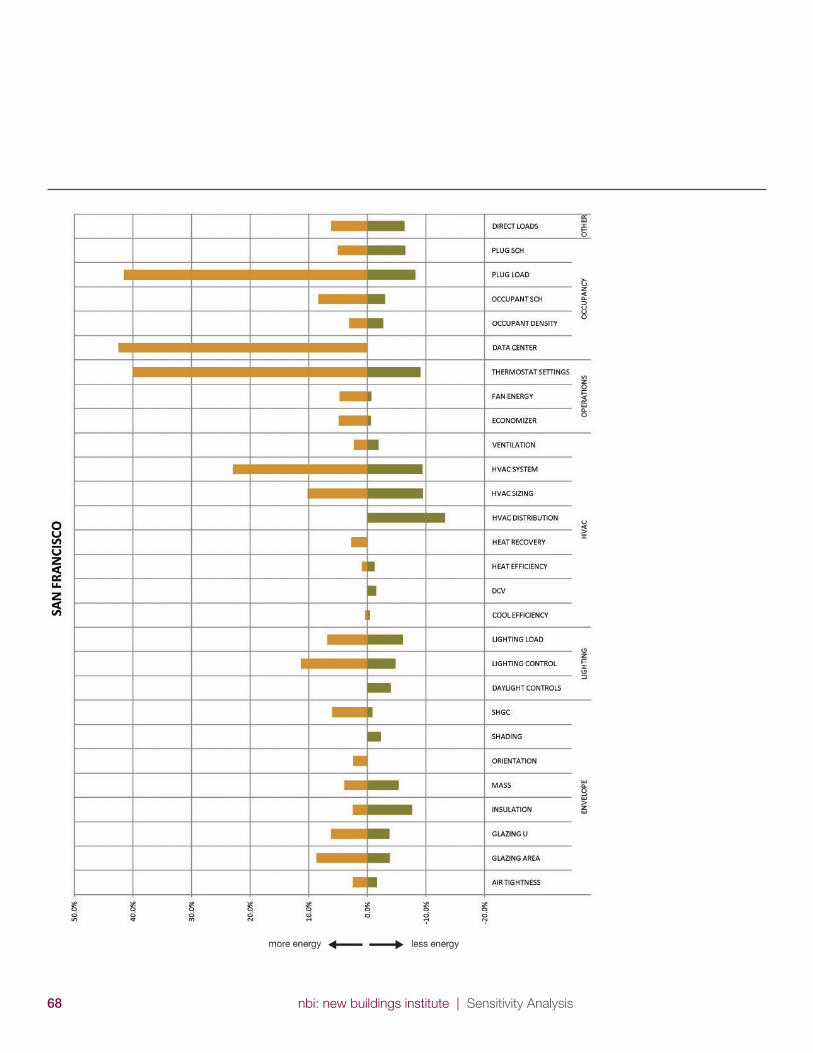
68 nbi: new buildings institute | Sensitivity Analysis
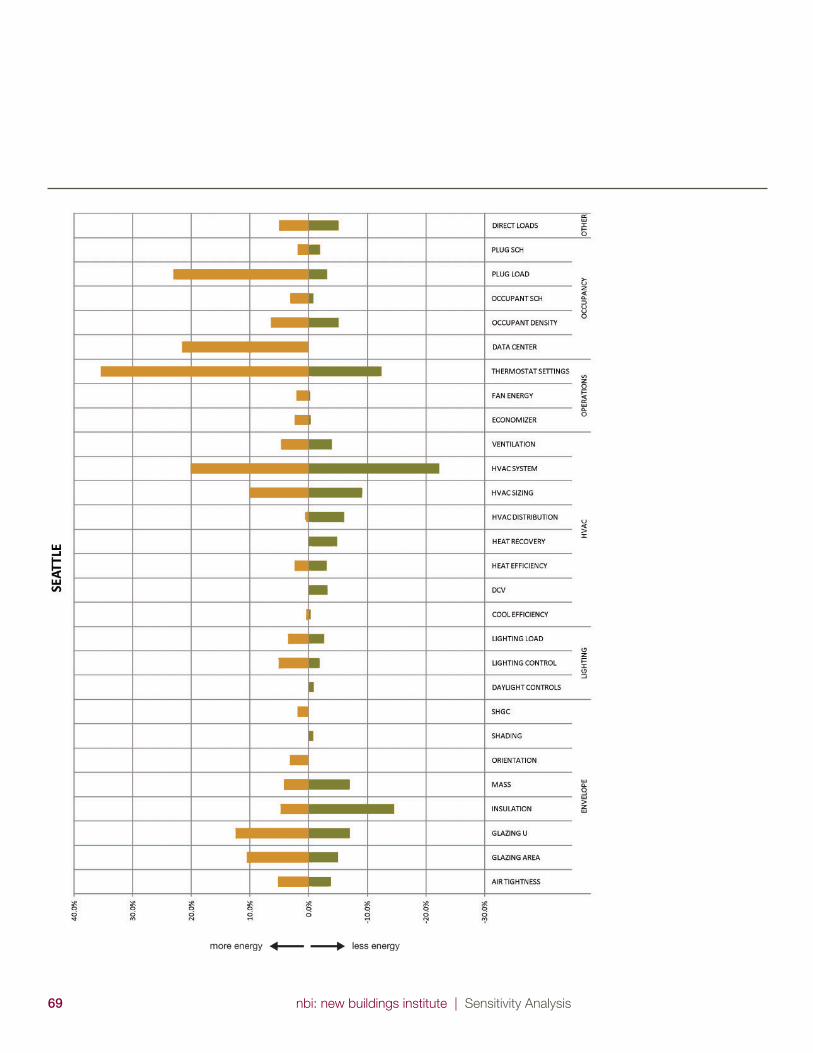
nbi: new buildings institute | Sensitivity Analysis69
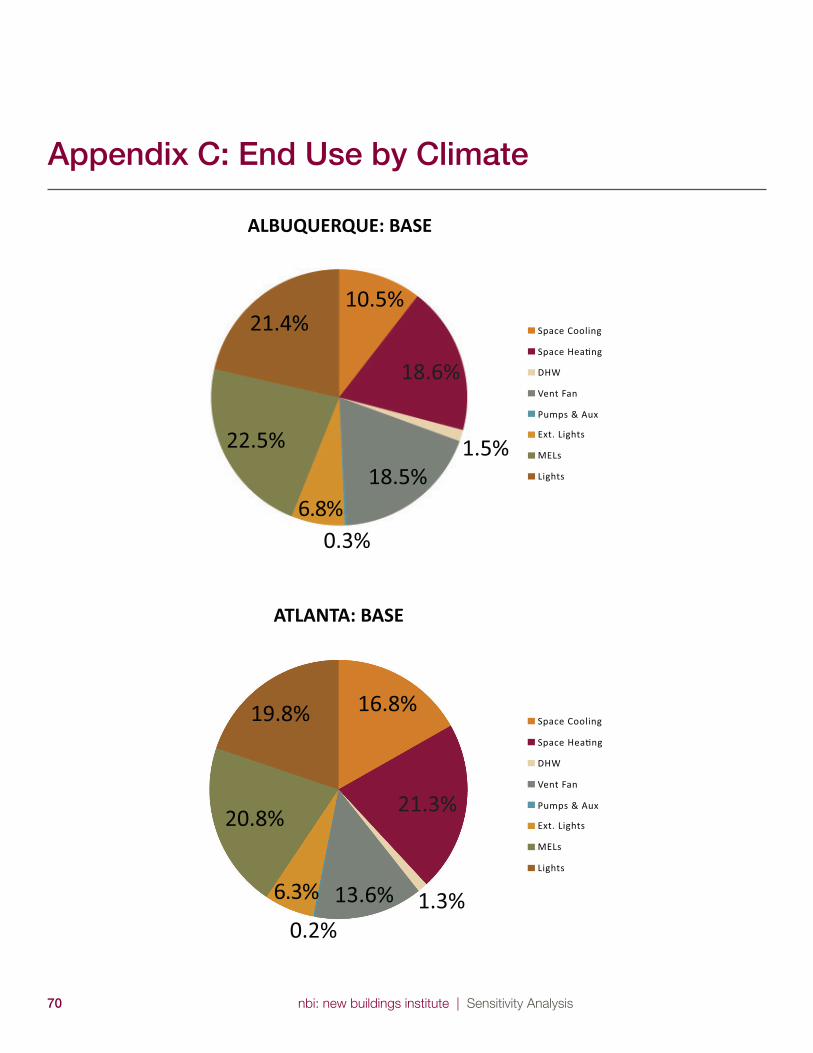
70 nbi: new buildings institute | Sensitivity Analysis
Appendix C: End Use by Climate
ATLANTA: BASE
16.8%19.8%
20.8%
6.3%
0.2%13.6% 1.3%
21.3%
Space Cooling
Space Hea�ng
DHW
Vent Fan
Pumps & Aux
Ext. Lights
MELs
Lights
ALBUQUERQUE: BASE
10.5%21.4%
22.5%
6.8%0.3%
18.5%
18.6%
1.5%
Space Cooling
Space Hea�ng
DHW
Vent Fan
Pumps & Aux
Ext. Lights
MELs
Lights
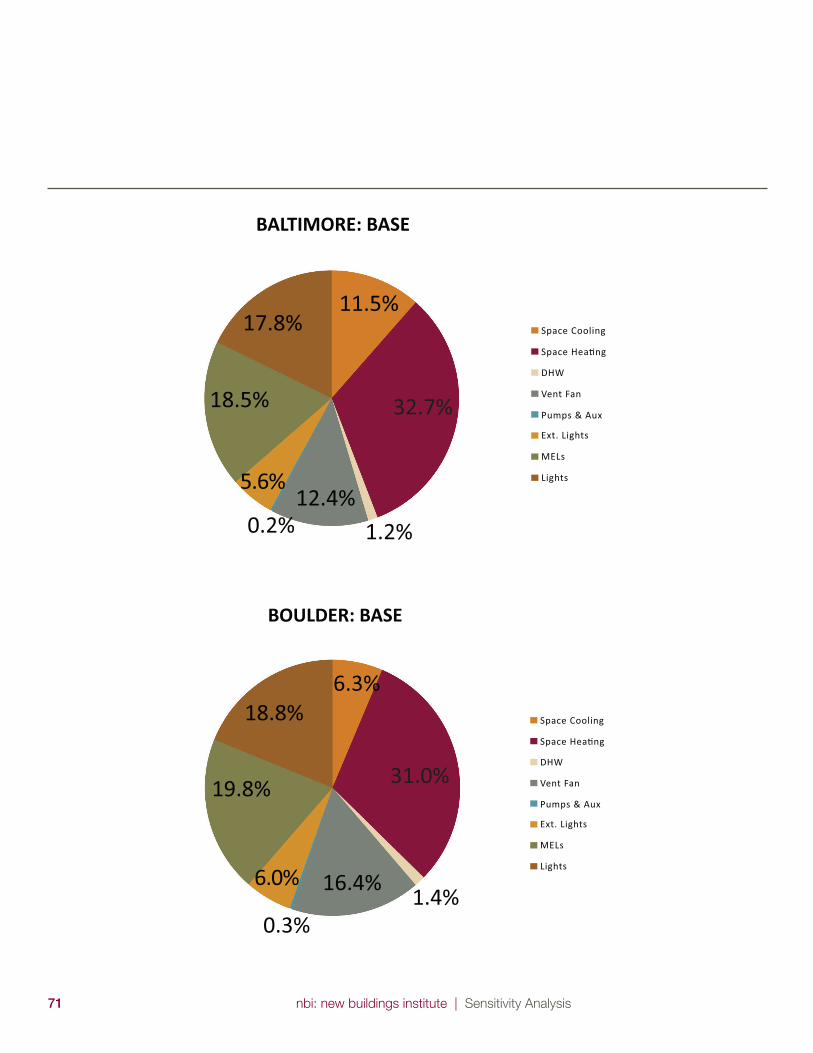
nbi: new buildings institute | Sensitivity Analysis71
BALTIMORE: BASE
11.5%17.8%
18.5%
5.6%
0.2%12.4%
32.7%
1.2%
Space Cooling
Space Hea�ng
DHW
Vent Fan
Pumps & Aux
Ext. Lights
MELs
Lights
BOULDER: BASE
6.3%18.8%
19.8%
6.0%
0.3%
16.4%
31.0%
1.4%
Space Cooling
Space Hea�ng
DHW
Vent Fan
Pumps & Aux
Ext. Lights
MELs
Lights
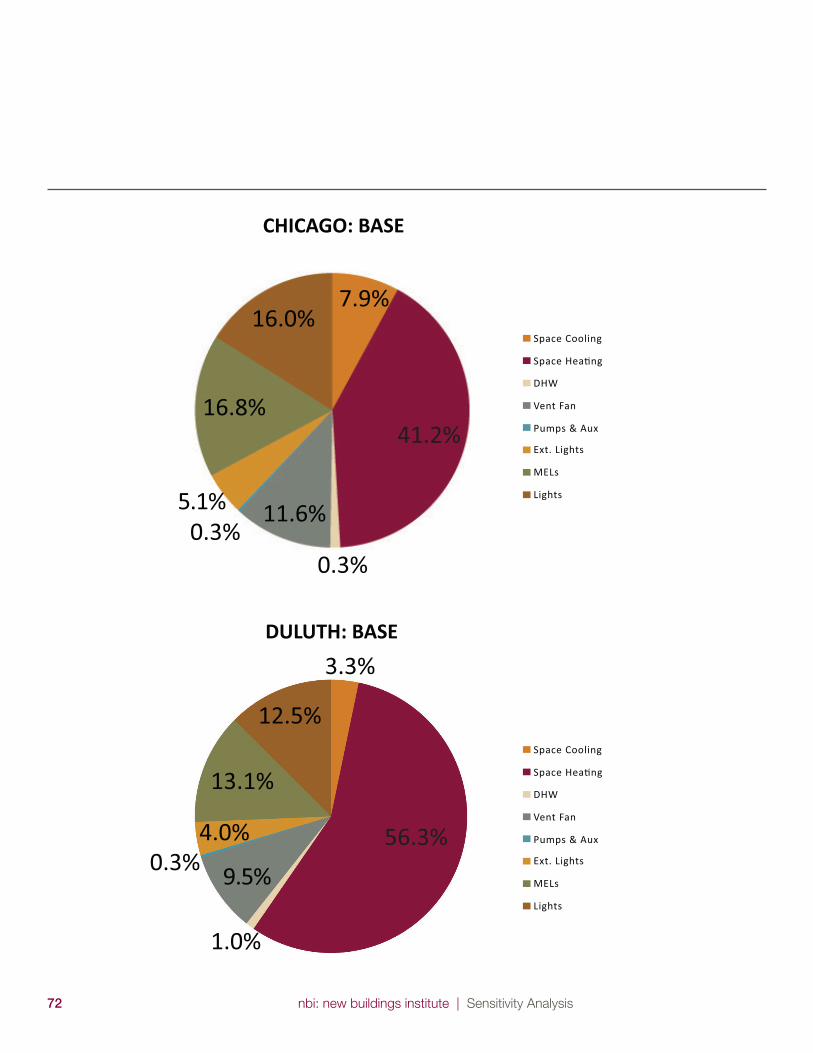
72 nbi: new buildings institute | Sensitivity Analysis
CHICAGO: BASE
7.9%16.0%
16.8%
5.1%
0.3%
11.6%0.3%
41.2%
Space Cooling
Space Hea�ng
DHW
Vent Fan
Pumps & Aux
Ext. Lights
MELs
Lights
Space Cooling
Space Hea�ng
DHW
Vent Fan
Pumps & Aux
Ext. Lights
MELs
Lights
DULUTH: BASE
3.3%
12.5%
13.1%
4.0%
9.5%0.3%56.3%
1.0%
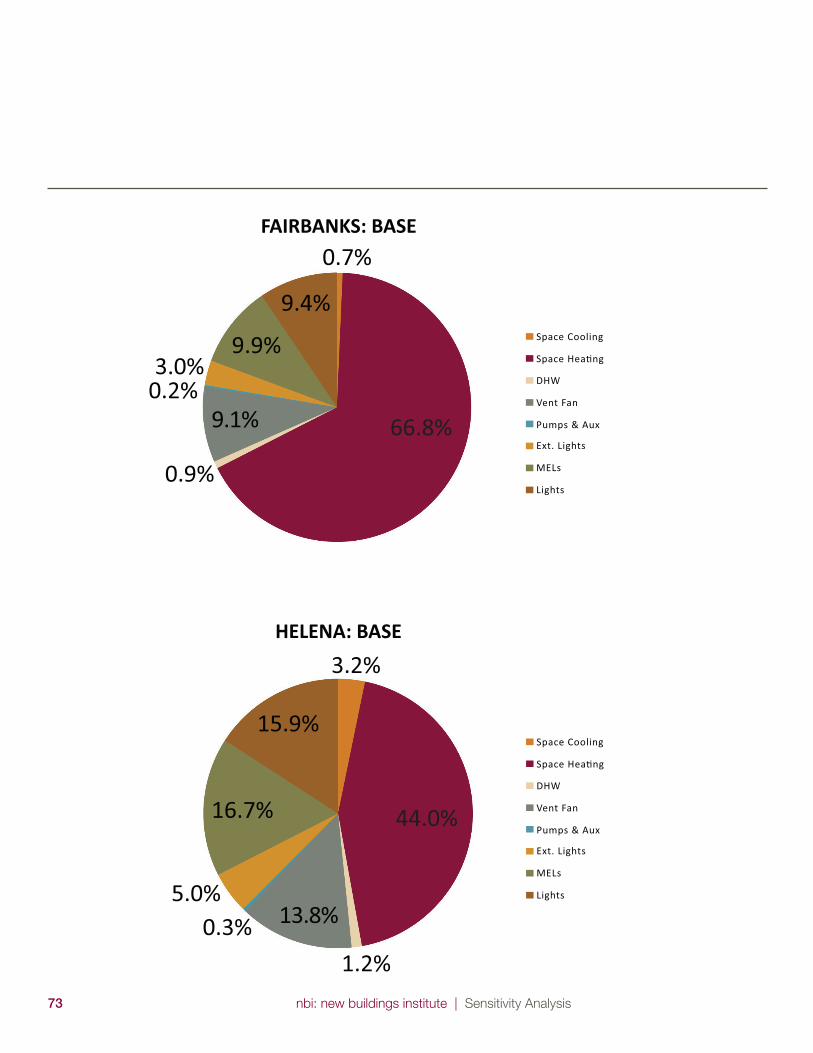
nbi: new buildings institute | Sensitivity Analysis73
FAIRBANKS: BASE0.7%
9.4%
9.9%3.0%
9.1%0.2%
66.8%
0.9%
Space Cooling
Space Hea�ng
DHW
Vent Fan
Pumps & Aux
Ext. Lights
MELs
Lights
HELENA: BASE
3.2%
15.9%
16.7%
5.0%13.8%0.3%
44.0%
1.2%
Space Cooling
Space Hea�ng
DHW
Vent Fan
Pumps & Aux
Ext. Lights
MELs
Lights
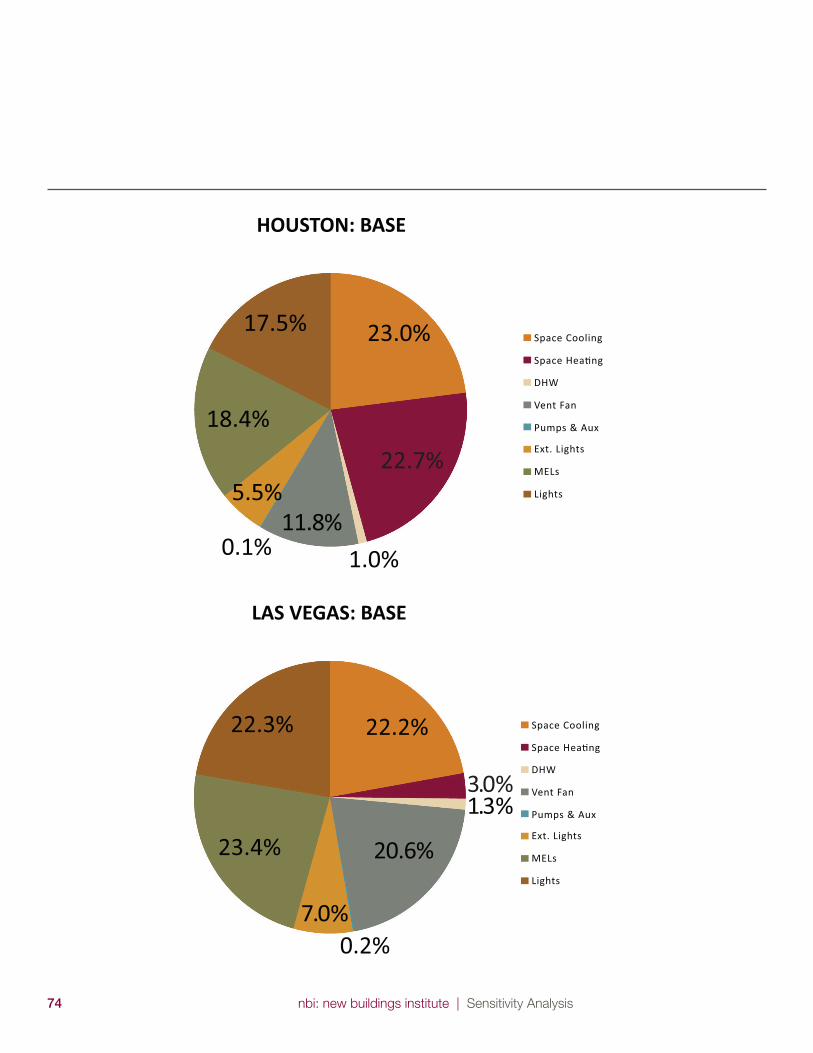
74 nbi: new buildings institute | Sensitivity Analysis
HOUSTON: BASE
23.0%17.5%
18.4%
5.5%11.8%
0.1%
22.7%
1.0%
Space Cooling
Space Hea�ng
DHW
Vent Fan
Pumps & Aux
Ext. Lights
MELs
Lights
LAS VEGAS: BASE
22.2%22.3%
23.4%
7.0%
20.6%
0.2%
3.0%1.3%
Space Cooling
Space Hea�ng
DHW
Vent Fan
Pumps & Aux
Ext. Lights
MELs
Lights
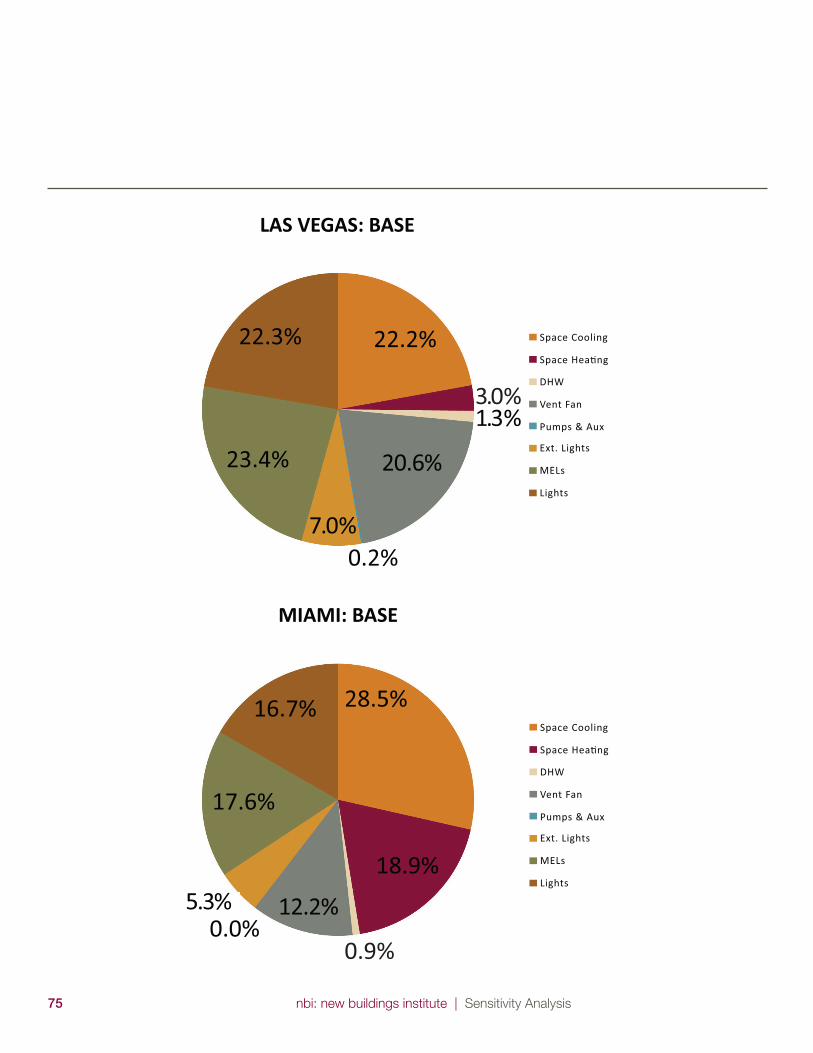
nbi: new buildings institute | Sensitivity Analysis75
LAS VEGAS: BASE
22.2%22.3%
23.4%
7.0%
20.6%
0.2%
3.0%1.3%
Space Cooling
Space Hea�ng
DHW
Vent Fan
Pumps & Aux
Ext. Lights
MELs
Lights
MIAMI: BASE
28.5%16.7%
17.6%
5.3% 12.2%0.0%
0.9%
18.9%
Space Cooling
Space Hea�ng
DHW
Vent Fan
Pumps & Aux
Ext. Lights
MELs
Lights
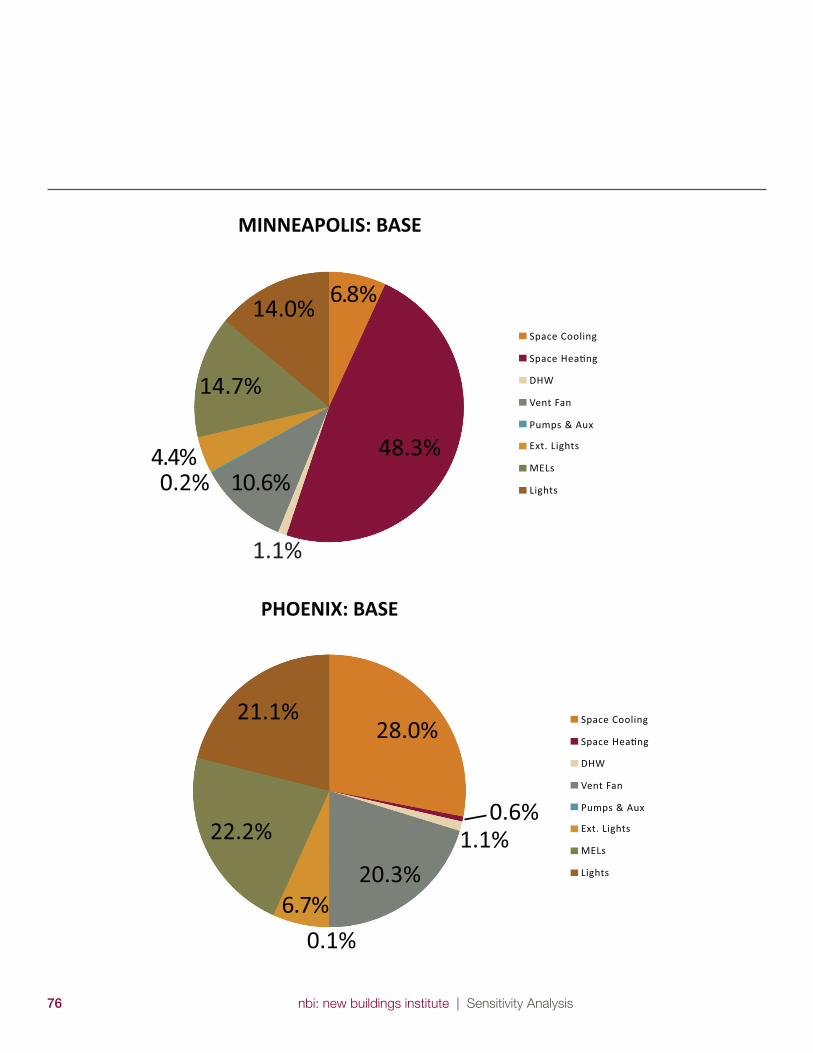
76 nbi: new buildings institute | Sensitivity Analysis
PHOENIX: BASE
28.0%21.1%
22.2%
6.7%0.1%
20.3%1.1%
0.6%
Space Cooling
Space Hea�ng
DHW
Vent Fan
Pumps & Aux
Ext. Lights
MELs
Lights
MINNEAPOLIS: BASE
6.8%14.0%
14.7%
4.4%10.6%0.2%
1.1%
48.3%
Space Cooling
Space Hea�ng
DHW
Vent Fan
Pumps & Aux
Ext. Lights
MELs
Lights
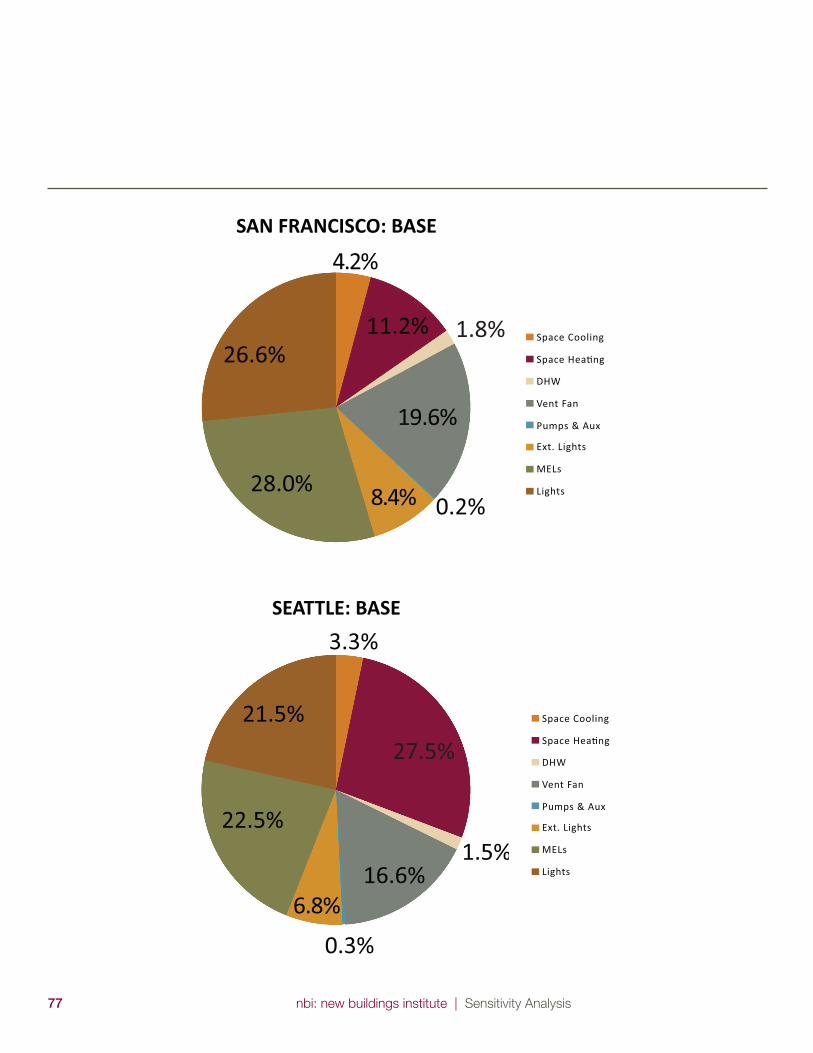
nbi: new buildings institute | Sensitivity Analysis77
SEATTLE: BASE
3.3%
21.5%
22.5%
6.8%
0.3%
16.6%
27.5%
1.5%
Space Cooling
Space Hea�ng
DHW
Vent Fan
Pumps & Aux
Ext. Lights
MELs
Lights
SAN FRANCISCO: BASE
4.2%
26.6%
28.0% 8.4%
19.6%
0.2%
1.8%11.2%Space Cooling
Space Hea�ng
DHW
Vent Fan
Pumps & Aux
Ext. Lights
MELs
Lights
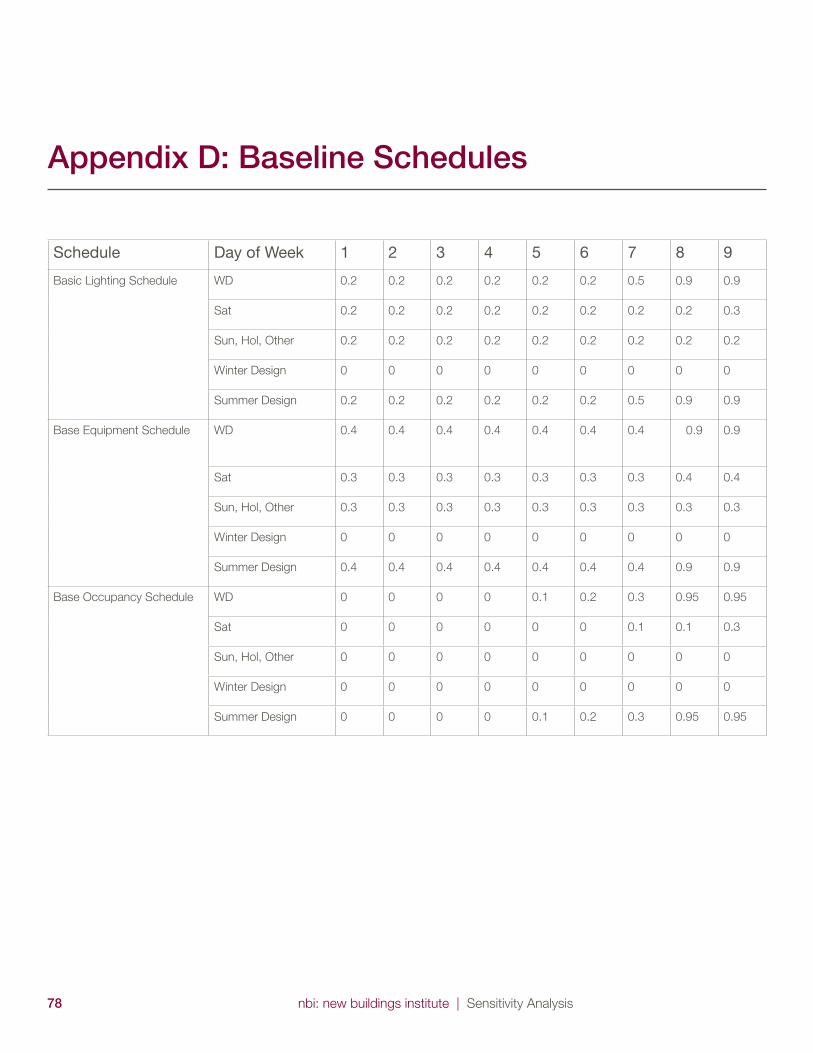
78 nbi: new buildings institute | Sensitivity Analysis
Appendix D: Baseline Schedules
Schedule Day of Week 1 2 3 4 5 6 7 8 9
Basic Lighting Schedule WD 0.2 0.2 0.2 0.2 0.2 0.2 0.5 0.9 0.9
Sat 0.2 0.2 0.2 0.2 0.2 0.2 0.2 0.2 0.3
Sun, Hol, Other 0.2 0.2 0.2 0.2 0.2 0.2 0.2 0.2 0.2
Winter Design 0 0 0 0 0 0 0 0 0
Summer Design 0.2 0.2 0.2 0.2 0.2 0.2 0.5 0.9 0.9
Base Equipment Schedule WD 0.4 0.4 0.4 0.4 0.4 0.4 0.4 0.9 0.9
Sat 0.3 0.3 0.3 0.3 0.3 0.3 0.3 0.4 0.4
Sun, Hol, Other 0.3 0.3 0.3 0.3 0.3 0.3 0.3 0.3 0.3
Winter Design 0 0 0 0 0 0 0 0 0
Summer Design 0.4 0.4 0.4 0.4 0.4 0.4 0.4 0.9 0.9
Base Occupancy Schedule WD 0 0 0 0 0.1 0.2 0.3 0.95 0.95
Sat 0 0 0 0 0 0 0.1 0.1 0.3
Sun, Hol, Other 0 0 0 0 0 0 0 0 0
Winter Design 0 0 0 0 0 0 0 0 0
Summer Design 0 0 0 0 0.1 0.2 0.3 0.95 0.95
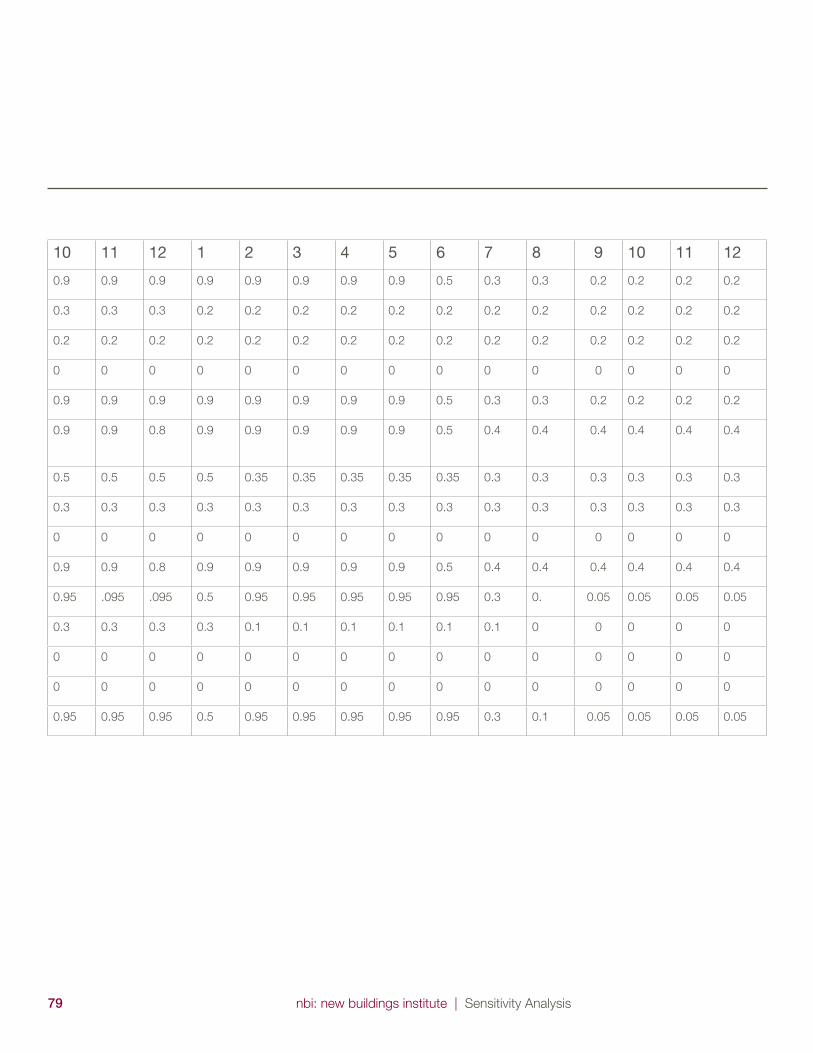
nbi: new buildings institute | Sensitivity Analysis79
10 11 12 1 2 3 4 5 6 7 8 9 10 11 12
0.9 0.9 0.9 0.9 0.9 0.9 0.9 0.9 0.5 0.3 0.3 0.2 0.2 0.2 0.2
0.3 0.3 0.3 0.2 0.2 0.2 0.2 0.2 0.2 0.2 0.2 0.2 0.2 0.2 0.2
0.2 0.2 0.2 0.2 0.2 0.2 0.2 0.2 0.2 0.2 0.2 0.2 0.2 0.2 0.2
0 0 0 0 0 0 0 0 0 0 0 0 0 0 0
0.9 0.9 0.9 0.9 0.9 0.9 0.9 0.9 0.5 0.3 0.3 0.2 0.2 0.2 0.2
0.9 0.9 0.8 0.9 0.9 0.9 0.9 0.9 0.5 0.4 0.4 0.4 0.4 0.4 0.4
0.5 0.5 0.5 0.5 0.35 0.35 0.35 0.35 0.35 0.3 0.3 0.3 0.3 0.3 0.3
0.3 0.3 0.3 0.3 0.3 0.3 0.3 0.3 0.3 0.3 0.3 0.3 0.3 0.3 0.3
0 0 0 0 0 0 0 0 0 0 0 0 0 0 0
0.9 0.9 0.8 0.9 0.9 0.9 0.9 0.9 0.5 0.4 0.4 0.4 0.4 0.4 0.4
0.95 .095 .095 0.5 0.95 0.95 0.95 0.95 0.95 0.3 0. 0.05 0.05 0.05 0.05
0.3 0.3 0.3 0.3 0.1 0.1 0.1 0.1 0.1 0.1 0 0 0 0 0
0 0 0 0 0 0 0 0 0 0 0 0 0 0 0
0 0 0 0 0 0 0 0 0 0 0 0 0 0 0
0.95 0.95 0.95 0.5 0.95 0.95 0.95 0.95 0.95 0.3 0.1 0.05 0.05 0.05 0.05