![Journal of Remote Sensing & GIS · eophys Remote Sensing SSN: 219-0049 RS an open access journal based mapping methods [16]. Remote sensing and Geographic Information System is a](https://static.fdocuments.us/doc/165x107/5f56ace5ac756d0606266296/journal-of-remote-sensing-gis-eophys-remote-sensing-ssn-219-0049-rs-an-open.jpg)
Sensing International Journal of Remote
20
This article was downloaded by: [University of Leeds] On: 09 January 2012, At: 14:39 Publisher: Taylor & Francis Informa Ltd Registered in England and Wales Registered Number: 1072954 Registered office: Mortimer House, 37-41 Mortimer Street, London W1T 3JH, UK International Journal of Remote Sensing Publication details, including instructions for authors and subscription information: http://www.tandfonline.com/loi/tres20 A multilevel decision fusion approach for urban mapping using very high- resolution multi/hyperspectral imagery Xin Huang a & Liangpei Zhang a a State Key Laboratory of Information Engineering in Surveying, Mapping and Remote Sensing, Wuhan University, Wuhan, Hubei, 430079, PR China Available online: 21 Nov 2011 To cite this article: Xin Huang & Liangpei Zhang (2012): A multilevel decision fusion approach for urban mapping using very high-resolution multi/hyperspectral imagery, International Journal of Remote Sensing, 33:11, 3354-3372 To link to this article: http://dx.doi.org/10.1080/01431161.2011.591444 PLEASE SCROLL DOWN FOR ARTICLE Full terms and conditions of use: http://www.tandfonline.com/page/terms-and- conditions This article may be used for research, teaching, and private study purposes. Any substantial or systematic reproduction, redistribution, reselling, loan, sub-licensing, systematic supply, or distribution in any form to anyone is expressly forbidden. The publisher does not give any warranty express or implied or make any representation that the contents will be complete or accurate or up to date. The accuracy of any instructions, formulae, and drug doses should be independently verified with primary sources. The publisher shall not be liable for any loss, actions, claims, proceedings, demand, or costs or damages whatsoever or howsoever caused arising directly or indirectly in connection with or arising out of the use of this material.
Transcript of Sensing International Journal of Remote

This article was downloaded by: [University of Leeds]On: 09 January 2012, At: 14:39Publisher: Taylor & FrancisInforma Ltd Registered in England and Wales Registered Number: 1072954 Registeredoffice: Mortimer House, 37-41 Mortimer Street, London W1T 3JH, UK
International Journal of RemoteSensingPublication details, including instructions for authors andsubscription information:http://www.tandfonline.com/loi/tres20
A multilevel decision fusion approachfor urban mapping using very high-resolution multi/hyperspectral imageryXin Huang a & Liangpei Zhang aa State Key Laboratory of Information Engineering in Surveying,Mapping and Remote Sensing, Wuhan University, Wuhan, Hubei,430079, PR China
Available online: 21 Nov 2011
To cite this article: Xin Huang & Liangpei Zhang (2012): A multilevel decision fusion approach forurban mapping using very high-resolution multi/hyperspectral imagery, International Journal ofRemote Sensing, 33:11, 3354-3372
To link to this article: http://dx.doi.org/10.1080/01431161.2011.591444
PLEASE SCROLL DOWN FOR ARTICLE
Full terms and conditions of use: http://www.tandfonline.com/page/terms-and-conditions
This article may be used for research, teaching, and private study purposes. Anysubstantial or systematic reproduction, redistribution, reselling, loan, sub-licensing,systematic supply, or distribution in any form to anyone is expressly forbidden.
The publisher does not give any warranty express or implied or make any representationthat the contents will be complete or accurate or up to date. The accuracy of anyinstructions, formulae, and drug doses should be independently verified with primarysources. The publisher shall not be liable for any loss, actions, claims, proceedings,demand, or costs or damages whatsoever or howsoever caused arising directly orindirectly in connection with or arising out of the use of this material.

International Journal of Remote SensingVol. 33, No. 11, 10 June 2012, 3354–3372
A multilevel decision fusion approach for urban mapping using veryhigh-resolution multi/hyperspectral imagery
XIN HUANG* and LIANGPEI ZHANGState Key Laboratory of Information Engineering in Surveying, Mapping and Remote
Sensing, Wuhan University, Wuhan, Hubei 430079, PR China
(Received 4 June 2010; in final form 23 April 2011)
A novel multilevel decision fusion approach is proposed for urban mapping usingvery-high-resolution (VHR) multi/hyperspectral imagery. The proposed frame-work consists of three levels: (1) at level I, we first propose a self-dual filter forextracting structural features from the VHR imagery–subsequently, the spectraland structural features are integrated based on a weighted probability fusion;(2) level II extends level I by implementing the spectral–structural fusion in anobject-based framework; and (3) at level III, the object-based probabilistic out-puts at level II are used to identify unreliable objects, and shape attributes ofthese unreliable objects are then considered for refinement of classification. At thislevel, a decision-level object merging is used to improve the initial segmentation,since shape feature extraction is highly dependent on the quality of segmenta-tion. Experiments were conducted on a Hyperspectral Digital Imagery CollectionExperiment (HYDICE) DC Mall image and a QuickBird Beijing data set. Theresults revealed that the proposed approach provided progressively increasing accu-racies when the multilevel features were gradually considered in the processingchain.
1. Introduction
With the increasing availability of very high-resolution (VHR) remotely sensed images,we can acquire a large amount of detailed ground information, for which there isthe potential for many new remote-sensing applications in urban monitoring, humanactivity impact, precision agriculture and so on. Nevertheless, detailed structures areadequately presented in VHR images, resulting in the fact that the same classes havedifferent spectral properties and different classes show similar spectral reflectance.Consequently, the increase of within-class variance and decrease of interclass vari-ance lead to the inadequacy of traditional spectral-based and pixel-based classificationapproaches.
Consequently, in recent years, researchers have proposed different algorithms toimprove the conventional classification approaches, which can be summarized intothe following two categories.
1. Exploitation of textural and spatial features. The basic idea of this approachis to extract textural, structural or contextual features from VHR images for
*Corresponding author. Email: [email protected]
International Journal of Remote SensingISSN 0143-1161 print/ISSN 1366-5901 online © 2012 Taylor & Francis
http://www.tandf.co.uk/journalshttp://dx.doi.org/10.1080/01431161.2011.591444
Dow
nloa
ded
by [
Uni
vers
ity o
f L
eeds
] at
14:
39 0
9 Ja
nuar
y 20
12

A multilevel decision fusion approach for VHR urban mapping 3355
complementing the spectral information and hence discriminating spectrallysimilar classes. The grey level co-occurrence matrix (GLCM) is a widely usedtextural measure. Puissant et al. (2005) examined the potential of GLCM tex-tural features combined with spectral information to improve the classificationaccuracy of intra-urban land cover types. Due to the fact that the analysiswindow size of GLCM is difficult to determine for different image scenes,Huang et al. (2007b) proposed an adaptive algorithm for optimal windowselection by considering the edge density within an analysis window. Morerecently, Pacifici et al. (2009) extracted the GLCM textures based on a series ofdirections and displacement values with multiple window sizes. The resultanthigh-dimensional features were then selected using a neural network pruningand saliency measurements.
Another effective textural measure refers to the wavelet transform. It is ableto represent either micro-texture using wavelet decomposition of local win-dows or macro-texture based on the stationary wavelet transform performedon the whole image. Shah et al. (2010) presented a new feature set by combin-ing the independent component analysis (ICA) and wavelet transformation forimage information mining in geospatial data. Ouma et al. (2006) extracted mul-tiscale features based on vertical, horizontal and diagonal wavelet sub-bandsof multiple decomposition levels. The resultant textures were used to delineateurban trees of QuickBird images. Another study by Ouma et al. (2008) inte-grated the GLCM and wavelet textures for discrimination between differentvegetation types. The wavelet textures were also utilized for classification ofVHR urban images. Myint et al. (2004) compared different spatial measuresfor urban feature discrimination, and it was revealed that the wavelet texturesgave the highest accuracies in comparison with GLCM, spatial autocorrelationand fractal features. Huang et al. (2008) proposed a wavelet-based multiscaleclassification method, where the wavelet decomposition was used to extract themultiscale spatial information in a series of concentric windows.
In comparison with the aforementioned textural measures, structural fea-tures have been found to be more effective for VHR imagery since they are ableto describe shape and geometrical characters. Huang et al. (2007a) proposeda structural feature set based on the spectral coherence of groups of pix-els along selected directions. Benediktsson et al. (2003) presented differentialmorphological profiles (DMPs) based on opening/closing-by-reconstructionwith increasing sizes of structural elements (SEs). Subsequently, the DMPswere extended to the extended morphological profiles (EMPs) by construct-ing the morphological features based on the principal components of urbanhyperspectral images (Benediktsson et al. 2005). More recently, Fauvel et al.(2008) improved the EMP approach by considering both spectral–structuralfeatures and building the profiles on kernel principal components (Fauvel etal. 2009). Other notable improvements to DMPs referred to the fuzzy model(Chanussot et al. 2006) and partial morphological reconstruction (Bellenset al. 2008).
2. Object-based analysis. The basic idea of the object-oriented classification is togroup the spatially adjacent pixels into spectrally homogeneous objects andthen conduct classification on objects as the minimum processing unit. Theadvantages of object-based processing include its ability to reduce local spec-tral variation, avoid salt–pepper effects of the pixel-based classification, mimichuman perception in identifying objects and generate geometrical attributes.
Dow
nloa
ded
by [
Uni
vers
ity o
f L
eeds
] at
14:
39 0
9 Ja
nuar
y 20
12

3356 X. Huang and L. Zhang
Therefore, object-based image analysis has received much attention, especiallyfor VHR image processing and applications.
Most of the existing object-oriented algorithms are based on the well-knowneCognition commercial software (Trimble Company, Sunnyvale, CA, USA)and the embedded fractal net evolution approach (FNEA) (Benz et al. 2004).Yu et al. (2006) calculated the object-based spectral, textural and geometric fea-tures using eCognition software for detailed vegetation mapping. The resultanthyperdimensional features were statistically ranked according to importanceand then classified using a classification and regression tree algorithm (CART).Chubey et al. (2006) utilized object-based segmentation to delineate homoge-neous landscape components from IKONOS-2 data. Van Coillie et al. (2007)combined object-based features and genetic algorithm-based feature selectionfor forest mapping with IKONOS imagery. Zhou et al. (2009) evaluated theeffectiveness of the object-based approach for classification of shaded areas inurban VHR images. In addition to the FNEA algorithm, researchers have pre-sented other segmentation methods for object extraction from VHR images,such as the adaptive mean shift procedure (Huang and Zhang 2008), whichis an unsupervised feature space clustering algorithm, watershed segmentation(Li and Xiao 2007) and the J-measure-based segmentation (Wang and Boesch2007).
In this article, a multilevel classification system is proposed by integrating thepixel-based structural features and the object-based shape features based on a noveldecision-level probability fusion approach. The proposed system is able to yield multi-level outputs as the processing unit is updated progressively from the pixel level to theobject level, and additional features are gradually considered in the decision process.
2. Methodology
The proposed multilevel processing chain is shown in figure 1.
1. At level I, a structural spectrum is proposed to represent the multiscaleand multidirectional features based on the morphological transformation.Subsequently, the multispectral and the structural features are separately fedinto two support vector machines (SVMs), respectively termed the spectralSVM and structural SVM. The spectral–structural decision fusion is car-ried out by taking the weighted probabilistic outputs of the two SVMs intoconsideration.
2. At level II, a mean shift segmentation is used to extract object boundaries. Theobject-based decision fusion is implemented by considering the probabilisticoutputs of level I within the boundary of each object.
3. Level III focuses on the unreliable objects that have low probabilistic outputs atlevel II. A decision-level object merging is used to refine the initial segmentationof level II. Subsequently, shape attributes extracted from the refined boundariesare used to reclassify the unreliable objects. At this level, only the unreliableobjects are of interest because shape features are not necessarily effective ininterpreting all the objects.
2.1 Morphological structural spectrum
Mathematical morphology is an effective tool for extracting image components thatare useful in the representation of structural features. Morphological features are
Dow
nloa
ded
by [
Uni
vers
ity o
f L
eeds
] at
14:
39 0
9 Ja
nuar
y 20
12

A multilevel decision fusion approach for VHR urban mapping 3357
Mean shiftsegmentation
Multi/Hyper-spectral VHR data
Subspace
Base images
Structuralspectrum
Structural SVMSpectral SVM
Spectral–structuraldecision fusion (Level I)
Pixel mode Structural mode Object mode
Spectralbands
Object-Baseddecision fusion (Level II)
Postprocessing(Level III)
Information extraction
Boundary
Shape
Figure 1. Flowchart of the multilevel decision fusion approach. VHR, very high resolution;SVM, support vector machine.
based on some basic operators, such as opening (γ ) and closing (φ), used to removesmall bright (opening) or dark (closing) details while leaving the overall features rel-atively undisturbed. The morphological reconstruction is usually jointly used withthe opening and closing, that is, opening-by-reconstruction (γ R) and closing-by-reconstruction (φR), since this family of filters has proved to have better shapepreservation than classical morphological operators (Soille and Pesaresi 2002). Theseoperators are applied to an image with a set of a known shape, namely a SE. In thisstudy, the morphological transformation is used to construct the structural spectrumwith a series of multiscale and multidirectional SEs. The proposed structural spectrumconsists of the morphological centre transformation and the morphological profiles(MPs) that are described in the following steps.
Step 1 A pair of opening–closing dual filters, for example, opening followedby closing (OFC) and closing followed by opening (CFO), are used in this studyconsidering that they act simultaneously on the bright and dark structures:
OFCR = φRγR, (1)
CFOR = γ RφR, (2)
Dow
nloa
ded
by [
Uni
vers
ity o
f L
eeds
] at
14:
39 0
9 Ja
nuar
y 20
12
3358 X. Huang and L. Zhang
where the OFC and CFO filters are implemented with the reconstruction form.
Step 2 The linear SE is used in this study because it contains information about themaximum object dimensions, and it is able to represent multidirectional characteristicsof structures in the VHR imagery. Hence, equations (1) and (2) can be extended to
OFCR(d, s) = φR(d, s) γR(d, s), (3)
CFOR(d, s) = γR(d, s) φR(d, s), (4)
where d and s indicate the direction and size of a linear SE, respectively.
Step 3 The OFC and CFO filters process bright and dark structures much moreequally; however, they are not self-dual because their results depend on the sequenceof opening and closing. Hence, we propose to construct their self-dual filter based onthe morphological centre transformation:
fmc(d, s) = ζ 〈OFCR(d, s), CFOR(d, s)〉 , (5)
where the function ζ 〈·〉 stands for the morphological centre transformation. The self-dual filters are of interest because they are able to avoid dependence with regard to thelocal contrast of image structures (Soille and Pesaresi 2002) and preserve the shape ofstructures while simplifying them. Readers can refer to Soille and Pesaresi (2002) fora detailed description about the morphological centre.
Step 4 MPs are defined as a series of feature images with varying parameters ofSEs (e.g. sizes and directions). DMPs are defined as vectors where the measures of theslopes of the MPs are stored for every step of an increasing SE series (Benediktssonet al. 2003). In this study, the DMPs are built on the morphological centre filter withmultiscale and multidirectional SEs:
DMP = {∣∣fmc(d, s) − fmc(d, s − �s)∣∣ , s ∈ [m, n], d ∈ D
}, (6)
where D is the set of directions: D = (45◦, 90◦, 135◦, 180◦), and m, n and �s representthe minimum, maximum and interval values for the lengths of the linear SE.
The application of the DMPs to the multi/hyperspectral images is conducted on aseries of dimensionally reduced components (e.g. the principal component analysis),namely base images. Under this circumstance, the DMPs are converted to the EMPs(Benediktsson et al. 2005):
EMP = {dist
(fmc(d, s), fmc(d, s − �s)
), s ∈ [m, n], d ∈ D
}
with fmc(d, s) =(
f bmc(d, s)
)B
b=1,
(7)
where f bmc(d, s) stands for the morphological centre filter of band b; dist(·) represents
the distance (Euclidean distance in this study) between two vectors; and B is thenumber of spectral bands.
An example of the morphological centre transformation is shown in figure 2.Figure 2(a) is the original image, and figures 2(b) and (c) are the OFC and CFO fea-ture images, respectively. Figures 2(d) shows the morphological centre of figure 2(b)
Dow
nloa
ded
by [
Uni
vers
ity o
f L
eeds
] at
14:
39 0
9 Ja
nuar
y 20
12

A multilevel decision fusion approach for VHR urban mapping 3359
(a) (b)
(c) (d)
Figure 2. Demonstration of the morphological centre filter: (a) the original sample image, (b)OFCR(d = 45, s = 15), (c) CFOR(d = 45, s = 15) and (d) fmc(d = 45, s = 15).
and (c). Comparing figure 2(b) with figure 2(c), it follows that their processing dependson whether one starts the filter with an opening or a closing. From figure 2(d), it canbe seen that the morphological centre of the dual filters is able to effectively preservethe shape of structures when simplifying them (as highlighted in the two rectangularregions).
The radiance spectra and the structural spectra for some spectrally similar classes(e.g. water–shadows, grass–trees, trails–roofs–roads) in the Hyperspectral DigitalImagery Collection Experiment (HYDICE) data set are compared in figure 3. Thex-axes of the radiance spectra and the structural spectra represent the dimensionalityof the spectral and structural channels, respectively. Their y-axes represent the digitalnumber (DN) value and feature value of the spectral and structural channels, respec-tively. From the figure, it can be found that in the VHR image, the spectral informationalone is not adequate for discriminating the objects with similar spectral reflectancein spite of the availability of hundreds of channels. Nevertheless, it can be seen thatthe structural spectra has the potential to distinguish these spectrally similar classes,because it takes into account multiscale and multidirectional features with a series ofanisotropic SEs.
Dow
nloa
ded
by [
Uni
vers
ity o
f L
eeds
] at
14:
39 0
9 Ja
nuar
y 20
12

3360 X. Huang and L. Zhang
80 (a)
60
40
DN
val
ue
20
50 100Band number
150
(c)D
N v
alue
200
150
100
50
50 100Band number
150
(e)
DN
val
ue
200
150
100
50
50 100Band number
150
(b)WaterShadw
40
30
20
10
01 5 9 13
Scale-direction number17 21
Feat
ure
valu
e
(d)40
50
30
20
10
Road9TrailsRoofs
1 5 9 13Scale-direction number
17 21
Feat
ure
valu
e
(f)GrassTrees
1 5 9 13Scale-direction number
17 21
30
20
10
Feat
ure
valu
e
Figure 3. Comparison of the radiance spectra and the structural spectra for spectrally simi-lar classes in the Hyperspectral Digital Imagery Collection Experiment (HYDICE) DC Malldata set: (a), (c) and (e) show the hyperspectra of water–shadow, roads–trails–roofs and grass–trees, respectively; (b), (d) and (f ) show their structural spectra, respectively. DN, digitalnumber.
2.2 Pixel-level decision fusion (level I)
A decision fusion scheme is proposed to integrate the spectral and structural informa-tion based on probabilistic outputs of classifiers. The spectral and structural featuresare separately interpreted in two SVMs, termed the spectral SVM and structural SVM.Afterwards, a weighted fusion algorithm is used for classification of each pixel. SVMis of interest due to its swift learning pace and adaptability to the high-dimensionalfeature space. Moreover, it is not constrained to prior assumptions on the distribu-tion of input data and is hence well suited for interpretation of complex features, suchas spectral–spatial joint classification (Huang et al. 2007a), object-based classifica-tion (Huang et al. 2008) and hyperdimensional stacking (Bruzzone and Carlin 2006).Most of the existing applications for the SVM refer to a crisp output that only pre-dicts a class label. However, in this study, the probabilistic outputs of spectral SVMand structural SVM are exploited for integrating the spectral and structural decisioninformation. The algorithm consists of two steps.
Dow
nloa
ded
by [
Uni
vers
ity o
f L
eeds
] at
14:
39 0
9 Ja
nuar
y 20
12

A multilevel decision fusion approach for VHR urban mapping 3361
Step 1 The spectral and structural features are separately fed into two SVMs. TheSVM probabilistic output is estimated by combining the pairwise class probabilities(Wu et al. 2004). We assume pspe(c |x ) and lspe(x) as the probabilistic output (soft)and the classification prediction (crisp) of the spectral SVM, respectively. Similarly,pstr(c |x ) and lstr(x) are the probability and the classification label of the structuralSVM, respectively. The relationship between the probabilistic output and the classlabel for pixel x can be expressed as
lspe(x) = arg maxc∈1,2,...,C
(pspe(c |x )
), (8)
lstr(x) = arg maxc∈1,2,...,C
(pstr(c |x )) , (9)
where c stands for an information class.
Step 2 The spectral–structural decision rule is defined as
l(x) = arg maxc∈1,2,...,C
(p(c |x )) , (10)
with
p(c |x ) = wspe(c) pspe(c |x ) + wstr(c) pstr(c |x )wspe(c) + wstr(c)
, (11)
where w(c) is the weight of the spectral (or structural) probability, and it is defined asthe F-measure of the producer’s and user’s accuracies (Shah et al. 2010):
w(c) = 2 Ap(c) Au(c)
Ap(c) + Au(c), (12)
where Ap(c) and Au(c) are the producer’s and user’s accuracies of class c, respec-tively. In this article, the reference samples are divided into three parts: training,validation and test samples. The training and test samples are used for training andevaluation of classification, while the validation samples are used for calculationof w(c).
Equation (10) is actually a pixel-level classification combining the decision informa-tion of both spectral SVM and structural SVM. It should be noted that equation (10)refers to a crisp classification result of the spectral–structural fusion, while the outputof equation (11) refers to a soft one. The soft output p(c |x ) provides the probabilitythat a pixel x is assigned to a class c. The probabilistic output in equation (11) can befurther employed in an object-based decision fusion.
2.3 Object-based decision fusion (levels II and III)
The object-based decision fusion consists of two levels:
1. At level II, the pixel-level decision fusion is extended to an object-based deci-sion fusion by considering the probabilistic outputs within the boundary of
Dow
nloa
ded
by [
Uni
vers
ity o
f L
eeds
] at
14:
39 0
9 Ja
nuar
y 20
12

3362 X. Huang and L. Zhang
each object. The objects having low probabilistic outputs are considered asunreliable and are processed in the next level.
2. At level III, shape attributes of the unreliable objects are used for improvingthe classification of level II.
The algorithm is detailed as follows.
Step 1 Segmentation: an adaptive mean shift segmentation algorithm (Huang andZhang 2008) is used to extract boundaries of objects. The mean shift algorithm isselected in this study since recently it has received increasing attention for segmen-tation of remotely sensed data (Chaabouni-Chouayakh and Datcu 2010), and in ourprevious work it showed better performance than the widely used FNEA segmentation(Huang and Zhang 2008).
Step 2 Object-based decision fusion at level II is implemented by considering thepixel-level probabilistic outputs of all the pixels within the object boundary:
l(obj) = arg maxc=1,2,...,C
(p(c |obj )) , (13)
where l(obj) is the winning label of the object and p(c |obj ) = ∑x∈obj p(c |x ) indicates
the sum of probabilistic outputs of all the pixels for class c in the object.
Step 3 Object merging: a decision-level object merging algorithm is used to mergethe spatially adjacent objects with the same class. The following processing is repeateduntil no adjacent object pairs can be further merged:
IF (obj1 is adjacent to obj2) AND l(obj1) = l(obj2)THEN obj1 and obj2 are merged as one object
Step 4 Post-processing: this step only focuses on the unreliable objects that satisfythe following condition:
p(c |obj ) = maxc
(p(c |obj )) < t, (14)
where c = l(obj) is the winning label of obj. The threshold t ∈ (0,1) for identificationof the unreliable objects should be chosen according to the characteristics of differ-ent images. Shape attributes (e.g. length–width ratio) of the unreliable objects are usedfor their reclassification. It should be noted that shape information is used only forobjects where it can bring improvements since a blind consideration of shape infor-mation to all objects could decrease the overall classification results. Therefore, in thisstudy, the shape attributes are only considered for the unreliable objects. Specifically,in our experiments, the length–width ratio is used for discrimination between roofsand roads. Road objects generate large values since they are relatively elongatedand narrow, while roof objects result in small values since they are rectangular andcompact.
A graphical example of the processing chain is demonstrated in figure 4. It is clearlyshown that: (1) the segmentation after the object merging is more effective in repre-senting the actual shape of the objects than the initial segmentation; (2) the unreliableobjects are determined according to the probabilistic outputs of all the pixels in eachobject; and (3) the shape attribute of the unreliable objects is then used for refinementof classification.
Dow
nloa
ded
by [
Uni
vers
ity o
f L
eeds
] at
14:
39 0
9 Ja
nuar
y 20
12

A multilevel decision fusion approach for VHR urban mapping 3363
Probabilistic outputs
Segmentation
Spectral–structuralfusion
Initial segmentation Unreliable objects
Shape attributes(Length–width ratio)
Object merging
Shape-basedpost-processing forrefinement of the
classification
Final result
Figure 4. A graphical example of the processing chain. In the images of the probabilistic out-puts, a large brightness value stands for a high possibility that a pixel belongs to a class. For theimage showing the unreliable objects, the grey level represents the value of p(c |obj ) defined inequation (14), where a large brightness value means a high probability and a small uncertaintyfor the classification. As for the feature image of length–width ratio, a large brightness standsfor a large ratio.
3. Experiments
In this section, two VHR data sets are used to validate the effectiveness and robustnessof the proposed multilevel decision fusion approach. The HYDICE DC Mall image isa standard data set for evaluation of segmentation and classification algorithms. Theother data set includes a pan-sharpened QuickBird multispectral image in Beijing, thecapital of China.
Dow
nloa
ded
by [
Uni
vers
ity o
f L
eeds
] at
14:
39 0
9 Ja
nuar
y 20
12

3364 X. Huang and L. Zhang
3.1 HYDICE DC Mall data set
The HYDICE airborne hyperspectral data flight over the Mall in Washington, DC wasused in this experiment. Two hundred and ten bands were collected in the 0.4–2.4 µmregion of the visible and infrared spectrum. The water absorption bands were thendeleted, resulting in 191 channels. This data set contains 1280 scan lines with 307pixels in each scan line. In this experiment, the non-negative matrix factorization(NMF) transformation (Lee and Seung 1999) was used to extract three-dimensionalbase images from the hyperspectral channels and yields the morphological structuralspectra. Training, validation and test samples are shown in table 1.
Accuracies of the multilevel decision fusion are listed in table 2, where the class-specific accuracies are the average of the producer’s accuracy (PA) and user’s accuracy(UA). The kappa coefficient and the overall accuracy (OA) are computed based onthe confusion matrix. The average accuracy (AA) is also reported since it is relativelyindependent of the number of samples for each class (Benediktsson et al. 2003). Basedon table 2, we have the following observations.
1. At level I. The spectral and structural features were integrated using weightdecision fusion (equation (10)). At this level, the decision fusion increased theoverall accuracies from 91.0% (spectral SVM) and 93.8% (structural SVM) to95.2%.
Table 1. Numbers of the reference samples (HYDICE data set).
Class Number of training pixels Number of validation pixels Number of test pixels
Road 110 333 3 334Grass 111 308 3 075Water 110 288 2 882Trail 114 103 1 034Tree 110 205 2 047Shadow 111 109 1 093Roof 111 587 5 867Total 777 1 933 19 332
Note: HYDICE, Hyperspectral Digital Imagery Collection Experiment.
Table 2. Accuracies of the multilevel decision fusion (HYDICE data set).
Class Spectral SVM Structural SVM Level I Level II Level III
Road 91.4 91.6 92.3 91.9 97.9Grass 97.1 98.0 97.8 98.5 98.5Water 94.8 99.8 99.2 99.9 99.9Trail 76.1 82.4 87.7 93.4 95.4Tree 97.2 98.0 97.8 98.9 98.9Shadow 84.2 91.4 94.6 96.5 96.5Roof 90.2 92.4 94.5 95.2 99.3OA (%) 91.0 93.8 95.2 96.0 98.6AA (%) 90.1 93.4 94.8 96.3 98.1κ 0.891 0.925 0.941 0.951 0.983
Note: HYDICE, Hyperspectral Digital Imagery Collection Experiment; SVM, support vectormachine; OA, overall accuracy; AA, average accuracy.
Dow
nloa
ded
by [
Uni
vers
ity o
f L
eeds
] at
14:
39 0
9 Ja
nuar
y 20
12

A multilevel decision fusion approach for VHR urban mapping 3365
2. At level II. In comparison with the level I, OA and kappa at level II increasedby 0.8% and 1.0%, respectively. The increments were achieved by extending thespectral–structural decision fusion from the pixel level to the object level.
3. At level III. The length–width ratio was used for classification of the unreliableobjects (t = 0.46). The rule is defined asFOR (c = roads or trails) AND (p(c |obj ) < t)IF Ratio <2.5THEN c = roofs.
The objective of this shape-based rule is to avoid the misclassifications between roads,trails and roofs. In table 2, it can be seen that the post-processing at level III gave verypromising results (OA = 98.6% and κ = 0.983). In comparison with level II, accuraciesof the man-made structures were improved by 6.0%, 2.0% and 4.1 % for roads, trailsand roofs, respectively.
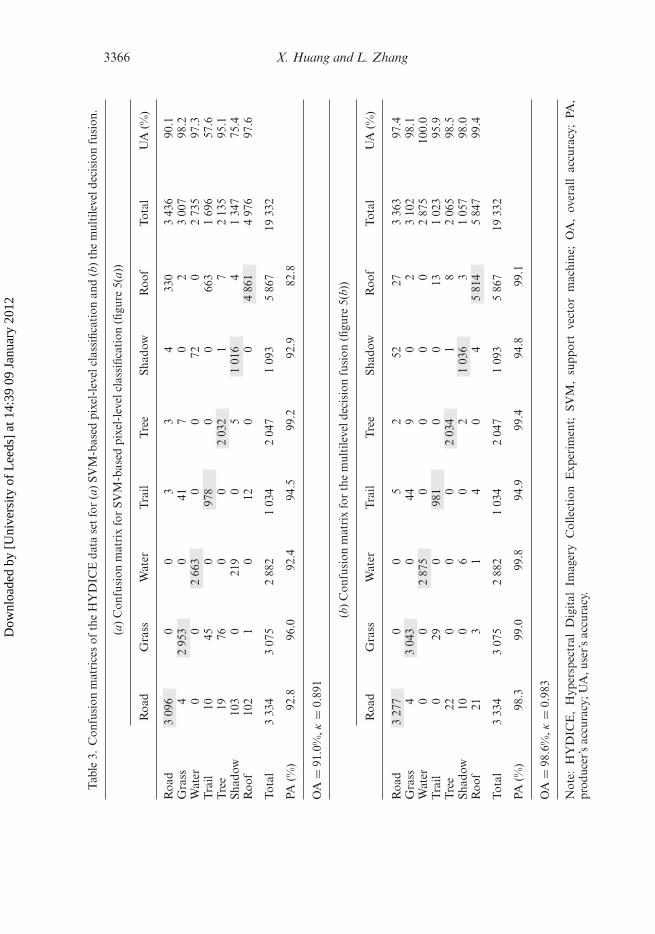
The results of the proposed multilevel fusion and the pixel-level classification arecompared in figure 5. Their confusion matrices are provided in table 3. Subsets of theclassification maps are displayed in figure 6. Figure 6(a) shows the pixel-level spectral
RoadsGrassWaterTrailsTreesShadowRoofs
(a) (b)
Figure 5. Classification results of the airborne hyperspectral data over the Washington DCMall: (a) support vector machine (SVM)-based pixel-level interpretation and (b) the multileveldecision fusion.
Dow
nloa
ded
by [
Uni
vers
ity o
f L
eeds
] at
14:
39 0
9 Ja
nuar
y 20
12
3366 X. Huang and L. Zhang
Tab
le3.
Con
fusi
onm
atri
ces
ofth
eH
YD
ICE
data
set
for
(a)
SVM
-bas
edpi
xel-
leve
lcla
ssifi
cati
onan
d(b
)th
em
ulti
leve
ldec
isio
nfu
sion
.
(a)
Con
fusi
onm
atri
xfo
rSV
M-b
ased
pixe
l-le
velc
lass
ifica
tion
(figu
re5(
a))
Roa
dG
rass
Wat
erT
rail
Tre
eSh
adow
Roo
fTo
tal
UA
(%)
Roa
d3
096
00
33
433
03
436
90.1
Gra
ss4
295
30
417
02
300
798
.2W
ater
00
266
30
072
02
735
97.3
Tra
il10
450
978
00
663
169
657
.6T
ree
1976
00
203
21
72
135
95.1
Shad
ow10
30
219
05
101
64
134
775
.4R
oof
102
10
120
04
861
497
697
.6
Tota
l3
334
307
52
882
103
42
047
109
35
867
1933
2
PA(%
)92
.896
.092
.494
.599
.292
.982
.8
OA
=91
.0%
,κ=
0.89
1
(b)
Con
fusi
onm
atri
xfo
rth
em
ulti
leve
ldec
isio
nfu
sion
(figu
re5(
b))
Roa
dG
rass
Wat
erT
rail
Tre
eSh
adow
Roo
fTo
tal
UA
(%)
Roa
d3
277
00
52
5227
336
397
.4G
rass
43
043
044
90
23
102
98.1
Wat
er0
02
875
00
00
287
510
0.0
Tra
il0
290
981
00
131
023
95.9
Tre
e22
00
02
034
18
206
598
.5Sh
adow
100
60
21
036
31
057
98.0
Roo
f21
31
40
45
814
584
799
.4
Tota
l3
334
307
52
882
103
42
047
109
35
867
1933
2
PA(%
)98
.399
.099
.894
.999
.494
.899
.1
OA
=98
.6%
,κ=
0.98
3
Not
e:H
YD
ICE
,H
yper
spec
tral
Dig
ital
Imag
ery
Col
lect
ion
Exp
erim
ent;
SVM
,su
ppor
tve
ctor
mac
hine
;O
A,
over
all
accu
racy
;PA
,pr
oduc
er’s
accu
racy
;UA
,use
r’sac
cura
cy.
Dow
nloa
ded
by [
Uni
vers
ity o
f L
eeds
] at
14:
39 0
9 Ja
nuar
y 20
12

A multilevel decision fusion approach for VHR urban mapping 3367
Figure 6. Subsets of classification maps of the Hyperspectral Digital Imagery CollectionExperiment (HYDICE) DC Mall image: (a) pixel-level classification using the hyperspectralbands with the support vector machine (SVM) classifier; (b), (c) and (d) classification results oflevels I, II and III, respectively.
classification using the hyperspectral bands with a SVM classifier, and figure 6(b)–(d)are the classification maps of the proposed method for levels I, II and III, respec-tively. Some misclassifications are highlighted with several rectangular regions. Thepixelwise classification (figure 6(a)) clearly shows the pepper–salt effect and misclas-sifications between spectrally similar classes. The spectral–structural classification infigure 6(b) revises some errors of water–shadow and trails–roofs. The object-baseddecision fusion (figure 6(c)) is able to reduce the uncertainties and the pepper–salteffect of pixelwise classification. The performance of the shape-based post-processingcan be observed in figure 6(d), where some misclassifications for trails–roofs androads–roofs in figure 6(a)–(c) are corrected.
3.2 QuickBird Beijing data set
In this experiment, a pan-sharpened QuickBird image of Beijing with a spatial res-olution of 0.61 m is used to validate the proposed multilevel model. The study areais shown in figure 7(a). It is a typical urban landscape in China, including dense res-idential and apartments with gardens. The training, validation and test samples are
Dow
nloa
ded
by [
Uni
vers
ity o
f L
eeds
] at
14:
39 0
9 Ja
nuar
y 20
12

3368 X. Huang and L. Zhang
Lake
(a) (b)
(d) (e)
(c)
Grass
Bare soil
Roads
Shadow
Apartment
TreesDense residential
Vehicle
Figure 7. (a) QuickBird colour image of the study area in the northwest of Beijing, the cap-ital city of China, (b) mean shift segmentation result and (c) refined segmentation map withthe decision-level object merging. (d) and (e) Classification maps for the pixel-level spectralclassification and the proposed multilevel fusion approach, respectively.
Table 4. Numbers of the reference samples (Beijing QuickBird data set).
Class Number of trainingpixels
Number ofvalidation pixels
Number of testpixels
Lake 60 300 6 986Grass 60 300 1 654Bare soil 60 300 2 806Road 60 300 6 603Shadow 60 300 2 062Apartment 60 300 7 630Tree 60 300 4 691Dense
residential60 300 7 414
Vehicle 60 300 592Total 540 2 700 40 438
listed in table 4. The challenge for classifying this area is to discriminate betweenthe spectrally similar classes such as bare soil, roads, residential area, apartment andvehicle.
Accuracies of the multilevel decision fusion are reported in table 5. From thistable, a similar conclusion is obtained as the HYDICE experiment. In the QuickBirdexperiment, the accuracy increments achieved by the multilevel framework are moresignificant. The results are very promising since the OA increased from 65.5% (spectralclassification) to 78.9%, 87.2% and 93.3% for decision fusion at levels I, II and
Dow
nloa
ded
by [
Uni
vers
ity o
f L
eeds
] at
14:
39 0
9 Ja
nuar
y 20
12

A multilevel decision fusion approach for VHR urban mapping 3369
Table 5. Accuracies of the multilevel decision fusion (Beijing QuickBird data set).
Class Spectral SVM Structural SVM Level I Level II Level III
Lake 100.0 99.1 100.0 100.0 100.0Grass 73.1 48.0 78.6 93.4 93.4Bare soil 60.9 79.4 79.6 91.0 91.0Road 62.5 65.9 71.8 81.7 92.3Shadow 88.7 92.2 90.8 96.2 96.2Apartment 33.1 68.7 67.4 74.0 90.8Tree 86.4 83.1 90.7 97.2 97.2Dense residential 50.1 70.2 72.0 89.4 89.4Vehicle 57.7 74.8 74.5 85.7 85.7OA (%) 65.5 75.1 78.9 87.2 93.3AA (%) 68.1 75.7 80.6 89.8 92.9κ 0.600 0.710 0.754 0.850 0.922
Note: SVM, support vector machine; OA, overall accuracy; AA, average accuracy.
III, respectively. Once again, in table 5, it is seen that the accuracy of each classincreased when structural (level I), boundary (level II) and shape (level III) featureswere gradually included in the processing chain.
The segmentation and classification maps are displayed in figure 7, where figure 7(b)is the mean shift-based initial segmentation, and figure 7(c) is the refined segmenta-tion after the decision-level object merging. The classification maps for the pixel-levelspectral classification and the proposed multilevel decision fusion are compared in fig-ures 7(d) and (e). Their confusion matrices are provided in table 6. The comparison intable 6 reveals that classification for all the information classes are improved with themultilevel method. This observation is further supported by the visual inspection infigure 7.
4. Conclusion
In this study, we presented a novel multilevel model for effectively integrating spectral,structural and geometrical features for classification of the VHR multi/hyperspectralimagery. The model is progressively enhanced from a low level (pixel) to a high (object)level when the multilevel features are gradually considered in the processing chain.Moreover, the model is adaptively extended by considering the probabilistic outputsof each level. The main contributions of this study are summarized as follows.
1. At level I. A morphological centre filter was used to construct the self-dualoperators and extend the algorithm of MPs. Furthermore, a weight probabilitydecision fusion was proposed to integrate spectral and structural information.
2. At level II. The spectral–structural decision fusion was extended from thepixel level to the object level by considering probabilistic outputs within theboundary of each object. The results showed that this extension improved theaccuracies of level I by 0.8% and 8.3% for the HYDICE and QuickBird datasets, respectively.
3. At level III. This level only focused on the unreliable objects of level II. Theshape attribute of the unreliable objects was extracted for refining the result oflevel II. The accuracy increments achieved by the shape-based post-processingwere 2.6% and 6.1% for the HYDICE and QuickBird data sets, respectively.
Dow
nloa
ded
by [
Uni
vers
ity o
f L
eeds
] at
14:
39 0
9 Ja
nuar
y 20
12

3370 X. Huang and L. Zhang
Tab
le6.
Con
fusi
onm
atri
ces
for
(a)
SVM
-bas
edpi
xel-
leve
lcla
ssifi
cati
onan
d(b
)th
epr
opos
edm
ulti
leve
ldec
isio
nfu
sion
(Qui
ckB
ird
data
set)
.
(a)
Con
fusi
onm
atri
xfo
rSV
M-b
ased
pixe
l-le
velc
lass
ifica
tion
(figu
re7(
d))
Lak
eG
rass
Bar
eso
ilR
oad
Shad
owA
part
men
tT
rees
Den
sere
side
ntia
lV
ehic
leTo
tal
UA
(%)
Lak
e6
986
00
00
00
00
698
610
0.0
Gra
ss0
143
22
00
2493
17
02
396
59.7
Bar
eso
il0
292
057
110
169
70
421
194
234
48.5
Roa
d0
024
480
20
239
80
189
649
916
952
.3Sh
adow
00
1824
203
610
171
321
122
583
78.8
Apa
rtm
ent
00
291
921
01
935
01
510
684
725
40.9
Tre
e0
191
30
20
367
012
03
878
94.6
Den
sere
side
ntia
l0
232
083
924
110
319
316
819
549
457
.6V
ehic
le0
091
60
372
079
425
973
43.6
Tota
l6
986
165
42
806
660
32
062
763
04
691
741
459
240
438
PA(%
)10
0.0
86.5
73.3
72.7
98.7
25.3
78.2
42.7
71.7
OA
=65
.5%
,κ=
0.60
0
(b)
Con
fusi
onm
atri
xfo
rth
em
ulti
leve
ldec
isio
nfu
sion
(figu
re7(
e))
Lak
eG
rass
Bar
eso
ilR
oads
Shad
owA
part
men
tT
rees
Den
sere
side
ntia
lV
ehic
leTo
tal
UA
(%)
Lak
e6
986
00
00
00
00
698
610
0.0
Gra
ss0
164
40
00
4716
625
01
882
87.4
Bar
eso
il0
02
552
60
189
054
12
802
91.1
Roa
d0
00
643
20
432
046
849
738
187
.1Sh
adow
00
61
201
927
1956
72
135
94.6
Apa
rtm
ent
00
069
06
504
015
818
674
996
.4T
ree
010
00
310
448
86
154
550
98.6
Den
sere
side
ntia
l0
022
895
1241
518
663
525
742
889
.3V
ehic
le0
020
00
160
1247
752
590
.9To
tal
698
61
654
280
66
603
206
27
630
469
17
414
592
4043
8PA
(%)
100.
099
.491
.097
.497
.985
.295
.789
.580
.6
OA
=93
.3%
,κ=
0.92
2
Not
e:SV
M,s
uppo
rtve
ctor
mac
hine
;OA
,ove
rall
accu
racy
;PA
,pro
duce
r’sac
cura
cy;U
A,u
ser’s
accu
racy
.
Dow
nloa
ded
by [
Uni
vers
ity o
f L
eeds
] at
14:
39 0
9 Ja
nuar
y 20
12

A multilevel decision fusion approach for VHR urban mapping 3371
Future work will be related to the use of some standard techniques in the processingchain. Some other methods for the spatial features (e.g. textural bands), classifiers (e.g.the maximum likelihood classification and neural networks) and segmentation (e.g. theFNEA and J-measure-based approach) can be also used in the proposed multilevelsystem. Hence, it will be interesting to evaluate and compare their performance infuture experiments.
AcknowledgementThis work was supported by the National Science Foundation of China(41061130553), the Fundamental Research Funds for the Central Universities(3101016) and the LIESMARS Special Research Funding.
ReferencesBELLENS, R., GAUTAMA, S., MARTINEZ-FONTE, L., PHILIPS, W., CHAN, J.C.W. and CANTERS,
F., 2008, Improved classification of VHR images of urban areas using directionalmorphological profiles. IEEE Transactions on Geoscience and Remote Sensing, 46,pp. 2803–2813.
BENEDIKTSSON, J.A., PALMASON, J.A. and SVEINSSON, J.R., 2005, Classification of hyper-spectral data from urban areas based on extended morphological profiles. IEEETransactions on Geoscience and Remote Sensing, 43, pp. 480–491.
BENEDIKTSSON, J.A., PESARESI, M. and ARNASON, K., 2003, Classification and featureextraction for remote sensing images from urban areas based on morphological trans-formations. IEEE Transactions on Geoscience and Remote Sensing, 41, pp. 1940–1949.
BENZ, U.C., HOFMANN, P., WILLHAUCK, G., LINGENFELDER, I. and HEYNEN, M., 2004,Multi-resolution, object-oriented fuzzy analysis of remote sensing data for GIS-readyinformation. ISPRS Journal of Photogrammetry and Remote Sensing, 58, pp. 239–258.
BRUZZONE, L. and CARLIN, L., 2006, A multilevel context-based system for classificationof very high spatial resolution images. IEEE Transactions on Geoscience and RemoteSensing, 44, pp. 2587–2600.
CHAABOUNI-CHOUAYAKH, H. and DATCU, M., 2010, Coarse-to-fine approach for urban areainterpretation using TerraSAR-X data. IEEE Geoscience and Remote Sensing Letters,7, pp. 78–82.
CHANUSSOT, J., BENEDIKTSSON, J.A. and FAUVEL, M., 2006, Classification of remote sensingimages from urban areas using a fuzzy possibilistic model. IEEE Geoscience and RemoteSensing Letters, 3, pp. 40–44.
CHUBEY, M.S., FRANKLIN, S.E. and WULDER, M.A., 2006, Object-based analysis of Ikonos-2 imagery for extraction of forest inventory parameters. Photogrammetric Engineeringand Remote Sensing, 72, pp. 383–394.
FAUVEL, M., BENEDIKTSSON, J.A., CHANUSSOT, J. and SVEINSSON, J.R., 2008, Spectral and spa-tial classification of hyperspectral data using SVMs and morphological profiles. IEEETransactions on Geoscience and Remote Sensing, 46, pp. 3804–3814.
FAUVEL, M., CHANUSSOT, J. and BENEDIKTSSON, J.A., 2009, Kernel principal componentanalysis for the classification of hyperspectral remote-sensing data over urban areas.EURASIP Journal on Advances in Signal Processing, doi: 10.1155/2009/783194.
HUANG, X. and ZHANG, L., 2008, An adaptive mean-shift analysis approach for objectextraction and classification from urban hyperspectral imagery. IEEE Transactions onGeoscience and Remote Sensing, 46, pp. 4173–4185.
HUANG, X., ZHANG, L. and LI, P., 2007a, Classification and extraction of spatial features inurban areas using high resolution multispectral imagery. IEEE Geoscience and RemoteSensing Letters, 4, pp. 260–264.
Dow
nloa
ded
by [
Uni
vers
ity o
f L
eeds
] at
14:
39 0
9 Ja
nuar
y 20
12

3372 X. Huang and L. Zhang
HUANG, X., ZHANG, L. and LI, P., 2007b, An adaptive multiscale information fusion approachfor feature extraction and classification of IKONOS multispectral imagery over urbanareas. IEEE Geoscience and Remote Sensing Letters, 4, pp. 654–658.
HUANG, X., ZHANG, L. and LI, P., 2008, A multiscale feature fusion approach for classifica-tion of very high resolution satellite imagery based on wavelet transform. InternationalJournal of Remote Sensing, 29, pp. 5923–5941.
LEE, D.D. and SEUNG, H.S., 1999, Learning the parts of objects by non-negative matrixfactorization. Nature, 401, pp. 788–791.
LI, P. and XIAO, X., 2007, Multispectral image segmentation by a multichannel watershed-basedapproach. International Journal of Remote Sensing, 28, pp. 4429–4452.
MYINT, S.W., LAM, N.S.N. and TYLER, J., 2004, Wavelets for urban spatial feature discrim-ination: comparisons with fractal, spatial autocorrelation, and spatial co-occurrenceapproaches. Photogrammetric Engineering and Remote Sensing, 70, pp. 803–812.
OUMA, Y.O., NGIGI, T.G. and TATEISHI, R., 2006, On the optimization and selection of wavelettexture for feature extraction from high-resolution satellite imagery with applicationtowards urban-tree delineation. International Journal of Remote Sensing, 27, pp. 73–104.
OUMA, Y.O., TETUKO, J. and TATEISHI, R., 2008, Analysis of co-occurrence and discretewavelet transform textures for differentiation of forest and non-forest vegetation in very-high-resolution optical-sensor imagery. International Journal of Remote Sensing, 29,pp. 3417–3456.
PACIFICI, F., CHINI, M. and EMERY, W.J., 2009, A neural network approach using multi-scaletextural metrics from very high-resolution panchromatic imagery for urban land-useclassification. Remote Sensing of Environment, 113, pp. 1276–1292.
PUISSANT, A., HIRSCH, J. and WEBER, C., 2005, The utility of texture analysis to improve per-pixel classification for high to very high spatial resolution imagery. International Journalof Remote Sensing, 26, pp. 733–745.
SHAH, V.P., YOUNAN, N.H., DURBHA, S.S. and KING, R.L., 2010, Feature identification via acombined ICA–wavelet method for image information mining. IEEE Geosciences andRemote Sensing Letters, 7, pp. 18–22.
SOILLE, P. and PESARESI, M., 2002, Advances in mathematical morphology applied to geo-science and remote sensing. IEEE Transactions on Geoscience and Remote Sensing, 40,pp. 2042 –2055.
VAN COILLIE, F.M.B., VERBEKE, L.P.C. and DE WULF, R.R., 2007, Feature selection by geneticalgorithms in object-based classification of IKONOS imagery for forest mapping inFlanders, Belgium. Remote Sensing of Environment, 110, pp. 476–487.
WANG, Z. and BOESCH, R., 2007, Color- and texture-based image segmentation forimproved forest delineation. IEEE Transactions on Geoscience and Remote Sensing, 45,pp. 3055–3062.
WU, T.F., LIN, C.J. and WENG, R.C., 2004, Probability estimates for multi-class classificationby pairwise coupling. Journal of Machine Learning Research, 5, pp. 975–1005.
YU, Q., GONG, P., CLINTON, N., BIGING, G. and SCHIROKAUER, D., 2006, Object-based detailedvegetation classification with airborne high spatial resolution remote sensing imagery.Photogrammetric Engineering and Remote Sensing, 72, pp. 799–811.
ZHOU, W., HUANG, G., TROY, A. and CADENASSO, M.L., 2009, Object-based land cover classi-fication of shaded areas in high spatial resolution imagery of urban areas: a comparisonstudy. Remote Sensing of Environment, 113, pp. 1769–1777.
Dow
nloa
ded
by [
Uni
vers
ity o
f L
eeds
] at
14:
39 0
9 Ja
nuar
y 20
12


![[REMOTE SENSING] 3-PM Remote Sensing](https://static.fdocuments.us/doc/165x107/61f2bbb282fa78206228d9e2/remote-sensing-3-pm-remote-sensing.jpg)


