Senior Thesis Defense Presentation: Regional Inequality and Chinese Consumers' Demands
16
Regional Inequality and Consumers’ Demands An Empirical Analysis on the Relationship Between the Correlation of Variation and the Income Elasticity of Demand in Contemporary China
-
Upload
rob-pettit -
Category
Education
-
view
650 -
download
0
Transcript of Senior Thesis Defense Presentation: Regional Inequality and Chinese Consumers' Demands

Regional Inequality and Consumers’ Demands
An Empirical Analysis on the Relationship Between the Correlation of
Variation and the Income Elasticity of Demand in Contemporary China
0
2000
4000
6000
8000
10000
12000
14000
16000
18000
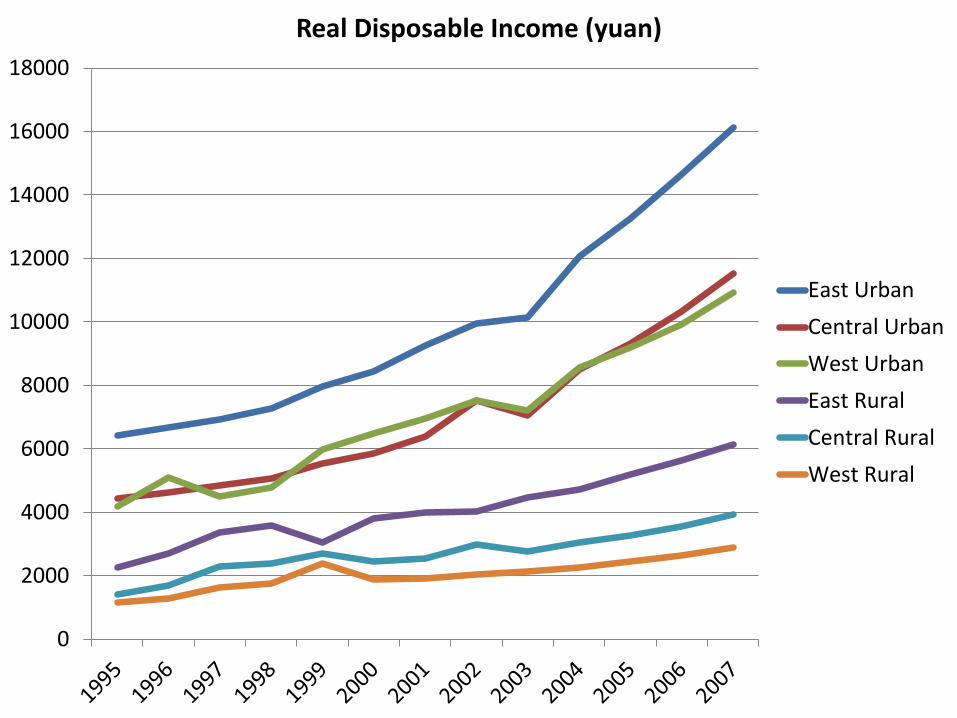
Real Disposable Income (yuan)
East Urban
Central Urban
West Urban
East Rural
Central Rural
West Rural
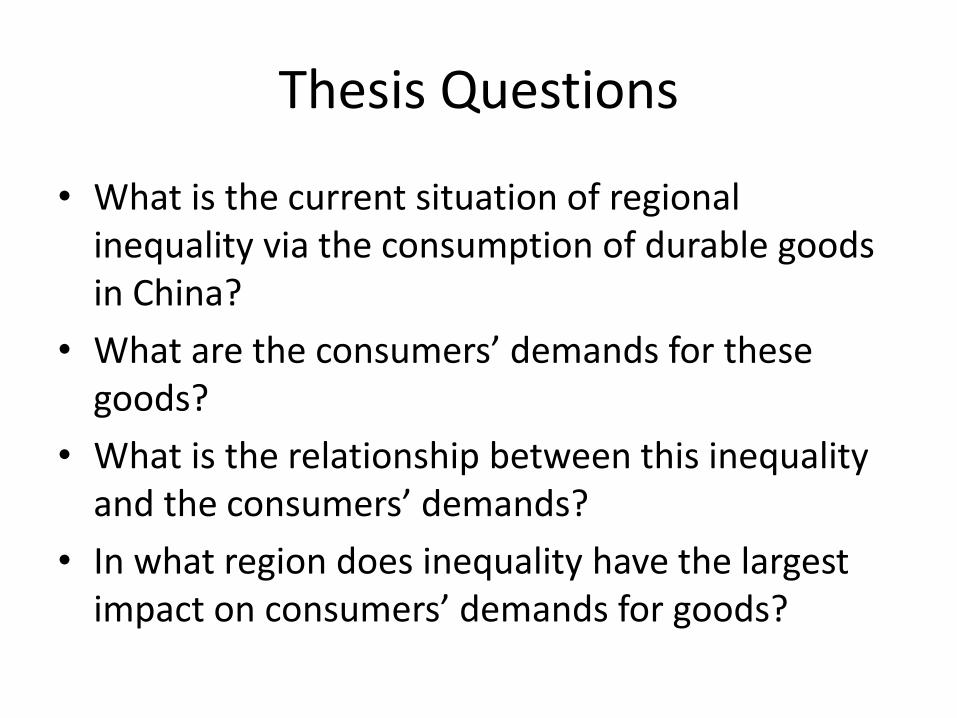
Thesis Questions
• What is the current situation of regional inequality via the consumption of durable goods in China?
• What are the consumers’ demands for these goods?
• What is the relationship between this inequality and the consumers’ demands?
• In what region does inequality have the largest impact on consumers’ demands for goods?


Inequality Indicators
• Color TV Sets
• Refrigerators
• Motorcycles
• Cameras
• Washing Machines

Dependent Variable
Income Elasticity of Demand (Consumers’ Demands)-how sensitive quantity demanded is to a change in income
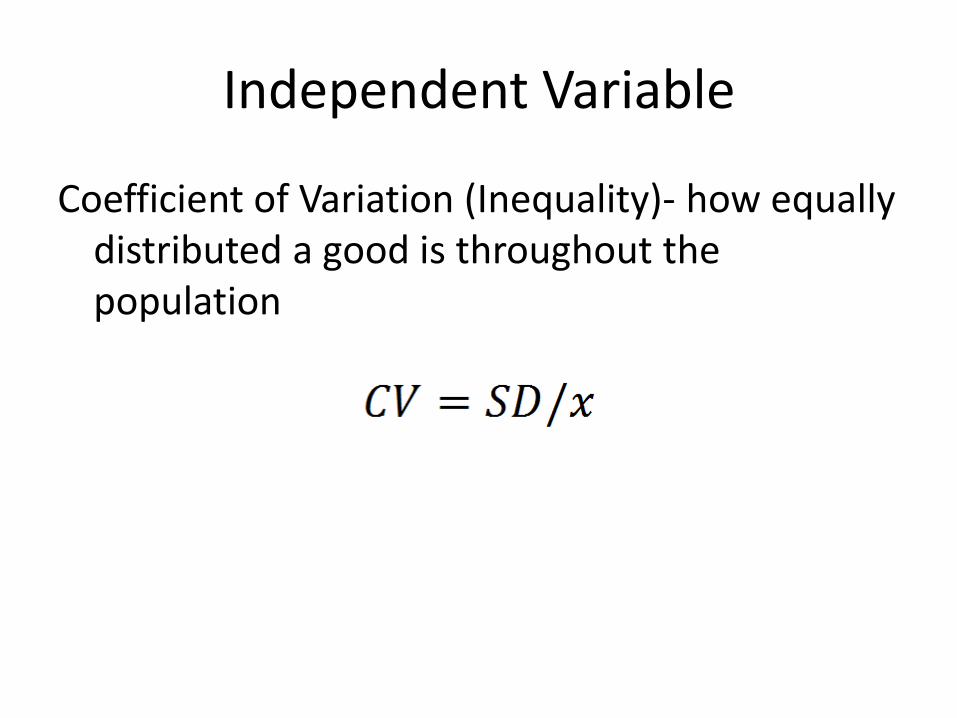
Independent Variable
Coefficient of Variation (Inequality)- how equally distributed a good is throughout the population
0
20
40
60
80
100
120
140
160
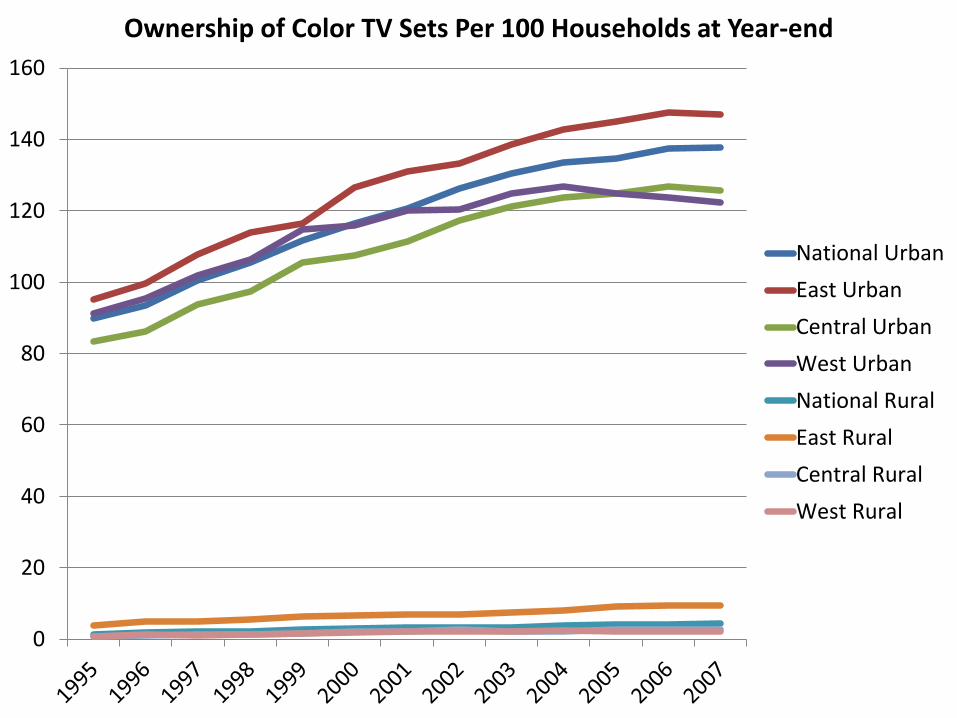
Ownership of Color TV Sets Per 100 Households at Year-end
National Urban
East Urban
Central Urban
West Urban
National Rural
East Rural
Central Rural
West Rural

Durable Good Regions
Average Annual %Growth
Correlation of Variation
(1996-2007)
URBAN RURAL
Color TV Sets
National 4.422124702 -9.814652591
East 4.016287734 -7.382496507
Central 15.36699155 -15.82124415
West 11.81954683 -10.99016813
Refrigerators
National -8.063147979 -7.259335949
East -4.504644032 -5.302285046
Central -13.71279228 -0.860317645
West -2.594221168 3.617870079
Motorcycles
National 0.067301337 -7.80202395
East 0.221599125 -5.44086449
Central -1.797377898 -6.24116446
West 4.774005066 -3.339083226
Cameras
National -1.038031619 -2.004611812
East -1.826791685 -2.231949859
Central -3.428201296 2.394932569
West 0.600210644 -0.310687795
Washing
Machines
National 12.9664818 -5.498577635
East 16.71482544 -3.53928115
Central -2.570156902 -4.43538997
West 13.46672735 -4.315798845

0
0.1
0.2
0.3
0.4
0.5
0.6
0.7
0.8
0.9
Coefficient of Variation for Color TV Sets (1995-2007)
National Urban
East Urban
Central Urban
West Urban
National Rural
East Rural
Central Rural
West Rural
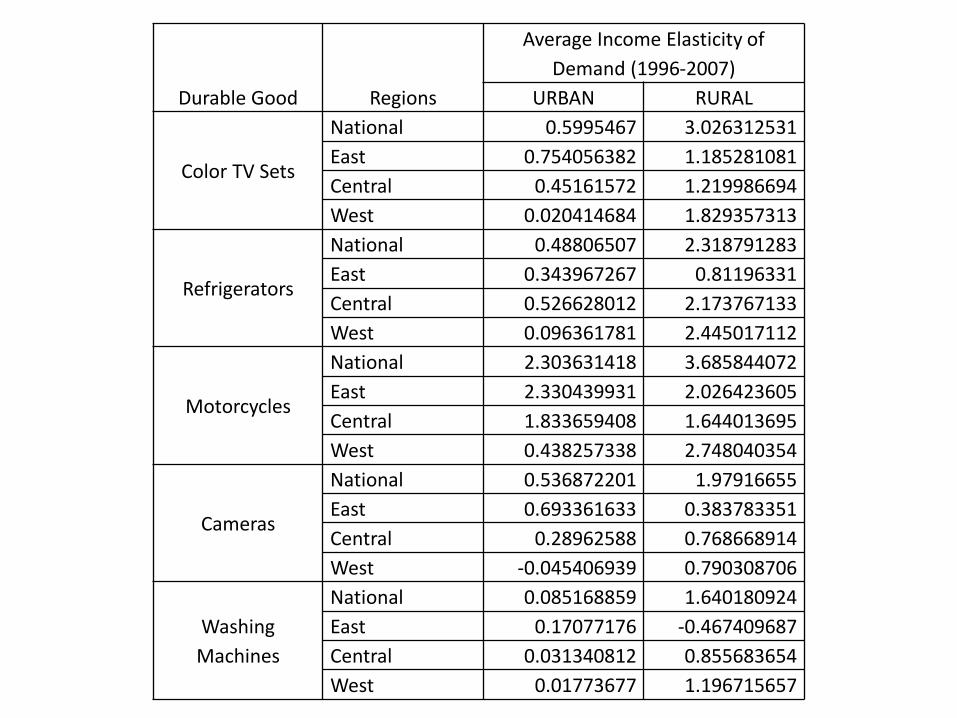
Durable Good Regions
Average Income Elasticity of
Demand (1996-2007)
URBAN RURAL
Color TV Sets
National 0.5995467 3.026312531
East 0.754056382 1.185281081
Central 0.45161572 1.219986694
West 0.020414684 1.829357313
Refrigerators
National 0.48806507 2.318791283
East 0.343967267 0.81196331
Central 0.526628012 2.173767133
West 0.096361781 2.445017112
Motorcycles
National 2.303631418 3.685844072
East 2.330439931 2.026423605
Central 1.833659408 1.644013695
West 0.438257338 2.748040354
Cameras
National 0.536872201 1.97916655
East 0.693361633 0.383783351
Central 0.28962588 0.768668914
West -0.045406939 0.790308706
Washing
Machines
National 0.085168859 1.640180924
East 0.17077176 -0.467409687
Central 0.031340812 0.855683654
West 0.01773677 1.196715657

-4
-2
0
2
4
6
8
10
12
14
Income Elaticity of Demand for Color TV Sets (1996-2007)
National Urban
East Urban
Central Urban
West Urban
National Rural
East Rural
Central Rural
West Rural

Overall Inequality
National Urban
East Urban
Central Urban
West Urban
National Rural
East Rural
Central Rural
West Rural
Overall Inequality
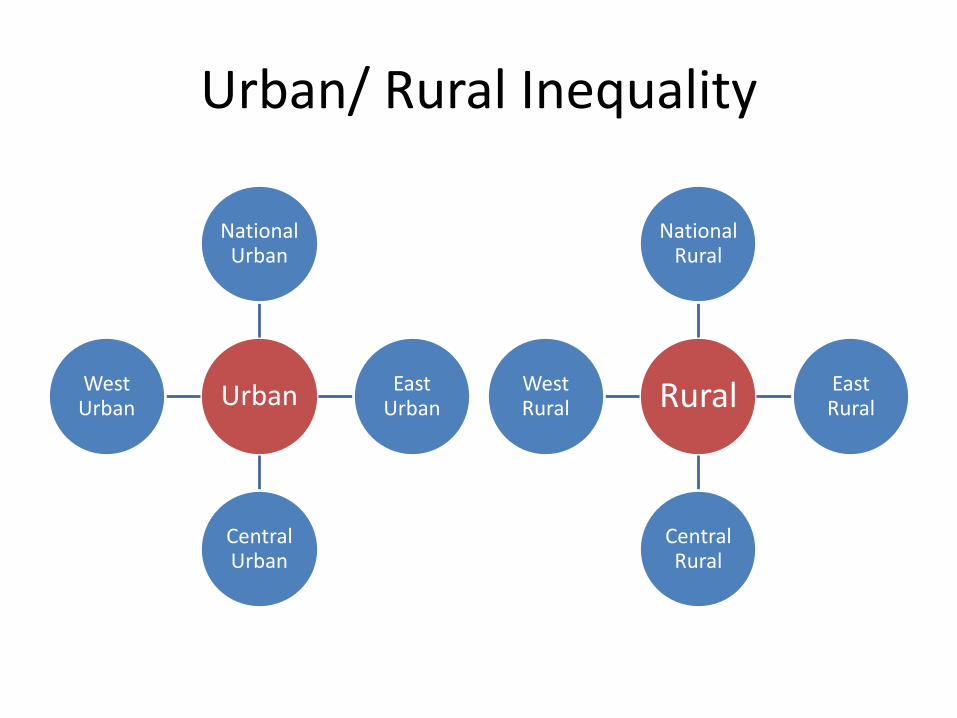
Urban/ Rural Inequality
Urban
National Urban
East Urban
Central Urban
West Urban Rural
National Rural
East Rural
Central Rural
West Rural

East
East Urban
East Rural
Central
Central
Urban
Central
Rural
West
West
Urban
West
Rural
3 Region Inequality

COEFFICIENTS
Variables All Urban Rural East Central West
Coefficient of Variation 1.52** 2.69*** 0.07 0.09 1.93 3.60**
(3.629) (6.338) (0.09) (0.094) (1.651) (4.252)
N 40 20 20 10 10 10
R2 0.257 0.691 0.000 0.001 0.254 0.693
R 0.51 0.83 0.02 0.03 0.50 0.83
F statistics 13.169 40.176 0.008 0.009 2.727 18.083
Note: t-statistics are in parentheses
***p<0.001, **p<0.01, *p<0.05 (two-tailed tests)
Confidence Interval: 95%