Senior Project Administrator - WCEC | Waste Managementwcec.wm.com/documents/our-vision/18 - 140730...
148
This document is intended for the sole use of the party to whom it is addressed and may contain information that is privileged and/or confidential. If you have received this in error, please notify us immediately. ® RWDI name and logo are registered trademarks in Canada and the United States of America Reputation Resources Results Canada | USA | UK | India | China | Hong Kong | Singapore www.rwdi.com Tel: 519.823.1311 Fax: 519.823.1316 RWDI AIR Inc. 650 Woodlawn Road West Guelph, Ontario, Canada N1K 1B8 West Carleton Environmental Centre Landfill Ottawa, Ontario Final Report Emission Summary & Dispersion Modelling Report RWDI # 1302177 July 30, 2014 SUBMITTED TO Wayne Jenken Landfill Engineer – Southwest Landfills [email protected] Rémi Godin, P.Eng Landfill Project Engineer [email protected] Waste Management of Canada Corporation West Carleton Environmental Centre Landfill 2301 Carp Road, Ottawa, ON K0A 1L0 P: (613) 831-5363 F: (613) 831-8928 SUBMITTED BY Brad Bergeron, A.Sc.T., d.E.T Senior Project Manager / Principal [email protected] John DeYoe, B.A. d.E.T Project Director / Associate [email protected] Brian Sulley, B.A.Sc., P.Eng. Senior Specialist [email protected] Claire Finoro, B.Sc. (Eng) Project Scientist [email protected]
Transcript of Senior Project Administrator - WCEC | Waste Managementwcec.wm.com/documents/our-vision/18 - 140730...

This document is intended for the sole use of the party to whom it is addressed and may contain information that is privileged and/or confidential. If you have received this in error, please notify us immediately.
® RWDI name and logo are registered trademarks in Canada and the United States of America
Reputation Resources Results Canada | USA | UK | India | China | Hong Kong | Singapore www.rwdi.com
Tel: 519.823.1311 Fax: 519.823.1316 RWDI AIR Inc. 650 Woodlawn Road West Guelph, Ontario, Canada N1K 1B8
West Carleton Environmental Centre Landfill Ottawa, Ontario
Final Report
Emission Summary & Dispersion Modelling Report RWDI # 1302177
July 30, 2014
SUBMITTED TO
Wayne Jenken Landfill Engineer – Southwest Landfills
Rémi Godin, P.Eng Landfill Project Engineer
Waste Management of Canada Corporation West Carleton Environmental Centre Landfill
2301 Carp Road, Ottawa, ON
K0A 1L0
P: (613) 831-5363 F: (613) 831-8928
SUBMITTED BY
Brad Bergeron, A.Sc.T., d.E.T Senior Project Manager / Principal
John DeYoe, B.A. d.E.T Project Director / Associate
Brian Sulley, B.A.Sc., P.Eng. Senior Specialist
Claire Finoro, B.Sc. (Eng) Project Scientist


Reputation Resources Results Canada | USA | UK | India | China | Hong Kong | Singapore www.rwdi.com
WCEC Landfill Emission Summary & dispersion Modelling Report Waste Management of Canada Corporation RWDI#1302177 July 30, 2014
EXECUTIVE SUMMARY
This Emission Summary and Dispersion Modelling (ESDM) report was prepared in support of an
application to amend the following existing Environmental Compliance Approvals (ECA):
ECA #4117-8EHQE7;
ECA #7025-7F4PN5; and
ECA #7816-7C9JMR.
The application for ECA amendment reflects the expansion of the applicant’s West Carleton
Environmental Centre (WCEC) facility located at 2301 Carp Road, Ottawa, Ontario. This application is
being submitted to achieve compliance of Waste Management of Canada Corporation’s (WM) operations
with the requirements of Section 9 of the Environmental Protection Act (EPA), R.S.O. 1990.
The purpose of the application for amendment is to include the new and/or modified operations and
sources associated with the proposed landfill expansion as follows:
Five (5) 1,600 kW landfill gas-fired engine-generator sets;
Two (2) enclosed flare systems;
One (1) candlestick flare system;
One (1) existing closed landfill mound;
One (1) proposed landfill mound;
Four (4) sources associated with the landfilling activities including the active stage, working face,
interim cover and contaminated soil stockpile;
One (1) leachate treatment system including one (1) raw leachate equalization tank, one (1) SBR
tank, one (1) effluent equalization tank, and one (1) sludge holding tank;
Material loading at contaminated soil stockpile;
Material loading at overburden stockpile;
Material loading the construction working face;
Material loading at the landfill working face;
Material unloading at the contaminated soil stockpile;
Material unloading at the construction working face;
Material unloading at the landfill working face;
Bulldozing at the overburden stockpile;
Bulldozing at the construction working face;
Crushing of aggregate material at the Impact Crusher near the Waste Transfer Facility; and
One (1) 300 hp diesel-fired engine supplying power to the impact crusher.

Reputation Resources Results Canada | USA | UK | India | China | Hong Kong | Singapore www.rwdi.com
WCEC Landfill Emission Summary & dispersion Modelling Report Waste Management of Canada Corporation RWDI#1302177 July 30, 2014
Sources and activities subject to the Environmental Activity and Sector Registry are included in this
application for amendment to ECA #4117-8EHQE7, in accordance with a request made under s. 20.18 of
the Environmental Protection Act.
WM’s WCEC is a waste disposal facility receiving municipal, industrial, commercial, and institutional
wastes. The North American Industry Classification Scheme (NAICS) code that best applies to WM’s
WCEC landfill is 562210 – “Waste Disposal and Treatment”. This facility is part of Schedule 5 identified
by a NAICS code listed in Schedule 5 and shall comply with Schedule 3 standards using an approved
dispersion model (AERMOD), effective February 1, 2013.
A total of seventy-five contaminants were identified with respect to WCEC landfill operation. These
contaminants were emitted from a total of thirty-two sources at the WCEC landfill facility. Of the identified
contaminants, forty-six contaminants were discharged in negligible amounts and four of the significant
contaminants do not have Schedule 3 Standard or guideline under O. Reg. 419/05. Of all the sources on
site, thirty were determined to be significant.
For the purposes of estimating emissions from the facility, a maximum operating scenario was considered.
This scenario consists of simultaneous operation of all on-site sources at a maximum capacity, including
the LGTE facility engine-generator sets, the landfill gas flares, the leachate treatment system and
generators. The assessment also considered the concurrent maximum level of fugitive releases from the
existing and proposed landfill mounds as well as material handling and processing emissions. This
scenario was used as the basis for the dispersion modelling analysis, which was conducted for 10-minute,
30-minute, 1-hour, 24-hour and annual averaging times. Emission rates were determined through the
following estimation techniques; mass balance, emission factors, source testing, and engineering
calculations.
The facility is located at 2301 Carp Road, Ottawa, Ontario, and is zoned as a rural heavy industrial area.
The facility is surrounded by mineral extraction, rural general industrial, rural commercial, and
environmental protection areas. The local terrain is relatively flat; however, source and receptor base
heights were considered in the dispersion modelling analysis through the use of terrain data files
available from the MOE.
Concentrations at points of impingement were predicted using the AERMOD. Modelling input and output
files have been provided on a compact disc included in Appendix A.
The maximum predicted 10-minute odour concentration is higher than the criterion of 1 OU, with a value
of 2.6 at one of the twenty-three assessed discrete receptors. However, the modelling shows that the
criterion of 1 OU is exceeded less than 0.5% annual at the discrete receptor, which is considered
acceptable by the suggested MOE guidance in terms of odour emissions (Methodology for Modelling
Assessments of Contaminants with 10-Minute Average Standards and Guidelines).
Predicted concentrations for all of the contaminants of significance were found to be less than their
respective Standards or guidelines under O. Reg. 419/05 at all receptors in the area. The contaminant
with the greatest percentage of the O. Reg. 419/05 Standard was predicted to be vinyl chloride with a
value of 73%. Therefore, WCEC landfill facility is expected to be in compliance with the requirements of
O. Reg. 419/05.

Emission Summary Table RWDI Project #1302177
Receptor Contaminant CAS Total Air Maximum Averaging MOE Limiting Regulation Percentage
Number Facility Dispersion POI Period POI Effect Schedule of MOE
Emission Model Concentration Limit [1] # POI Limit
Rate Used
(g/s) (µg/m³) (hours) (µg/m³) (%)
Property Line Methyl chloroform (1,1,1-Trichloroethane) 71-55-6 6.00E-05 AERMOD 0.003 24 Hour 115000 Health Schedule 3 < 1%
Property Line 1,1,2-Trichloroethane 79-00-5 7.72E-06 AERMOD 0.0004 24 Hour 0.31 N/A JSL < 1%
Property Line Dichloroethane, 1,1- 75-34-3 1.54E-03 AERMOD 0.07 24 Hour 165 Health Schedule 3 < 1%
Property Line Vinylidene chloride (1,1-Dichloroethene) 75-35-4 5.09E-03 AERMOD 0.61 24 Hour 10 Health Schedule 3 6%
Property Line Ethylene dichloride 107-06-2 1.30E-03 AERMOD 0.2 24 Hour 2 Health Schedule 3 8%
Property Line Dichloroethylene, cis-1,2- 156-59-2 1.05E-01 AERMOD 12.2 24 Hour 105 Health Guideline 12%
Property Line Dichloroethylene, trans-1,2- 156-60-5 1.71E-04 AERMOD 0.008 24 Hour 105 Health Guideline < 1%
Property Line Ammonia 7664-41-7 1.05E-01 AERMOD 12.8 24 Hour 100 Health Schedule 3 13%
Property Line Benzene 71-43-2 6.29E-03 AERMOD 0.05 Annual 0.45 Health Schedule 3 11%
Property Line Carbon tetrachloride 56-23-5 9.94E-06 AERMOD 0.0005 24 Hour 2.4 Health Schedule 3 < 1%
Property Line Chloroethane 75-00-3 2.48E-03 AERMOD 0.24 24 Hour 5600 Health Schedule 3 < 1%
Property Line Chloroform 67-66-3 1.08E-04 AERMOD 0.005 24 Hour 1 Health Schedule 3 < 1%
Property Line Methylene chloride 75-09-2 4.85E-01 AERMOD 58.9 24 Hour 220 Health Schedule 3 27%
Property Line Dimethyl sulphide 75-18-3 8.81E-04 AERMOD 0.37 10 Minute 30 Odour Guideline 1%
Property Line Ethylene dibromide 106-93-4 2.02E-06 AERMOD 0.00009 24 Hour 3 Health Guideline < 1%
R3 Hydrogen sulphide [2] 7783-06-4 1.08E-01 AERMOD 6 10 Minute 13 Odour Schedule 3 49%
Property Line Hydrogen sulphide [2] 7783-06-4 1.08E-01 AERMOD 2 24 Hour 7 Health Schedule 3 24%
Property Line Methane 74-82-8 3.94E-01 AERMOD 48 24 Hour n/a n/a n/a n/a
Property Line Mercaptans [3] 74-93-1 4.71E-06 AERMOD 0.002 10 Minute 13 Odour Schedule 3 < 1%
Property Line Octane 111-65-9 3.33E-03 AERMOD 1.4 10 Minute 61800 Odour Guideline < 1%
Property Line Butyl alcohol, sec- 78-92-2 1.72E-02 AERMOD 0.80 24 Hour 496 N/A JSL < 1%
Property Line Tetrachloroethylene 127-18-4 7.67E-03 AERMOD 0.58 24 Hour 360 Health Schedule 3 < 1%
Property Line Trichloroethylene (TCE) 79-01-6 1.25E-02 AERMOD 1.4 24 Hour 12 Health Schedule 3 12%
Property Line Vinyl chloride 75-01-4 7.87E-03 AERMOD 0.7 24 Hour 1 Health Schedule 3 73%
Property Line Carbon monoxide (single source) 630-08-0 1.61E+01 AERMOD 899 1/2 Hour 6000 Health Schedule 3 15%
Property Line Nitrogen oxides 10102-44-0 3.60E+00 AERMOD 229 1 Hour 400 Health Schedule 3 57%
Property Line Nitrogen oxides 10102-44-0 3.60E+00 AERMOD 84 24 Hour 200 Health Schedule 3 42%
Property Line Suspended particulate matter (< 44 µm diameter) n/a - 1 2.33E+00 AERMOD 41 24 Hour 120 Visibility Schedule 3 34%
Property Line Sulphur dioxide 7446-09-5 2.13E+00 AERMOD 80 1 Hour 690 Health & Vegetation Schedule 3 12%
Property Line Sulphur dioxide 7446-09-5 2.13E+00 AERMOD 60 24 Hour 275 Health & Vegetation Schedule 3 22%Property Line Dioxins, Furans and Dioxin-like PCBs n/a - 2 4.05E-10 AERMOD 8.50E-09 24 Hour 1.00E-07 Health Schedule 3 8%
R8 Odour n/a - 3 7.69E+03 AERMOD 2.6 10 Minute n/a I n/a n/a
Notes:
[1] The term “MOE POI Limit” identified in Table D-4 refers to the following information (there may be more than one relevant MOE POI Limit for each contaminant):
- air quality standards in Schedules 1, 2 and 3 of the Regulation; and
- the guidelines for contaminants set out the MOE publication, “Summary of Standards and Guidelines to Support Ontario Regulation 419: Air Pollution – Local Air Quality"
- an acceptable concentration for contaminants with no standards or guidelines.
[2] A calibration factor of 3 was applied to all hydrogen sulphide concentrations.
[3] For the purposes of the Regulation, mercaptans are expressed as methyl mercaptan; an amount (or concentration of total mercaptans shall be calculated in accordance with the following formula:
A = Ʃ((B x 48) / C), where,
A = the amount (or concentration) of total mercaptans, expressed as methyl mercaptan
B = the amount (or concentration) of each mercaptans
C = the molecular weight of each mercaptan

Reputation Resources Results Canada | USA | UK | India | China | Hong Kong | Singapore www.rwdi.com
WCEC Landfill Emission Summary & dispersion Modelling Report Waste Management of Canada Corporation RWDI#1302177 July 30, 2014
TABLE OF CONTENTS
1. INTRODUCTION AND FACILITY DESCRIPTION ............................................................................... 1
1.1 Purpose and Scope of ESDM Report ........................................................................................... 1
1.2 Description of Process & NAICS Code(S) .................................................................................... 1
1.3 Description of Products and Raw Materials .................................................................................. 1
1.3.1 Fugitive Landfill Emissions from Existing Landfill Mound ................................................. 1
1.3.2 Fugitive Landfill Emissions from Proposed Landfill Mound ............................................... 2
1.3.3 Landfill Collection System, Landfill Gas-Fired Generators and Flares ............................. 2
1.3.4 Contaminated Soil Stockpile ............................................................................................. 3
1.3.5 Leachate Treatment System ............................................................................................. 3
1.3.6 Material Handling and Processing Sources ...................................................................... 4
1.3.6.1 Material Handling Operations .............................................................................. 4
1.3.6.2 Bulldozing Operations.......................................................................................... 4
1.3.6.3 Crushing Operation.............................................................................................. 4
1.4 Process Flow Diagram .................................................................................................................. 4
1.5 Operating Schedule ...................................................................................................................... 5
2. INITIAL IDENTIFICATION OF SOURCES & CONTAMINANTS ......................................................... 5
2.1 New, Modified or Updated Sources Requiring Approval .............................................................. 5
2.2 Existing Approved Sources ........................................................................................................... 6
2.3 Previously Approved Insignificant Sources not Included in The Modelling .................................. 6
3. SIGNIFICANCE OF SOURCES AND CONTAMINANTS .................................................................... 7
3.1 Identification of Negligible Sources ............................................................................................... 7
3.1.1 Insignificant Sources ......................................................................................................... 7
3.1.2 Rationale for Assessment ................................................................................................. 7
3.2 Identification of Insignificant Contaminants ................................................................................... 7
3.2.1 Insignificant Contaminants ................................................................................................ 7
3.2.2 Rationale for Assessment ................................................................................................. 8
4. OPERATING CONDITIONS, EMISSIONS ESTIMATING & DATA QUALITY .................................... 9
4.1 Description of Operating Conditions ............................................................................................. 9
4.1.1 Existing Landfill Mound, LFG Engines and LFG Flares .................................................... 9
4.1.2 Proposed Landfill Mound ................................................................................................... 9
4.1.3 Contaminated Soil Stockpiling ......................................................................................... 10
4.1.4 Leachate Treatment System ........................................................................................... 10
4.1.5 Material Handling and Processing................................................................................... 10
4.2 Explanation of Method Used to Calculate the Emission Rate .................................................... 11
4.2.1 Existing Landfill Mound ................................................................................................... 11
4.2.1.1 Existing Landfill Mound ...................................................................................... 11
4.2.1.2 Landfill Gas Compound Emissions .................................................................... 11
4.2.1.3 Odour Emissions ............................................................................................... 12

Reputation Resources Results Canada | USA | UK | India | China | Hong Kong | Singapore www.rwdi.com
WCEC Landfill Emission Summary & dispersion Modelling Report Waste Management of Canada Corporation RWDI#1302177 July 30, 2014
4.2.2 Proposed Landfill Mound and Active Stage .................................................................... 12
4.2.2.1 Proposed Landfill Mound ................................................................................... 12
4.2.2.2 Landfill Gas Compound Emissions .................................................................... 13
4.2.2.3 Odour Emissions ............................................................................................... 13
4.2.3 Landfill Gas-Fired Generators and Flares ....................................................................... 13
4.2.3.1 Landfill Gas Compound Emissions .................................................................... 14
4.2.3.2 Combustion By-Product Emissions ................................................................... 14
4.2.4 Contaminated Soil Stockpile ........................................................................................... 14
4.2.4.1 Volatile Organic Compound Emissions ............................................................. 14
4.2.5 Leachate Treatment Facility ............................................................................................ 16
4.2.5.1 Volatile Organic Compound and Odour Emissions ........................................... 16
4.2.5.2 Combustion By-Product Emissions ................................................................... 17
4.2.6 Material Handling and Processing Emissions ................................................................. 17
4.2.6.1 Fugitive Dust (Particulate Matter) Emissions .................................................... 17
4.2.6.2 Material Handling Emission Rates ..................................................................... 18
4.2.6.3 Bulldozing Emission Rates ................................................................................ 19
4.2.7 Impact Crusher and Engine ............................................................................................. 19
4.2.7.1 Particulate Matter Emissions ............................................................................. 19
4.2.7.2 Combustion By-Products ................................................................................... 20
4.3 Sample Calculation for each Method .......................................................................................... 20
4.4 Assessment of Data Quality for Each Emission Rate ................................................................. 20
5. SOURCE SUMMARY TABLE & PROPERTY PLAN ......................................................................... 21
5.1 Source Summary Table .............................................................................................................. 21
5.2 Site Plan (Scaleable) ................................................................................................................... 21
6. DISPERSION MODELLING ............................................................................................................... 21
6.1 Dispersion Modelling Input Summary Table ............................................................................... 21
6.1.1 Meteorological Conditions ............................................................................................... 21
6.1.2 Area of Modelling Coverage ............................................................................................ 22
6.1.3 Stack Height for Certain New Sources of Contaminant .................................................. 22
6.1.4 Terrain Data ..................................................................................................................... 23
6.1.5 Averaging Periods Used .................................................................................................. 23
6.2 Land Use Designation Plan ......................................................................................................... 23
6.3 Dispersion Modelling Input and Output Files .............................................................................. 23
7. EMISSION SUMMARY TABLE & CONCLUSIONS ........................................................................... 24
7.1 Emission Summary Table ........................................................................................................... 24
7.2 Contaminants without Standards or Guidelines under O. Reg. 419/05 ...................................... 24
7.3 Odour Criteria .............................................................................................................................. 24
7.4 Landfill Gas Calibration Factor .................................................................................................... 25
7.5 Conclusions ................................................................................................................................. 25

Reputation Resources Results Canada | USA | UK | India | China | Hong Kong | Singapore www.rwdi.com
WCEC Landfill Emission Summary & dispersion Modelling Report Waste Management of Canada Corporation RWDI#1302177 July 30, 2014
Tables
Table 2.1: Source and Contaminants Identification Table Table 5.1: Source Summary Table Table 6.1: Dispersion Modelling Input Summary Table Table 7.1: Emission Summary Table
Figures
Figure 1.4: Process Flow Diagram Figure 5.2: Site Plan Figure 6.1.2: Receptor Locations Figure 6.2: Land Use Zoning and Designation
Appendices
Appendix A: Dispersion Modelling Input & Output Files Appendix B: Negligibility Assessment Appendix C: EA Scenario Comparison Appendix D: Existing Landfill Mound Emissions Appendix E: Proposed Landfill Mound Emissions Appendix F: Flare and Engine-Generator Emissions Appendix G: Contaminated Soil Stockpile Emissions Appendix H: Leachate Treatment System Emissions Appendix I: Leachate Treatment System Emergency Generator Emissions Appendix J: Material Handling Emissions Appendix K: Bulldozing Emissions Appendix L: Impact Crushing and Diesel-Fired Generator Emissions Appendix M: Odour Frequency Analysis Appendix N: Landfill Gas Calibration Factor

Reputation Resources Results Canada | USA | UK | India | China | Hong Kong | Singapore www.rwdi.com
WCEC Landfill Emission Summary & dispersion Modelling Report Waste Management of Canada Corporation RWDI#1302177 July 30 2014
Page 1
1. INTRODUCTION AND FACILITY DESCRIPTION
1.1 Purpose and Scope of ESDM Report
This Emission Summary and Dispersion Modelling (ESDM) report was prepared in support of an
application to amend the following existing Environmental Compliance Approvals (ECA):
ECA #4117-8EHQE7;
ECA #7025-7F4PN5; and
ECA #7816-7C9JMR.
The application for ECA amendment reflects the expansion of the applicant’s West Carleton
Environmental Centre (WCEC) facility located at 2301 Carp Road, Ottawa, Ontario. This application is
being submitted to achieve compliance of Waste Management of Canada Corporation’s (WM) operations
with the requirements of Section 9 of the Environmental Protection Act (EPA), R.S.O. 1990.
Sources and activities subject to the Environmental Activity and Sector Registry are included in this
application for amendment to ECA #4117-8EHQE7, in accordance with a request made under s. 20.18 of
the Environmental Protection Act.
1.2 Description of Process & NAICS Code(S)
WM’s WCEC is a waste disposal facility receiving municipal, industrial, commercial, and institutional
wastes. The North American Industry Classification Scheme (NAICS) code that best applies to WM’s
WCEC landfill is 562210 – “Waste Disposal and Treatment”. This facility is part of Schedule 5 identified
by a NAICS code listed in Schedule 5 and shall comply with Schedule 3 standards using an approved
dispersion model (AERMOD), effective February 1, 2013.
1.3 Description of Products and Raw Materials
The raw material for the landfilling operations consists of various municipal, industrial, commercial and
institutional wastes. The landfill operations do not produce any products; instead landfill gases and
leachate are generated as by-products of the landfill operations.
Detailed descriptions for the existing, modified or new operations at the WCEC landfill facility are provided
in the following sections.
1.3.1 Fugitive Landfill Emissions from Existing Landfill Mound
The existing landfill mound under final cover is the portion of the WCEC landfill where waste is no longer
being deposited. The existing landfill is closed and the entire landfill mound is under final cover. This
area is characterized by the presence of a clay landfill cap and LFG collection system. The top portion of
the landfill is covered with a heavy polymer membrane (beanie). The total landfill final cover area is
estimated to be approximately 34.46 ha (344,600 m2) with a final peak height of 174 m above sea level.

Reputation Resources Results Canada | USA | UK | India | China | Hong Kong | Singapore www.rwdi.com
WCEC Landfill Emission Summary & dispersion Modelling Report Waste Management of Canada Corporation RWDI#1302177 July 30 2014
Page 2
Fugitive emissions of LFG compounds may occur from the final cover area, due to the release of LFG
through the surface of the landfill. The LFG collection system in the final cover area of the landfill serves
to extract the LFG from the mound, thus reducing the amount of LFG available to escape through the
surface of the mound. In addition, the cover material filters and limits the ability of the LFG to be released
through the surface of the landfill. However, even with the LFG collection system and cap in place, some
LFG is released through the atmosphere through the final cover.
The existing landfill mound, with a final cover in place and extraction wells installed, has an overall LFG
collection efficiency of 85%.
1.3.2 Fugitive Landfill Emissions from Proposed Landfill Mound
The proposed landfill area is the portion of the landfill where accepted waste will be deposited at an
estimated rate of 400,000 tonnes per year, equivalent to a total waste tonnage of 4,000,000 tonnes. The
material accepted will consist primarily of institutional, commercial and industrial waste, as well as
residential waste and “special” waste. “Special” waste consists primarily of contaminated soils that may
be used for daily or interim covers. The composition of the waste stream is expected to vary based on
actual waste sources.
The rate of LFG generation within the proposed landfill mound will be dependent on the quantity of waste
placed. Fugitive emissions through the surface of the daily cover, interim cover and final cover of LFG
compounds may occur. The proposed LFG collection system will serve to extract LFG from the mound,
thus reducing the amount of LFG available to escape through the surface of the mound. In addition, the
cover material filters and limits the ability of the LFG to be released through the surface of the landfill.
However, even with the LFG collection system and covers in place, some LFG is released through the
atmosphere through the daily cover, interim cover, final cover.
The LFG collection system serving the proposed landfill mound will be designed and constructed to have
the capability of achieving an overall collection efficiency of 85%.
1.3.3 Landfill Collection System, Landfill Gas-Fired Generators and Flares
Currently, a landfill gas (LFG) collection system is serving the existing landfill mound. A similar system is
to be implemented to serve the proposed landfill mound. These LFG collection systems supply the LFG
to the on-site electricity generation system at the landfill-gas-to-energy (LGTE) facility and to on-site flares.
The LGTE facility consists of five reciprocating engine-generator sets, all located inside a building near
the southeast corner of the property boundary, along Carp Road. The engine-generators are used to
combust the landfill gases and the energy generated through the combustion reaction is used to supply
up to 8 MW of electricity to the municipal grid.

Reputation Resources Results Canada | USA | UK | India | China | Hong Kong | Singapore www.rwdi.com
WCEC Landfill Emission Summary & dispersion Modelling Report Waste Management of Canada Corporation RWDI#1302177 July 30 2014
Page 3
Currently, two types of engine-generator sets are in place at the landfill gas-to-energy (LGTE) facility.
Due to the proposed landfill expansion, the smaller engine-generator sets with a power rating of
800 kilowatts (kW) may be replaced with the larger engine-generator sets with a power rating of 1,600 kW.
In effort to conservatively assess emissions from the landfill gas-fired engine-generators and in
anticipation of the increased LFG generation, this assessment is based on the installation of the larger
1,600 kW engine-generator sets. This configuration of generators (in combination with the flare
configuration, the recommended LFG collection efficiency, and potential LFG generation) is expected to
have the capacity to handle the LFG collected by the LFG collections systems from both the existing and
proposed landfills.
In addition to supplying LFG to the landfill gas-fired engine-generator sets, the LFG collection systems
also supply LFG generated from the existing landfill and the preferred landfill to three flares. The flares
are utilized to combust and destroy the LFG that was not sent to the generators.
1.3.4 Contaminated Soil Stockpile
The WCEC landfill will receive contaminated soil or ‘special’ waste from off-site locations for use as daily
cover. The majority of this soil is likely to be petroleum fuel-contaminated and to contain fuel-related
VOCs such as benzene and other light aromatics. The contaminated soil will be stockpiled near the haul
routes for daily access, located in the adjacent cell south of the active stage of the proposed landfill. The
contaminated soil stockpile is expected to not exceed a surface area of approximately 4,000 m2.
1.3.5 Leachate Treatment System
WM has proposed to collect the leachate generated at the closed existing landfill mound and send it to
an-site leachate treatment system. Similarly, the leachate generated at the proposed landfill will also be
collected and sent to the proposed leachate treatment system. The leachate will be treated on-site using
a sequencing batch reactor (SBR) system. The SBR leachate treatment system is a single train. The
tanks associated with the SBR system operation will include the raw leachate equalization tank, the SBR
tank, the effluent equalization tank, and the sludge tank. Raw leachate from the leachate collection wells
will be pumped to an equalization tank for storage. From the equalization tank, raw leachate will be
pumped using leachate transfer pumps to the SBR tank.
The SBR system operates on a batch cycle which includes the following steps:
Fill cycle – in the fill cycle the raw leachate is pumped into the SBR tank to fill the tank to a preset
level;
React cycle – in the react cycle the SBR tank contents are aerated and the biological decomposition
of the leachate occurs;
Settle phase – after the reaction phase, the aeration and mixing of the SBR is stopped and the mixed
liquor suspended solids are allowed to settle;
Decant phase – in the decant phase the clarified effluent is decanted from the top of the SBR tank to
the treated leachate effluent tank; and
On a periodic basis, waste activated sludge is pumped from the SBR tank to the sludge storage tank.

Reputation Resources Results Canada | USA | UK | India | China | Hong Kong | Singapore www.rwdi.com
WCEC Landfill Emission Summary & dispersion Modelling Report Waste Management of Canada Corporation RWDI#1302177 July 30 2014
Page 4
1.3.6 Material Handling and Processing Sources
Handling of particulate matter-generating materials, such as overburden materials and contaminated soil,
will occur daily during construction operations and normal landfilling operations. These operations
include:
Material loading at contaminated soil stockpile, overburden stockpile, construction working face, and
landfill working face;
Material unloading at the contaminated soil stockpile, construction working face, and landfill working
face;
Bulldozing at the overburden stockpile and construction working face; and
Crushing of aggregate material at the Impact Crusher near the WTFP.
1.3.6.1 Material Handling Operations
Both material loading and unloading generate particulate matter emissions. Material loading into haul
trucks is completed using loader bucket at the contaminated soil stockpile, the overburden stockpile, the
construction working face and the landfill working face. Material unloading is completed when the haul
truck bed is lifted up to dump its material at the construction working face and the landfill working face.
1.3.6.2 Bulldozing Operations
Bulldozing is also a particulate matter emission generating activity, which occurs at the landfill overburden
stockpile in the southwest corner of the proposed landfill and at the construction working face. Bulldozing
will be limited to the approximate surface areas of 4,000 m2 and 900 m
2 for the overburden stockpile and
construction working face, respectively.
1.3.6.3 Crushing Operation
WM has proposed to operate an impact crusher to allow for on-site crushing of aggregate material, a
process with the potential to also generate particulate matter emissions. At the time of the assessment,
data for the crushing operations was not available and therefore a typical impact crusher processing
capacity was taken from an impact crusher unit used by WM at another facility, previously evaluated by
RWDI. The crushing process consists of one impact crusher, having a processing rate of 200 tonnes per
hour. One 300 hp diesel engine is used to power the crushing plant.
1.4 Process Flow Diagram
Figure 1.4 in the Figures Section provides the process flow diagram(s) for the facility.

Reputation Resources Results Canada | USA | UK | India | China | Hong Kong | Singapore www.rwdi.com
WCEC Landfill Emission Summary & dispersion Modelling Report Waste Management of Canada Corporation RWDI#1302177 July 30 2014
Page 5
1.5 Operating Schedule
The landfill operates from 6:00 to 20:00 with waste receipt and the Waste Transfer and Processing
Facility (WTPF) operating from 7:00 to 19:00. The landfill and the WTPF facility are assumed to operate
year-round.
Landfill construction activities such as bulldozing at the overburden pile and at the construction working face
are not assumed to be continuous and these activities are limited to occur during the landfill hours of
operation. Similarly, the diesel-fired impact crusher operation is not assumed to be continuous and will only
occur during the hours of operation for the WTPF.
All other equipment such as the landfill gas flares, the landfill gas-fired generators, the leachate treatment
system, and the emergency diesel-fired generator (providing back-up power for the leachate treatment
facility) are assumed to operate continuously.
2. INITIAL IDENTIFICATION OF SOURCES & CONTAMINANTS
Table 2.1 in the Tables Section provides the Source and Contaminants Identification Table. A list of the
sources included in this ESDM Report is provided below:
2.1 New, Modified or Updated Sources Requiring Approval
One (1) existing capped landfill mound (Source ID: LM_EX), previously used for the landfilling of solid
waste materials. The landfill mound produces landfill gas, the majority of which is collected and sent
to the LGTE facility or to the flares for destruction. The landfill gas not collected is released from the
landfill mound in a fugitive manner;
One (1) landfill mound (Source ID: LM_PP), used for the landfilling of solid waste materials. The
landfill mound produces landfill gas, the majority of which is collected and sent to the LGTE facility or
to the flares for destruction. The landfill gas not collected is released from the landfill mound in a
fugitive manner;
Five (5) 1,600 kW landfill gas-fired engine-generator sets (Source ID: E1, E2, E3, E4 and E5) for a
total power rating of 8.0 kW and a maximum LFG firing rate of 0.28 m3 per second;
One (1) enclosed flare system (Source ID: F1), used to incinerate the landfill gases from a landfill gas
collection system at a maximum volumetric gas flow rate of 0.57 cubic metres per second based on a
methane content of 50 percent by volume. The landfill flare has a maximum heat input of 41.7
gigajoules per hour;
One (1) enclosed flare system (Source ID: F2), used to incinerate the landfill gases from an expanded
landfill gas collection system at a maximum volumetric gas flow rate of 1.04 cubic metres per second
based on a methane content of 50 percent by volume. The landfill flare has a maximum heat input of
70.7 gigajoules per hour;

Reputation Resources Results Canada | USA | UK | India | China | Hong Kong | Singapore www.rwdi.com
WCEC Landfill Emission Summary & dispersion Modelling Report Waste Management of Canada Corporation RWDI#1302177 July 30 2014
Page 6
One (1) candlestick flare system (Source ID: F3), used to incinerate the landfill gases from a landfill
gas collection system at a maximum volumetric gas flow rate of 1.0 standard m3 per second based on
a methane content of 50 percent by volume;
One (1) raw leachate equalization tank (Source ID: RAWLEACH), which is an outdoor above-ground
storage tank;
One (1) SBR tank (Source ID: SBR), which is an outdoor above-ground storage tank, exhausting
through a passive vent;
One (1) effluent equalization tank (Source ID: EFFLUENT), which is an outdoor above-ground
storage tank, exhausting through a passive vent;
One (1) sludge holding tank (Source ID: SLUDGE), which is an outdoor above-ground storage tank,
exhausting through a passive vent;
One (1) 300 hp diesel-fired engine (Source ID: CR_ENG) used to provide power to the impact
crusher;
Crushing of aggregate material at the Impact Crusher (Source ID: CR) near the Waste Transfer
Facility;
Material loading and unloading at contaminated soil stockpile (Source ID: CSS_MH);
Material loading at overburden stockpile (Source ID: OB_MH);
Material loading the construction working face (Source ID: CWS_MH);
Material loading at the landfill working face (Source ID: ACTFCE);
Material unloading at the construction working face (Source ID: CF_UNL);
Material unloading at the landfill working face (Source ID: ACT_UNL);
Bulldozing at the overburden stockpile (Source ID: OB_BD); and
Bulldozing at the construction working face (Source ID: CF_BD).
2.2 Existing Approved Sources
One (1) 320 kW emergency diesel-fired generator (Source ID: LEACHGEN) used to provide back-up
power for the leachate treatment facility.
2.3 Previously Approved Insignificant Sources not Included in The Modelling
One (1) exhaust (Source ID: B3), to serve the gas stripper in the Blower Building used to remove
methane and non-methane organic compounds from the wastewater before its discharge to sanitary
sewer; and
One (1) landfill gas-fired boiler (Source ID: BOILER), used at the leachate facility to provide heating
for the SBR process, with a maximum heat input of 2 111 000 kilojoules per hour.

Reputation Resources Results Canada | USA | UK | India | China | Hong Kong | Singapore www.rwdi.com
WCEC Landfill Emission Summary & dispersion Modelling Report Waste Management of Canada Corporation RWDI#1302177 July 30 2014
Page 7
3. SIGNIFICANCE OF SOURCES AND CONTAMINANTS
3.1 Identification of Negligible Sources
3.1.1 Insignificant Sources
The following sources were determined to be insignificant:
One (1) exhaust (Source ID: B3), to serve the gas stripper in the Blower building; and,
One (1) landfill gas-fired boiler (Source ID: Boiler), used at the leachate treatment facility to
provide heating for the SBR process.
3.1.2 Rationale for Assessment
The gas stripper exhaust (B3) and landfill gas-fired boiler (BOILER) were both deemed to be insignificant
based on MOE guidance. The MOE states that: sources which, in combination, represent less than 5%
of total property–wide emissions of a contaminant can, in many cases, be considered insignificant
sources.
Emissions for the gas stripper exhaust (B3) were calculated in the 2008 ESDM and found to be less than
1% of the site-wide totals for all contaminants, previous to adding emissions from proposed landfill.
The significance of the landfill gas-fired boiler (BOILER) was assessed based on its maximum landfill gas
consumption. This source can consume up to 0.032 m³/s of landfill gas. The total landfill gas consumed
by combustion equipment at the WCEC Landfill facility (including the flares, LFG engines, and the boiler)
is 4.04 m³/s. Since the BOILER consumes less than 1% of the landfill gas, it would be expected to
release less than 1% of the total site-wide emissions from landfill gas combustion.
3.2 Identification of Insignificant Contaminants
3.2.1 Insignificant Contaminants
The following contaminants were determined to be insignificant:
1,1,2,2-Tetrachloroethan (CAS# 79-34-5); Fluorene (CAS# 86-73-7);
1,3,5 Trimethylbenzene (CAS# 108-67-8); Lead (CAS# 7439-92-1);
1,4 Dichlorobenzene(-p) (CAS#106-46-7); Magnesium (CAS# 7439-95-4);
1-Methylnaphthalene (CAS# 90-12-0); Manganese (CAS# 7439-96-5);
1-Methylphenanthrene (CAS# 832-69-9); Mercury (CAS# 7439-97-6);
2-Methylnaphthalene (CAS# 91-57-6); Methyl Ethyl Ketone (2-Butanone) (CAS# 78-93-3);
Acenaphthylene (CAS# 120-12-7); Molybdenum (CAS# 7439-98-7);
Acetone (2-Propanone) (CAS# 67-64-1); Naphthalene (CAS# 91-20-3);
Aluminum (CAS# 7429-90-5); Nickel (CAS# 7440-02-0);

Reputation Resources Results Canada | USA | UK | India | China | Hong Kong | Singapore www.rwdi.com
WCEC Landfill Emission Summary & dispersion Modelling Report Waste Management of Canada Corporation RWDI#1302177 July 30 2014
Page 8
Antimony (CAS# 7440-36-0); Phenanthrene (CAS# 85-01-8);
Arsenic (CAS# 7440-38-2); Phenol (CAS# 108-95-2);
Biphenyl (CAS# 92-52-4); Phosphorus (CAS# 7723-14-0);
Bis(2-Ethylhexyl)Phthalate (CAS# 117-81-7); Potassium (CAS# 7440-09-7);
Boron (CAS# 7440-42-8); Quinoline (CAS# 91-22-5);
Bromodichloromethane (CAS# 75-27-4); Selenium (CAS# 7782-49-2);
Cadmium (CAS# 7440-43-9); Sodium (CAS #7440-23-5);
Calcium (CAS# 7440-70-2); Styrene (CAS# 100-42-5);
Chlorobenzene (CAS#108-90-7); Sulphate (CAS# 18785-72-3);
Chloromethane (methylchloride) (CAS# 74-87-3); Tin (CAS #7440-31-5);
Chromium (total) (CAS #7440-47-3); Titanium (CAS# 7440-32-6);
Cobalt (CAS# 7440-48-4); Toluene (CAS# 108-88-3);
Copper (CAS# 7440-50-8); Xylene (CAS# 1330-20-7); and
Ethylbenzene (CAS# 100-41-4); Zinc (CAS# 7440-66-6).
3.2.2 Insignificant Contaminants
Contaminants that were measured in the source testing for the landfill gas engines but were not present
in detectable quantities in the laboratory analysis were deemed to be insignificant.
The leachate treatment facility (which includes the SBR system) portion of the assessment deals with
volatile compounds as identified from sampling of raw leachate from the existing WCEC landfill and
projected leachate quality parameters from WM’s Twin Creeks landfill. The sampling results and list of
projected leachate quality parameters can be found in Appendix H1 and H2. Compounds that were not
detected (i.e., below sampling detection limits) were deemed to be insignificant. Non-volatile compounds,
such as metals, were assumed to remain in the liquid leachate and were also deemed to be insignificant.
Contaminant emissions unique to the leachate management system were compared to a calculated site-
specific emission threshold to evaluate whether the contaminant is significant. The Emission Threshold is
calculated using a MOE conservative dispersion factor (μg/m³ per g/s emission) and the relevant standard
or guideline under O. Reg. 419/05. For chemicals without standards or guidelines under O. Reg. 419/05,
the MOE de minimus POI concentrations (24-hour average basis) presented in Appendix B of the MOE’s
Procedure for Preparing an ESDM Report, Version 3.0, March 2009, can be applied. The dispersion
factor used to calculate the emission threshold is based on the separation distance between the leachate
treatment system sources and the nearest POI. Detailed calculations can be found in Appendix B.

Reputation Resources Results Canada | USA | UK | India | China | Hong Kong | Singapore www.rwdi.com
WCEC Landfill Emission Summary & dispersion Modelling Report Waste Management of Canada Corporation RWDI#1302177 July 30 2014
Page 9
4. OPERATING CONDITIONS, EMISSIONS ESTIMATING &
DATA QUALITY
Section 10 of O. Reg. 419/05 states that, for the purposes of an ESDM report, an acceptable operating
scenario to consider is one that would result, for a given contaminant, in the highest concentration of that
contaminant at Points of Impingement (POI’s) that the facility is capable of causing. To satisfy this
requirement, a maximum production scenario was developed in consultation with WM. This scenario
examined the maximum processing rate that the facility could be expected to achieve. This consists of
simultaneous operation of all on-site sources at a maximum capacity, including the LGTE facility engine-
generator sets, the landfill gas flares, the leachate treatment system and generators. The assessment
also considered the concurrent maximum level of fugitive releases from the existing and proposed landfill
mounds as well as material handling and processing emissions.
In the Detailed Impact Assessment prepared as part of the Environmental Assessment Application, the
potential air quality impacts that would results from the construction and operation of the proposed landfill
were assessed at two worst case future build stages and phases of development. The scenarios
assessed were:
An intermediate operation scenario; and
A final operating scenario.
Based on the results outlined in the Detailed Impact Assessment, the maximum predicted concentrations
for the vast majority of the contaminants assessed were observed as a result of the intermediate
operation scenario. The intermediate operation scenario was therefore chosen as the worst-case
scenario evaluated as part of this assessment.
4.1 Description of Operating Conditions
4.1.1 Existing Landfill Mound, LFG Engines and LFG Flares
All five 1,600 kW engine-generators and all three flares were assumed to be operating at a maximum
capacity for 24 hours per day, 365 days per year, concurrent with the maximum fugitive landfill gas
releases through the existing landfill mound. The existing landfill mound has a LFG collection system in
place, with 85% collection efficiency.
4.1.2 Proposed Landfill Mound
For the intermediate operation scenario, it was assumed that Phase 1 was completed and therefore half
of the total waste, approximately 2,000,000 tonnes, had been deposited in all eight stages of the landfill.
It was assumed that this area will be characterized by the presence of a LFG collection system with a
collection efficiency of 85%. Phase 2 was also assumed to have commenced, and approximately
250,000 tonnes of waste was deposited in Stage 1.

Reputation Resources Results Canada | USA | UK | India | China | Hong Kong | Singapore www.rwdi.com
WCEC Landfill Emission Summary & dispersion Modelling Report Waste Management of Canada Corporation RWDI#1302177 July 30 2014
Page 10
As a conservative approach, it was assumed that the entire surface area (47,250 m2) of Stage 1 was
considered the “active stage”. The active stage was defined as the area where waste was deposited
during the year in which the intermediate operation scenario takes place. The active stage is also
assumed to contain an interim cover area, which includes a 900 m2 working face where landfilling would
actively occur. The active stage would not have a completely installed LFG collection system, therefore
the LFG collection efficiency for the active stage area would only be 50%.
In addition to the active stage occurring in Stage 1, it was assumed that construction operations occur
simultaneously in Stage 3. Both the landfill and construction working faces were assumed to be placed in
the northeast corner of Stage 1 and Stage 3, respectively, as this represents a worst case location due to
the close proximity of the property boundary and sensitive receptors.
4.1.3 Contaminated Soil Stockpiling
The contaminated soil stockpile was assumed to have a surface area of 4,000 m2, based on the size of
the contaminated soil stockpile at the existing landfill mound during its peak operation (in 2004). The
contaminated soil stockpile was modelled in a worst-case location near the southwest corner of the
proposed landfill. As a conservative estimate the contaminant soil stockpile was modelled at a height of
zero metres above grade.
4.1.4 Leachate Treatment System
The WCEC leachate treatment systems (SBR system) will treat leachate collected from the existing and
proposed landfills. Although the SBR is a batch system, the sources were conservatively assumed to be
emitting continuously.
All four leachate treatment tanks (equalization tank, SBR, effluent tank and sludge tank) were assumed to
be emitting contaminants simultaneously and at a maximum capacity, for 24 hours per day, 365 days per
year.
The emergency diesel generator serving the leachate treatment system was also assumed to be
operating at maximum capacity, as part of a routine scheduled testing. As a conservative estimate, it was
assumed that the emergency diesel generator was operating 24 hours per day, 365 days per year.
4.1.5 Material Handling and Processing
Material handling activities, bulldozing activities and crushing operations are assumed to take place at the
WCEC landfill all year-round.
Landfill construction activities such as bulldozing at the overburden pile and at the construction working face
are not assumed to be continuous and these activities are limited to occur during the landfill hours of
operation (from 7:00 to 17:00). Similarly, the diesel-fired impact crusher operation is not assumed to be
continuous and will only occur during the hours of operation for the WTPF (from 7:00 to 19:00).
The crushing operations assume that the impact crusher has a maximum processing rate of 200 tonnes
per hour.

Reputation Resources Results Canada | USA | UK | India | China | Hong Kong | Singapore www.rwdi.com
WCEC Landfill Emission Summary & dispersion Modelling Report Waste Management of Canada Corporation RWDI#1302177 July 30 2014
Page 11
4.2 Explanation of Method Used to Calculate the Emission Rate
4.2.1 Existing Landfill Mound
4.2.1.1 Existing Landfill Mound
The United States Environmental Protection Agency’s (U.S. EPA) Landfill Gas Emissions Model
(LANDGEM) was used to calculate LFG generation rates and estimate the emission rates for the LFG
compounds from the existing closed landfill mound.
The key inputs in the LANDGEM program are the methane generation rate (k) and the methane
generation capacity (L0). The LFG generation of 0.72 m3/s was based on the recommended k and L0
values for Ontario landfills from Environment Canada’s GHG Quantification Guidance - Emission Factors
from Canada's GHG Inventory – Waste obtained in May 2011 (k=0.045, L0=83). These values were
selected as they represent the most recent guidance for landfills in Ontario.
When comparing to the available metered LFG consumption data from the LGTE facility in 2010 and the
LFG flares, the actual amount of gas combusted exceeded the LANDGEM predicted amount of gas
generated. The reason for this discrepancy is likely attributed to the unknown and estimated historical
waste acceptance rate at the existing landfill. Therefore, the metered consumption data was used in
combination with the estimated collection efficiency of the LFG collection system to back calculate the
amount of LFG generated by the landfill 2010 and determine a correction factor that can be applied to
determine future year LFG generation from the existing landfill.
The LANDGEM model and correction factor were used to calculate LFG generation for the existing
WCEC landfill for the intermediate operation scenario (which approximately corresponds to the 2018
calendar year). For the existing landfill, it was assumed that the LFG collection system is installed serving
the entirety the mound, and operating with an estimated LFG collection efficiency 85%.
Please refer to Appendix D for additional details and sample calculations.
4.2.1.2 Landfill Gas Compound Emissions
To ensure the use of conservative LFG emission rates, a comparison of the calculated emission rates
and source testing results was completed.
Emission rates are calculated using the concentration of compounds in LFG in combination with the
maximum LFG consumption rate for each piece of equipment. To determine the concentration of
compounds in the LFG, on-site measurement of LFG compounds were taken on June 10, 2004 and April
4, 2011. The two datasets (2004 and 2011) were reviewed against each other to note any changes in the
LFG composition due to the improvements to the LFG collection system. The average concentration for
each individual compound was calculated separately for the 2004 samples and the 2011 samples. The
2004 and 2011 average concentrations were compared to one another, and the higher of the two was
used to develop the emission rate for the LFG compounds in this ECA assessment.

Reputation Resources Results Canada | USA | UK | India | China | Hong Kong | Singapore www.rwdi.com
WCEC Landfill Emission Summary & dispersion Modelling Report Waste Management of Canada Corporation RWDI#1302177 July 30 2014
Page 12
Between the calculated emission rates and source testing results, the maximum emission rate for each
contaminant was selected for use in the dispersion modelling. For all compounds, the calculated
emission rates based on the equipment maximum LFG consumption rate and the highest concentration
measures in LFG yielded the more conservative emission rate with the exception of benzene. The
emission rate for benzene was based on the source testing results.
The emission rates for each of the LFG compounds from the existing landfill mound were calculated by
using the measured concentration (in milligrams per cubic metres) taken on June 10, 2004 or April 4,
2011 in combination with the amount of LFG released fugitively from the landfill (in cubic metres per year)
(refer to methodology described in Section 4.2.1).
Please refer to Appendix D for additional details and sample calculations.
4.2.1.3 Odour Emissions
The odour emission rates were estimated through the use of emission factors based on LFG generation
rates and collection efficiencies described previously in Section 4.2.2 and the Ministry of Environment
recommended odour concentration of 10,000 OU/m3 of LFG, outlined in the MOE’s “Interim Guide to
Estimate and Assess Landfill Air Impacts”, 1992.
Please refer to Appendix D for additional details and sample calculations.
4.2.2 Proposed Landfill Mound and Active Stage
4.2.2.1 Proposed Landfill Mound
The United States Environmental Protection Agency’s (U.S. EPA) Landfill Gas Emissions Model
(LANDGEM) was used to calculate LFG generation rates and estimate the emission rates for the LFG
compounds from the proposed landfill mound.
The key inputs in the LANDGEM program are the methane generation rate (k) and the methane
generation capacity (L0). The LFG generation of 0.72 m3/s was based on the recommended k and L0
values for Ontario landfills from Environment Canada’s GHG Quantification Guidance - Emission Factors
from Canada's GHG Inventory – Waste obtained in May 2011 (k=0.045, L0=83). These values were
selected as they represent the most recent guidance for landfills in Ontario.
In contrast to determining the LFG generated from the existing landfill, a correction factor was not applied
in determining the LFG generated from the proposed landfill. The reason a correction factor was not
applied was due to WM plans to execute diversion efforts and accept less organic material at the
proposed landfill, resulting in lower LFG generation rates. Also, unlike the historical waste acceptance at
the existing landfill, the waste acceptance at the proposed landfill will be well documented. For these
reasons, it is thought that the LFG generation estimated using the LANDGEM model will be more
accurate and little discrepancy will occur when compared to the future metered consumption data.

Reputation Resources Results Canada | USA | UK | India | China | Hong Kong | Singapore www.rwdi.com
WCEC Landfill Emission Summary & dispersion Modelling Report Waste Management of Canada Corporation RWDI#1302177 July 30 2014
Page 13
For the proposed landfill footprint, the estimated gas collection efficiency of the LFG collection system
varies between the portions of the landfill with final cover (85% collection) and the active stage of the
landfill (50% collection).
4.2.2.2 Landfill Gas Compound Emissions
The emission rates for the LFG compounds from the proposed landfill mound were calculated by
assuming that the concentration in the raw LFG produced by the proposed landfill would be the same as
the measured concentrations found in the raw LFG of the existing landfill (refer to methodology described
in Section 4.2.1.1) in combination with the LFG generation rates and LFG collection efficiencies described
in the previous section.
Please refer to Appendix E for additional details and sample calculations.
4.2.2.3 Odour Emissions
The odour emission rates from the proposed landfill mound were estimated using the LFG generation
rates and the collection efficiency described in Section 4.2.3 as well as the Ministry of Environment
recommended odour concentration of 10,000 OU/m3 of LFG, outlined in the MOE’s “Interim Guide to
Estimate and Assess Landfill Air Impacts”, 1992.
Odour emission rates from the working face area of the active stage were determined through flux
chamber measurements taken at various representative landfill sites in Ontario such as Ridge Landfill,
Britannia Road Sanitary Landfill, Trail Road Landfill and Walker Landfill. Flux chamber measurements
are used to directly measure the odour emission rate originating from the surface of interest.
The odour emission samples were collected using a stainless flux chamber. The flux chamber was
placed on the surface of the working face and the bottom edge of the chamber was forced a short depth
down into the surface to create a seal. The flux chamber was operated under a slight positive pressure to
further prevent outside air from entering underneath the walls and into the chamber.
Samples were collected and submitted for analysis by an odour panel, a representative group of the
population that smell and characterize diluted odour samples to quantitatively determine the strength of
the odour source in odour units. The 90th percentile concentration from the samples collected on each
source was used in determining the emission rate for the source.
Please refer to Appendix E for additional details and sample calculations.
4.2.3 Landfill Gas-Fired Generators and Flares
Source testing was conducted for both the landfill gas-fired engine-generator sets and flares to measure
concentrations of LFG compounds as well as combustion by-products. The source testing conducted on
the landfill gas-fired engine-generators were completed and summarized in RWDI Report #0925116:
“Stack Sampling Program”, dated November, 2010. The source testing conducted on the flares were
completed and summarized in RWDI Memo Report #W07-5143A: “Results of Stack testing on the Flare
Stack, Carp Road Landfill, March Testing Program”, dated June, 2007.

Reputation Resources Results Canada | USA | UK | India | China | Hong Kong | Singapore www.rwdi.com
WCEC Landfill Emission Summary & dispersion Modelling Report Waste Management of Canada Corporation RWDI#1302177 July 30 2014
Page 14
The destruction efficiency of the landfill gas-fired generators was estimated to be 97% and the destruction
efficiency of the landfill gas-fired flares was estimated to be 98%. This is based on guidance in the final
version of the U.S. EPA AP-42 Emission Factor Document (AP-42), Chapter 2.4 Municipal Solid Waste
Landfills, dated November 1998,
4.2.3.1 Landfill Gas Compound Emissions
The emission rates for each of the LFG compounds from the existing landfill and proposed landfill
mounds were calculated by using the measured concentration (in milligrams per cubic metres) taken on
June 10, 2004 or April 4, 2011 (refer to methodology described in Section 4.2.1.1) in combination with the
total amount of LFG released fugitively from the landfills (in cubic metres per year).
Please refer to Appendix F for additional details and sample calculations.
4.2.3.2 Combustion By-Product Emissions
Emissions from the landfill gas-fired engine-generators and flares also include combustion by-products
such as total suspended particulate, carbon monoxide, nitrogen oxides and dioxins and furans.
LFG-fired engine-generators’ particulate matter emission rates were calculated using information
provided in Chapter 2.4 of AP-42. The LFG-fired generators’ nitrogen oxides, carbon monoxide and
dioxins and furans emission rates are based on the source testing results.
Most flares’ nitrogen oxides, carbon monoxide and particulate matter emission rates were calculated
based on Chapter 2.4 of AP-42, with the exception of the nitrogen oxides emission rate from Flare 2,
which was based on source testing results. The dioxins and furans emission rates for all three flares are
also based on the source testing, as it is the best available data.
Please refer to Appendices F for additional details and sample calculations.
4.2.4 Contaminated Soil Stockpile
4.2.4.1 Volatile Organic Compound Emissions
The contaminated soil accepted and utilized at the proposed landfill is expected to be similar in nature to
the soil previously accepted at the existing landfill. The majority of soil used at the existing landfill was
petroleum fuel-contaminated and contained fuel-related VOCs such as benzene and other light aromatic
compounds. The results from a flux chamber measurement program for the existing landfill contaminated
soil stockpiles were the most appropriate method to estimate the emissions for this source.

Reputation Resources Results Canada | USA | UK | India | China | Hong Kong | Singapore www.rwdi.com
WCEC Landfill Emission Summary & dispersion Modelling Report Waste Management of Canada Corporation RWDI#1302177 July 30 2014
Page 15
In 2004, a flux chamber measurement program, as presented in RWDI Report #041491: “Landfill Gas
Assessment Ottawa Landfill Baseline Conditions”, dated March, 2005 was used to determine the
emission rate originating from the contaminated soil stockpiles. The composition of the contaminated soil
stockpiles is expected to vary based on actual soil accepted, therefore a total of six samples were
collected over the course of two days; July 7 and 8, 2004, to determine “typical” concentrations of
contaminants in the contaminated soil stockpiles. As emissions of VOCs from the soil will generally
decrease with increasing surface exposure time, the majority of the samples were taken from piles that
had been deposited less than one hour prior to the commencement of sampling. The remaining samples
were collected from piles that were less than 24 hours old. In addition, the emissions are expected to be
highest during the summer months, since the volatilization of VOCs will be greater at higher temperatures.
The emission rates determined from the July sampling results were applied to the contaminated soil
stockpiles on an annual basis.
The soil emission samples were collected using a flux chamber. This flux chamber was 71 cm in
diameter, 31 cm high constructed of 14 gauge stainless steel, as per the designer specifications (Reinhart,
Cooper and Walker, 1992). The flux chamber was placed on the surface of the contaminated soil pile
and the bottom edge of the chamber was forced a short depth down into the surface to create a seal.
The flux chamber was operated under a slight positive pressure (0.045 inches H2O) to further prevent
outside air from entering underneath the walls and into the chamber, as recommended by the designer
(Reinhart, Cooper and Walker, 1992).
The flux chamber was first purged with a sweep gas of nitrogen to minimize biasing of gas emission rates
and produce accurate measurements. After the flux chamber had been purged, a VOC sample was
drawn from the chamber using a four-phase stainless steel absorbent tube. The sample was collected
using the VOC sample train, in accordance with the U.S. EPA Method TO-17. An average flow rate of
406 mL/min was maintained for approximately 25 minutes, resulting in sample volumes ranging from 8.8
to 11.1 liters. The sample tubes were sent to OSB Laboratories in Brampton to be analyzed for all of 24
LFG species.
The sample results indicate that the most of the contaminants were not emitted from the contaminated
soil stockpile in concentrations above the laboratory detection limit. Emission flux rates (in grams per
square metre per second) were determined for the following eight compounds, which were found to be
emitted from the contaminated soil stockpiles:
1,1,1-Trichloroethane; Octane;
1,2-Dichloroethane; 2-Butanol;
Benzene; Tetrachloroethylene; and
Dichloromethane; Trichloroethylene.
Please refer to Appendix G for additional details and sample calculations.

Reputation Resources Results Canada | USA | UK | India | China | Hong Kong | Singapore www.rwdi.com
WCEC Landfill Emission Summary & dispersion Modelling Report Waste Management of Canada Corporation RWDI#1302177 July 30 2014
Page 16
4.2.5 Leachate Treatment Facility
4.2.5.1 Volatile Organic Compound and Odour Emissions
The U.S. EPA’s wastewater treatment model WATER9 was used to estimate potential air emissions from
the SBR leachate treatment system. WATER9 outputs emission rates (in gram per second) to air by
contaminant for each source. WATER9 allows the user of the model to select component equipment
configurations within the plant and arrange the flows and process inputs to approximate the facility
configuration, therefore allowing the user to simulate the plant virtually within the modelling program.
Certain parameters were inputted to the program (i.e., temperatures, flows, influent concentrations),
based on the Ottawa Landfill Leachate Treatment System Conceptual Design Report document, prepared
by AECOM, as well as additional information provided by AECOM and Waste Management. Where
required information was not available from either of these sources, parameters were based on the
WATER9 defaults. In cases where a specific equipment configuration did not exist within the program,
the most reasonably representative equipment type or configuration was chosen.
For the WCEC landfill’s leachate treatment system or the sequencing batch reactor (SBR) system was
represented by the “diffused air biotreatment” equipment type in the WATER9 model. This equipment
type considers biological degradation of the compounds in the leachate and aeration/agitation of the
leachate in the containment tank. The Equalization Tank and Effluent Equalization Tank were
represented by the “storage tank” equipment type in the WATER9 model and the Sludge Tank was
represented by the “mix tank” equipment type.
The water quality data for all sources at the leachate treatment facility were based on the water quality
data for raw leachate. Incoming leachate quality data was based on two sources of information –
sampling data from raw leachate at the existing landfill and maximum design leachate concentrations for
a SBR system at another WM facility, the Twin Creeks landfill. The raw leachate sampling data were
assessed and any contaminants that were detected above their corresponding method detection limit
were carried forward in the assessment. Contaminants that were measured but not found in
concentrations above the method detection limit were not assessed. The WCEC existing landfill sampling
data and the Twin Creeks design concentrations were compared, and the highest concentration for each
contaminant (with exception of ammonia) was used to develop emission rates for the detected
contaminants. This is a conservative approach, as no degradation or removal of the contaminants in the
leachate was accounted for as the leachate is treated through the process. The one exception to the
above statement is when calculating ammonia emission rates, where AECOM provided inlet ammonia
concentration data separately for the raw leachate (Equalization Tank and SBR), the effluent (Effluent
Tank), as well as the sludge (Sludge Tank).
The initial proposed design for the SBR system was to treat leachate collected from the existing landfill.
In anticipation of the increased leachate generation due to the construction and filling of the proposed
landfill, the SBR system was assumed to double in equipment and capacity; therefore, as a conservative
approach, the initial estimated emission rates for the raw leachate equalization tank, the effluent
equalization tank, and the sludge holding tank were doubled. The emissions from the SBR tank were not
doubled, since the SBR is a batch process and maximum emissions would not occur from two SBR tanks
simultaneously.

Reputation Resources Results Canada | USA | UK | India | China | Hong Kong | Singapore www.rwdi.com
WCEC Landfill Emission Summary & dispersion Modelling Report Waste Management of Canada Corporation RWDI#1302177 July 30 2014
Page 17
For the purposes of this assessment and to obtain the most conservative emissions release estimate, the
following was assumed:
The SBR system is operating at its maximum flow rate;
The leachate inlet concentration for each parameter identified is at its highest;
The leachate generated from the proposed landfill and the existing landfill are similar in
quality; and
The SBR tank, although a batch process, is discharging emission continuously, 24 hours per
day, 7 days a week.
Having one SBR system operating 24-hours per day at the worst-case conditions is a conservative
assumption intended to address any potential additional capacity that may be required in the future.
Please refer to Appendix H for additional details and sample calculations.
4.2.5.2 Combustion By-Product Emissions
A 320 kW emergency diesel-fired generator supports the leachate treatment system or SBR system.
Emissions associated with the emergency diesel-fired generator include combustion by-products such as
total suspended particulate, carbon monoxide and nitrogen oxides.
PM, CO and NOx emission rates were calculated based on emission factors provided in manufacturer
specifications.
Please refer to Appendix I for additional details and sample calculations.
4.2.6 Material Handling and Processing Emissions
4.2.6.1 Fugitive Dust (Particulate Matter) Emissions
Estimates of the particulate matter emission rates from landfilling and construction operations were
obtained using the relevant chapters from AP-42. These documents provide a reasonable general
estimate of emission rates in dry conditions. Formulae and emission factors for calculating particulate
matter emission rates are presented below.

Reputation Resources Results Canada | USA | UK | India | China | Hong Kong | Singapore www.rwdi.com
WCEC Landfill Emission Summary & dispersion Modelling Report Waste Management of Canada Corporation RWDI#1302177 July 30 2014
Page 18
4.2.6.2 Material Handling Emission Rates
Estimates for particulate matter emission rates for material handling operations are based on the equation
from Section 13.2.4 of AP-42 summarized below:
4.1
3.1
2
2.2*0016.0*
M
U
kE Equation 1
Where: E = emission factor in kg/Mg (kilogram of particulate matter emitted per megagram of
material processed);
K = particle size multiplier (TSP = 0.74, PM10 = 0.35 and PM2.5 = 0.11);
U = mean wind speed in m/s (metres/second); and,
M = material moisture content (%).
The required inputs into the above equation are mean wind speed and moisture content of the material
handled. An hourly emission rate file was generated using the hourly wind speed recorded in the Ottawa
Airport meteorological data file used, corresponding to the years of meteorological data modelled.
Material handling was assumed to occur only during the landfill’s hours of operation; therefore, material
handling emissions were only calculated for hours between 6:00 and 20:00 and were set to zero off for all
other hour. Hourly emission rates were also set to zero if the Ottawa Airport meteorological data for the
corresponding hour was recorded to have medium to high precipitation.
The typical mean moisture content of 12 % for cover material at municipal solid waste landfills, as listed in
Section 13.2.4 of AP-42, was used to calculate the emission rates for all material handling sources.
At the proposed landfill footprint, the material handling sources include:
Material loading and unloading at the contaminated soil stockpile;
Material loading at the overburden stockpile;
Material loading and unloading at the construction working face; and
Material loading and unloading at the landfill working face.
Emissions were based on material handling rates developed by using the truck traffic for each location
and a truck capacity of 10 m3 of soil/granular material. A material density of 1.61 tonnes/m
3 was
calculated based on the average density of clay (dry excavated and wet excavated) and sand (wet and
dry) from the Mass, Weight, Density or Specific Gravity of Bulk Material website. Material handling rates
for each source are summarized in Table 4.2.7
Excerpts of the hourly emission rate files can be found in Appendix J.

Reputation Resources Results Canada | USA | UK | India | China | Hong Kong | Singapore www.rwdi.com
WCEC Landfill Emission Summary & dispersion Modelling Report Waste Management of Canada Corporation RWDI#1302177 July 30 2014
Page 19
4.2.6.3 Bulldozing Emission Rates
Particulate matter emission estimates from the bulldozing operations at the overburden stockpile and the
construction working face were obtained using the equation used for the bulldozing overburden material
from Section 11.9.2 of AP-42 as summarized below:
( ) ( )
( ) Equation 2
( ) ( )
( ) Equation 3
( ) ( ) Equation 4
( ) ( ) Equation 5
Where: E = emission factor in kg/hr;
s = material silt loading (%); and
M = material moisture content.
Bulldozing was assumed to occur on a continuous basis for the landfill hours of operations. No controls
were applied to the particulate matter emission created by the bulldozing operations.
The bulldozing operations at the overburden stockpile and the construction working face are considered
area sources and to determine the emission flux rate, the approximated surface areas of 4000 m2 and
900 m2 for the overburden stockpile and construction working face, respectively, were used.
To be consistent with the material handling emission rates developed, the typical mean moisture content
of 12% and mean silt content of 9% for cover material at municipal solid waste landfills, as listed in
Section 13.2.4 of the AP-42, was used to calculate the emission rates for all the bulldozing sources.
Based on the silt and moisture content used, the calculated PM2.5 emission rates were higher than the
calculated PM10 emission rates. Therefore, as a conservative approach, the PM2.5 emission rates were
used for both the PM2.5 and PM10 assessments.
Please refer to Appendix K for additional details and sample calculations.
4.2.7 Impact Crusher and Engine
4.2.7.1 Particulate Matter Emissions
Particulate matter emissions from the crushing and screening processes were determined using the AP-
42 Chapter 11.19.2 “Crushed Stone Processing and Pulverized Mineral Processing”. Since this chapter
does not include emission factors from primary and secondary crushing, the tertiary crushing emission
factor of 6.0E-04 kg/Mg was conservatively used for the crushing process. Controlled emission factors
were used as it was assumed that water spray bars have been installed on the processing equipment to
control fugitive particulate matter emissions from the crushing process.

Reputation Resources Results Canada | USA | UK | India | China | Hong Kong | Singapore www.rwdi.com
WCEC Landfill Emission Summary & dispersion Modelling Report Waste Management of Canada Corporation RWDI#1302177 July 30 2014
Page 20
As no data on the proposed crusher system was available at the time of this assessment, the amount of
material handled the processing operations was determined by using the processing capacity of 200
Mg/hour based on another typical impact crusher previously evaluated by RWDI.
Please refer to Appendix L for additional details and sample calculations.
4.2.7.2 Combustion By-Products
One 300 horsepower diesel engine powers the impact crusher. Specifications for the specific unit to be
used at the WCEC were not available, since the equipment has not yet been selected. Emission rates for
the engine was based on emission factors from AP-42 Chapter 3.3, Gasoline and Diesel Industrial
Engines, with exhaust parameters assumed based on typical units.
Please refer to Appendix L for additional details and sample calculations.
4.3 Sample Calculation for each Method
Sample calculations are provided in the appendix associated with each source.
4.4 Assessment of Data Quality for Each Emission Rate
The assessment of data quality for each emission rate is provided in the Source Summary Table.
The emission rates for the landfill gas-fired engines were based on engineering calculations, AP-42
emission factors and validated source testing program; therefore, depending on the contaminant, they
were assigned an “above-average” or “marginal” data quality rating. The emission rates for the landfill
gas flares were based on LANDGEM calculations, source testing and AP-42 emission factors; therefore,
dependant on the contaminant, they were assigned an “above-average” or “average” data quality rating.
The emission rates for the landfill mounds were based on LANDGEM calculations and source testing;
therefore, they were assigned “above-average” data quality ratings. The fugitive emissions from the
contaminated soil stockpile were based on validated source testing program; therefore, they were
assigned “above-average” data quality ratings.
The leachate treatment emission rates estimated using WATER9 were assigned “average” data quality
ratings. The emission rates for the leachate treatment system emergency diesel generator are based on
AP-42 emission factors with “A” ratings; therefore, they were assigned “above-average” data quality
ratings.
The emission rates for the material loading activities are based on an AP-42 emission factor equation with
an “A” rating; therefore, they were assigned “above-average” data quality ratings. The emission rates for
the bulldozing activities are based on an AP-42 emission factor with a “C” rating; therefore, they were
assigned “average” data quality ratings. The emission rates for the crushing activities and diesel
generator are based on an AP-42 emission factor with an “E” rating; therefore, they were assigned
“marginal” data quality ratings.

Reputation Resources Results Canada | USA | UK | India | China | Hong Kong | Singapore www.rwdi.com
WCEC Landfill Emission Summary & dispersion Modelling Report Waste Management of Canada Corporation RWDI#1302177 July 30 2014
Page 21
5. SOURCE SUMMARY TABLE & PROPERTY PLAN
5.1 Source Summary Table
Table 5.1 in the Tables Section provides the Source Summary Table for the facility.
5.2 Site Plan (Scaleable)
Figure 5.2 in the Figures Section provides the site plan for the facility.
6. DISPERSION MODELLING
6.1 Dispersion Modelling Input Summary Table
Table 6.1 in the Tables Section provides the Dispersion Modelling Input Summary Table for the facility.
Additional information on specific elements of the modelling analysis is provided in the following sections.
The U.S. EPA’s AERMOD dispersion model was used to predict maximum concentrations resulting from
emissions from the WCEC facility. AERMOD is a steady-state Gaussian model that is capable of
handling multiple emission sources. Within the model, receptor grids as well as discrete receptor
locations of interest can be considered.
Separate model runs were conducted for each of the thirty-three (33) significant contaminants emitted
from the WCEC landfill facility. All sources in the assessment were modelled either as a point, area or
volume sources.
6.1.1 Meteorological Conditions
Five years of local meteorological data (2006-2010) were used in the AERMOD dispersion model. The
meteorological data set for the WCEC was developed by the MOE’s Environmental Monitoring and
Reporting Branch (EMRB). This dataset, however, was based on the MOE’s regional meteorological data
for Eastern Ontario, which considers surface data from the Ottawa International Airport. The Ottawa
Airport, which is located approximately 25 km away from the landfill, is the nearest weather station
providing the desired meteorological parameters on an hourly basis. The EMRB adjusted the regional
meteorological dataset to account for local land uses surrounding the WCEC facility. The data set
provided by the EMBR was used directly in the dispersion model, with no changes or alterations
conducted by RWDI.
Consultation on the meteorological dataset was conducted with Jinliang (John) Liu from the EMRB. A
request for approval under Section 13(1) of O. Reg. 419/05 for the use of site-specific meteorological data
is included in the ECA application.

Reputation Resources Results Canada | USA | UK | India | China | Hong Kong | Singapore www.rwdi.com
WCEC Landfill Emission Summary & dispersion Modelling Report Waste Management of Canada Corporation RWDI#1302177 July 30 2014
Page 22
6.1.2 Area of Modelling Coverage
The area of modelling coverage was designed to meet the requirements outlined in Section 14 of
O. Reg. 419/05. A multi-tiered receptor grid was developed with reference to Section 7.2 of the Air
Dispersion Modelling Guideline for Ontario, Version 2.0, March 2009; therefore, interval spacing was
dependent on the receptor distance from on-site sources.
Typically when modelling odour (or any contaminant with a 10-minute averaging standard), impacts are
assessed only at odour sensitive receptor locations and not at the property line. In the MOE’s
“Methodology for Modelling Assessments of Contaminants with 10-minute Average Standards and
Guidelines under O. Reg. 419/05”, April 2008, odour sensitive receptors are defined as “any locations
where and when human activities regularly occur”. Receptors were positioned at 1.5 metres above grade,
which is considered to be a typical breathing zone height. Twenty-two (22) discrete (residential)
receptors were considered in this assessment. The receptor locations are shown in Figure 6.1.2.
R1and R3, which were assessed in the Detailed Impact Assessment, are not assessed as part of this
ECA assessment, as WM has purchased the lands on which R1and R3 are located, no longer making
them sensitive receptors.
6.1.3 Stack Height for Certain New Sources of Contaminant
All stack heights are less than the allowable stack height obtained using the stack height formula defined
under Section 15 of O. Reg. 419/05. As such, building downwash effects have been considered in the
dispersion modelling by using the US-EPA’s Building Profile Input Program (BPIP) associated with the
AERMOD model.
The Building Profile Input Program (BPIP) was used to calculate the effects of building downwash on
point sources, such as stacks. The landfill-gas-to-energy building and the flare building were included in
the modelling, as these structures have the potential to affect emissions from the engines and flares. The
SBR system tanks were also included in the modelling as buildings, as the tanks have the potential to
affect emission from the tank vent sources. The BPIP model was run prior to running the AERMOD
model to incorporate the potential building downwash effects.
The potential building downwash effects were only evaluated for the point sources within the dispersion
model. Although the existing and proposed landfill mounds may be considered “structures”, dispersion
modelling tests were completed including these landfill mound “structures” and it was found that the
effects of mound downwash have insignificant impacts on the maximum off-site concentrations. The
effects of the mound downwash are insignificant as the sloping features of the mound do not act as a
solid block building.

Reputation Resources Results Canada | USA | UK | India | China | Hong Kong | Singapore www.rwdi.com
WCEC Landfill Emission Summary & dispersion Modelling Report Waste Management of Canada Corporation RWDI#1302177 July 30 2014
Page 23
6.1.4 Terrain Data
Terrain information for the area surrounding the WCEC landfill facility was obtained from the MOE Ontario
Digital Elevation Model Data web site. The terrain data are based on the North American Datum 1983
(NAD83) horizontal reference datum. These data were run through the AERMAP terrain pre-processor to
estimate base elevations for receptors and to help the model account for changes in elevation of the
surrounding terrain.
6.1.5 Averaging Periods Used
10-minute, ½-hour, 1-hour and 24-hour averaging times were used with the AERMOD model to compare
to Schedule 3 Standards and other guidelines listed in the Ministry document "Summary of
O. Reg. 419/05 Standards and Point Of Impingement Guidelines and Ambient Air Quality Criteria
(AAQC's)" dated April 2012. 10-minute average values were calculated from the 1-hour predicted
concentrations using a factor of 1.65, as given in Table 4.1 of the Ministry document “Guideline A11: Air
Dispersion Modelling Guideline for Ontario” dated March 2009. ½-hour average values were calculated
from the 1-hour predicted concentrations using a factor of 1.2, as given in Table 4.1 of Guideline A11.
6.2 Land Use Designation Plan
Figure 6.2 in the Figures Section provides the zoning documentation. The WCEC landfill facility is
located adjacent to Highway 417. It is bounded by Carp Road on the east and William Mooney Road on
the west. An active quarry is situated immediately east of the site across Carp Road. The land within 1
km of the landfill is largely industrial and agricultural. The landfill itself is zoned as “rural heavy industrial”
and is bordered by “mineral extraction” areas to the east and north, “rural general industrial” areas to the
north and south, “rural commercial” areas to the south, and “environmental protection” areas to the west.
6.3 Dispersion Modelling Input and Output Files
Modelling input and output files have been provided on a compact disc included in Appendix A

Reputation Resources Results Canada | USA | UK | India | China | Hong Kong | Singapore www.rwdi.com
WCEC Landfill Emission Summary & dispersion Modelling Report Waste Management of Canada Corporation RWDI#1302177 July 30 2014
Page 24
7. EMISSION SUMMARY TABLE & CONCLUSIONS
7.1 Emission Summary Table
Table 7.1 in the Tables Section provides the Emission Summary Table for the facility.
7.2 Contaminants without Standards or Guidelines under O. Reg. 419/05
The following contaminants do not have standards or guidelines under O. Reg. 419/05, but have
Jurisdictional Screening Levels (JSL):
1,1,2-Trichloroethane (CAS# 79-00-5); and
Butyl alcohol, sec- (CAS# 78-92-2).
The predicted concentrations of these contaminants are below their respective JSL, and therefore do not
require a maximum ground-level concentration acceptability request.
The following contaminants do not have Standards or guidelines under O. Reg. 419/05, nor do they have
relevant JSL values, and will also require a maximum ground-level concentration acceptability request:
1,1,2,2-Tetrachloroethane (CAS# 79-34-5);
Bromodichloromethane (CAS# 75-27-4); and
Methane (CAS# 74-82-8).
7.3 Odour Criteria
In March, 2005, the Ontario Ministry of the Environment published a position paper in which it proposed to
develop an odour policy framework. As part of this position paper, the Ministry recognized the need to
review odour-based limits. Historically, the odour threshold most commonly reported was the detection
threshold, which is defined as the level at which 50% of a group of normal observers say they detect the
odour. The Ministry recognized that complaint thresholds are typically 3 to 5 times the detection
threshold. Odour levels are expressed in terms of odour units (OU), where a value of 1 OU corresponds
to the 50% detection threshold. Expressed in these units, the complaint threshold for an odour is typically
3 to 5 OU.
Historically, the Ministry’s requirements with respect to odours have varied from one facility to another.
The Ministry had no requirement in cases where there was no history of odour complaints or no other
evidence of potential concerns. When there was evidence of a legitimate concern, the Ministry
sometimes required the facility to stay within 1 OU at sensitive impact locations at all times. In other
cases, a frequency of values above 1 OU was permitted if it was below 0.5% annually and, in other cases,
a higher odour threshold was adopted (e.g., 5 OU).

Reputation Resources Results Canada | USA | UK | India | China | Hong Kong | Singapore www.rwdi.com
WCEC Landfill Emission Summary & dispersion Modelling Report Waste Management of Canada Corporation RWDI#1302177 July 30 2014
Page 25
In the case of the WCEC odour emissions, concentrations exceed the 1 OU criterion at several of the
twenty-three discrete receptors locations evaluated. The frequency of exceedance was conducted. The
modeled frequency of exceedance is 0.33%, below the acceptable 0.5% annual frequency of exceedance.
Frequency analysis results are shown in Appendix M.
7.4 Landfill Gas Calibration Factor
The LANDGEM Model has been developed as a LFG generation model and is not a LFG emission model.
The approaches taken in this assessment also produce an estimate of LFG generation rather than LFG
emission. This is a very critical distinction when assessing air quality. The effect of LFG passing through
several feet of moistened soil, full of microbes and reactive minerals, greatly reduces the amount of many
LFG compounds. This is particularly true for reduced sulphur compounds such as hydrogen sulphide.
As referred to in the Amended LFG (VOC) Baseline Assessment Report, dated November 2011, a
Combined Assessment of Modelled and Monitored (CAMM) results indicated that it is reasonable that the
hydrogen sulphide emission rate be adjusted using a calibration factor. The emission factors for the
hydrogen sulphide sources (only LFG related sources) in this assessment were divided by a value of 3,
the reduction factor used to obtain an adjusted emission rate. The CAMM study has been reviewed and
accepted by the MOE, with the documentation included in Appendix N.
None of the other contaminant emission rates were adjusted through the use of a calibration factor.
7.5 Conclusions
Concentrations at points of impingement were predicted using the AERMOD. Modelling input and output
files have been provided on a compact disc included in Appendix A.
The maximum predicted 10-minute odour concentration is higher than the criterion of 1 OU, with a value
of 2.6 at one of the twenty-three assessed discrete receptors. However, the modelling shows that the
criterion of 1 OU is exceeded less than 0.5% annual at the discrete receptor, which is considered
acceptable by the suggested MOE guidance in terms of odour emissions (Methodology for Modelling
Assessments of Contaminants with 10-Minute Average Standards and Guidelines).
Predicted concentrations for all of the contaminants of significance were found to be less than their
respective Standards or guidelines under O. Reg. 419/05 at all receptors in the area. The contaminant
with the greatest percentage of the O. Reg. 419/05 Standard was predicted to be vinyl chloride with a
value of 73%. Therefore, WCEC landfill facility is expected to be in compliance with the requirements of
O. Reg. 419/05.

Employee Job Title
TABLES

2.1 Sources and Contaminant Identification Table RWDI Project #1302177
Source Information Expected Contaminants Included in Significant? ReferenceSource ID Source Description General Modelling? (optional)(optional) or Title Location (yes / no) (yes / no)
E1 LFG Engine #1 - CAT 3520 LFG Engine Building - East Corner of Facility near Carp RoadBy-Products of Combustion &
Residual VOCsyes yes
E2 LFG Engine #2 - CAT 3520 LFG Engine Building - East Corner of Facility near Carp RoadBy-Products of Combustion &
Residual VOCsyes yes
E3 LFG Engine #3 - CAT 3520 LFG Engine Building - East Corner of Facility near Carp RoadBy-Products of Combustion &
Residual VOCsyes yes
E4 LFG Engine #4 - CAT 3520 LFG Engine Building - East Corner of Facility near Carp RoadBy-Products of Combustion &
Residual VOCsyes yes
E5 LFG Engine #5 - CAT 3520 LFG Engine Building - East Corner of Facility near Carp RoadBy-Products of Combustion &
Residual VOCsyes yes
F1 LFG Flare #1Adjacent to LFG Blower Building - North side of Facilitynext to Carp Road
By-Products of Combustion & Residual VOCs
yes yes
F2 LFG Flare #2Adjacent to LFG Blower Building - North side of Facilitynext to Carp Road
By-Products of Combustion & Residual VOCs
yes yes
F3 Candlestick LFG FlareAdjacent to LFG Blower Building - North side of Facilitynext to Carp Road
By-Products of Combustion & Residual VOCs
yes yes
LM_EX Existing Landfill Mound South Centre of Site VOCs and Odour yes yesLM_PP Proposed Landfill Mound North Centre of Site VOCs and Odour yes yes
ACTSTG Active Stage of Proposed Landfill Mound North East of Proposed Landfill Mound VOCs yes yesWRKFCE Working Face of Proposed Landfill Mound North East of Proposed Landfill Mound Odour yes yesINTERIM Interim Cover Area of Proposed Landfill Mound North East of Proposed Landfill Mound Odour yes yes
CSS Contaminated Soil Stockpile West of Proposed Landfill Mound VOCs yes yesRAWLEACH Raw Leachate Equalization Tank Leachate Treatment Facility - South of Existing Landfill Mound Ammonia, Odour and VOCs yes yes
SBR Sequencing Batch Reactor Tank Leachate Treatment Facility - South of Existing Landfill Mound Ammonia, Odour and VOCs yes yesEFFLUENT Effluent Equalization Tank Leachate Treatment Facility - South of Existing Landfill Mound Ammonia, Odour and VOCs yes yesSLUDGE Sludge Tank Leachate Treatment Facility - South of Existing Landfill Mound Ammonia, Odour and VOCs yes yes
LEACHGEN Emergency Diesel-Fired Generator for SBR Leachate Treatment Facility - South of Existing Landfill Mound By-Products of Combustion yes yesCR_ENG Impact Crusher Diesel Engine Waste Transfer Facility - South West of Existing Landfill Mound By-Products of Combustion yes yes
CR Impact Crusher Waste Transfer Facility - South West of Existing Landfill Mound TSP yes yesACTFCE Material Loading at the Working Face of the Active Stage North East of Proposed Landfill Mound TSP yes yes
ACT_UNL Material Unloading at the Working Face of the Active Stage North East of Proposed Landfill Mound TSP yes yesCF_BD Bulldozing at the Construction Working Face North East of Proposed Landfill Mound TSP yes yes
CF_UNL Material Unloading at the Construction Working Face North East of Proposed Landfill Mound TSP yes yesCWS_MH Material Loading at the Construction Working Face North East of Proposed Landfill Mound TSP yes yesCSS_MH Material loading and unloading at the Contaminated Soil Stockpile West of Proposed Landfill Mound TSP yes yesOB_BD Bulldozing at the Overburden Pile West of Proposed Landfill Mound TSP yes yesOB_MH Material Loading at the Overburden Pile West of Proposed Landfill Mound TSP yes yes
BOILER Leachate Plant Boiler Leachate Treatment Facility - South of Existing Landfill MoundBy-Products of Combustion &
Residual VOCsno no [1]
B3 GS Blower South East of Existing Landfill Mound VOCs no no [1]
Notes:[1] the Leachate plant boiler and GS blower were deemed to be insignificant since these source contributed less than 5% of the overall site-wide emissions.
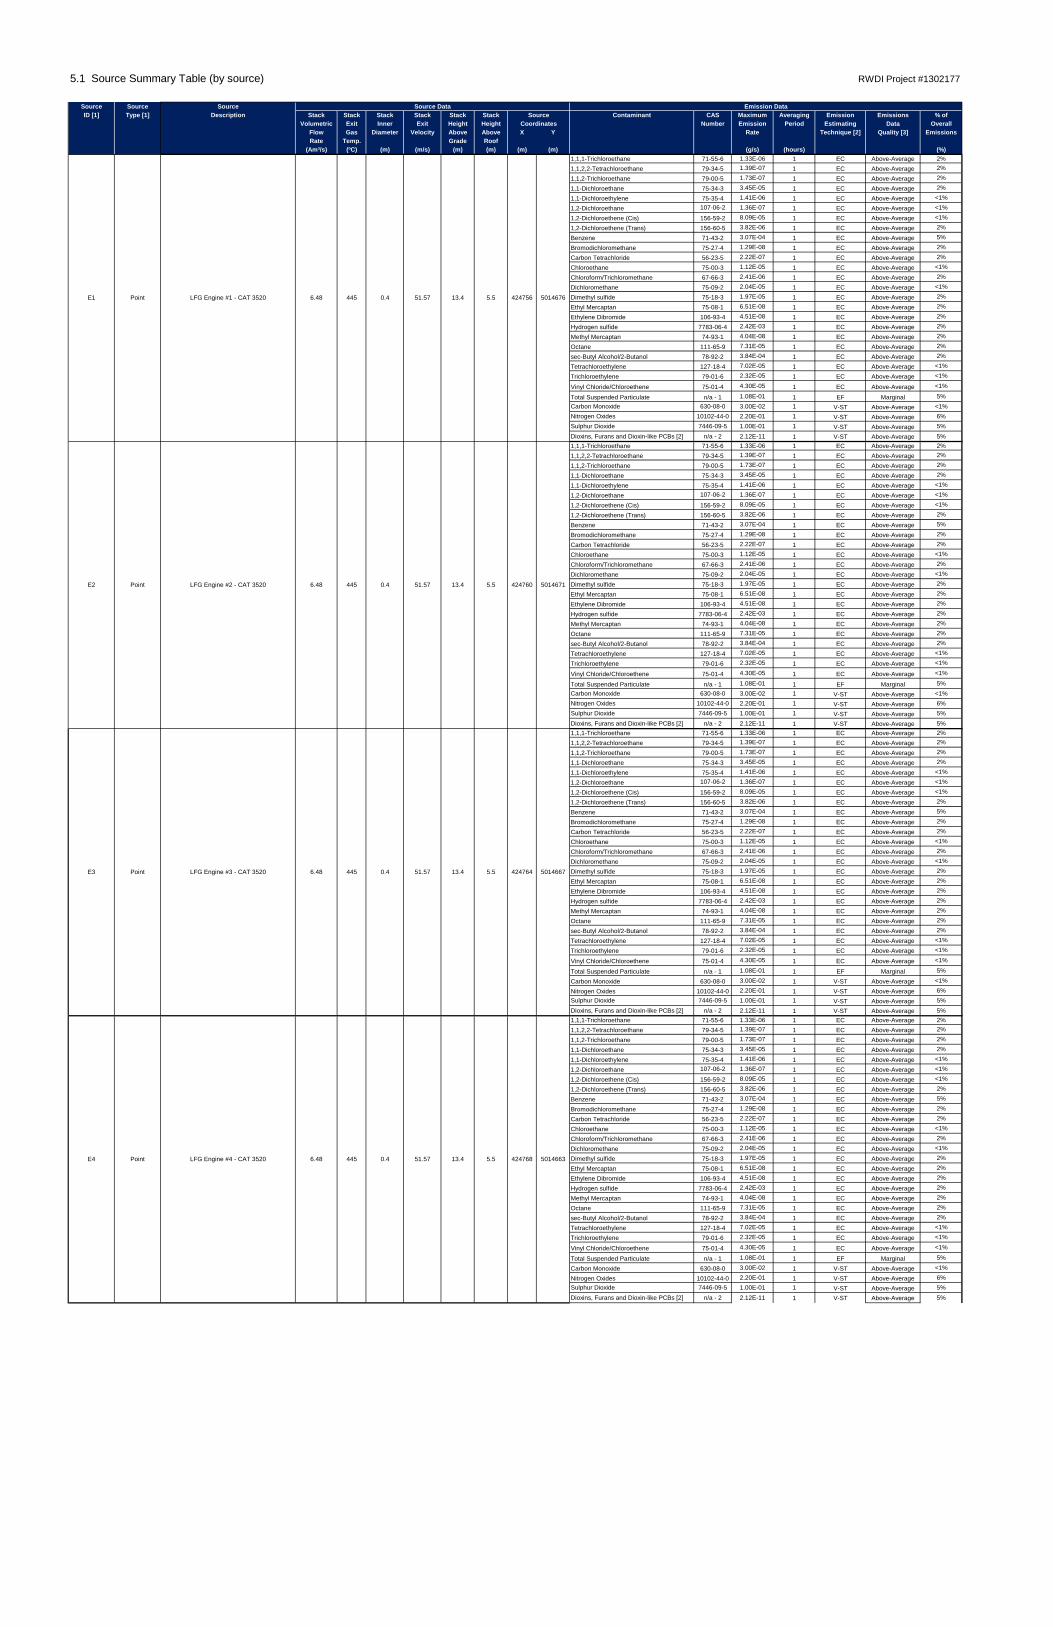
5.1 Source Summary Table (by source) RWDI Project #1302177
Source Source Source Source Data Emission DataID [1] Type [1] Description Stack Stack Stack Stack Stack Stack Source Contaminant CAS Maximum Averaging Emission Emissions % of
Volumetric Exit Inner Exit Height Height Coordinates Number Emission Period Estimating Data OverallFlow Gas Diameter Velocity Above Above X Y Rate Technique [2] Quality [3] EmissionsRate Temp. Grade Roof
(Am³/s) (ºC) (m) (m/s) (m) (m) (m) (m) (g/s) (hours) (%)1,1,1-Trichloroethane 71-55-6 1.33E-06 1 EC Above-Average 2%
1,1,2,2-Tetrachloroethane 79-34-5 1.39E-07 1 EC Above-Average 2%
1,1,2-Trichloroethane 79-00-5 1.73E-07 1 EC Above-Average 2%
1,1-Dichloroethane 75-34-3 3.45E-05 1 EC Above-Average 2%
1,1-Dichloroethylene 75-35-4 1.41E-06 1 EC Above-Average <1%
1,2-Dichloroethane 107-06-2 1.36E-07 1 EC Above-Average <1%
1,2-Dichloroethene (Cis) 156-59-2 8.09E-05 1 EC Above-Average <1%
1,2-Dichloroethene (Trans) 156-60-5 3.82E-06 1 EC Above-Average 2%
Benzene 71-43-2 3.07E-04 1 EC Above-Average 5%
Bromodichloromethane 75-27-4 1.29E-08 1 EC Above-Average 2%
Carbon Tetrachloride 56-23-5 2.22E-07 1 EC Above-Average 2%
Chloroethane 75-00-3 1.12E-05 1 EC Above-Average <1%
Chloroform/Trichloromethane 67-66-3 2.41E-06 1 EC Above-Average 2%
Dichloromethane 75-09-2 2.04E-05 1 EC Above-Average <1%
Dimethyl sulfide 75-18-3 1.97E-05 1 EC Above-Average 2%
Ethyl Mercaptan 75-08-1 6.51E-08 1 EC Above-Average 2%
Ethylene Dibromide 106-93-4 4.51E-08 1 EC Above-Average 2%
Hydrogen sulfide 7783-06-4 2.42E-03 1 EC Above-Average 2%
Methyl Mercaptan 74-93-1 4.04E-08 1 EC Above-Average 2%
Octane 111-65-9 7.31E-05 1 EC Above-Average 2%
sec-Butyl Alcohol/2-Butanol 78-92-2 3.84E-04 1 EC Above-Average 2%
Tetrachloroethylene 127-18-4 7.02E-05 1 EC Above-Average <1%
Trichloroethylene 79-01-6 2.32E-05 1 EC Above-Average <1%
Vinyl Chloride/Chloroethene 75-01-4 4.30E-05 1 EC Above-Average <1%
Total Suspended Particulate n/a - 1 1.08E-01 1 EF Marginal 5%
Carbon Monoxide 630-08-0 3.00E-02 1 V-ST Above-Average <1%
Nitrogen Oxides 10102-44-0 2.20E-01 1 V-ST Above-Average 6%
Sulphur Dioxide 7446-09-5 1.00E-01 1 V-ST Above-Average 5%
Dioxins, Furans and Dioxin-like PCBs [2] n/a - 2 2.12E-11 1 V-ST Above-Average 5%
1,1,1-Trichloroethane 71-55-6 1.33E-06 1 EC Above-Average 2%
1,1,2,2-Tetrachloroethane 79-34-5 1.39E-07 1 EC Above-Average 2%
1,1,2-Trichloroethane 79-00-5 1.73E-07 1 EC Above-Average 2%
1,1-Dichloroethane 75-34-3 3.45E-05 1 EC Above-Average 2%
1,1-Dichloroethylene 75-35-4 1.41E-06 1 EC Above-Average <1%
1,2-Dichloroethane 107-06-2 1.36E-07 1 EC Above-Average <1%
1,2-Dichloroethene (Cis) 156-59-2 8.09E-05 1 EC Above-Average <1%
1,2-Dichloroethene (Trans) 156-60-5 3.82E-06 1 EC Above-Average 2%
Benzene 71-43-2 3.07E-04 1 EC Above-Average 5%
Bromodichloromethane 75-27-4 1.29E-08 1 EC Above-Average 2%
Carbon Tetrachloride 56-23-5 2.22E-07 1 EC Above-Average 2%
Chloroethane 75-00-3 1.12E-05 1 EC Above-Average <1%
Chloroform/Trichloromethane 67-66-3 2.41E-06 1 EC Above-Average 2%
Dichloromethane 75-09-2 2.04E-05 1 EC Above-Average <1%
Dimethyl sulfide 75-18-3 1.97E-05 1 EC Above-Average 2%
Ethyl Mercaptan 75-08-1 6.51E-08 1 EC Above-Average 2%
Ethylene Dibromide 106-93-4 4.51E-08 1 EC Above-Average 2%
Hydrogen sulfide 7783-06-4 2.42E-03 1 EC Above-Average 2%
Methyl Mercaptan 74-93-1 4.04E-08 1 EC Above-Average 2%
Octane 111-65-9 7.31E-05 1 EC Above-Average 2%
sec-Butyl Alcohol/2-Butanol 78-92-2 3.84E-04 1 EC Above-Average 2%
Tetrachloroethylene 127-18-4 7.02E-05 1 EC Above-Average <1%
Trichloroethylene 79-01-6 2.32E-05 1 EC Above-Average <1%
Vinyl Chloride/Chloroethene 75-01-4 4.30E-05 1 EC Above-Average <1%
Total Suspended Particulate n/a - 1 1.08E-01 1 EF Marginal 5%
Carbon Monoxide 630-08-0 3.00E-02 1 V-ST Above-Average <1%
Nitrogen Oxides 10102-44-0 2.20E-01 1 V-ST Above-Average 6%
Sulphur Dioxide 7446-09-5 1.00E-01 1 V-ST Above-Average 5%
Dioxins, Furans and Dioxin-like PCBs [2] n/a - 2 2.12E-11 1 V-ST Above-Average 5%
424760
E1 Point LFG Engine #1 - CAT 3520 6.48 13.4 5.5 424756 5014676
501467151.57 13.4 5.5
424764
5014663
E2 Point LFG Engine #2 - CAT 3520 6.48 445 0.4
445 0.4 51.57
E4 Point LFG Engine #4 - CAT 3520 6.48 445 0.4 51.57 13.4
5014667E3 Point LFG Engine #3 - CAT 3520 6.48 445 0.4 51.57 13.4 5.5
5.5 424768

5.1 Source Summary Table (by source) RWDI Project #1302177
Source Source Source Source Data Emission DataID [1] Type [1] Description Stack Stack Stack Stack Stack Stack Source Contaminant CAS Maximum Averaging Emission Emissions % of
Volumetric Exit Inner Exit Height Height Coordinates Number Emission Period Estimating Data OverallFlow Gas Diameter Velocity Above Above X Y Rate Technique [2] Quality [3] EmissionsRate Temp. Grade Roof
(Am³/s) (ºC) (m) (m/s) (m) (m) (m) (m) (g/s) (hours) (%)
1,1,1-Trichloroethane 71-55-6 1.33E-06 1 EC Above-Average 2%
1,1,2,2-Tetrachloroethane 79-34-5 1.39E-07 1 EC Above-Average 2%
1,1,2-Trichloroethane 79-00-5 1.73E-07 1 EC Above-Average 2%
1,1-Dichloroethane 75-34-3 3.45E-05 1 EC Above-Average 2%
1,1-Dichloroethylene 75-35-4 1.41E-06 1 EC Above-Average <1%
1,2-Dichloroethane 107-06-2 1.36E-07 1 EC Above-Average <1%
1,2-Dichloroethene (Cis) 156-59-2 8.09E-05 1 EC Above-Average <1%
1,2-Dichloroethene (Trans) 156-60-5 3.82E-06 1 EC Above-Average 2%
Benzene 71-43-2 3.07E-04 1 EC Above-Average 5%
Bromodichloromethane 75-27-4 1.29E-08 1 EC Above-Average 2%
Carbon Tetrachloride 56-23-5 2.22E-07 1 EC Above-Average 2%
Chloroethane 75-00-3 1.12E-05 1 EC Above-Average <1%
Chloroform/Trichloromethane 67-66-3 2.41E-06 1 EC Above-Average 2%
Dichloromethane 75-09-2 2.04E-05 1 EC Above-Average <1%
Dimethyl sulfide 75-18-3 1.97E-05 1 EC Above-Average 2%
Ethyl Mercaptan 75-08-1 6.51E-08 1 EC Above-Average 2%
Ethylene Dibromide 106-93-4 4.51E-08 1 EC Above-Average 2%
Hydrogen sulfide 7783-06-4 2.42E-03 1 EC Above-Average 2%
Methyl Mercaptan 74-93-1 4.04E-08 1 EC Above-Average 2%
Octane 111-65-9 7.31E-05 1 EC Above-Average 2%
sec-Butyl Alcohol/2-Butanol 78-92-2 3.84E-04 1 EC Above-Average 2%
Tetrachloroethylene 127-18-4 7.02E-05 1 EC Above-Average <1%
Trichloroethylene 79-01-6 2.32E-05 1 EC Above-Average <1%
Vinyl Chloride/Chloroethene 75-01-4 4.30E-05 1 EC Above-Average <1%
Total Suspended Particulate n/a - 1 1.08E-01 1 EF Marginal 5%
Carbon Monoxide 630-08-0 3.00E-02 1 V-ST Above-Average <1%
Nitrogen Oxides 10102-44-0 2.20E-01 1 V-ST Above-Average 6%
Sulphur Dioxide 7446-09-5 1.00E-01 1 V-ST Above-Average 5%
Dioxins, Furans and Dioxin-like PCBs [2] n/a - 2 2.12E-11 1 V-ST Above-Average 5%
1,1,1-Trichloroethane 71-55-6 1.80E-06 1 EC Above-Average 3%
1,1,2,2-Tetrachloroethane 79-34-5 1.89E-07 1 EC Above-Average 3%
1,1,2-Trichloroethane 79-00-5 2.34E-07 1 EC Above-Average 3%
1,1-Dichloroethane 75-34-3 4.68E-05 1 EC Above-Average 3%
1,1-Dichloroethylene 75-35-4 1.91E-06 1 EC Above-Average <1%
1,2-Dichloroethane 107-06-2 1.84E-07 1 EC Above-Average <1%
1,2-Dichloroethene (Cis) 156-59-2 1.10E-04 1 EC Above-Average <1%
1,2-Dichloroethene (Trans) 156-60-5 5.18E-06 1 EC Above-Average 3%
Benzene 71-43-2 4.12E-05 1 EC Above-Average <1%
Bromodichloromethane 75-27-4 1.75E-08 1 EC Above-Average 3%
Carbon Tetrachloride 56-23-5 3.02E-07 1 EC Above-Average 3%
Chloroethane 75-00-3 1.52E-05 1 EC Above-Average <1%
Chloroform/Trichloromethane 67-66-3 3.26E-06 1 EC Above-Average 3%
Dichloromethane 75-09-2 2.77E-05 1 EC Above-Average <1%
Dimethyl sulfide 75-18-3 2.67E-05 1 EC Above-Average 3%
Ethyl Mercaptan 75-08-1 8.83E-08 1 EC Above-Average 3%
Ethylene Dibromide 106-93-4 6.13E-08 1 EC Above-Average 3%
Hydrogen sulfide 7783-06-4 3.28E-03 1 EC Above-Average 3%
Methyl Mercaptan 74-93-1 5.48E-08 1 EC Above-Average 3%
Octane 111-65-9 9.91E-05 1 EC Above-Average 3%
sec-Butyl Alcohol/2-Butanol 78-92-2 5.21E-04 1 EC Above-Average 3%
Tetrachloroethylene 127-18-4 9.53E-05 1 EC Above-Average 1%
Trichloroethylene 79-01-6 3.15E-05 1 EC Above-Average <1%
Vinyl Chloride/Chloroethene 75-01-4 5.83E-05 1 EC Above-Average <1%
Total Suspended Particulate n/a - 1 7.70E-02 1 EF Average 3%
Carbon Monoxide 630-08-0 3.42E+00 1 EF Average 21%
Nitrogen Oxides 10102-44-0 1.85E-01 1 EF Average 5%
Sulphur Dioxide 7446-09-5 7.11E-01 1 V-ST Above-Average 33%
Dioxins, Furans and Dioxin-like PCBs [2] n/a - 2 9.96E-11 1 V-ST Above-Average 25%
1,1,1-Trichloroethane 71-55-6 3.29E-06 1 EC Above-Average 5%
1,1,2,2-Tetrachloroethane 79-34-5 3.45E-07 1 EC Above-Average 6%
1,1,2-Trichloroethane 79-00-5 4.28E-07 1 EC Above-Average 6%
1,1-Dichloroethane 75-34-3 8.53E-05 1 EC Above-Average 6%
1,1-Dichloroethylene 75-35-4 3.49E-06 1 EC Above-Average <1%
1,2-Dichloroethane 107-06-2 3.36E-07 1 EC Above-Average <1%
1,2-Dichloroethene (Cis) 156-59-2 2.00E-04 1 EC Above-Average <1%
1,2-Dichloroethene (Trans) 156-60-5 9.46E-06 1 EC Above-Average 6%
Benzene 71-43-2 7.52E-05 1 EC Above-Average 1%
Bromodichloromethane 75-27-4 3.20E-08 1 EC Above-Average 6%
Carbon Tetrachloride 56-23-5 5.50E-07 1 EC Above-Average 6%
Chloroethane 75-00-3 2.78E-05 1 EC Above-Average 1%
Chloroform/Trichloromethane 67-66-3 5.96E-06 1 EC Above-Average 6%
Dichloromethane 75-09-2 5.06E-05 1 EC Above-Average <1%
Dimethyl sulfide 75-18-3 4.88E-05 1 EC Above-Average 6%
Ethyl Mercaptan 75-08-1 1.61E-07 1 EC Above-Average 6%
Ethylene Dibromide 106-93-4 1.12E-07 1 EC Above-Average 6%
Hydrogen sulfide 7783-06-4 5.99E-03 1 EC Above-Average 6%
Methyl Mercaptan 74-93-1 9.99E-08 1 EC Above-Average 6%
Octane 111-65-9 1.81E-04 1 EC Above-Average 5%
sec-Butyl Alcohol/2-Butanol 78-92-2 9.51E-04 1 EC Above-Average 6%
Tetrachloroethylene 127-18-4 1.74E-04 1 EC Above-Average 2%
Trichloroethylene 79-01-6 5.74E-05 1 EC Above-Average <1%
Vinyl Chloride/Chloroethene 75-01-4 1.06E-04 1 EC Above-Average 1%
Total Suspended Particulate n/a - 1 1.40E-01 1 EF Average 6%
Carbon Monoxide 630-08-0 6.24E+00 1 EF Average 39%
Nitrogen Oxides 10102-44-0 1.86E-01 1 V-ST Average 5%
Dioxins, Furans and Dioxin-like PCBs [2] n/a - 2 9.96E-11 1 V-ST Above-Average 25%
1,1,1-Trichloroethane 71-55-6 3.17E-06 1 EC Above-Average 5%
1,1,2,2-Tetrachloroethane 79-34-5 3.32E-07 1 EC Above-Average 5%
1,1,2-Trichloroethane 79-00-5 4.11E-07 1 EC Above-Average 5%
1,1-Dichloroethane 75-34-3 8.21E-05 1 EC Above-Average 5%
1,1-Dichloroethylene 75-35-4 3.36E-06 1 EC Above-Average <1%
1,2-Dichloroethane 107-06-2 3.23E-07 1 EC Above-Average <1%
1,2-Dichloroethene (Cis) 156-59-2 1.93E-04 1 EC Above-Average <1%
1,2-Dichloroethene (Trans) 156-60-5 9.09E-06 1 EC Above-Average 5%
Benzene 71-43-2 7.23E-05 1 EC Above-Average 1%
Bromodichloromethane 75-27-4 3.08E-08 1 EC Above-Average 5%
Carbon Tetrachloride 56-23-5 5.29E-07 1 EC Above-Average 5%
Chloroethane 75-00-3 2.67E-05 1 EC Above-Average 1%
Chloroform/Trichloromethane 67-66-3 5.73E-06 1 EC Above-Average 5%
Dichloromethane 75-09-2 4.87E-05 1 EC Above-Average <1%
Dimethyl sulfide 75-18-3 4.69E-05 1 EC Above-Average 5%
Ethyl Mercaptan 75-08-1 1.55E-07 1 EC Above-Average 5%
Ethylene Dibromide 106-93-4 1.07E-07 1 EC Above-Average 5%
Hydrogen sulfide 7783-06-4 5.76E-03 1 EC Above-Average 5%
Methyl Mercaptan 74-93-1 9.61E-08 1 EC Above-Average 5%
Octane 111-65-9 1.74E-04 1 EC Above-Average 5%
sec-Butyl Alcohol/2-Butanol 78-92-2 9.14E-04 1 EC Above-Average 5%
Tetrachloroethylene 127-18-4 1.67E-04 1 EC Above-Average 2%
Trichloroethylene 79-01-6 5.52E-05 1 EC Above-Average <1%
Vinyl Chloride/Chloroethene 75-01-4 1.02E-04 1 EC Above-Average 1%
Total Suspended Particulate n/a - 1 1.35E-01 1 EF Marginal 6%
Carbon Monoxide 630-08-0 6.00E+00 1 EF Average 37%
Nitrogen Oxides 10102-44-0 3.25E-01 1 EF Average 9%
Sulphur Dioxide 7446-09-5 7.11E-01 1 V-ST Above-Average 33%
Dioxins, Furans and Dioxin-like PCBs [2] n/a - 2 9.96E-11 1 V-ST Above-Average 25%
Odour [in OU/s) n/a - 3 1.94E+03 1 EC Above-Average 25%
1,1,1-Trichloroethane 71-55-6 3.07E-05 1 EC Above-Average 51%1,1,2,2-Tetrachloroethane 79-34-5 3.22E-06 1 EC Above-Average 52%1,1,2-Trichloroethane 79-00-5 3.99E-06 1 EC Above-Average 52%1,1-Dichloroethane 75-34-3 7.95E-04 1 EC Above-Average 52%1,1-Dichloroethylene 75-35-4 3.25E-05 1 EC Above-Average <1%1,2-Dichloroethane 107-06-2 3.13E-06 1 EC Above-Average <1%1,2-Dichloroethene (Cis) 156-59-2 1.87E-03 1 EC Above-Average 2%1,2-Dichloroethene (Trans) 156-60-5 8.81E-05 1 EC Above-Average 52%Benzene 71-43-2 7.01E-04 1 EC Above-Average 11%Bromodichloromethane 75-27-4 2.98E-07 1 EC Above-Average 52%Carbon Tetrachloride 56-23-5 5.13E-06 1 EC Above-Average 52%
LM_EX Area Existing Landfill Mound n/a n/a n/a n/a n/a n/a 423418 5014454 Chloroethane 75-00-3 2.59E-04 1 EC Above-Average 10%Chloroform/Trichloromethane 67-66-3 5.55E-05 1 EC Above-Average 52%Dichloromethane 75-09-2 4.72E-04 1 EC Above-Average <1%Dimethyl sulfide 75-18-3 4.55E-04 1 EC Above-Average 52%Ethyl Mercaptan 75-08-1 1.50E-06 1 EC Above-Average 52%Ethylene Dibromide 106-93-4 1.04E-06 1 EC Above-Average 52%Hydrogen sulfide 7783-06-4 5.59E-02 1 EC Above-Average 52%Methyl Mercaptan 74-93-1 9.31E-07 1 EC Above-Average 52%Octane 111-65-9 1.69E-03 1 EC Above-Average 51%sec-Butyl Alcohol/2-Butanol 78-92-2 8.86E-03 1 EC Above-Average 52%Tetrachloroethylene 127-18-4 1.62E-03 1 EC Above-Average 21%Trichloroethylene 79-01-6 5.35E-04 1 EC Above-Average 4%Vinyl Chloride/Chloroethene 75-01-4 9.91E-04 1 EC Above-Average 13%
424772
5014950F1 Point LFG Flare #1 31.3 871 2.1 9.0 12.2
5014660E5 Point LFG Engine #5 - CAT 3520 6.48 445 0.4 51.57 13.4 5.5
n/a 424557
424551
5014952F3 Point Candlestick LFG Flare 1 900 0.2 31.8 10.4
5014946F2 Point LFG Flare #2 57.3 900 2.7 10.01 12.2 n/a
n/a 424551

5.1 Source Summary Table (by source) RWDI Project #1302177
Source Source Source Source Data Emission DataID [1] Type [1] Description Stack Stack Stack Stack Stack Stack Source Contaminant CAS Maximum Averaging Emission Emissions % of
Volumetric Exit Inner Exit Height Height Coordinates Number Emission Period Estimating Data OverallFlow Gas Diameter Velocity Above Above X Y Rate Technique [2] Quality [3] EmissionsRate Temp. Grade Roof
(Am³/s) (ºC) (m) (m/s) (m) (m) (m) (m) (g/s) (hours) (%)
Odour [in OU/s) n/a - 3 6.02E+02 1 EC Above-Average 8%1,1,1-Trichloroethane 71-55-6 9.52E-06 1 EC Above-Average 16%1,1,2,2-Tetrachloroethane 79-34-5 9.98E-07 1 EC Above-Average 16%1,1,2-Trichloroethane 79-00-5 1.24E-06 1 EC Above-Average 16%1,1-Dichloroethane 75-34-3 2.47E-04 1 EC Above-Average 16%1,1-Dichloroethylene 75-35-4 1.01E-05 1 EC Above-Average <1%1,2-Dichloroethane 107-06-2 9.72E-07 1 EC Above-Average <1%1,2-Dichloroethene (Cis) 156-59-2 5.79E-04 1 EC Above-Average <1%1,2-Dichloroethene (Trans) 156-60-5 2.74E-05 1 EC Above-Average 16%Benzene 71-43-2 2.18E-04 1 EC Above-Average 3%Bromodichloromethane 75-27-4 9.25E-08 1 EC Above-Average 16%Carbon Tetrachloride 56-23-5 1.59E-06 1 EC Above-Average 16%Chloroethane 75-00-3 8.03E-05 1 EC Above-Average 3%
LM_PP Area Proposed Landfill Mound n/a n/a n/a n/a n/a n/a 423131 5014859 Chloroform/Trichloromethane 67-66-3 1.72E-05 1 EC Above-Average 16%Dichloromethane 75-09-2 1.46E-04 1 EC Above-Average <1%Dimethyl sulfide 75-18-3 1.41E-04 1 EC Above-Average 16%Ethyl Mercaptan 75-08-1 4.66E-07 1 EC Above-Average 16%Ethylene Dibromide 106-93-4 3.23E-07 1 EC Above-Average 16%Hydrogen sulfide 7783-06-4 1.73E-02 1 EC Above-Average 16%Methyl Mercaptan 74-93-1 2.89E-07 1 EC Above-Average 16%Octane 111-65-9 5.23E-04 1 EC Above-Average 16%sec-Butyl Alcohol/2-Butanol 78-92-2 2.75E-03 1 EC Above-Average 16%Tetrachloroethylene 127-18-4 5.03E-04 1 EC Above-Average 7%Trichloroethylene 79-01-6 1.66E-04 1 EC Above-Average 1%Vinyl Chloride/Chloroethene 75-01-4 3.08E-04 1 EC Above-Average 4%
1,1,1-Trichloroethane 71-55-6 4.33E-06 1 EC Above-Average 7%1,1,2,2-Tetrachloroethane 79-34-5 4.54E-07 1 EC Above-Average 7%1,1,2-Trichloroethane 79-00-5 5.63E-07 1 EC Above-Average 7%1,1-Dichloroethane 75-34-3 1.12E-04 1 EC Above-Average 7%1,1-Dichloroethylene 75-35-4 4.59E-06 1 EC Above-Average <1%1,2-Dichloroethane 107-06-2 4.42E-07 1 EC Above-Average <1%1,2-Dichloroethene (Cis) 156-59-2 2.64E-04 1 EC Above-Average <1%1,2-Dichloroethene (Trans) 156-60-5 1.24E-05 1 EC Above-Average 7%Benzene 71-43-2 9.90E-05 1 EC Above-Average 2%Bromodichloromethane 75-27-4 4.21E-08 1 EC Above-Average 7%Carbon Tetrachloride 56-23-5 7.24E-07 1 EC Above-Average 7%
Active Stage of Proposed Chloroethane 75-00-3 3.66E-05 1 EC Above-Average 1%ACTSTG Area Landfill Mound n/a n/a n/a n/a n/a n/a 423748 5015094 Chloroform/Trichloromethane 67-66-3 7.84E-06 1 EC Above-Average 7%
Dichloromethane 75-09-2 6.66E-05 1 EC Above-Average <1%Dimethyl sulfide 75-18-3 6.42E-05 1 EC Above-Average 7%Ethyl Mercaptan 75-08-1 2.12E-07 1 EC Above-Average 7%Ethylene Dibromide 106-93-4 1.47E-07 1 EC Above-Average 7%Hydrogen sulfide 7783-06-4 7.89E-03 1 EC Above-Average 7%Methyl Mercaptan 74-93-1 1.32E-07 1 EC Above-Average 7%Octane 111-65-9 2.38E-04 1 EC Above-Average 7%sec-Butyl Alcohol/2-Butanol 78-92-2 1.25E-03 1 EC Above-Average 7%Tetrachloroethylene 127-18-4 2.29E-04 1 EC Above-Average 3%Trichloroethylene 79-01-6 7.56E-05 1 EC Above-Average <1%Vinyl Chloride/Chloroethene 75-01-4 1.40E-04 1 EC Above-Average 2%
WRKFCE Area Working Face of Proposed Landfill Mound n/a n/a n/a n/a n/a n/a 423762 5015357 Odour [in OU/s) n/a - 3 8.08E+02 1 EC Average 11%
INTERIM Area Interim Cover Area of Proposed Landfill Mound n/a n/a n/a n/a n/a n/a 423743 5015381 Odour [in OU/s) n/a - 3 2.90E+01 1 EC Average <1%
1,1,1-Trichloroethane 71-55-6 5.13E-07 1 V-ST Above-Average <1%1,2-Dichloroethane 107-06-2 3.19E-06 1 V-ST Above-Average <1%Benzene 71-43-2 1.35E-04 1 V-ST Above-Average 2%Dichloromethane 75-09-2 2.70E-05 1 V-ST Above-Average <1%
CSS Area Contaminated Soil Stockpile n/a n/a n/a n/a n/a n/a 423886 5015024 Octane 111-65-9 6.38E-05 1 V-ST Above-Average 2%sec-Butyl Alcohol/2-Butanol 78-92-2 6.40E-07 1 V-ST Above-Average <1%Tetrachloroethylene 127-18-4 5.38E-06 1 V-ST Above-Average <1%Trichloroethylene 79-01-6 5.87E-06 1 V-ST Above-Average <1%
Odour [in OU/s) n/a - 3 2.00E+01 1 EF Average <1%
1,1-Dichloroethylene 75-35-4 1.29E-04 1 EF Average 3%1,2-Dichloroethane 107-06-2 1.64E-05 1 EF Average 1%Ammonia 7664-41-7 3.06E-04 1 EF Average <1%Benzene 71-43-2 5.48E-05 1 EF Average <1%Chloroethane 75-00-3 3.96E-05 1 EF Average 2%Vinyl Chloride/Chloroethene 75-01-4 1.25E-04 1 EF Average 2%1,2-Dichloroethene (Cis) 156-59-2 6.80E-04 1 EF Average <1%Methane 74-82-8 1.66E-02 1 EF Average 4%Dichloromethane 75-09-2 2.76E-03 1 EF Average <1%Tetrachloroethylene 127-18-4 1.04E-04 1 EF Average 1%Trichloroethylene 79-01-6 2.04E-04 1 EF Average 2%
Odour [in OU/s) n/a - 3 3.47E+03 1 EF Average 45%1,1-Dichloroethylene 75-35-4 5.95E-04 1 EF Average 12%1,2-Dichloroethane 107-06-2 3.63E-05 1 EF Average 3%Ammonia 7664-41-7 1.03E-01 1 EF Average 98%Benzene 71-43-2 1.45E-04 1 EF Average 2%Chloroethane 75-00-3 2.27E-04 1 EF Average 9%Vinyl Chloride/Chloroethene 75-01-4 1.12E-03 1 EF Average 14%1,2-Dichloroethene (Cis) 156-59-2 2.59E-02 1 EF Average 25%Dichloromethane 75-09-2 3.78E-02 1 EF Average 8%Tetrachloroethylene 127-18-4 5.31E-04 1 EF Average 7%Trichloroethylene 79-01-6 9.65E-04 1 EF Average 8%
EFFLUENT Odour [in OU/s) n/a - 3 6.00E+00 1 EF Average <1%1,1-Dichloroethylene 75-35-4 8.78E-05 1 EF Average 2%1,2-Dichloroethane 107-06-2 8.50E-06 1 EF Average <1%Ammonia 7664-41-7 5.08E-06 1 EF Average <1%Benzene 71-43-2 3.12E-05 1 EF Average <1%Chloroethane 75-00-3 2.44E-05 1 EF Average <1%Vinyl Chloride/Chloroethene 75-01-4 8.24E-05 1 EF Average 1%1,2-Dichloroethene (Cis) 156-59-2 3.92E-04 1 EF Average <1%Methane 74-82-8 1.53E-02 1 EF Average 4%Dichloromethane 75-09-2 1.62E-03 1 EF Average <1%Tetrachloroethylene 127-18-4 6.62E-05 1 EF Average <1%Trichloroethylene 79-01-6 1.22E-04 1 EF Average <1%
Odour [in OU/s) n/a - 3 8.09E+02 1 EF Average 11%1,1-Dichloroethylene 75-35-4 4.22E-03 1 EF Average 83%1,2-Dichloroethane 107-06-2 1.23E-03 1 EF Average 95%Ammonia 7664-41-7 1.64E-03 1 EF Average 2%Benzene 71-43-2 3.18E-03 1 EF Average 51%Chloroethane 75-00-3 1.69E-03 1 EF Average 68%Vinyl Chloride/Chloroethene 75-01-4 4.62E-03 1 EF Average 59%1,2-Dichloroethene (Cis) 156-59-2 7.48E-02 1 EF Average 71%Methane 74-82-8 3.62E-01 1 EF Average 92%Dichloromethane 75-09-2 4.42E-01 1 EF Average 91%Tetrachloroethylene 127-18-4 3.82E-03 1 EF Average 50%Trichloroethylene 79-01-6 1.01E-02 1 EF Average 81%
Total Suspended Particulate n/a - 1 7.22E-03 1 EF Above-Average <1%
Carbon Monoxide 630-08-0 7.80E-02 1 EF Above-Average <1%Sulphur Dioxide 7446-09-5 1.34E-01 1 EF Marginal 6%Nitrogen Oxides 10102-44-0 6.30E-01 1 EF Above-Average 18%
Total Suspended Particulate n/a - 1 8.32E-02 1 EF Marginal 4%
Carbon Monoxide 630-08-0 2.52E-01 1 EF Marginal 2%
Sulphur Dioxide 7446-09-5 7.75E-02 1 EF Marginal 4%
Nitrogen Oxides 10102-44-0 1.17E+00 1 EF Marginal 33%
CR Volume Impact Crusher n/a n/a n/a n/a n/a n/a 423790 5014099 Total Suspended Particulate n/a - 1 3.33E-02 1 EF Marginal 1%
ACTFCE [4] VolumeMaterial Loading at the Working Face of the
Active Stage N/A N/A N/A N/A N/A N/A 423763 5015382 Total Suspended Particulate n/a - 1 3.36E-03 1 EF Above-Average <1%
ACT_UNL [4] VolumeMaterial Unloading at the Working Face of the
Active Stage N/A N/A N/A N/A N/A N/A 423763 5015382 Total Suspended Particulate n/a - 1 3.36E-03 1 EF Above-Average <1%
CF_BD Area Bulldozing at the Construction Working Face N/A N/A N/A N/A N/A N/A 423623 5015244 Total Suspended Particulate n/a - 1 6.30E-01 1 EF Average 27%
CF_UNL [4] VolumeMaterial Unloading at the Construction Working
FaceN/A N/A N/A N/A N/A N/A 423625 5015266 Total Suspended Particulate n/a - 1 2.85E-02 1 EF Above-Average 1%
CWS_MH [4] VolumeMaterial Loading at the Construction Working
FaceN/A N/A N/A N/A N/A N/A 423626 5015265 Total Suspended Particulate n/a - 1 1.68E-03 1 EF Above-Average <1%
CSS_MH [4] VolumeMaterial loading and unloading at the
Contaminated Soil StockpileN/A N/A N/A N/A N/A N/A 423939 5015041 Total Suspended Particulate n/a - 1 1.34E-02 1 EC Above-Average <1%
OB_BD Area Bulldozing at the Overburden Pile N/A N/A N/A N/A N/A N/A 423790 5014937 Total Suspended Particulate n/a - 1 6.30E-01 1 EF Average 27%
OB_MH [4] Volume Material Loading at the Overburden Pile N/A N/A N/A N/A N/A N/A 423840 5014956 Total Suspended Particulate n/a - 1 1.68E-03 1 EC Above-Average <1%
LEACHGEN Point Emergency Diesel-Fired Generator for SBR 1.23 432 0.2 39.2 3.1 0.1 424298
RAWLEACH Point Raw Leachate Equalization Tank 0.0001 25 0.2 0.003 6.6
SLUDGE Point Sludge Tank 0.0001 25
6.6 0.6 424317 5014732
EFFLUENT Point Effluent Equalization Tank 0.0001 25 0.2
SBR Point Sequencing Batch Reactor Tank 0.0001 32 0.2 0.003
0.2 0.003 6.6 0.6 424340 5014708
0.003 6.6 0.6 424290 5014662
0.6 424269 5014684
5014726
CR_ENG Point Impact Crusher Diesel Engine 0.555 600 0.12 49.100 2 N/A 423800 5014110

5.1 Source Summary Table (by source) RWDI Project #1302177
Source Source Source Source Data Emission DataID [1] Type [1] Description Stack Stack Stack Stack Stack Stack Source Contaminant CAS Maximum Averaging Emission Emissions % of
Volumetric Exit Inner Exit Height Height Coordinates Number Emission Period Estimating Data OverallFlow Gas Diameter Velocity Above Above X Y Rate Technique [2] Quality [3] EmissionsRate Temp. Grade Roof
(Am³/s) (ºC) (m) (m/s) (m) (m) (m) (m) (g/s) (hours) (%)
1,1,1-Trichloroethane 71-55-6 6.00E-05 - - - - - - 100%
1,1,2,2-Tetrachloroethane 79-34-5 6.23E-06 - - - - - - 100%
1,1,2-Trichloroethane 79-00-5 7.72E-06 - - - - - - 100%
1,1-Dichloroethane 75-34-3 1.54E-03 - - - - - - 100%
1,1-Dichloroethylene 75-35-4 5.09E-03 - - - - - - 100%
1,2-Dichloroethane 107-06-2 1.30E-03 - - - - - - 100%
1,2-Dichloroethene (Cis) 156-59-2 1.05E-01 - - - - - - 100%
1,2-Dichloroethene (Trans) 156-60-5 1.71E-04 - - - - - - 100%
Ammonia 7664-41-7 1.05E-01 - - 100%
Benzene 71-43-2 6.29E-03 - - - - - - 100%
Bromodichloromethane 75-27-4 5.77E-07 - - - - - - 100%
Carbon Tetrachloride 56-23-5 9.94E-06 - - - - - - 100%
Chloroethane 75-00-3 2.48E-03 - - - - - - 100%
Chloroform/Trichloromethane 67-66-3 1.08E-04 - - - - - - 100%
Dichloromethane 75-09-2 4.85E-01 - - - - - - 100%
Dimethyl sulfide 75-18-3 8.81E-04 - - - - - - 100%
Ethyl Mercaptan 75-08-1 2.91E-06 - - - - - - 100%
Ethylene Dibromide 106-93-4 2.02E-06 - - - - - - 100%
Hydrogen sulfide 7783-06-4 1.08E-01 - - - - - - 100%
Methane 74-82-8 3.94E-01 - - - - - - 100%
Methyl Mercaptan 74-93-1 1.80E-06 - - - - - - 100%
Octane 111-65-9 3.33E-03 - - - - - - 100%
sec-Butyl Alcohol/2-Butanol 78-92-2 1.72E-02 - - - - - - 100%
Tetrachloroethylene 127-18-4 7.67E-03 - - - - - - 100%
Trichloroethylene 79-01-6 1.25E-02 - - - - - - 100%
Vinyl Chloride/Chloroethene 75-01-4 7.87E-03 - - - - - - 100%
Total Suspended Particulate n/a - 1 2.33E+00 - - - - - - 100%
Carbon Monoxide 630-08-0 1.61E+01 - - - - - - 100%
Nitrogen Oxides 10102-44-0 3.60E+00 - - - - - - 100%
Sulphur Dioxide 7446-09-5 2.13E+00 - - - - - - 100%
Dioxins, Furans and Dioxin-like PCBs [2] n/a - 2 4.05E-10 - - - - - - 100%
Odour [in OU/s) n/a - 3 7.69E+03 - - - - - - 100%
Notes:[1] Source ID, Source Type: should provide information on the modelling source type (e.g., Point, Area or Volume Source); the process source or sources within the modelling source (e.g., Process Line #1); and the stack or stacks within each process source.[2] Emission Estimating Technique Short-Forms are V-ST (Validated Source Test), “ST” (Source Test), EF (Emission Factor), MB (Mass Balance), and EC (Engineering Calculation).[3] Data Quality Categories: Highest; Above-Average; Average; and Marginal.[4] Emission rate shown for material handling sources and wind erosion sources are calculated using the threshold wind speed of 6.2 m/s
- - - - - - - - - -Total - - Total of all Listed Sources - - - - - -

6.1 Dispersion Modelling Input Summary Table RWDI Project #1302177
Relevant Section Title Description of How the Approved Dispersion Model was UsedSection of
theRegulationSection 8 Negligible Sources
Section 9 Same Structure Contamination Same structure contamination was not considered a part of this assessment. Section 10 Operating Conditions Please refer to Section 4.1 in the ESDM report.
Section 11 Source of Contaminant Please refer to Section 4.2 in the ESDM report.
Emission Rates
Section 12 Combined Effect ofAssumptions for OperatingConditions and Emission Rates
Section 13 Meteorological Conditions Please refer to Section 6.1.1 in the ESDM report.
Section 14 Area of Modelling Coverage Please refer to Section 6.1.2 in the ESDM report.
Section 15 Stack Height for Certain New Please refer to Section 6.1.3 in the report.Sources of Contaminant
Section 16 Terrain Data Please refer to Section 6.1.4 in the report.
Section 17 Averaging Periods Please refer to Section 6.1.5 in the report.Emissions were modelled for 10-minute, 1-hour, 24-hour and annual averaging times, to correspond with the POI Standards and MOE guidelines for the various contaminants. Odour emissions were modelled for a 10-minute averaging time, using the AERMOD dispersion model to compare to the MOE's 10 minute average criteria of 1 OU.
The following souces were determined to be insignificant - one exhaust serving the gas stripper (B3) in the Blower building and one landfill gas-fired boiler (BOILER), used at the leachate treatment facility. The gas stripper exhaust (B3) and landfill gas-fired boiler (BOILER) were both deemed to be insignificant based on MOE guidance. The MOE states that: sources which, in combination, represent less than 5% of total property–wide emissions of a contaminant can, in many cases, be considered insignificant sources. These sources were not included in the dispersion modelling assessment.
The operating conditions and emission rates (as decribed in the preceeding sections) were used in an approved dispersion model. The model predicted results that were less than the applicable POI Standards and MOE guidelines, therefore, no further refinments were made to either the operating conditions or emissions
Five years of local meteorological data (2006-2010) were used in the AERMOD dispersion model. The meteorological data set for the WCEC was developed by the MOE’s Environmental Monitoring and Reporting Branch (EMRB). This dataset, however, was based on the MOE’s regional meteorological data for Eastern Ontario, which considers surface data from the Ottawa International Airport. The Ottawa Airport, which is located approximately 25 km away from the landfill, is the nearest weather station providing the desired meteorological parameters on an hourly basis. The EMRB adjusted the regional meteorological dataset to account for local land uses surrounding the WCEC facility. The data set provided by the EMBR was used directly in the dispersion model, with no changes or alterations conducted by RWDI.
For AERMOD, the area of modelling coverage was designed to meet the requirements outlined in O.Reg. 419/05, s.14. A multi-tiered grid was designed to extend a minimum of 5 km from all sources located on-site. All receptors in the grid were positioned at ground level. The internal spacing was dependant on the receptor distance from the on-site sources.
Twenty-two (22) discrete (residential) receptors were considered in this assessment. Receptors were positioned at 1.5 metres above grade, which is considered to be a typical breathing zone height.
All stack heights are less than the allowable stack height obtained using the stack height formula defined under Section 15 of O. Reg. 419/05
Terrain information for the area surrounding the WCEC landfill facility was obtained from the MOE Ontario Digital Elevation Model Data web site. The terrain data are based on the North American Datum 1983 (NAD83) horizontal reference datum. These data were run through the AERMAP terrain pre-processor to estimate base elevations for receptors and to help the model account for changes in elevation of the surrounding terrain.
For the purposes of estimating emissions from the facility, a maximum operating scenario was considered. This scenario consists of simultaneous operation of all on-site sources at a maximum capacity, including the LGTE facility engine-generator sets, the landfill gas flares, the leachate treatment system and generators. The assessment also considered the concurrent maximum level of fugitive releases from the existing and proposed landfill mounds as well as material handling and processing emissions.
Emission rates were determined through the following estimation techniques; mass balance, emission factors, source testing, and engineering calculations.

7.1 Emission Summary Table RWDI Project #1302177
Receptor Contaminant CAS Total Air Maximum Averaging MOE Limiting Regulation Percentage
Number Facility Dispersion POI Period POI Effect Schedule of MOE
Emission Model Concentration Limit [1] # POI Limit
Rate Used
(g/s) (µg/m³) (hours) (µg/m³) (%)
Property Line Methyl chloroform (1,1,1-Trichloroethane) 71-55-6 6.00E-05 AERMOD 0.003 24 Hour 115000 Health Schedule 3 < 1%
Property Line 1,1,2,2-Tetrachloroethane 79-34-5 6.23E-06 AERMOD 0.0003 24 Hour 0.1 n/a n/a < 1%
Property Line 1,1,2-Trichloroethane 79-00-5 7.72E-06 AERMOD 0.0004 24 Hour 0.31 N/A JSL < 1%
Property Line Dichloroethane, 1,1- 75-34-3 1.54E-03 AERMOD 0.07 24 Hour 165 Health Schedule 3 < 1%
Property Line Vinylidene chloride (1,1-Dichloroethene) 75-35-4 5.09E-03 AERMOD 0.61 24 Hour 10 Health Schedule 3 6%
Property Line Ethylene dichloride 107-06-2 1.30E-03 AERMOD 0.2 24 Hour 2 Health Schedule 3 8%
Property Line Dichloroethylene, cis-1,2- 156-59-2 1.05E-01 AERMOD 12.2 24 Hour 105 Health Guideline 12%
Property Line Dichloroethylene, trans-1,2- 156-60-5 1.71E-04 AERMOD 0.008 24 Hour 105 Health Guideline < 1%
Property Line Ammonia 7664-41-7 1.05E-01 AERMOD 12.8 24 Hour 100 Health Schedule 3 13%
Property Line Benzene 71-43-2 6.29E-03 AERMOD 0.05 Annual 0.45 Health Schedule 3 11%
Property Line Bromodichloromethane 75-27-4 5.77E-07 AERMOD 0.00003 24 Hour 0.1 n/a n/a < 1%
Property Line Carbon tetrachloride 56-23-5 9.94E-06 AERMOD 0.0005 24 Hour 2.4 Health Schedule 3 < 1%
Property Line Chloroethane 75-00-3 2.48E-03 AERMOD 0.24 24 Hour 5600 Health Schedule 3 < 1%
Property Line Chloroform 67-66-3 1.08E-04 AERMOD 0.005 24 Hour 1 Health Schedule 3 < 1%
Property Line Methylene chloride 75-09-2 4.85E-01 AERMOD 58.9 24 Hour 220 Health Schedule 3 27%
Property Line Dimethyl sulphide 75-18-3 8.81E-04 AERMOD 0.37 10 Minute 30 Odour Guideline 1%
Property Line Ethylene dibromide 106-93-4 2.02E-06 AERMOD 0.00009 24 Hour 3 Health Guideline < 1%
R3 Hydrogen sulphide [2] 7783-06-4 1.08E-01 AERMOD 6 10 Minute 13 Odour Schedule 3 49%
Property Line Hydrogen sulphide [2] 7783-06-4 1.08E-01 AERMOD 2 24 Hour 7 Health Schedule 3 24%
Property Line Methane 74-82-8 3.94E-01 AERMOD 48 24 Hour n/a n/a n/a n/a
Property Line Mercaptans [3] 74-93-1 4.71E-06 AERMOD 0.002 10 Minute 13 Odour Schedule 3 < 1%
Property Line Octane 111-65-9 3.33E-03 AERMOD 1.4 10 Minute 61800 Odour Guideline < 1%
Property Line Butyl alcohol, sec- 78-92-2 1.72E-02 AERMOD 0.80 24 Hour 496 N/A JSL < 1%
Property Line Tetrachloroethylene 127-18-4 7.67E-03 AERMOD 0.58 24 Hour 360 Health Schedule 3 < 1%
Property Line Trichloroethylene (TCE) 79-01-6 1.25E-02 AERMOD 1.4 24 Hour 12 Health Schedule 3 12%
Property Line Vinyl chloride 75-01-4 7.87E-03 AERMOD 0.7 24 Hour 1 Health Schedule 3 73%
Property Line Carbon monoxide (single source) 630-08-0 1.61E+01 AERMOD 899 1/2 Hour 6000 Health Schedule 3 15%
Property Line Nitrogen oxides 10102-44-0 3.60E+00 AERMOD 229 1 Hour 400 Health Schedule 3 57%
Property Line Nitrogen oxides 10102-44-0 3.60E+00 AERMOD 84 24 Hour 200 Health Schedule 3 42%
Property Line Suspended particulate matter (< 44 µm diameter) n/a - 1 2.33E+00 AERMOD 41 24 Hour 120 Visibility Schedule 3 34%Property Line Sulphur dioxide 7446-09-5 2.13E+00 AERMOD 80 1 Hour 690 Health & Vegetation Schedule 3 12%Property Line Sulphur dioxide 7446-09-5 2.13E+00 AERMOD 60 24 Hour 275 Health & Vegetation Schedule 3 22%
Property Line Dioxins, Furans and Dioxin-like PCBs n/a - 2 4.05E-10 AERMOD 8.50E-09 24 Hour 1.00E-07 Health Schedule 3 8%
R8 Odour n/a - 3 7.69E+03 AERMOD 2.6 10 Minute n/a I n/a n/a
Notes:
[1] The term “MOE POI Limit” identified in Table D-4 refers to the following information (there may be more than one relevant MOE POI Limit for each contaminant):
- air quality standards in Schedules 1, 2 and 3 of the Regulation; and
- the guidelines for contaminants set out the MOE publication, “Summary of Standards and Guidelines to Support Ontario Regulation 419: Air Pollution – Local Air Quality"
- an acceptable concentration for contaminants with no standards or guidelines.
A = Ʃ((B x 48) / C), where,
A = the amount (or concentration) of total mercaptans, expressed as methyl mercaptan
B = the amount (or concentration) of each mercaptans
C = the molecular weight of each mercaptan
[3] For the purposes of the Regulation, mercaptans are expressed as methyl mercaptan; an amount (or concentration of total mercaptans shall be calculated in accordance with the following formula:
[2] A calibration factor of 3 was applied to all hydrogen sulphide concentrations.

Employee Job Title
FIGURES


#*#*#*#*
#*#*#*#*#*
#*#*#*
!(
!(
#*
#*
!(
F3F2
F1
E1E2
E3
E4E5
422000
422000
422500
422500
423000
423000
423500
423500
424000
424000
424500
424500
425000
425000
425500
425500
5014
000
5014
000
5014
500
5014
500
5015
000
5015
000
5015
500
5015
500
WCEC Landfill Site Plan
West Carleton Environmental Centre - Ottawa, Ontario Project #1302177
[True North
Date Revised: May 28, 2014
Approx. Scale:
Figure:Drawn by: NBN
1:15,0005.2
Map Projection: NAD 83 UTM 18N.
Imagery Credits: First Base Solutions Web Mapping Service, OttawaDivision, 2008; Service Layer Credits: Esri, HERE, DeLorme,MapmyIndia, © OpenStreetMap contributors 0 0.25 0.5 0.75 km
Legend!( Impact Crusher and Engine at WTPF
#* Landfill Face
#* Construction Face
!( Crusher and Engine
!( SBR Emergency Diesel-Fired Generator
#* LFG F lares & LFG-Fired Generator Sources
#* Effluent Equalization Tank
#* Raw Leachate Equalization Tank
#* Sequencing Batch Reactor Tank
#* Sludge TankIntermediate Operation Year Active StageContaminated Soil StockpileOverburden StockpileStage 1Stage 3Property LineExisting LandfillProposed Landfill

!'
!'!'
!'
!'
!'
!'
!'
!'
!'
!'
!'
!'
!'!'
!'
!' !'
!'
!'
!'
!'
R9
R8R7
R6
R5R4
R2
R24
R23
R22
R21
R20R19
R18
R17R16
R15R14
R13
R12
R11
R10
420000
420000
422000
422000
424000
424000
426000
426000
428000
428000
5014
000
5014
000
5016
000
5016
000
5018
000
5018
000
WCEC Landfill Discrete Receptor Locations
West Carleton Environmental Centre - Ottawa, Ontario Project #1302177
[True North
Date Revised: Mar. 12, 2014
Approx. Scale:
Figure:Drawn by: NBN
1:40,000
6.1.2Map Projection: NAD 83 UTM 18N.
Imagery Credits: First Base Solutions Web Mapping Service, OttawaDivision, 2008; Service Layer Credits: Copyright:© 2014 Esri,DeLorme, HERE, TomTom 0 0.5 1 1.5 km
Legend!' Discrete Receptors
Property LineExisting LandfillProposed Landfill

Figure 6.2 – Zoning Definitions
TABLE 35(B)- LIST OF PRIMARY ZONES AND CODES
(I) Zone Name (II) Zone Code
RESIDENTIAL ZONES (1) Residential First Density Zone R1 (2) Residential Second Density Zone R2 (3) Residential Third Density Zone R3 (4) Residential Fourth Density Zone R4 (5) Residential Fifth Density Zone R5 (6) Mobile Home Park Zone RM INSTITUTIONAL ZONES (7) Minor Institutional Zone I1 (8) Major Institutional Zone I2 OPEN SPACE AND LEISURE ZONES (9) Parks and Open Space Zone O1 (10) Community Leisure Facility Zone L1 (11) Major Leisure Facility Zone L2 (12) Central Experimental Farm Zone L3 ENVIRONMENTAL ZONE (13) Environmental Protection Zone EP COMMERCIAL/MIXED USE ZONES (14) Local Commercial Zone LC (15) General Mixed Use Zone GM (16) Traditional Mainstreet Zone TM (17) Arterial Mainstreet Zone AM (18) Mixed Use Centre Zone MC (19) Mixed Use Downtown Zone MD

INDUSTRIAL ZONES (20) Business Park Industrial Zone IP (21) Light Industrial Zone IL (22) General Industrial Zone IG (23) Heavy Industrial Zone IH TRANSPORTATION ZONES (24) Air Transportation Facility Zone T1 (25) Ground Transportation Facility Zone
T2
RURAL ZONES (26) Agricultural Zone AG (27) Mineral Extraction Zone ME (28) Mineral Aggregate Reserve Zone MR (29) Rural Commercial Zone RC (30) Rural General Industrial Zone RG (31) Rural Heavy Industrial Zone RH (32) Rural Institutional Zone RI (33) Rural Residential Zone RR (34) Rural Countryside Zone RU (35) Village Mixed Use Zone VM (36) Village Residential First Density Zone
V1
(37) Village Residential Second Density Zone
V2
(38) Village Residential Third Density Zone
V3
OTHER ZONES (39) Development Reserve Zone DR

Figure 6.2a ‐ Zoning Map for Ottawa LandfillShowing Lands South and West of the Landfill Showing Lands South and West of the Landfill
Ottawa Landfill

Figure 6.2b ‐ Zoning Map for Ottawa LandfillShowing Lands North and East of the Landfill Showing Lands North and East of the Landfill
Ottawa Landfill

APPENDIX A Please See Attached CD

Employee Job Title
APPENDIX B

Appendix B: Supporting Information for Assessment of NegligibilityBased on Leachate Management System
Contaminant Contaminant Source Source Contaminant Distance Reg. 419 Criteria [1] Regulation Criteria Limiting Table B-1 Table B-1 Predicted ContaminantName CAS ID Description Emission to Standard 50% of Standard Schedule Averaging Effect 1-hour Dispersion Concentration Negligible?
Number Rate Property or or de minimus # Time Dispersion Factor(by source) Line Guideline Factor for Converted
[2] Shortest to CriteriaDistance to Averaging
Property TimeLine [2]
(g/s) (m) (µg/m³) (µg/m³) (hours) (µg/m³ / g/s) (µg/m³ / g/s) (µg/m³)1,1 Dichloroethene (vinylidene chloride) 75-35-4 total leachate management plant 5.03E-03 380 10 5 3 24 health 1700 680 3.42E+00 yes1,2 Dichloroethane 107-06-2 total leachate management plant 1.29E-03 380 2 1 3 24 health 1700 680 8.75E-01 yes1,3,5 Trimethylbenzene 108-67-8 total leachate management plant 2.67E-04 380 220 110 3 24 heath 1700 680 1.82E-01 yes1,4 Dichlorobenzene (-p) 106-46-7 total leachate management plant 9.70E-04 380 95 47.5 3 24 health 1700 680 6.60E-01 yes1-Methylnaphthalene 90-12-0 total leachate management plant 6.24E-06 380 12 6 JSL 24 -- 1700 680 4.24E-03 yes1-Methylphenanthrene 832-69-9 total leachate management plant 1.15E-06 380 0.1 0.05 de minimus 24 -- 1700 680 7.82E-04 yes2-Methylnaphthalene 91-57-6 total leachate management plant 3.90E-06 380 10 5 JSL 24 -- 1700 680 2.65E-03 yesAcenaphthylene 120-12-7 total leachate management plant 1.42E-06 380 0.2 0.1 JSL 24 -- 1700 680 9.66E-04 yesAcetone (2-Propanone) 67-64-1 total leachate management plant 2.40E-01 380 11800 5900 3 24 health 1700 680 1.63E+02 yesAmmonia 7664-41-7 total leachate management plant 1.45E+00 380 100 50 3 24 health 1700 680 9.89E+02 noBenzene 71-43-2 total leachate management plant 2.43E-01 380 2.3 1.15 3 (annual equivalent) 24 health 1700 680 1.66E+02 noBiphenyl 92-52-4 total leachate management plant 2.25E-06 380 60 30 24-hr guideline 1 odour 1700 680 1.53E-03 yesBis(2-Ethylhexyl)Phthalate 117-81-7 total leachate management plant 5.41E-06 380 50 25 3 24 health 1700 680 3.68E-03 yesChlorobenzene 108-90-7 total leachate management plant 4.14E-04 380 3500 1750 3 1 health 1700 1700 7.04E-01 yesChlorobenzene 108-90-7 total leachate management plant 4.14E-04 380 4500 2250 3 10-min odour 1700 2805 1.16E+00 yesChloroethane (ethyl chloride) 75-00-3 total leachate management plant 1.98E-03 380 5600 2800 3 24 health 1700 680 1.35E+00 yesChloroethylene (vinyl chloride) 75-01-4 total leachate management plant 5.95E-03 380 1 0.5 3 24 health 1700 680 4.04E+00 noChloromethane (methylchloride) 74-87-3 total leachate management plant 4.58E-03 380 320 160 3 24 health 1700 680 3.11E+00 yescis-1,2 Dichloroethylene 156-59-2 total leachate management plant 1.02E-01 380 105 52.5 24-hr guideline 24 health 1700 680 6.92E+01 noEthylbenzene 100-41-4 total leachate management plant 2.70E-02 380 1000 500 3 24 health 1700 680 1.83E+01 yesFluorene 86-73-7 total leachate management plant 5.87E-07 380 0.1 0.05 de minimus 24 -- 1700 680 3.99E-04 yesMethyl Ethyl Ketone (2-Butanone) 78-93-3 total leachate management plant 1.10E-01 380 1000 500 3 24 health 1700 680 7.48E+01 yesMethane 74-82-8 total leachate management plant 4.95E-01 380 0.1 0.05 de minimus 24 -- 1700 680 3.37E+02 noMethylene Chloride (dichloromethane) 75-09-2 total leachate management plant 5.22E-01 380 220 110 3 24 health 1700 680 3.55E+02 noNaphthalene 91-20-3 total leachate management plant 8.50E-04 380 22.5 11.25 24-hr guideline 24 health 1700 680 5.78E-01 yesNaphthalene 91-20-3 total leachate management plant 8.50E-04 380 50 25 24-hr guideline 10-min odour 1700 2805 2.38E+00 yesPhenanthrene 85-01-8 total leachate management plant 2.93E-06 380 0.1 0.05 de minimus 24 -- 1700 680 1.99E-03 yesPhenol 108-95-2 total leachate management plant 3.37E-05 380 30 15 3 24 health 1700 680 2.29E-02 yesQuinoline 91-22-5 total leachate management plant 5.60E-06 380 0.1 0.05 de minimus 24 -- 1700 680 3.81E-03 yesStyrene 100-42-5 total leachate management plant 6.00E-02 380 400 200 3 24 health 1700 680 4.08E+01 yesSulphate 18785-72-3 total leachate management plant 2.25E-15 380 0.1 0.05 de minimus 24 -- 1700 680 1.53E-12 yesTetrachloroethene 127-18-4 total leachate management plant 4.52E-03 380 360 180 3 24 health 1700 680 3.07E+00 yesToluene 108-88-3 total leachate management plant 1.14E+00 380 2000 1000 24-hr guideline 24 odour 1700 680 7.72E+02 yesTrichloroethylene 79-01-6 total leachate management plant 1.14E-02 380 12 6 3 24 health 1700 680 7.76E+00 noXylene 1330-20-7 total leachate management plant 1.99E-01 380 730 365 3 24 health 1700 680 1.36E+02 yes
Notes:[1] 50% of MOE Schedule 1, 2 or 3 Standard, or de-minimus values as per Appendix B of the Guide to Preparing an ESDM Report.[2] Use dispersion factor associated with shortest distance to property line for all sources emitting the contaminant. For the Ottawa Landfill leachate plant, the closest source to the property line has a separation distance of 680m.

Employee Job Title
APPENDIX C

Appendix C: Comparison of Results from Scenarios Evaluated as part of the EA
Summary of Maximum Predicted 24-Hour Concentrations Off-site for Each Future Build Scenario
Average Sample
ConcentrationAveraging MOE
(mg/m³) Period POI
(hours) Limit
(µg/m³) Maximum Percentage Maximum Percentage
Predicted of MOE Predicted of MOE
Concentration POI Limit Concentration POI Limit
(µg/m³) (%) (µg/m³) (%)
71-55-6 1,1,1-Trichloroethane 0.16 24 Hour 115,000 2.77E-03 <0.1% 2.53E-03 <0.1%
79-34-5 1,1,2,2-Tetrachloroethane 0.017 n/a n/a 2.91E-04 n/a 2.65E-04 n/a
79-00-5 1,1,2-Trichloroethane 0.02 24 Hour 0.31 3.61E-04 0% 3.29E-04 0%
75-34-3 1,1-Dichloroethane 4.1 24 Hour 165 7.20E-02 <0.1% 6.56E-02 <0.1%
75-35-4 1,1-Dichloroethylene 0.17 24 Hour 10 6.06E-01 6% 6.06E-01 6%
107-06-2 1,2-Dichloroethane 0.02 24 Hour 2 1.58E-01 8% 1.58E-01 8%
156-59-2 1,2-Dichloroethene (Cis) 9.63 24 Hour 105 1.22E+01 12% 1.22E+01 12%
156-60-5 1,2-Dichloroethene (Trans) 0.45 24 Hour 105 7.97E-03 <0.1% 7.27E-03 <0.1%
71-43-2 Benzene 3.62 24 Hour 2.3 4.31E-01 19% 4.29E-01 19%
75-27-4 Bromodichloromethane 0.002 n/a n/a 2.70E-05 n/a 2.46E-05 n/a
56-23-5 Carbon Tetrachloride 0.03 24 Hour 2.4 4.64E-04 <0.1% 4.23E-04 <0.1%
75-00-3 Chloroethane 1.34 24 Hour 5600 2.44E-01 <0.1% 2.44E-01 <0.1%
67-66-3 Chloroform/Trichloromethane 0.29 24 Hour 1 5.02E-03 1% 4.58E-03 0%
75-09-2 Dichloromethane 2.43 24 Hour 220 5.89E+01 27% 5.89E+01 27%
106-93-4 Ethylene Dibromide 0.01 24 Hour 3 9.42E-05 <0.1% 8.59E-05 <0.1%
04/06/7783 Hydrogen sulphide 288 24 Hour 7 1.68E+00 24% 1.53E+00 22%
sec-Butyl Alcohol/2-Butanol
(as n-Butanol)
127-18-4 Tetrachloroethylene 8.36 24 Hour 360 5.80E-01 0% 5.75E-01 0%
79-01-6 Trichloroethylene 2.76 24 Hour 12 1.39E+00 12% 1.39E+00 12%
75-01-4 Vinyl Chloride/Chloroethene 5.11 24 Hour 1 7.35E-01 73% 7.32E-01 73%
7664-41-7 Ammonia n/a 24 Hour 100 1.28E+01 13% 1.28E+01 13%
2023 – Future Build
78-92-2 45.7 24 Hour 920 8.23E-01 <0.1% 8.39E-01 <0.1%
CAS # Compounds
2018 – Future Build

Summary of Maximum Predicted 10-Minute Results at Discrete Receptors for Each Future Build Scenario – Contingency Leachate Management System
Receptor
No. Maximum Frequency Frequency Maximum Frequency Frequency
10-Minute Average Concentration
(OU/m³)>1 OU >3 OU
10-Minute Average
Concentration
(OU/m³)
>1 OU >3 OU
2 2.5 0.36% -- 2.5 0.33% --
3 1.4 0.10% -- 2.7 0.18% --
4 2.5 0.16% -- 2.4 0.19% --
5 0.5 -- -- 0.5 -- --
6 1 0.01% -- 0.8 -- --
7 0.8 -- -- 0.6 -- --
8 2.6 0.15% -- 2.6 0.13% --
9 2.1 0.48% -- 1 -- --
10 0.5 -- -- 0.7 -- --
11 0.7 -- -- 1 -- --
12 0.8 -- -- 1.3 0.02% --
13 1 -- -- 1 -- --
14 1.5 0.08% -- 1.6 0.35% --
15 1.1 0.01% -- 1.1 0.04% --
16 0.8 -- -- 0.6 -- --
17 0.6 -- -- 0.5 -- --
18 1.9 0.14% -- 1.8 0.09% --
19 1.1 0.02% -- 0.9 -- --
20 0.7 -- -- 0.5 -- --
21 0.6 -- -- 0.7 -- --
22 0.4 -- -- 0.6 -- --
23 0.4 -- -- 0.5 -- --
24 0.3 -- -- 0.3 -- --
2018 - Future Build 2023 - Future Build
The worst-case concentration occurs in the 2023 Future Build Year, however it is less than 4% higher than the worst case concentration in the 2018 Future Build Year. The worst-case
frequency of exceedences (0.48%) occurs in the 2018 Future Build Year, and it if far exceeds the worst case frequency of exceedences in the 2023 Future Build Year. Therefore, the 2018
Future Build Year, or as referred to in the ECA the mid year operation scenario, was the evaluated worst-case scenario.

Employee Job Title
APPENDIX D

Appendix D1 - Existing Landfill Mound LFG Emission Rates - Based on Scaling 2010 Flow Data
Landfill Gas Consumed (2010) 48,911,689 m³/year (from flowmeter data as provided in 2010 NPRI Info)
% of LM_EX with Gas Collection System in Place 100%
Estimated Efficiency of LFG Collection System 85%
Overall Gas Collection 85%
Total Landfill Gas Generated 57,543,164 m³/year (based on gas consumed & overall gas collection)
Total Landfill Gas Released 8,631,475 m³/year (based on gas generated & overall gas collection)
Continuous Emission Rate 0.27 m³/s
Emission Flux Rate from Landfill
Landfill Area 355,013 m² (actual area)
Landfill Area 365,726 m² (modelled area)
Notes:
[1] Using flowmeter data provided in 2010 NPRI Info and Landgem LFG Output, a ratio was calculated and applied to other years to predict actual LFG generation rates
Ratio Gas Generated/LANDGEM Prediction = 1.64
Scenario Year
LANDGEM
Emissions
(m3/year)
Total Landfill
Gas Generated
(m3)
Collection
Efficiencies
Total Landfill
Gas Released
(m3)
Continuous
Emission Rate
(m3/s)
Intermediate Operation
Year2018 24,834,505 40,751,168 0.85 6,112,675 0.194
DESCRIPTION Emission RateEmission
Flux Rate
CAS # COMPOUND mg/m3
g/m3 g/s g/m
2/s
71-55-6 1,1,1-Trichloroethane 0.158 1.58E-04 3.07E-05 8.39E-11
79-34-5 1,1,2,2-Tetrachloroethane 0.017 1.66E-05 3.22E-06 8.79E-12
79-00-5 1,1,2-Trichloroethane 0.021 2.06E-05 3.99E-06 1.09E-11
75-34-3 1,1-Dichloroethane 4.10 4.10E-03 7.95E-04 2.17E-09
75-35-4 1,1-Dichloroethylene 0.17 1.68E-04 3.25E-05 8.89E-11
107-06-2 1,2-Dichloroethane 0.016 1.62E-05 3.13E-06 8.57E-12
156-59-2 1,2-Dichloroethene (Cis) 9.63 9.63E-03 1.87E-03 5.10E-09
156-60-5 1,2-Dichloroethene (Trans) 0.45 4.55E-04 8.81E-05 2.41E-10
71-43-2 Benzene 3.62 3.62E-03 7.01E-04 1.92E-09
75-27-4 Bromodichloromethane 0.002 1.54E-06 2.98E-07 8.15E-13
56-23-5 Carbon Tetrachloride 0.026 2.65E-05 5.13E-06 1.40E-11
75-00-3 Chloroethane 1.34 1.34E-03 2.59E-04 7.08E-10
67-66-3 Chloroform/Trichloromethane 0.29 2.86E-04 5.55E-05 1.52E-10
75-09-2 Dichloromethane 2.43 2.43E-03 4.72E-04 1.29E-09
75-18-3 Dimethyl sulfide [2] 2.35 2.35E-03 4.55E-04 1.24E-09
75-08-1 Ethyl Mercaptan 0.008 7.75E-06 1.50E-06 4.11E-12
106-93-4 Ethylene Dibromide 0.01 5.37E-06 1.04E-06 2.85E-12
04-06-7783 Hydrogen sulfide [2] 288.15 2.88E-01 5.59E-02 1.53E-07
74-93-1 Methyl Mercaptan 0.005 4.80E-06 9.31E-07 2.55E-12
111-65-9 Octane 8.70 8.70E-03 1.69E-03 4.61E-09
78-92-2 sec-Butyl Alcohol/2-Butanol 45.70 4.57E-02 8.86E-03 2.42E-08
127-18-4 Tetrachloroethylene 8.36 8.36E-03 1.62E-03 4.43E-09
79-01-6 Trichloroethylene 2.76 2.76E-03 5.35E-04 1.46E-09
75-01-4 Vinyl Chloride/Chloroethene 5.11 5.11E-03 9.91E-04 2.71E-09
Notes:
[1] Average Concentrations are based on the LFG Analysis results of measurements taken in 2004 and in 2011.
The resulting concentrations were averaged for the 2004 and 2011 period.
The highest average concentration was used to estimate the emission rates and emission flux rate.
[2] Sulphur Compounds concentrations were highest in 2011 and are an average of six sample concentration results
Sample Calculations
Total Landfill Gas Generated (m3) = 24,834,505 m
3 1.64 (Gas Generated)
year Landgem Prediction
Total Landfill Gas Generated (m3) = 40,751,168
Total Landfill Gas Released (m3) = 40,751,168 m
31-0.85 (Collection Efficiency)
Total Landfill Gas Released (m3) = 6,112,675
Continuous LFG Emission Rate (m3/s) = 6,112,675 m
3 1 year 1 day 1 hour
year 365 days 24 hours 3600s
Continuous LFG Emission Rate (m3/s) = 0.194
Benzene Emission Rate (g/s) = 0.003617 g 0.194 m3
m3 s
Benzene Emission Rate (g/s) = 0.000701
Benzene Emission Flux Rate (g/s/m2) = 0.000701 g
s 365,726 m2
Benzene Emission Flux Rate (g/s/m2) = 1.92E-09
Average Concentration [1]
Collection Efficiency 0.850
2018
Flow Rate (m³/s) 0.194

REPORT OF ANALYSIS: EPA624/TO-14 Target Compounds in mg/m³
REPORT: 11017 (Method - SCAN ATD-GC-MSD Cryogenic Oven Control)
DESCRIPTION 11042003 11042004 11042005 11042006
CAS # COMPOUNDNo.1-VOC
4/19/11V=5.0mL
No.1-VOC4/19/11V=15mL
No.2-VOC4/19/11V=15mL
No.3-VOC4/19/11V=15mL
POI(Ontario)(ug/m³)
Target Compounds
74-93-1 Methyl Mercaptan 0.011 0.003 0.003 0.003 -
75-01-4 Vinyl Chloride 4.53 4.25 5.88 5.80 3
75-08-1 Ethyl Mercaptan 0.017 0.005 0.005 0.004 -
75-00-3 Chloroethane 0.083 0.153 0.200 0.198 -
75-18-3 Dimethyl Sulfide 0.014 0.004 0.004 0.003 30
75-35-4 1,1-Dichloroethylene 0.047 0.049 0.072 0.066 30
75-09-2 Dichloromethane 0.592 0.592 0.831 0.797 5300
156-60-5 1,2-Dichloroethene (trans) 0.274 0.348 0.531 0.505 315
75-34-3 1,1-Dichloroethane 0.992 1.015 1.451 1.378 600
78-92-2 2-Butanol 0.025 0.007 0.006 0.006 -
156-59-2 1,2-Dichloroethene (cis) 7.75 8.15 11.58 11.04 315
67-66-3 Chloroform 0.056 0.072 0.103 0.100 300
56-23-5 Carbon Tetrachloride 0.059 0.017 0.016 0.014 1800
71-55-6 1,1,1-Trichloroethane 0.093 0.143 0.206 0.191 350000
71-43-2 Benzene 2.33 2.45 3.68 3.44 1
107-06-2 1,2-Dichloroethane 0.036 0.010 0.010 0.009 6
79-01-6 Trichloroethylene 1.37 1.45 2.23 2.10 3500
75-27-4 Bromodichloromethane 0.003 0.001 0.001 0.001 -
111-65-9 Octane 4.67 4.53 6.60 6.07 45400
79-00-5 1,1,2-Trichloroethane 0.046 0.013 0.012 0.011 -
127-18-4 Tetrachloroethylene 3.90 4.39 6.72 6.31 10000
106-93-4 1,2-Dibromoethane 0.012 0.003 0.003 0.003 -
79-34-5 1,1,2,2-Tetrachloroethane 0.037 0.011 0.010 0.009 -
TVOCs (Toluene) 552 381 661
POI = Half Hour Point of Impingement (Ontario Ministry of Environment)
V = Volume of air sampled
NB - Values in bold represent "Less Thans"

REPORT OF ANALYSIS: Selected and Target Compounds in mg/m³
REPORT: 04024 (Methods 1c, 3a, 5b, 6b)
DESCRIPTION 04061105 04061106 04061107 0
CAS # COMPOUNDVOC1
V=5mLVOC2
V=5mLVOC3
V=5mLPOI (Ontario)
(mg/m³)
Target Compounds74-93-1 Methyl Mercaptan ND ND ND 0.0275-08-1 Ethyl Mercaptan ND ND ND 0.0275-01-4 Vinyl Chloride/Chloroethene 3.74 3.65 3.88 0.00375-00-3 Chloroethane 1.218 1.361 1.427 -75-35-4 1,1-Dichloroethylene 0.1704 0.1632 0.1698 0.0375-18-3 Dimethyl Sulphide 2.27 2.34 2.46 0.0375-09-2 Dichloromethane 2.61 2.29 2.40 5.3
156-60-5 1,2-Dichloroethene (Trans) 0.448 0.453 0.463 0.31575-34-3 1,1-Dichloroethane 4.09 4.00 4.22 0.6
156-59-2 1,2-Dichloroethene (Cis) 8.00 7.70 8.11 0.31578-92-2 sec-Butyl Alcohol/2-Butanol 45.3 43.9 47.9 -67-66-3 Chloroform/Trichloromethane 0.307 0.281 0.271 0.371-55-6 1,1,1-Trichloroethane 0.1231 0.1053 0.1199 35056-23-5 Carbon Tetrachloride ND ND ND 0.007271-43-2 Benzene 3.67 3.51 3.67
107-06-2 1,2-Dichloroethane ND ND ND 0.00679-01-6 Trichloroethylene 2.83 2.66 2.79 3.575-27-4 Bromodichloromethane ND ND ND -
111-65-9 Octane 8.88 8.26 8.95 45.479-00-5 1,1,2-Trichloroethane ND ND ND -
127-18-4 Tetrachloroethylene 8.36 8.16 8.56 10106-93-4 Ethylene Dibromide ND ND ND 0.00979-34-5 1,1,2,2-Tetrachloroethane ND ND ND -
Selected Compounds15-07-1/74-98-1-Propene/Propane 48.2 49.3 49.4 -
75-28-5 2-Methyl Propane/Isobutane 17.80 16.83 17.87 -115-11-7 Isobutene/2-Methyl-1-Propene 7.69 7.53 8.24 -67-56-1 Methanol 2.58 2.31 3.73 1278-78-4 2-Methyl Butane 5.82 5.74 6.57 -75-69-4 Trichlorofluoromethane(11) 0.995 1.033 1.155 18
9-67-1/1191-961-Pentene/Ethyl Cyclopropane 0.323 0.279 0.298 -109-66-0 Pentane 5.15 4.73 5.28 -64-17-5 Ethanol 76.3 77.7 81.6 19
123-38-6 Propanal 1.270 1.272 1.414 0.00767-64-1 Acetone 17.66 17.73 18.26 4875-15-0 Carbon Disulphide 0.814 U 0.473 0.3367-63-0 Isopropyl Alcohol 25.7 25.6 26.8 2475-05-8 Acetonitrile 0.1199 0.209 0.1349 -79-29-8 2,3-Dimethyl Butane 0.512 0.573 0.649 -79-20-9 Methyl Acetate 1.041 1.361 1.400 -
107-83-5 2-Methyl Pentane 4.16 4.08 4.24 -96-14-0 3-Methyl Pentane 3.51 3.35 3.57 -
92-41-6/763-29 1-Hexene/2-Methyl-1-Pentene 0.416 0.355 0.370 -110-54-3 Hexane 7.85 7.78 8.17 3571-23-8 n-Propanol 38.1 38.2 39.8 48
534-22-5 2-Methyl Furan 1.188 1.149 1.062 -123-72-8 n-Butanal 4.94 4.91 4.68 -96-37-7 Methyl Cyclopentane 3.63 3.37 3.22 -78-93-3 MEK/2-Butanone 41.0 39.7 41.1 30
141-78-6 Ethyl Acetate 14.33 13.39 13.88 19109-99-9 Tetrahydrofuran 6.36 5.95 5.75 93591-76-4 2-Methyl Hexane 5.8 5.82 5.72 -589-34-4 3-Methyl Hexane 9.78 9.80 9.87 -565-59-3 2,3-Dimethyl Pentane 2.95 2.81 2.75 -

REPORT OF ANALYSIS: Selected and Target Compounds in mg/m³
REPORT: 04024 (Methods 1c, 3a, 5b, 6b)
DESCRIPTION 04061105 04061106 04061107 0
CAS # COMPOUNDVOC1
V=5mLVOC2
V=5mLVOC3
V=5mLPOI (Ontario)
(mg/m³)
78-83-1 Isobutyl Alcohol/2-Methyl-1-Pro 5.92 5.61 5.23 -142-82-5 Heptane 13.47 13.78 14.12 3371-36-3 n-Butanol 41.2 41.4 44.7 2.278
108-87-2 Methyl Cyclohexane 19.60 19.43 19.92 -592-27-8 2-Methyl Heptane 6.18 5.92 6.12 -589-53-7 4-Methyl Heptane 2.11 2.01 6.17 -589-81-1 3-Methyl Heptane 5.27 5.13 5.11 -108-10-1 4-Methyl-2-Pentanone/MIBK 8.30 8.00 8.61 1.2108-88-3 Toluene 65.4 61.9 62.3 2123-86-4 Butyl Acetate 16.01 15.49 16.57 0.735108-90-7 Chlorobenzene 3.45 3.36 3.45 4.2100-41-4 Ethyl Benzene 31.9 29.3 29.2 3
08-38-3/106-42 m/p-Xylene 73.7 65.9 67.1 2.3*95-47-6 o-Xylene 26.5 24.0 24.8 2.3*
1678-92-8 Propyl Cyclohexane 41.1 42.2 43.6 -98-82-8 Cumene/Isopropyl Benzene 6.36 5.87 6.13 0.179-92-5 Camphene 41.6 40.9 42.2 -
103-65-1 Propyl Benzene 7.36 6.64 7.10 -20-14-4/622-96 m/p-Ethyl Toluene 25.1 22.7 23.9 -
124-18-5 Decane 70.1 63.5 66.2 -611-14-3 o-Ethyl Toluene 14.14 12.70 13.40 -95-63-6 1,2,4-Trimethyl Benzene 20.9 18.83 19.88 0.5
13466-78-9 3-Carene 3.54 3.64 4.01 -8-86-3/5989-27Limonene/D-Limonene 64.5 58.1 59.7 -
99-87-6 p-Cymene 36.1 32.6 33.4 -106-46-7 1,4-Dichlorobenzene 14.04 12.18 13.02 -
1120-21-4 Undecane 23.9 21.4 23.1 -541-02-6 Decamethyl Cyclopentasiloxan 11.91 11.69 14.13 -112-40-3 Dodecane 2.59 2.31 2.70 -540-97-6 Dodecamethyl Cyclohexasiloxa 6.61 6.25 6.16 -
- Aromatics 76.4 58.3 70.6- Aliphatics 244 228 243- Cycloaliphatics 109.0 101.0 116.7- Oxygenates 403 406 324- Complex 176.4 129.8 209
TVOCs (Toluene) 1408 1315 1379
POI = Half Hour Point of Impingement (Ontario Ministry of Environment)U = Unresolved due to co-elution< (ND) = Characteristic ions are not present therefore Not Detected* & ** = Sum of all isomersV = Volume of air sampled

RWDI West IncMaxxam Job #: B153692 Client Project #: WM OTTAWAReport Date: 2011/04/21 Project name:
Your P.O. #: 1100798Sampler Initials:
COMPRESSED GAS PARAMETERS (AIR)Maxxam ID JG2672 JG2672 JG2673 JG2674 JG2674Sampling Date 19/04/2011 19/04/2011 19/04/2011 19/04/2011 19/04/2011COC Number na na na na na
Units SAMPLE1 SAMPLE1 Lab-Dup SAMPLE 2 RDL SAMPLE 3 SAMPLE 3 Lab-Dup RDL QC BatchOxygen % v/v 5.2 N/A 2.9 0.1 2.9 2.9 0.1 2464878Nitrogen % v/v 19.5 N/A 12.0 0.1 11.9 12.0 0.1 2464878Methane % v/v 45.0 N/A 50.7 0.1 50.6 51.1 0.1 2464878Carbon Dioxide % v/v 30.8 N/A 34.8 0.1 34.9 35.2 0.1 2464878Carbon Monoxide % v/v ND N/A ND 0.1 ND ND 0.1 2464878Hydrogen sulfide ppmv 170 180 180 1.5 290 N/A 2.5 2464828Carbonyl sulfide ppmv ND ND ND 0.40 ND N/A 0.40 2464828Methyl mercaptan ppmv 0.96 0.90 0.90 0.80 1.1 N/A 0.80 2464828Ethyl mercaptan ppmv 0.55 0.43 ND 0.40 0.47 N/A 0.40 2464828Dimethyl sulfide ppmv 1.4 1.6 1.6 0.80 1.7 N/A 0.80 2464828Dimethyl disulfide ppmv ND ND ND 0.80 ND N/A 0.80 2464828
ND = Not detectedN/A = Not ApplicableRDL = Reportable Detection LimitLab-Dup = Laboratory Initiated DuplicateEDL = Estimated Detection LimitQC Batch = Quality Control Batch

RWDI AirAtt: Brad Bergeron650 Woodlawn RoadGuelph ON, N1K 1B8
Project Number: J11061Client # 1100798Report Date: 30-Apr-11Analysis Date: 29-Apr-11Receipt Date 29-Apr-11Analytical Method:Unit: All results reported in mole ppm by volumeSample Type: Tedlar Bag
Results Detection Limit TRS-1 TRS-2 TRS-3
Marix gases
CO 100 <100 <100 <100O2 100 31439 22240 20985
CO2 100 415403 446814 427069CH4 100 428771 440616 465959N2 100 124213 90146 85803
Sulfur Compounds
Hydrogensulfide 0.01 173 183 182Methyl mercaptan 0.01 0.55 0.58 0.56Ethyl Mercaptan 0.01 0.26 0.29 0.26Dimethyl Sulfide 0.01 0.18 0.20 0.18
Dimethyl Disulfide 0.01 0.05 0.06 0.05Carbonyl Sulfide 0.01 <0.01 <0.01 <0.01
Analyst Quang Tran, M. Sc.
Manager Air Monitoring Philip Fellin, M.Sc.
This report shall not be reproduced except in full and only with the approval of the laboratory.
Airzone One 222 Matheson Boulevard East Mississauga, Ontario L4Z 1X1
Sample Analysis Report
Gas Chromatography/Flame Photometric Detection/ (GC/FPD)
Tel: (905) 890-6957 Fax: (905) 890-8629 www.airzoneone.com


Appendix D7 - Existing Landfill Mound Odour Emission Rates - Based on Scaling 2010 Flow Data
Odour Concentration of Landfil Gas 10,000 OU/m³
Landfill Gas Consumed (2010) 48,911,689 m³/year (from flowmeter data as provided in 2010 NPRI Info)
% of LM_EX with Gas Collection System in Place 100%
Estimated Efficiency of LFG Collection System 85%
Overall Gas Collection 85%
Total Landfill Gas Generated 57,543,164 m³/year (based on gas consumed & overall gas collection)
Total Landfill Gas Released 8,631,475 m³/year (based on gas generated & overall gas collection)
Continuous Emission Rate 0.27 m³/s
Emission Flux Rate from Landfill
Landfill Area 355,013 m² (actual area)
Landfill Area 365,726 m² (modelled area)
Notes:
[1] Using flowmeter data provided in 2010 NPRI Info and Landgem LFG Output, a ratio was calculated and applied to other years to predict actual LFG generation rates
Ratio Gas Generated/LANDGEM Prediction = 1.64
Year
LANDGEM
Emissions
(m3/year)
Total Landfill
Gas Generated
(m3/year)
Collection
Efficiencies
Total Landfill
Gas Released
(m3/year)
Continuous
Emission
Rate (m3/s)
Odour
Emission
Rate
(OU/s)
Odour
Emission
Flux Rate
(OU/m2/s)
Intermediate Operation Year (2018) 24,834,505 40,751,168 0.85 6,112,675 0.194 1938 5.30E-03
Sample Calculations
Total Landfill Gas Generated (m3) = 24,834,505 m
3 1.64 (Gas Generated)
year Landgem Prediction
Total Landfill Gas Generated (m3) = 40,751,168
Total Landfill Gas Released (m3) = 40,751,168 m
31-0.85 (Collection Efficiency)
Total Landfill Gas Released (m3) = 6,112,675
Continuous LFG Emission Rate (m3/s) = 6,112,675 m
3 1 year 1 day 1 hour
year 365 days 24 hours 3600s
Continuous LFG Emission Rate (m3/s) = 0.194
Odour Emission Rate (OU/s) = 10,000 OU 0.194 m3
m3 s
Odour Emission Rate (g/s) = 1938
Odour Emission Flux Rate (g/s/m2) = 1938 OU
s 365,726 m2
Odour Emission Flux Rate (OU/s/m2) = 5.30E-03
"upper range" estimate of odour concentrationfrom the MOE's Interim Guide to Estimate
and Assess Landfill Air Impacts

Employee Job Title
APPENDIX E

Appendix E1 - Proposed Landfill Mound and Active Stage LFG Emission Rates - Based on LANDGEM Data
Modelled Landfill Area (m2) Proposed Landfill Footprint Active Stage
Intermediate Operation Year
(2018)321198 47,250
Notes:
No actual change in landfill area, change is due to adjustments made to the preferred alternative landfill polygon source to accommodate the change of the active stage placement
Proposed Landfill
Scenario Year
LANDGEM
Emissions
(m3/year)
Collection
Efficiencies
Total Landfill
Gas Released
(m3/s)
Continuous
Emission Rate
(m3/s)
Intermediate Operation Year 2018 12,649,667 0.85 1,897,450 0.060
Active Stage
Scenario Year
LANDGEM
Emissions
(m3/year)
Collection
Efficiencies
Total Landfill
Gas Released
(m3/s)
Continuous
Emission Rate
(m3/s)
Intermediate Operation Year 2018 1,726,619 0.5 863,310 0.027
Notes:
The waste deposit in each stages (8) and for both phases is assumed to be placed in 16 equal portions.
Total waste placed (400,000 Mg per year, 4,000,000 Mg total).
Approximately 250,000 Mg waste per portion.
LANDGEM Emission for the active stage is based on the placement of 250,000 Mg of waste, with no historic cumulation from previous waste deposited.
This is the maximum amount of gas that would be emitted from that waste (i.e. 1 year after its placement).
PROPOSED LANDFILL EMISSION RATES
DESCRIPTION Emission RateEmission Flux
Rate
COMPOUND mg/m3
g/m3 g/s g/m
2/s
71-55-6 1,1,1-Trichloroethane 0.158 1.58E-04 9.52E-06 2.96E-11
79-34-5 1,1,2,2-Tetrachloroethane 0.017 1.66E-05 9.98E-07 3.11E-12
79-00-5 1,1,2-Trichloroethane 0.021 2.06E-05 1.24E-06 3.85E-12
75-34-3 1,1-Dichloroethane 4.10 4.10E-03 2.47E-04 7.69E-10
75-35-4 1,1-Dichloroethylene 0.17 1.68E-04 1.01E-05 3.14E-11
107-06-2 1,2-Dichloroethane 0.016 1.62E-05 9.72E-07 3.03E-12
156-59-2 1,2-Dichloroethene (Cis) 9.63 9.63E-03 5.79E-04 1.80E-09
156-60-5 1,2-Dichloroethene (Trans) 0.45 4.55E-04 2.74E-05 8.52E-11
71-43-2 Benzene 3.62 3.62E-03 2.18E-04 6.77E-10
75-27-4 Bromodichloromethane 0.002 1.54E-06 9.25E-08 2.88E-13
56-23-5 Carbon Tetrachloride 0.026 2.65E-05 1.59E-06 4.96E-12
75-00-3 Chloroethane 1.34 1.34E-03 8.03E-05 2.50E-10
67-66-3 Chloroform/Trichloromethane 0.29 2.86E-04 1.72E-05 5.36E-11
75-09-2 Dichloromethane 2.43 2.43E-03 1.46E-04 4.56E-10
75-18-3 Dimethyl sulfide [2] 2.35 2.35E-03 1.41E-04 4.40E-10
75-08-1 Ethyl Mercaptan 0.008 7.75E-06 4.66E-07 1.45E-12
106-93-4 Ethylene Dibromide 0.01 5.37E-06 3.23E-07 1.01E-12
04-06-7783 Hydrogen sulfide [2] 288.15 2.88E-01 1.73E-02 5.40E-08
74-93-1 Methyl Mercaptan 0.005 4.80E-06 2.89E-07 9.00E-13
111-65-9 Octane 8.70 8.70E-03 5.23E-04 1.63E-09
78-92-2 sec-Butyl Alcohol/2-Butanol 45.70 4.57E-02 2.75E-03 8.56E-09
127-18-4 Tetrachloroethylene 8.36 8.36E-03 5.03E-04 1.57E-09
79-01-6 Trichloroethylene 2.76 2.76E-03 1.66E-04 5.17E-10
75-01-4 Vinyl Chloride/Chloroethene 5.11 5.11E-03 3.08E-04 9.58E-10
Notes:
[1] Average Concentrations are based on the LFG Analysis results of measurements taken in 2004 and in 2011.
The resulting concentrations were averaged for the 2004 and 2011 period.
The highest average concentration was used to estimate the emission rates and emission flux rate
[2] Sulphur Compounds concentrations were highest in 2011 and are an average of six sample concentration results
ACTIVE STAGE EMISSION RATES
DESCRIPTION Emission RateEmission Flux
Rate
CAS # COMPOUND mg/m3
g/m3 g/s g/m
2/s
71-55-6 1,1,1-Trichloroethane 0.158 1.58E-04 4.33E-06 9.17E-11
79-34-5 1,1,2,2-Tetrachloroethane 0.017 1.66E-05 4.54E-07 9.61E-12
79-00-5 1,1,2-Trichloroethane 0.021 2.06E-05 5.63E-07 1.19E-11
75-34-3 1,1-Dichloroethane 4.10 4.10E-03 1.12E-04 2.38E-09
75-35-4 1,1-Dichloroethylene 0.17 1.68E-04 4.59E-06 9.72E-11
107-06-2 1,2-Dichloroethane 0.016 1.62E-05 4.42E-07 9.36E-12
156-59-2 1,2-Dichloroethene (Cis) 9.63 9.63E-03 2.64E-04 5.58E-09
156-60-5 1,2-Dichloroethene (Trans) 0.45 4.55E-04 1.24E-05 2.63E-10
71-43-2 Benzene 3.62 3.62E-03 9.90E-05 2.10E-09
75-27-4 Bromodichloromethane 0.002 1.54E-06 4.21E-08 8.91E-13
56-23-5 Carbon Tetrachloride 0.026 2.65E-05 7.24E-07 1.53E-11
75-00-3 Chloroethane 1.34 1.34E-03 3.66E-05 7.74E-10
67-66-3 Chloroform/Trichloromethane 0.29 2.86E-04 7.84E-06 1.66E-10
75-09-2 Dichloromethane 2.43 2.43E-03 6.66E-05 1.41E-09
75-18-3 Dimethyl sulfide [2] 2.35 2.35E-03 6.42E-05 1.36E-09
75-08-1 Ethyl Mercaptan 0.008 7.75E-06 2.12E-07 4.49E-12
106-93-4 Ethylene Dibromide 0.01 5.37E-06 1.47E-07 3.11E-12
04-06-7783 Hydrogen sulfide [2] 288.15 2.88E-01 7.89E-03 1.67E-07
74-93-1 Methyl Mercaptan 0.005 4.80E-06 1.32E-07 2.78E-12
111-65-9 Octane 8.70 8.70E-03 2.38E-04 5.04E-09
78-92-2 sec-Butyl Alcohol/2-Butanol 45.70 4.57E-02 1.25E-03 2.65E-08
127-18-4 Tetrachloroethylene 8.36 8.36E-03 2.29E-04 4.84E-09
79-01-6 Trichloroethylene 2.76 2.76E-03 7.56E-05 1.60E-09
75-01-4 Vinyl Chloride/Chloroethene 5.11 5.11E-03 1.40E-04 2.96E-09
Notes:
[1] Average Concentrations are based on the LFG Analysis results of measurements taken in 2004 and in 2011.
The resulting concentrations were averaged for the 2004 and 2011 period.
The highest average concentration was used to estimate the emission rates and emission flux rate
[2] Sulphur Compounds concentrations were highest in 2011 and are an average of six sample concentration results
Sample Calculations - Active Stage
Total Landfill Gas Released (m3) = 1,726,619 m
3 1-0.05 (Collection Efficiency)
Total Landfill Gas Released (m3) = 863,310
Continuous LFG Emission Rate (m3/s) = 863,310 1 year 1 day 1 hour
year 365 days 24 hours 3600s
Continuous LFG Emission Rate (m3/s) = 0.027
Benzene Emission Rate (g/s) = 0.003617 g 0.027 m3
m3 s
Benzene Emission Rate (g/s) = 9.90E-05
Benzene Emission Flux Rate (g/s/m2) = 9.90E-05 g
s 47,250 m2
Benzene Emission Flux Rate (g/s/m2) = 2.10E-09
CAS #
Flow Rate (m³/s) 0.060
Average Concentration [1]
Collection Efficiency
Flow Rate (m³/s) 0.027
Average Concentration [1]
Collection Efficiency 0.500
2018
0.850
2018

Appendix E2 - Proposed Landfill Mound Odour Emission Rates - Based on LANDGEM
Odour Concentration of Landfil Gas 10,000 OU/m³
Year
Modelled Preferred
Alternative Landfill
Area
(m2)
Intermediate Operation Year (2018) 321198
Notes:
No actual change in landfill area, change is due to change of the active stage placement and therefore slight adjustments made to the preferred alternatice landfill mound polygon source in the modelling
Proposed Landfill
YearLANDGEM Emissions
(m3/year)
Collection
Efficiencies
Total Landfill
Gas Released
Continuous
Emission Rate
(m3/s)
Odour
Emission
Rate (OU/s)
Odour
Emission
Flux Rate
(OU/m2/s)
Intermediate Operation Year (2018) 12,649,667 0.85 1,897,450 0.060 602 1.87E-03
Sample Calculations
Total Landfill Gas Released (m3) = 12,679,667 m
3 1-0.85 (Collection Efficiency)
Total Landfill Gas Released (m3) = 1,897,450
Continuous LFG Emission Rate (m3/s) = 1,897,450 1 year 1 day 1 hour
year 365 days 24 hours 3600s
Continuous LFG Emission Rate (m3/s) = 0.060
Odour Emission Rate (g/s) = 10,000 OU 0.060 m3
m3 s
Odour Emission Rate (g/s) = 602
Odour Emission Flux Rate (g/s/m2) = 602 OU
s 321,198 m2
Odour Emission Flux Rate (g/s/m2) = 1.84E-03
"upper range" estimate of odour concentrationfrom the MOE's Interim Guide to
Estimate and Assess Landfill Air Impacts

Appendix E3: Working Face Odour Emission Rates based on Representative Facilities in Ontario
Sample ID
Odour
Concentration
(OU/m3)
Odour Emission
Flux Rate
Concentration
(OU/m2/s)
Source
WF1-O26 512 0.37 RWDI (W05-5271A); Trail Road Landfill Composting Dispersion Modelling Study; June, 2006
WF2-O26 868 0.62 RWDI (W05-5271A); Trail Road Landfill Composting Dispersion Modelling Study; June, 2006
WF1-LT 163 0.12 RWDI (W05-5271A); Trail Road Landfill Composting Dispersion Modelling Study; June, 2006
WF2-LT 161 0.12 RWDI (W05-5271A); Trail Road Landfill Composting Dispersion Modelling Study; June, 2006
WF3-LT 178 0.13 RWDI (W05-5271A); Trail Road Landfill Composting Dispersion Modelling Study; June, 2006
WF1-J21 793 0.58 RWDI (W05-5271A); Trail Road Landfill Composting Dispersion Modelling Study; June, 2006
WF2-J21 841 0.61 RWDI (W05-5271A); Trail Road Landfill Composting Dispersion Modelling Study; June, 2006
Aug23-F3 742 0.54 RWDI (W05-5271A); Trail Road Landfill Composting Dispersion Modelling Study; June, 2006
Aug23-F4 917 0.67 RWDI (W05-5271A); Trail Road Landfill Composting Dispersion Modelling Study; June, 2006
Aug23-F5 1149 0.83 RWDI (W05-5271A); Trail Road Landfill Composting Dispersion Modelling Study; June, 2006
Aug23-F6 1149 0.83 RWDI (W05-5271A); Trail Road Landfill Composting Dispersion Modelling Study; June, 2006
BFC-5 2272 1.63 RWDI (00-144); Odour Impact Management Plan for the Britannia Road Sanitary Landfill; November, 1999
BFC-6 1262 0.91 RWDI (00-144); Odour Impact Management Plan for the Britannia Road Sanitary Landfill; November, 1999
BFC-7 1035 0.74 RWDI (00-144); Odour Impact Management Plan for the Britannia Road Sanitary Landfill; November, 1999
BFC-8 1230 0.88 RWDI (00-144); Odour Impact Management Plan for the Britannia Road Sanitary Landfill; November, 1999
BFC-9 985 0.71 RWDI (00-144); Odour Impact Management Plan for the Britannia Road Sanitary Landfill; November, 1999
BFC-10 861 0.62 RWDI (00-144); Odour Impact Management Plan for the Britannia Road Sanitary Landfill; November, 1999
Working Face 4350 1.1
RWDI (95-302); BFI Ridge Landfill Expansion EA Impact Assessment Appendix M - Landfill Atmospheric Studies; September 1996
CBJ Air Quality Management (CJB); City of Guelph Eastview Road Sanitary Landfill Application for Continued and Closure Technical Appendix: Air
(Updated Analysis of Odour Impacts), May 1993
Working Face 1100 0.0124 RWDI (92-218); Britannia Landfill Expansion Study, Volume 2B, Section G, Air Quality and Odour; May 1992
Working Face 1100 0.0105 RWDI (92-218); Britannia Landfill Expansion Study, Volume 2B, Section G, Air Quality and Odour; May 1992
Working Face 1100 0.01027 RWDI (92-218); Britannia Landfill Expansion Study, Volume 2B, Section G, Air Quality and Odour; May 1992
Working Face 1100 0.0379 RWDI (92-218); Britannia Landfill Expansion Study, Volume 2B, Section G, Air Quality and Odour; May 1992
Active Face - T1 390 0.280 RWDI (W05-5113C); Walker Environmental Assessment Odour Impact Assessment, Appendix C3a; February 2006
Active Face - T2 302 0.217 RWDI (W05-5113C); Walker Environmental Assessment Odour Impact Assessment, Appendix C3a; February 2006
Active Face - T3 329 0.236 RWDI (W05-5113C); Walker Environmental Assessment Odour Impact Assessment, Appendix C3a; February 2006
90th Percentile Odour Emission Flux Rate 0.898 (OU/m2/s)
YearWorking Face
Surface Area (m2)
Odour Emission
Flux Rate (OU/m2/s)
Intermediate Operation Year (2018) 900 0.898

Appendix E4 - Preferred Alternative Landfill Interim Cover Area Odour Emission Rates
Based on LANDGEM
YearModelled Interim Cover
Area (m2)
Intermediate Operation Year (2018) 45666
Notes:
Interim Face
Year Collection Efficiencies
Odour
Emission Rate
(OU/s)
Odour
Emission Flux
Rate (OU/m2/s)
Intermediate Operation Year (2018) 0% 1142 0.025
Notes:
LANDGEM Emission is based on the placement of 250,000 Mg of waste, with no historic cumulation
This is the maximum amount of gas that would be emitted from that waste (i.e. 1 year after its placement)
Sample Calculations
Odour Emission Flux Rate (OU/s) = 0.025 OU 45666 m2
m2 · s
Odour Emission Flux Rate (OU/s) = 1141.66
No actual change in landfill area, change is due to change of the working face placement and therefore slight adjustments made to the interim face polygon source

Employee Job Title
APPENDIX F

Appendix F1 - Engine-Generators and Flares LFG Emission Rates
0.57 1.04 1 0.28 0.28 0.28 0.28 0.28
0.98 0.98 0.98 0.97 0.97 0.97 0.97 0.97
F1 F2 F3 E1 E2 E3 E4 E5
DESCRIPTIONEmission
Rate
Emission
Rate
Emission
Rate
Emission
Rate
Emission
Rate
Emission
Rate
Emission
Rate
Emission
Rate
CAS # COMPOUND mg/m3
g/m3 g/s g/s g/s g/s g/s g/s g/s g/s
71-55-6 1,1,1-Trichloroethane 0.158 1.58E-04 1.80E-06 3.29E-06 3.17E-06 1.33E-06 1.33E-06 1.33E-06 1.33E-06 1.33E-06
79-34-5 1,1,2,2-Tetrachloroethane 0.017 1.66E-05 1.89E-07 3.45E-07 3.32E-07 1.39E-07 1.39E-07 1.39E-07 1.39E-07 1.39E-07
79-00-5 1,1,2-Trichloroethane 0.021 2.06E-05 2.34E-07 4.28E-07 4.11E-07 1.73E-07 1.73E-07 1.73E-07 1.73E-07 1.73E-07
75-34-3 1,1-Dichloroethane 4.10 4.10E-03 4.68E-05 8.53E-05 8.21E-05 3.45E-05 3.45E-05 3.45E-05 3.45E-05 3.45E-05
75-35-4 1,1-Dichloroethylene 0.17 1.68E-04 1.91E-06 3.49E-06 3.36E-06 1.41E-06 1.41E-06 1.41E-06 1.41E-06 1.41E-06
107-06-2 1,2-Dichloroethane 0.016 1.62E-05 1.84E-07 3.36E-07 3.23E-07 1.36E-07 1.36E-07 1.36E-07 1.36E-07 1.36E-07
156-59-2 1,2-Dichloroethene (Cis) 9.63 9.63E-03 1.10E-04 2.00E-04 1.93E-04 8.09E-05 8.09E-05 8.09E-05 8.09E-05 8.09E-05
156-60-5 1,2-Dichloroethene (Trans) 0.45 4.55E-04 5.18E-06 9.46E-06 9.09E-06 3.82E-06 3.82E-06 3.82E-06 3.82E-06 3.82E-06
71-43-2 Benzene [1] 3.62 3.62E-03 4.12E-05 7.52E-05 7.23E-05 3.07E-04 3.07E-04 3.07E-04 3.07E-04 3.07E-04
75-27-4 Bromodichloromethane 0.002 1.54E-06 1.75E-08 3.20E-08 3.08E-08 1.29E-08 1.29E-08 1.29E-08 1.29E-08 1.29E-08
56-23-5 Carbon Tetrachloride 0.026 2.65E-05 3.02E-07 5.50E-07 5.29E-07 2.22E-07 2.22E-07 2.22E-07 2.22E-07 2.22E-07
75-00-3 Chloroethane 1.34 1.34E-03 1.52E-05 2.78E-05 2.67E-05 1.12E-05 1.12E-05 1.12E-05 1.12E-05 1.12E-05
67-66-3 Chloroform/Trichloromethane 0.29 2.86E-04 3.26E-06 5.96E-06 5.73E-06 2.41E-06 2.41E-06 2.41E-06 2.41E-06 2.41E-06
75-09-2 Dichloromethane 2.43 2.43E-03 2.77E-05 5.06E-05 4.87E-05 2.04E-05 2.04E-05 2.04E-05 2.04E-05 2.04E-05
75-18-3 Dimethyl sulfide [2] 2.35 2.35E-03 2.67E-05 4.88E-05 4.69E-05 1.97E-05 1.97E-05 1.97E-05 1.97E-05 1.97E-05
75-08-1 Ethyl Mercaptan 0.008 7.75E-06 8.83E-08 1.61E-07 1.55E-07 6.51E-08 6.51E-08 6.51E-08 6.51E-08 6.51E-08
106-93-4 Ethylene Dibromide 0.01 5.37E-06 6.13E-08 1.12E-07 1.07E-07 4.51E-08 4.51E-08 4.51E-08 4.51E-08 4.51E-08
04-06-7783 Hydrogen sulfide 288.15 2.88E-01 3.28E-03 5.99E-03 5.76E-03 2.42E-03 2.42E-03 2.42E-03 2.42E-03 2.42E-03
74-93-1 Methyl Mercaptan 0.005 4.80E-06 5.48E-08 9.99E-08 9.61E-08 4.04E-08 4.04E-08 4.04E-08 4.04E-08 4.04E-08
111-65-9 Octane 8.70 8.70E-03 9.91E-05 1.81E-04 1.74E-04 7.31E-05 7.31E-05 7.31E-05 7.31E-05 7.31E-05
78-92-2 sec-Butyl Alcohol/2-Butanol 45.70 4.57E-02 5.21E-04 9.51E-04 9.14E-04 3.84E-04 3.84E-04 3.84E-04 3.84E-04 3.84E-04
127-18-4 Tetrachloroethylene 8.36 8.36E-03 9.53E-05 1.74E-04 1.67E-04 7.02E-05 7.02E-05 7.02E-05 7.02E-05 7.02E-05
79-01-6 Trichloroethylene 2.76 2.76E-03 3.15E-05 5.74E-05 5.52E-05 2.32E-05 2.32E-05 2.32E-05 2.32E-05 2.32E-05
75-01-4 Vinyl Chloride/Chloroethene 5.11 5.11E-03 5.83E-05 1.06E-04 1.02E-04 4.30E-05 4.30E-05 4.30E-05 4.30E-05 4.30E-05
Notes:
[1] Benzene emission rates for the generators are taken from 2010 Source Testing Results, as they are more conservative than the LANDGEM results
Sample Calculations
Flare 1 Emission Rate (1,1,1-Trichloroethane in g/s) = 0.57 m3 1.58E-04 g
s m3
Flare 1 Emission Rate (1,1,1-Trichloroethane in g/s) = 1.80E-06
1-0.98 (destruction efficiency)
Average Concentration [1]
Point Sources
Max Equipment Capacity (m3/s)
Destruction Efficiency
Equipment ID

Appendix F2a: Combustion Emission Calculations - Landfill Gas FlareBased on AP-42 Chapter 2.4 "Municipal Solid Waste Landfills"
from final section (Nov. 1998)
Pollutant
Emission Factor
(kg/106 dscm
Methane)
Rating
Nitrogen Dioxide 650 C
Carbon Monoxide 12000 C
Particulate Matter 270 DNote: dscm = dry standard cubic meter
NOx SO2 CO PM
Flare 1 0.57 0.285 0.185 0.711 3.42 0.077
Flare 2 1.04 0.52 0.186 N/A[3] 6.24 0.140
Candlestick Flare 1.0 0.5 0.325 0.71 6.00 0.135
Notes:
[1] The assumed Methane content in the LFG is: 50%
[2] The NOx emission rate (for Flare 2 only) and Dioxins and Furans emission rates for all flares are based on source testing results.
[3] Flare 2 source testing results showed that sulphur dioxide was not detected (i.e., below sampling detection limits) and therefore was not included.
Sample Calculation:
Flare 1 Emission Rate (NOx in g/s) = 0.57 dsm3
50% methane 650 kg 1000g
s 106
dsm3
1 kg
Flare 1 Emission Rate (NOx in g/s) = 0.185
Sample Calculation - SO2 emissions:
Site Specific Data for total reduced sulphur compounds as sulphur
Sulphur Compounds ppmv # of Sulphur
Sulphur 198 -
Methyl Mercaptan 0.002 1
Ethyl Mercaptan 0.003 1
Dimethyl Sulphide 0.88 1
Hydrogen Sulphide 196 1
QCH4 = 27,922,952.92 m3/year
CS = 198 ppmv
QS = 10056 m3/year
MWp = 32.06 g/mol
T = 25 ⁰C (recommended assumption)
UMp = 13186 kg/year
CMSO2 = 22416 kg/year
CMSO2 = 0.71 g/s
Total Gas
Volumetric Flow
Rate (standard)
m³/s
Methane
Volumetric Flow
Rate (standard)
m³/s
Emission Rate (g/s)Equipment

Appendix F2b: Combustion Emission Calculations - Landfill Gas FlareBased on AP-42 Chapter 2.4 "Municipal Solid Waste Landfills"

Appendix F2a: Combustion Emission Calculations (Updated Dioxins and Furans Emissions) - Landfill Gas Flare
Sampling Results - Dioxins and Furans
Test : Blank
Sample ID : Blank
Sample Volume (m3)
[1] : -
Stack Flow Rate (m3/s)
[1] : -
TEQ Concentation Emission Rate TEQ Concentation Emission Rate Concentration Emission Rate
(pg) Factor (pg TEQ/m3) (pg/s) (pg TEQ/s) Factor (pg TEQ/m
3) (pg/s) (pg TEQ/s) (pg/m
3) (pg/s)
2,3,7,8-Tetra CDD <1.6 < 28 1 11.8209 12 92.08459 92 < 13 1 4.03395 4 35.1760753 35 8 63.5
1,2,3,7,8-Penta CDD <1.1 < 8.5 1 3.58848 3.6 27.95425 28 < 9.5 1 2.94789 2.9 25.7055935 26 3.25 27
1,2,3,4,7,8-Hexa CDD <1.3 < 2.5 0.1 0.10554 0.11 0.822184 0.82 < 2.9 0.1 0.08999 0.09 0.78469707 0.78 0.10 0.8
1,2,3,6,7,8-Hexa CDD <1.1 < 2.1 0.1 0.08866 0.089 0.690634 0.69 < 2.5 0.1 0.07758 0.078 0.67646299 0.68 0.084 0.685
1,2,3,7,8,9-Hexa CDD <1.2 < 2.3 0.1 0.0971 0.097 0.756409 0.76 < 2.7 0.1 0.08378 0.084 0.73058003 0.73 0.0905 0.745
1,2,3,4,6,7,8-Hepta CDD <3.8 < 5.1 0.01 0.02153 0.022 0.167725 0.17 3.1 0.01 0.00962 0.0096 0.08388141 0.084 0.016 0.13
1,2,3,4,6,7,8,9-Octa CDD 28.3 39.7 0.000 0.00503 0.005 0.039169 0.039 22.7 0.000 0.00211 0.0021 0.01842685 0.018 0.0036 0.029
2,3,7,8-Terta CDF <1.2 < 2.3 0.1 0.0971 0.097 0.756409 0.76 < 3.1 0.1 0.09619 0.096 0.8388141 0.84 0.10 0.8
1,2,3,7,8-Penta CDF <1.2 < 3.3 0.03 0.0418 0.042 0.325585 0.33 < 3.0 0.03 0.02793 0.028 0.24352668 0.24 0.035 0.29
2,3,4,7,8-Penta CDF <1.2 < 3.2 0.3 0.40529 0.41 3.157186 3.2 < 2.9 0.3 0.26996 0.27 2.3540912 2.4 0.34 2.8
1,2,3,4,7,8-Hexa CDF <2.2 < 2.5 0.1 0.10554 0.11 0.822184 0.82 < 1.8 0.1 0.05585 0.056 0.48705335 0.49 0.083 0.66
1,2,3,6,7,8-Hexa CDF <0.95 < 2.2 0.1 0.09288 0.093 0.723522 0.72 < 1.6 0.1 0.04965 0.05 0.43293631 0.43 0.072 0.575
2,3,4,6,7,8-Hexa CDF <1.1 < 2.6 0.1 0.10977 0.11 0.855071 0.86 < 1.9 0.1 0.05896 0.059 0.51411187 0.51 0.085 0.685
1,2,3,7,8,9-Hexa CDF <1.2 < 2.8 0.1 0.11821 0.12 0.920846 0.92 < 2.0 0.1 0.06206 0.062 0.54117039 0.54 0.091 0.73
1,2,3,4,6,7,8-Hepta CDF <2.9 < 5.4 0.01 0.0228 0.023 0.177592 0.18 < 3.7 0.01 0.01148 0.011 0.10011652 0.1 0.017 0.14
1,2,3,4,7,8,9-Hepta CDF <1.2 < 2 0.01 0.00844 0.0084 0.065775 0.066 < 2.1 0.01 0.00652 0.0065 0.05682289 0.057 0.00745 0.06
1,2,3,4,6,7,8,9-Octa CDF <7.4 6.6 0.000 0.00084 0.00084 0.006512 0.0065 < 7.2 0.000 0.00067 0.00067 0.00584464 0.0058 0.000755 0.0062
16.9 130 7.8 69 12.4 100
Notes:
[1] Sample volume and volumetric flow rate based on dry referenced conditions (101.3kPa, and 25oC)
' < ' indicates that the laboratory results were less than the Method Detection Limit (MDL). This MDL was used to calculate the concentration and emission rate.
(pg) (pg)
Total Toxicity Equivalency (TEQ) g
2.37 3.22
7.79 8.7 AVERAGE
Lab Data Lab Data
Test No. 1 Test No. 2
M23-Flare-T1 M23-Flare-T2

Appendix F3a: Combustion Emission Calculations - Landfill Gas-Fired Engine-GeneratorsBased on AP-42 Chapter 2.4 "Municipal Solid Waste Landfills"
from final section (Nov. 1998)
PollutantEmission Factor
(kg/106 dscm Methane)
Rating
Particulate Matter 770 E
NOx CO PM
CAT3520 Engine 0.28 0.14 - - - - 0.108
Notes:
[1] The assumed Methane content in the LFG is: 50%
[2] The NOx, CO, SO2 and Dioxins and Furans emission rates for both engine types are based on source testing results.
Sample Calculation:
CAT3520 Engine Emission Rate (PM in g/s) = 0.14 dsm3
50% methane 770 kg 1000g
s 106 dsm
31 kg
CAT3520 Engine Emission Rate (PM in g/s) = 0.054
Total Gas Volumetric Flow
Rate (standard)
m³/s
Methane
Volumetric Flow
Rate (standard)
m³/s
Emission Rate (g/s)
Equipment

Appendix F3b: Combustion Emission Calculations (Updated Dioxins and Furans) - Landfill Gas-Fired Engine-Generators
With original TEF
Updated Emissions with WHO2005 TEF
Reference Flow Rate 2.30 m3/s
Parameter
Concentration
@ 11% O2
pg/m3
WHO2005
TEFs
Toxicity
Equivalent
(TEQ)
pg TEQ/m3
TEQ
Emission
Rate
pg/s
2,3,7,8-Tetra CDD 1 1 1 2.3
1,2,3,7,8-Penta CDD 1.7 1 1.7 3.9
1,2,3,4,7,8-Hexa CDD 0.7 0.1 0.07 0.2
1,2,3,6,7,8-Hexa CDD 1 0.1 0.1 0.2
1,2,3,7,8,9-Hexa CDD 1 0.1 0.1 0.2
1,2,3,4,6,7,8-Hepta CDD 2.4 0.01 0.024 0.1
1,2,3,4,6,7,8,9-Octa CDD 6.6 0.0003 0.00198 0.0
2,3,7,8-Tetra CDF 27.6 0.1 2.76 6.3
1,2,3,7,8-Penta CDF 5 0.03 0.15 0.3
2,3,4,7,8-Penta CFD 7 0.3 2.1 4.8
1,2,3,4,7,8-Hexa CDF 3.7 0.1 0.37 0.9
1,2,3,6,7,8-Hexa CDF 4 0.1 0.4 0.9
2,3,4,6,7,8-Hexa CDF 3.2 0.1 0.32 0.7
1,2,3,7,8,9-Hexa CDF 0.7 0.1 0.07 0.2
1,2,3,4,6,7,8-Hepta CDF 5.9 0.01 0.059 0.1
1,2,3,4,7,8,9-Hepta CDF 1.2 0.01 0.012 0.0
1,2,3,4,6,7,8,9-Octa CDF 2.5 0.0003 0.00075 0.0


June 13, 2007 Remi Godin Waste Management of Canada 2301 Carp Road Ottawa, ON K0A 1L0 Re: Results of Stack Testing on the Flare Stack
Carp Road Landfill, March Testing Program RWDI Reference No. W07-5143A Email: [email protected] Dear Remi: RWDI AIR Inc. (RWDI) has been retained by Carp Road Landfill to conduct emission sampling of one of their flare stacks at their Landfill located in Kanata, Ontario. The purpose of this testing was to determine the emissions of dioxins and furans, along with volatile organic compounds being emitted from the landfill gas flare stack #2 (F-2). Two tests on the flare stack were conducted on March 22nd, and March 23rd, 2007 while the landfill was operating under typical process conditions. The emissions for the key parameters are provided below, and more detailed results are presented in the appendices. Sampling Location Due to sampling logistics (i.e. safety and scaffolding) only one of the two flare stacks were tested. Also for these reasons only one of the sampling ports on the flare could be accessed. The flare stack was tested for dioxins and furans, volatile organic compounds (VOC), oxygen, carbon dioxide, oxides of nitrogen, and sulphur dioxide. In addition to these parameters, stack gas characteristics including stack gas velocity and volumetric flow rate were determined.

June 13, 2007 Remi Godin Landfill Gas Flare Testing Results Page 2
Sampling Methodologies Stack Velocity, Temperature, and Volumetric Flow Rate Determination The exhaust velocities and flow rates were determined following the Ontario Source Testing Code (OSTC) Method 2, “Determination of Stack Gas Velocity and Flow Rate (Type S Pitot Tube)”. Velocity measurements were taken with a pre-calibrated S-Type pitot tube and incline manometer. Volumetric flow rates were determined following the equal area method as outlined in OSTC Method 2. Temperature measurements were made simultaneously with the velocity measurements and were conducted using a chromel-alumel type “k” thermocouple in conjunction with a digital temperature indicator. The diameter of the stack at the sample location was taken from the engineering drawings and C of A documentation and was determined to be 2.7m. The dry molecular weight of the stack gas was determined following calculations outlined in OSTC Method 3, “Determination of Molecular Weight of Dry Stack Gas”. Stack moisture content was determined through direct condensation and according to OSTC Method 4, “Determination of Moisture Content of Stack Gas”. Sampling Dioxin and Furan Isomers Sampling for dioxins and furans (PCDD/F) was performed in accordance with Environment Canada’s method RM/2, “Reference Method for Source Testing of Releases of Selected Semi-Volatile Organic Compounds from Stationary Sources”. Triplicate sampling runs were conducted. Due to the safety conditions regarding the high temperature and sampling infrastructure, sampling was conducted isokinetically at a single point. The sample was drawn through a glass lined sample probe and proofed glass fibre filter. Both of these were maintained at a temperature of 120 ± 14°C (248 ± 25°F). The sample then passed through a water cooled condenser and an XAD-2 absorbent module. The temperature of the XAD-2 module was kept below 20°C. The stack gas sample was then introduced into the impinger train. The impinger train was configured as specified in the reference method. Upon completion of the test, the samples were kept cool and delivered to Maxxam Analytical Services in Burlington, Ontario. The filter, XAD-2 module, impinger catch, and all rinses were analysed for the target compounds using high resolution mass spectrometry. Sampling for Volatile Organic Compounds Sampling for volatile organic compounds (VOC) was conducted by collecting the stack gas sample in a Tedlar Bag. The sample was then transported the same day to the laboratory and was analysed for VOC’s. Paracel Laboratory’s Ltd. Located in Ottawa, Ontario, conducted laboratory analysis.

June 13, 2007 Remi Godin Landfill Gas Flare Testing Results Page 3
Monitoring for NOX, SO2 Nitrogen oxides (NOx) and sulphur dioxide (SO2) was monitored using an electro-chemical cell combustion gas analyser. Sampling was conducted over a 1-hour duration and the average concentration was obtained from these readings. Please note that this method is considered non-compliance level testing and should be seen as screening values only. Results The results to the sampling program are provided in the tables below. The average stack gas flow characteristics are presented in Table 1, the average results from the emissions monitoring are presented in Table 2. Table 1 – Average Stack Gas Characteristics Parameter Units Average Value Diameter m 2.7 Temperature oC 937 Moisture % 12.7 Velocity m/s 6.8 Oxygen % 13.5 Carbon Dioxide % 6.1 Volumetric Flow Rate (actual) ACFM 81,950 Volumetric Flow Rate (Referenced to dry, 25oC and 101.3kPa) Rm3/s 8.25

June 13, 2007 Remi Godin Landfill Gas Flare Testing Results Page 4
Table 2 – Average Sampling Results Parameter Concentration Emission Rate
(pg/m3) (pg/s) Dioxins and Furans (TEQ) 11 88 (mg/m3) (mg/s) Oxides of Nitrogen 23 186 Sulphur Dioxide <13 < 108 (mg/m3) (mg/s) TVOC < 5 < 41 Benzene < 0.5 < 4 Bromodichloromethane < 0.4 < 3 Bromoform < 0.8 < 7 Bromomethane < 0.7 < 6 Carbon Tetrachloride < 0.5 < 4 Chlorobenzene < 0.4 < 3 Chloroethane < 1 < 8 Chloroform < 0.5 < 4 Chloromethane < 3 < 25 Dibromochloromethane < 0.5 < 4 1,2-Dibromoethane < 1 < 8 m-Dichlorobenzene < 0.4 < 3 o-Dichlorobenzene < 0.4 < 3 p-Dichlorobenzene < 0.4 < 3 1,1-Dichloroethane < 0.6 < 5 1,2-Dichloroethane < 0.5 < 4 1,1-Dichloroethylene < 0.6 < 5 c-1,2-Dichloroethylene < 0.4 < 3 t-1,2-Dichloroethylene < 0.4 < 3 1,2-Dichloropropane < 0.7 < 6 c-1,3-Dichloropropene < 0.4 < 3 t-1,3-Dichloropropene < 0.5 < 4 Ethylbenzene < 0.5 < 4 Methylene Chloride < 4 < 33 Styrene < 0.4 < 3 1,1,2,2-Tetrachloroethane < 0.6 < 5 Tetrachloroethylene < 0.5 < 4 Toluene < 0.5 < 4 1,1,1-Trichloroethane < 0.5 < 4 1,1,2-Trichloroethane < 0.6 < 5 Trichloroethylene < 0.5 < 4 Trichlorofluoromethane < 1 < 8 1,3,5-Trimethylbenzene < 0.5 < 4 Vinyl Chloride < 0.5 < 4 m/p-Xylene < 1 < 8 o-Xylene < 0.5 < 4

June 13, 2007 Remi Godin Landfill Gas Flare Testing Results Page 5
As expected, the landfill gas flare (F-2) showed no significant levels of emissions for the parameters tested. The majority of the PCDD/F and VOC parameters were below the laboratory’s method detection limit. Detailed results from the testing are presented in the appendices. Appendix A includes the laboratory results, and Appendix B contains the detailed calculations from the testing. If you have any questions regarding these results, please do not hesitate to contact us. Yours very truly, RWDI AIR Inc.
Colin Welburn, P.Eng. Project Manager Specialist


Stack Gas Characteristics

Stack Gas Velocity and Volumetric Flow Rate
O2 13.2 %
Client: CO2 6.1 %
Project #: Pitot Coefficient, Cp: 0.84 CO 0 ppm
Locations: Molar Weight Stack Gas: 28.20 N2 79.8 %
Date: Moisture, Bws (%): 12.2% Ar 0.9 %
Time: Static Pressure, Pg (" H2O): -0.5
stack diameter (inches): Md 29.62Stack Area, (ft2):Barometric Press, Pb (" Hg):Stack Pressure, Ps (" Hg):
Traverse 1 Traverse 2Point Position delta P Temp (Ts) Velocity Cyclonic delta P Temp (Ts) Velocity Cyclonic
(in) (" H2O) (oF) (ft/s) Angle (" H2O) (
oF) (ft/s) Angle
1 0.02 1758 16.5 < 5
2 0.03 1758 20.3 < 5
3 0.03 1758 20.3 < 5
4 0.04 1758 23.4 < 5
5 0.03 1758 20.3 < 5
6 0.04 1758 23.4 < 5
7 0.04 1758 23.4 < 5
8 0.04 1758 23.4 < 5
9
10
Moisture (Bws) 0.122
Average 0.03 1758 21.4Average velocity (ft/s) 21.4
(m/s) 6.5
Flow Rate, Qs (actual) (cfm) 78,527
(m3/min) 2,223.6
(m3/sec) 37.06
Flow Rate, Qs (ref,dry) (cf/sec) 275
(m3/sec) 7.79
AM
Carp Road Landfill
W07-5143
Flare Stack - Test #1
22-Mar-07
Dry Molecular Weight
BWS
106
61.3
29.60
29.56

Stack Gas Velocity and Volumetric Flow RateO2 13.2 %
Client: CO2 6.1 %
Project #: Pitot Coefficient, Cp: 0.84 CO 0 ppm
Locations: Molar Weight Stack Gas: 28.10 N2 79.8 %
Date: Moisture, Bws (%): 13.1% Ar 0.9 %
Time: Static Pressure, Pg (" H2O): -0.5
stack diameter (inches): Md 29.62Stack Area, (ft2):Barometric Press, Pb (" Hg):Stack Pressure, Ps (" Hg):
Traverse 1 Traverse 2Point Position delta P Temp (Ts) Velocity Cyclonic delta P Temp (Ts) Velocity Cyclonic
(in) (" H2O) (oF) (ft/s) Angle (" H2O) (
oF) (ft/s) Angle
1 0.03 1679 19.9 < 5
2 0.03 1679 19.9 < 5
3 0.05 1679 25.7 < 5
4 0.05 1679 25.7 < 5
5 0.05 1679 25.7 < 5
6 0.04 1679 23.0 < 5
7 0.04 1679 23.0 < 5
8 0.04 1679 23.0 < 5
9
10
Moisture (Bws) 0.131
Average 0.04 1679 23.2Average velocity (ft/s) 23.2
(m/s) 7.1
Flow Rate, Qs (actual) (cfm) 85,375
(m3/min) 2,417.5
(m3/sec) 40.29
Flow Rate, Qs (ref,dry) (cf/sec) 308
(m3/sec) 8.72
BWS
29.70
29.66
23-Mar-07
AM
106
61.3
Dry Molecular Weight
Carp Road Landfill
W07-5143
Flare Stack - Test #2

Semi-Volatile Organic Compounds (Dioxins and Furans)

Semi-Volatile Organic Compounds Sampling
Facility: Carp. Rd Landfill Operator: AWA / ELS
City: Ottawa, Ontario Entered by: ELS
Source: Flare Checked by: AWA
Reference Method: RM/2 E.C.
Symbol Units Test #1 Test #2SVOC SVOC
Date March 22,07 March 23,07
Start Time 8:19 AM 9:35 AM
End Time 11:13am 1:00 PM
Round Stack, Diameter (Inside) ds in 106 106
Standard Temperature Ts
oF 77 77
Standard Pressure Ps " Hg 29.92 29.92
Nozzle Diameter Dn in 0.569 0.569
Average Stack Temperature Ts
oF 1757 1679
Average Meter Temperature Tm
oF 48 60
Barometric Pressure Pbar " Hg 29.6 29.7
Stack Static Pressure Pg " H2O -0.5 -0.5
Average Delta H dH " H2O 0.74 0.97
Average Velocity Head (root mean square) dPrms " H2O 0.03 0.04
Pitot Coefficient Cp - 0.84 0.84
S-Type S-Type
Gas Sample Volume Vmft
379.62 110.41
DGM Calibration Factor Y - 1.0040 1.0040
Console C Console C
Total Sampling Time min min 170 205
Stack Gas Oxygen Concentration O2 % 13.5 13.5
Stack Gas Carbon Dioxide Concentration CO2 % 6.1 6.1
Impinger Gain Ww g 241.2 357.6
Pitot ID ->
DGM ID ->

Semi-Volatile Organic Compounds SamplingFacility: Carp. Rd Landfill Operator: AWA / ELS
City: Ottawa, Ontario Entered by: ELS
Source: Flare Checked by: AWA
Reference Method: RM/2 E.C.
Emissions Calculations Symbol Units Test #1 Test #2 AVERAGESVOC SVOC
Nozzle Area Anft
20.00176 0.00176
Stack Area Asft
261.28 61.28
Average Stack Temperature Ts
oR 2217 2139 2178
Average DGM Temperature Tm
oR 508 520
Sample Volume at Reference Conditions VmStdft
383.70 113.87
Vmmstd m3 2.37 3.22Vol. of Water Vapour VwStd
ft3
11.5776 17.1648
Water Fraction Bws 0.122 0.131 12.6%
Molecular Weight, dry Md lb/lbmole 29.63 29.63 29.63
Molecular Weight, wet Mw lb/lbmole 28.22 28.11 28.16
Absolute Stack Pressure Ps " Hg 29.56 29.66 29.61
Isokinetic Rate I % 105 104 104

Semi-Volatile Organic Compounds Sampling
Facility: Carp rd. Landfill Operator: AWA / ELS
City: Ottawa, Ontario Entered by: ELS
Source: Flare Checked by: AWA
Reference Method: RM/2 E.C. Test Date: March 22,07
Run: Test 1
Point Time Velocity Orifice Meter Stack Condenser Imp Meter Vacuum PercentagePressure Pressure Volume Temp Temp Temp Temp Pressure Isokinetic
(min) (" H2O) (" H2O) (ft3) (
oF) (
oF) (
oF) (
oF) (" Hg) (%)
test Leak Check = <0.00 at 10" Hg
1 0 0.03 0.82 912.38 1652 41 40 41 0.0 110
5 0.03 0.81 914.75 1652 37 38 41 0.0 97
10 0.03 0.81 916.86 1652 36 37 41 0.0 101
15 0.03 0.72 919.05 1742 36 37 41 0.0 104
20 0.03 0.72 921.25 1742 36 37 42 0.0 104
25 0.03 0.72 923.46 1742 36 37 42 5.0 105
30 0.03 0.72 925.69 1742 37 37 43 5.0 106
35 0.03 0.72 927.95 1742 37 38 43 3.0 115
40 0.03 0.72 930.40 1742 38 38 44 0.0 105
45 0.03 0.72 932.65 1742 38 39 45 0.0 105
50 0.03 0.72 934.90 1742 38 39 45 0.0 106
55 0.03 0.72 937.17 1742 38 39 46 0.0 101
60 0.03 0.72 939.33 1742 39 39 46 0.0 110
65 0.03 0.72 941.69 1742 38 39 47 0.0 105
70 0.03 0.72 943.95 1760 39 40 47 0.0 106
75 0.03 0.72 946.22 1760 39 40 47 0.0 102
80 0.03 0.69 948.39 1760 40 40 48 0.0 104
85 0.03 0.69 950.61 1760 41 41 48 0.0 103
90 0.03 0.69 952.82 1760 40 42 49 0.0 103
95 0.03 0.69 955.04 1760 42 42 49 0.0 103
100 0.03 0.69 957.26 1760 43 43 45 0.0 105
105 0.03 0.69 959.50 1760 44 44 51 0.0 103
110 0.03 0.69 961.73 1796 45 44 51 0.0 104
115 0.03 0.69 963.95 1796 47 46 52 0.0 104
120 0.03 0.69 966.18 1796 48 46 52 0.0 103
125 0.03 0.69 968.39 1796 50 47 53 0.0 104
130 0.03 0.69 970.62 1796 50 47 54 0.0 103
135 0.03 0.69 972.84 1796 50 49 54 0.0 104
140 0.03 0.69 975.07 1796 49 48 55 0.0 99
145 0.04 0.91 977.21 1796 45 46 55 0.0 102
150 0.04 0.91 979.74 1796 46 47 56 1.0 107
155 0.04 0.91 982.40 1796 47 48 56 1.0 107
160 0.04 0.91 985.07 1796 48 48 57 2.0 101
165 0.04 0.91 987.59 1796 48 48 58 2.0 110
173 991.99
0.03 0.74 79.62 1757 42 42 48 - 105
Note: Stopped test short due to power outage at the landfill.

Semi-Volatile Organic Compounds Sampling
Facility: Carp. Rd Landfill AWA / ELSCity: Ottawa, Ontario ELSSource: Flare AWAReference Method: RM/2 E.C. March 23,07Run: Test 2
Point Time Velocity Orifice Meter Stack Condenser Imp Meter Vacuum PercentagePressure Pressure Volume Temp Temp Temp Temp Pressure Isokinetic
(min) (" H2O) (" H2O) (ft3) (
oF) (
oF) (
oF) (
oF) (" Hg) (%)
Traverse 11 0 0.04 0.96 992.02 1666 48 59 43 0.0 99
5 0.04 0.96 994.55 1666 45 57 43 0.0 10110 0.04 0.96 997.15 1666 45 56 44 0.0 10215 0.04 0.96 999.76 1666 45 53 46 0.0 10120 0.04 0.96 1002.37 1666 44 53 48 0.0 10125 0.04 0.96 1004.98 1666 45 53 50 0.0 10130 0.04 0.96 1007.62 1666 45 54 52 0.0 10135 0.04 0.96 1010.27 1666 46 54 54 0.0 10140 0.04 0.96 1012.91 1666 46 54 55 1.0 10945 0.04 0.96 1015.77 1666 41 52 57 1.0 9350 0.04 0.96 1018.21 1666 43 52 60 1.0 10055 0.04 0.96 1666 43 52 60 1.060 0.04 0.96 1023.53 1684 43 52 60 1.0 10165 0.04 0.96 1684 44 52 60 1.070 0.04 0.98 1028.84 1684 45 52 59 1.0 10175 0.04 0.98 1031.50 1684 44 52 59 1.0 10180 0.04 0.98 1034.15 1684 45 51 60 1.0 10385 0.04 0.98 1036.78 1684 46 51 60 1.0 10490 0.04 0.98 1039.43 1684 47 52 60 1.0 10595 0.04 0.98 1042.10 1684 52 51 62 1.0 106100 0.04 0.98 1044.81 1684 47 49 63 1.0 106105 0.04 0.98 1047.53 1684 48 49 65 1.0 105110 0.04 0.98 1050.23 1684 48 51 68 1.0 106115 0.04 0.98 1052.98 1684 48 51 70 1.0 105120 0.04 0.98 1055.71 1684 49 51 72 1.0 106125 0.04 0.98 1058.48 1684 50 53 72 1.0 104130 0.04 0.98 1061.20 1684 49 54 71 1.0 104135 0.04 0.98 1063.90 1684 50 51 69 1.0 107140 0.04 0.98 1066.66 1684 56 56 68 1.0 105145 0.04 0.98 1069.38 1684 47 53 67 1.0 102150 0.04 0.98 1072.01 1684 44 49 66 1.0 111155 0.04 0.98 1074.87 1684 48 49 65 1.0 102160 0.04 0.98 1077.50 1684 49 50 64 1.0 107165 0.04 0.98 1080.24 1684 46 50 63 0.5 106170 0.04 0.98 1082.95 1684 53 51 63 0.5 106175 0.04 0.98 1085.66 1684 52 50 62 0.5 105180 0.04 0.98 1088.34 1684 49 51 62 0.5 106185 0.04 0.98 1091.04 1684 50 52 62 0.5 105190 0.04 0.98 1093.72 1684 50 53 62 0.5 105195 0.04 0.98 1096.41 1684 53 55 61 0.5 104200 0.04 0.98 1099.07 1684 58 51 61 0.5 110206 0.04 0.98 1102.43 1684 59 59 61 0.5
Average 0.04 0.97 110.41 1679 48 52 60 - 104

Sampling Results - Dioxins and FuransTest : Blank
Sample ID : Blank
Sample Volume (m3)
[1] : -
Stack Flow Rate (m3/s)
[1] : -
TEQ Concentation Emission Rate TEQ Concentation Emission Rate Concentration Emission Rate(pg) Factor (pg TEQ/m
3) (pg TEQ/s) Factor (pg TEQ/m
3) (pg TEQ/s) (pg/m
3) (pg/s)
2,3,7,8-Tetra CDD <1.6 < 28 1 12 92 < 13 1 4 35 8 63.5
1,2,3,7,8-Penta CDD <1.1 < 8.5 0.5 1.8 14 < 9.5 0.5 1.5 13 1.65 14
1,2,3,4,7,8-Hexa CDD <1.3 < 2.5 0.1 0.11 0.82 < 2.9 0.1 0.09 0.78 0.10 0.8
1,2,3,6,7,8-Hexa CDD <1.1 < 2.1 0.1 0.089 0.69 < 2.5 0.1 0.078 0.68 0.084 0.685
1,2,3,7,8,9-Hexa CDD <1.2 < 2.3 0.1 0.097 0.76 < 2.7 0.1 0.084 0.73 0.0905 0.745
1,2,3,4,6,7,8-Hepta CDD <3.8 < 5.1 0.01 0.022 0.17 3.1 0.01 0.0096 0.084 0.016 0.13
1,2,3,4,6,7,8,9-Octa CDD 28.3 39.7 0.001 0.017 0.13 22.7 0.001 0.007 0.061 0.0120 0.096
2,3,7,8-Terta CDF <1.2 < 2.3 0.1 0.097 0.76 < 3.1 0.1 0.096 0.84 0.10 0.8
1,2,3,7,8-Penta CDF <1.2 < 3.3 0.01 0.014 0.11 < 3.0 0.01 0.0093 0.081 0.012 0.10
2,3,4,7,8-Penta CDF <1.2 < 3.2 0.5 0.68 5.3 < 2.9 0.5 0.45 3.9 0.565 4.6
1,2,3,4,7,8-Hexa CDF <2.2 < 2.5 0.1 0.11 0.82 < 1.8 0.1 0.056 0.49 0.083 0.66
1,2,3,6,7,8-Hexa CDF <0.95 < 2.2 0.1 0.093 0.72 < 1.6 0.1 0.05 0.43 0.072 0.575
2,3,4,6,7,8-Hexa CDF <1.1 < 2.6 0.1 0.11 0.86 < 1.9 0.1 0.059 0.51 0.085 0.685
1,2,3,7,8,9-Hexa CDF <1.2 < 2.8 0.1 0.12 0.92 < 2.0 0.1 0.062 0.54 0.091 0.73
1,2,3,4,6,7,8-Hepta CDF <2.9 < 5.4 0.01 0.023 0.18 < 3.7 0.01 0.011 0.1 0.017 0.14
1,2,3,4,7,8,9-Hepta CDF <1.2 < 2 0.01 0.0084 0.066 < 2.1 0.01 0.0065 0.057 0.00745 0.06
1,2,3,4,6,7,8,9-Octa CDF <7.4 6.6 0.001 0.0028 0.022 < 7.2 0.001 0.0022 0.019 0.0025 0.0205
15.4 118 6.6 57 11.0 88
Notes:[1] Sample volume and volumetric flow rate based on dry referenced conditions (101.3kPa, and 25o C)' < ' indicates that the laboratory results were less than the Method Detection Limit (MDL). This MDL was used to calculate the concentration and emission rate.
(pg)
Test No. 2
M23-Flare-T2
3.22
8.7
(pg)
Test No. 1
M23-Flare-T1
2.37
7.79
Total Toxicity Equivalency (TEQ)
Lab Data Lab DataAVERAGE

Volatile Organic Compounds

MDLmg/m
3
TVOC 5 < 5 < 41
Benzene 0.5 < 0.5 < 4
Bromodichloromethane 0.4 < 0.4 < 3
Bromoform 0.8 < 0.8 < 7
Bromomethane 0.7 < 0.7 < 6
Carbon Tetrachloride 0.5 < 0.5 < 4
Chlorobenzene 0.4 < 0.4 < 3
Chloroethane 1 < 1 < 8
Chloroform 0.5 < 0.5 < 4
Chloromethane 3 < 3 < 25
Dibromochloromethane 0.5 < 0.5 < 4
1,2-Dibromoethane 1 < 1 < 8
m-Dichlorobenzene 0.4 < 0.4 < 3
o-Dichlorobenzene 0.4 < 0.4 < 3
p-Dichlorobenzene 0.4 < 0.4 < 3
1,1-Dichloroethane 0.6 < 0.6 < 5
1,2-Dichloroethane 0.5 < 0.5 < 4
1,1-Dichloroethylene 0.6 < 0.6 < 5
c-1,2-Dichloroethylene 0.4 < 0.4 < 3
t-1,2-Dichloroethylene 0.4 < 0.4 < 3
1,2-Dichloropropane 0.7 < 0.7 < 6
c-1,3-Dichloropropene 0.4 < 0.4 < 3
t-1,3-Dichloropropene 0.5 < 0.5 < 4
Ethylbenzene 0.5 < 0.5 < 4
Methylene Chloride 4 < 4 < 33
Styrene 0.4 < 0.4 < 3
1,1,2,2-Tetrachloroethane 0.6 < 0.6 < 5
Tetrachloroethylene 0.5 < 0.5 < 4
Toluene 0.5 < 0.5 < 4
1,1,1-Trichloroethane 0.5 < 0.5 < 4
1,1,2-Trichloroethane 0.6 < 0.6 < 5
Trichloroethylene 0.5 < 0.5 < 4
Trichlorofluoromethane 1 < 1 < 8
1,3,5-Trimethylbenzene 0.5 < 0.5 < 4
Vinyl Chloride 0.5 < 0.5 < 4
m/p-Xylene 1 < 1 < 8o-Xylene 0.5 < 0.5 < 4
Notes:- MDL = Method Detection Limit- TVOC = Total Volatile Organic Compounds- Emission rate was calculated using 8.25 m
3/s (Dry, referenced flow rate)
- For all parameters the concentration of the sample was below the MDL Therefore this MDL was used to calculate the concentration and the emission rate for each parameter.
Parameter
Volatile Organic Compounds Sampling Results
Concentration
mg/m3
Emission Rate
(mg/s)

NOx and SO2 Monitoring


Employee Job Title
APPENDIX G

Appendix G1 - Contaminated Soil Stockpile VOC Emission Rates
Contaminated Soil Stockpile Surface Area: 4000 m2
DESCRIPTIONEmission
Flux Rate [1]Emission Rate
COMPOUND g/m2/s g/s
71-55-6 1,1,1-Trichloroethane 1.28E-10 5.13E-07
79-34-5 1,1,2,2-Tetrachloroethane N/A N/A
79-00-5 1,1,2-Trichloroethane N/A N/A
75-34-3 1,1-Dichloroethane N/A N/A
75-35-4 1,1-Dichloroethylene N/A N/A
107-06-2 1,2-Dichloroethane 7.97E-10 3.19E-06
156-59-2 1,2-Dichloroethene (Cis) N/A N/A
156-60-5 1,2-Dichloroethene (Trans) N/A N/A
71-43-2 Benzene 3.38E-08 1.35E-04
75-27-4 Bromodichloromethane N/A N/A
56-23-5 Carbon Tetrachloride N/A N/A
75-00-3 Chloroethane N/A N/A
67-66-3 Chloroform/Trichloromethane N/A N/A
75-09-2 Dichloromethane 6.75E-09 2.70E-05
75-18-3 Dimethyl sulfide N/A N/A
75-08-1 Ethyl Mercaptan N/A N/A
106-93-4 Ethylene Dibromide N/A N/A
04-06-7783 Hydrogen sulfide N/A N/A
74-93-1 Methyl Mercaptan N/A N/A
111-65-9 Octane 1.59E-08 6.38E-05
78-92-2 sec-Butyl Alcohol/2-Butanol 1.60E-10 6.40E-07
127-18-4 Tetrachloroethylene 1.34E-09 5.38E-06
79-01-6 Trichloroethylene 1.47E-09 5.87E-06
75-01-4 Vinyl Chloride/Chloroethene N/A N/ANotes:
[1] The results were obtained from a contaminated soil emission sampling conducted July 7 and July 8, 2004
Sample Calculations
1,1,1-Trichloroethane Emission Rate (g/s) = 1.28E-10 g 4000 m2
m2 · s
1,1,1-Trichloroethane Emission Rate (g/s) = 5.12E-07
CAS #

Employee Job Title
APPENDIX H

Appendix H1: Comparison of Leachate Influent Characteristics - All Measured Leachate Contaminants at Ottawa Landfill
Contaminant
Ottawa Landfill Raw
Leachate
Jan. 6, 2010
(ug/L)
Ottawa Landfill Raw
Leachate
Jan. 6, 2010
(mg/L)
Ottawa Landfill Raw
Leachate
Jan. 15, 2010
(ug/L)
Ottawa Landfill Raw
Leachate
Jan. 15, 2010
(mg/L)
Maximum Measured
Ottawa Landfill Raw
Leachate
(mg/L)
Twin Creeks Landfill
Estimated Influent
Characteristics (SBR)
(mg/L)
Methane 3600 3.6 1900 1.9 3.6
Ammonia 1600000 1600 1600000 1600 1600 800
Inorganics
Total BOD - - 1200 - - 1600 1600 1750
Total Kjeldahl Nitrogen (TKN) - - 1600 - - 1800 1800 960
pH - - 7.6 - - 7.5 (pH) 7.6 6.8-7.5
Phenols-4AAP - - 0.42 - - 0.22 0.42 1
Total Phosphorus - - 11 - - 12 12 3
Total Suspended Solids - - 61 - - 140 140 150
Dissolved Sulphate (SO4) - - 200 - - 200 200 500
Sulphide - - 1.5 - - 4.2 4.2
Total Cyanide (CN) - - 0.017 - -
Metals
Mercury (Hg) 3 0.003 3 0.003 0.003 0.005
Total Aluminum (Al) 800 0.8 1900 1.9 1.9 4.09
Total Antimony (Sb) 14 0.014 13 0.013 0.014
Total Arsenic (As) 67 0.067 63 0.063 0.067 <0.11
Total Bismuth (Bi) 5 0.005 10 0.01 0.01
Total Boron (B) 18000 18 16000 16 18 50
Total Cadmium (Cd) 1 0.001 1 0.001 0.001 0.12
Total Chromium (Cr) 250 0.25 220 0.22 0.25 0.5
Total Cobalt (Co) 80 0.08 87 0.087 0.087 <0.115
Total Copper (Cu) 20 0.02 20 0.02 0.02 0.1
Total Lead (Pb) 0 28 0.028 0.028 1.38
Total Manganese (Mn) 1200 1.2 780 0.78 1.2 1
Total Molybdenum (Mo) 37 0.037 30 0.03 0.037 <0.06
Total Nickel (Ni) 300 0.3 320 0.32 0.32 0.5
Total Selenium (Se) 50 0.05 50 0.05 0.05 <0.100
Total Silver (Ag) 0.5 0.0005 1 0.001 0.001
Total Tin (Sn) 47 0.047 48 0.048 0.048
Total Titanium (Ti) 280 0.28 330 0.33 0.33 0.29
Total Vanadium (V) 59 0.059 47 0.047 0.059 0.115
Total Zinc (Zn) 640 0.64 2400 2.4 2.4 0.3
Volatile Organics
Benzene 10 0.01 6 0.006 0.006 0.046
Bromodichloromethane 10 0.01 2 0.002 0.01
Bromoform 20 0.02 4 0.004 0.02
Bromomethane 50 0.05 10 0.01 0.05
Carbon Tetrachloride 10 0.01 2 0.002 0.01
Chlorobenzene 10 0.01 7 0.007 0.007
Chloroform 10 0.01 2 0.002 0.01
Dibromochloromethane 20 0.02 4 0.004 0.02
1,2-Dichlorobenzene 20 0.02 4 0.004 0.02
1,3-Dichlorobenzene 20 0.02 4 0.004 0.02
1,4-Dichlorobenzene 25 0.025 22 0.022 0.025 0.023
1,1-Dichloroethane 10 0.01 2 0.002 0.01
1,2-Dichloroethane 20 0.02 4 0.004 0.02 0.035
1,1-Dichloroethylene 10 0.01 2 0.002 0.01 0.046
cis-1,2-Dichloroethylene 10 0.01 6 0.006 0.006
trans-1,2-Dichloroethylene 10 0.01 2 0.002 0.01
1,2-Dichloroethylene - - - - - - 0.008 0.008 1.104
1,2-Dichloropropane 10 0.01 2 0.002 0.01
cis-1,3-Dichloropropene 20 0.02 4 0.004 0.02
trans-1,3-Dichloropropene 20 0.02 4 0.004 0.02
Ethylbenzene 50 0.05 40 0.04 0.05 0.391
Ethylene Dibromide 20 0.02 4 0.004 0.02
Methylene Chloride(Dichloromethane) 50 0.05 10 0.01 0.05 7.59
Styrene 20 0.02 4 0.004 0.02
1,1,2,2-Tetrachloroethane 20 0.02 4 0.004 0.02
Tetrachloroethylene 10 0.01 2 0.002 0.01 0.046
Toluene 250 0.25 120 0.12 0.25 2.21
1,1,1-Trichloroethane 10 0.01 2 0.002 0.01
1,3,5-Trimethylbenzene 20 0.02 7 0.007 0.007
1,1,2-Trichloroethane 20 0.02 4 0.004 0.02
Trichloroethylene 10 0.01 2 0.002 0.01 0.127
Vinyl Chloride 20 0.02 4 0.004 0.02 0.127
p+m-Xylene 97 0.097 90 0.09 0.097 1.3
o-Xylene 40 0.04 40 0.04 0.04 0.529
Xylene (Total) 140 0.14 130 0.13 0.14 1.829
Chloroethane 20 0.02 4 0.004 0.02
Chloromethane 50 0.05 10 0.01 0.05
Trichlorofluoromethane (FREON 11) 20 0.02 4 0.004 0.02
Semivolatile Organics
Acenaphthene 4 0.004 1 0.001 0.004
Acenaphthylene 4 0.004 1 0.001 0.004
Di-N-butyl phthalate 30 0.03 10 0.01 0.03
3,3'-Dichlorobenzidine 10 0.01 4 0.004 0.01
Pentachlorophenol 20 0.02 5 0.005 0.02
Phenanthrene 4 0.004 2 0.002 0.004
Anthracene 4 0.004 1 0.001 0.004
Fluoranthene 4 0.004 1 0.001 0.004
Pyrene 4 0.004 1 0.001 0.004
Benzo(a)anthracene 4 0.004 1 0.001 0.004
Chrysene 4 0.004 1 0.001 0.004
Benzo(b/j)fluoranthene 4 0.004 1 0.001 0.004
Benzo(k)fluoranthene 4 0.004 1 0.001 0.004
Benzo(a)pyrene 4 0.004 1 0.001 0.004
Indeno(1,2,3-cd)pyrene 8 0.008 3 0.003 0.008
Dibenz(a,h)anthracene 8 0.008 3 0.003 0.008
Fluorene 30 0.03 4 0.004 0.03
Benzo(g,h,i)perylene 8 0.008 3 0.003 0.008
1-Methylnaphthalene 30 0.03 4 0.004 0.03
2-Methylnaphthalene 30 0.03 4 0.004 0.03
Dibenzo(a,i)pyrene 8 0.008 3 0.003 0.008
Naphthalene 42 0.042 10 0.01 0.042
Benzo(e)pyrene 4 0.004 1 0.001 0.004
Hexachlorobenzene 80 0.08 10 0.01 0.08
Perylene 4 0.004 1 0.001 0.004
Dibenzo(a,j)acridine 8 0.008 3 0.003 0.008
7H-Dibenzo(c,g)Carbazole 8 0.008 3 0.003 0.008
1,6-Dinitropyrene 8 0.008 3 0.003 0.008
1,3-Dinitropyrene 8 0.008 3 0.003 0.008
1,8-Dinitropyrene 8 0.008 3 0.003 0.008
Benzyl butyl phthalate 80 0.08 10 0.01 0.08
Bis(2-chloroethoxy)methane 80 0.08 10 0.01 0.08
Bis(2-ethylhexyl)phthalate 120 0.12 65 0.065 0.12
Di-N-butyl phthalate 300 0.3 40 0.04 0.3
Di-N-octyl phthalate 100 0.1 20 0.02 0.1
Diethyl phthalate 200 0.2 20 0.02 0.2
Indole 200 0.2 20 0.02 0.2
Calculated Parameters 0
Total PAHs (18 PAHs) 8 0.008 3 0.003 0.008
<-- note: shaded values were presented in the lab report as less than (<) the indicated amount.

Appendix H2: Comparison of Leachate Influent Characteristics - Detected and/or Matching Twin Creeks Contaminants
Contaminant
Maximum Measured
Ottawa Landfill Raw
Leachate
(mg/L)
Twin Creeks Landfill
Estimated Influent
Characteristics (SBR)
(mg/L)
Maximum Value
(mg/L)Source of Maximum Value
Methane 3.6 - - 3.6 Ottawa
Ammonia 1600 800 1600 Ottawa
Inorganics
Total BOD 1600 1750 1750 Twin Creeks
Total Kjeldahl Nitrogen (TKN) 1800 960 1800 Ottawa
pH 7.6 6.8-7.5 7.6 Ottawa
Phenols-4AAP 0.42 1 1 Twin Creeks
Total Phosphorus 12 3 12 Ottawa
Total Suspended Solids 140 150 150 Twin Creeks
Sulphide 4.2 - - 4.2 Ottawa
Volatile Organics
Benzene 0.006 0.046 0.046 Twin Creeks
Chlorobenzene 0.007 - - 0.007 Ottawa
1,4-Dichlorobenzene 0.025 0.023 0.025 Ottawa
cis-1,2-Dichloroethylene 0.006 - - 0.006 Ottawa
1,2-Dichloroethylene 0.008 1.104 1.104 Twin Creeks
Ethylbenzene 0.05 0.391 0.391 Twin Creeks
Toluene 0.25 2.21 2.21 Twin Creeks
1,3,5-Trimethylbenzene 0.007 - - 0.007 Ottawa
p+m-Xylene 0.097 1.3 1.3 Twin Creeks
o-Xylene 0.04 0.529 0.529 Twin Creeks
Xylene (Total) 0.14 1.829 1.829 Twin Creeks
Chloroethane 0.02 - - 0.02 Ottawa
Chloromethane 0.05 - - 0.05 Ottawa
Semivolatile Organics
Phenanthrene 0.004 - - 0.004 Ottawa
Naphthalene 0.042 - - 0.042 Ottawa
Bis(2-ethylhexyl)phthalate 0.12 - - 0.12 Ottawa
= compound reported as less than the indicated amount
= compound listed in Water9 program

Appendix H3: Raw Leachate Equalization Tank
Emissions from Water9 - based on Concentrations in Raw Leachate
WASTEWATER TREATMENT SUMMARY I 10-22-2010 16:31:48
Project C:\Documents and Settings\sjp\Desktop\05 Water9\ottawa_equal 24/09/2010 10:47:11 AM
RATE
(g/s) Air Removal Exit Adsorb
AMMONIA * 3.06E-04 0.00004 . 1 0 0
METHANE 1.66E-02 0.95693 . 0.0431 0 0
PHENOL 9.44E-07 0.0002 . 0.9998 0 0
SULFIDE * 0.00E+00 . . 1 0 0
PHOSPHORUS 0.00E+00 . . 1 0 0
BENZENE 5.48E-05 0.24656 . 0.7534 0 0
CHLOROBENZENE 9.90E-06 0.29309 . 0.7069 0 0
CHLOROETHANE (ethyl chloride) 3.96E-05 0.41018 . 0.5898 0 0
1,4 DICHLOROBENZENE (-p) 2.62E-05 0.21746 . 0.7825 0 0
DICHLOROETHYLENE(1,2) cis 6.80E-04 0.12764 . 0.8724 0 0
ETHYLBENZENE 4.46E-04 0.23621 . 0.7638 0 0
METHYLENE CHLORIDE, dichloromethane 2.76E-03 0.07533 . 0.9247 0 0
TOLUENE 1.74E-03 0.16266 . 0.8373 0 0
TRIMETHYLBENZENE (1,3,5) 1.27E-05 0.3763 . 0.6237 0 0
XYLENE 1.59E-03 0.18024 . 0.8198 0 0
BIS(2-ETHYLHEXYL)PHTHALATE 3.04E-07 0.00052 . 0.9995 0 0
NAPHTHALENE 2.04E-05 0.10015 . 0.8999 0 0
PHENANTHRENE 3.70E-07 0.0192 . 0.9808 0 0
FractionerrorCOMPOUND

Appendix H4: SBR Tank
Emissions from Water9 - based on Concentrations in Raw Leachate
WASTEWATER TREATMENT SUMMARY I 10-22-2010 16:32:38
Project C:\Documents and Settings\sjp\Desktop\05 Water9\ottawa_sbr 24/09/2010 10:49:10 AM
RATE
(g/s) Air Removal Exit Adsorb
AMMONIA 1.03E-01 0.00226 . 0.9977 0 0
METHANE 1.01E-01 0.9859 0.0124 0.0017 0 0
PHENOL 6.52E-08 . 0.9979 0.0021 0 0
SULFIDE 9.57E-18 . . 1 0 0
PHOSPHORUS 2.73E-17 . . 1 0 0
BENZENE 1.45E-04 0.11094 0.8717 0.0174 0 0
CHLOROBENZENE 2.53E-06 0.01272 0.9845 0.0028 0 0
CHLOROETHANE (ethyl chloride) 2.27E-04 0.39965 0.5673 0.033 0 0
1,4 DICHLOROBENZENE (-p) 3.36E-05 0.04737 0.9397 0.0129 0 0
DICHLOROETHYLENE(1,2) cis 2.59E-02 0.827 . 0.173 0 0
ETHYLBENZENE 1.27E-03 0.114 0.8734 0.0126 0 0
METHYLENE CHLORIDE, dichloromethane 3.78E-02 0.17557 0.7711 0.0533 0 0
TOLUENE 5.09E-03 0.08109 0.908 0.0109 0 0
TRIMETHYLBENZENE (1,3,5) 9.07E-06 0.04563 0.9462 0.0081 0 0
XYLENE 4.29E-03 0.08253 0.9023 0.0152 0 0
BIS(2-ETHYLHEXYL)PHTHALATE 2.54E-06 0.00075 0.7587 0.2406 0 0
NAPHTHALENE 5.15E-05 0.04319 0.9276 0.0292 0 0
PHENANTHRENE 4.23E-08 0.00037 0.9774 0.0223 0 0
COMPOUNDFraction
error

Appendix H5: Effluent Equalization Tank
Emissions from Water9 - based on Concentrations in Raw Leachate
WASTEWATER TREATMENT SUMMARY I 10-22-2010 16:29:58
Project C:\Documents and Settings\sjp\Desktop\05 Water9\ottawa_effluent 24/09/2010 10:44:31 AM
RATE
(g/s) Air Removal Exit Adsorb
AMMONIA 5.08E-06 0.00004 . 1 0 0
METHANE 1.53E-02 0.91733 . 0.0827 0 0
PHENOL 4.48E-07 0.0001 . 0.9999 0 0
SULFIDE 0.00E+00 . . 1 0 0
PHOSPHORUS 0.00E+00 . . 1 0 0
BENZENE 3.12E-05 0.14703 . 0.853 0 0
CHLOROBENZENE 5.58E-06 0.17279 . 0.8272 0 0
CHLOROETHANE (ethyl chloride) 2.44E-05 0.26363 . 0.7364 0 0
1,4 DICHLOROBENZENE (-p) 1.44E-05 0.12471 . 0.8753 0 0
DICHLOROETHYLENE(1,2) cis 3.92E-04 0.07667 . 0.9233 0 0
ETHYLBENZENE 2.64E-04 0.14596 . 0.854 0 0
METHYLENE CHLORIDE, dichloromethane 1.62E-03 0.04613 . 0.9539 0 0
TOLUENE 1.03E-03 0.10133 . 0.8987 0 0
TRIMETHYLBENZENE (1,3,5) 7.52E-06 0.23232 . 0.7677 0 0
XYLENE 9.50E-04 0.11239 . 0.8876 0 0
BIS(2-ETHYLHEXYL)PHTHALATE 1.42E-07 0.00026 . 0.9997 0 0
NAPHTHALENE 1.05E-05 0.05423 . 0.9458 0 0
PHENANTHRENE 1.76E-07 0.0095 . 0.9905 0 0
COMPOUNDFraction
error

Appendix H6: Sludge Tank
Emissions from Water9 - based on Concentrations in Raw Leachate
WASTEWATER TREATMENT SUMMARY I 10-22-2010 16:33:39
Project C:\Documents and Settings\sjp\Desktop\05 Water9\ottawa_sludge 24/09/2010 10:50:44 AM
RATE
(g/s) Air Removal Exit Adsorb
AMMONIA 1.64E-03 0.00065 . 0.9994 0 0
METHANE 3.62E-01 0.99676 . 0.0032 0 0
PHENOL 3.22E-05 0.00032 . 0.9997 0 0
SULFIDE 9.34E-18 . . 1 0 0
PHOSPHORUS 2.68E-17 . . 1 0 0
BENZENE 3.18E-03 0.68477 . 0.3152 0 0
CHLOROBENZENE 3.96E-04 0.55916 . 0.4408 0 0
CHLOROETHANE (ethyl chloride) 1.69E-03 0.83612 . 0.1639 0 0
1,4 DICHLOROBENZENE (-p) 8.96E-04 0.3545 . 0.6455 0 0
DICHLOROETHYLENE(1,2) cis 7.48E-02 0.67122 . 0.3288 0 0
ETHYLBENZENE 2.50E-02 0.63158 . 0.3684 0 0
METHYLENE CHLORIDE, dichloromethane 4.42E-01 0.57601 . 0.424 0 0
TOLUENE 1.48E-01 0.66133 . 0.3387 0 0
TRIMETHYLBENZENE (1,3,5) 2.38E-04 0.33693 . 0.6631 0 0
XYLENE 1.12E-01 0.6041 . 0.3959 0 0
BIS(2-ETHYLHEXYL)PHTHALATE 2.42E-06 0.0002 . 0.9998 0 0
NAPHTHALENE 7.44E-04 0.17555 . 0.8244 0 0
PHENANTHRENE 6.72E-07 0.00166 . 0.9983 0 0
COMPOUNDFraction
error

Appendix H7: SBR System Odour Emission Rate - AIHA Odour Thresholds
Contaminant NameCAS
Number
Molecular
Weight
Odour
Threshold
(ppm)
Odour
Threshold
(mg/m3)
Odour
Threshold
Reference
1,1 Dichloroethene (vinylidene chloride) 75-35-4 96.94 n/a n/a - -
1,2 Dichloroethane 107-06-2 98.96 6.00 24.28 [1]
1,3,5 Trimethylbenzene 108-67-8 120.19 0.037 0.18 [2]
1,4 Dichlorobenzene (-p) 106-46-7 147.01 15 90.19 [2]
Ammonia 7664-41-7 17.03 0.043 0.03 [2]
Benzene 71-43-2 78.11 34 108.62 [1]
Bis(2-Ethylhexyl)Phthalate 117-81-7 n/a n/a - -
Chlorobenzene 108-90-7 112.56 0.087 0.40 [2]
Chloroethane (ethyl chloride) 75-00-3 n/a n/a - -
Chloroethylene (vinyl chloride) 75-01-4 62.50 10 25.56 [2]
Chloromethane (methylchloride) 74-87-3 50.49 10 20.65 [2]
Chromium (total) 7440-47-3 n/a n/a - -
cis-1,2 Dichloroethylene 156-59-2 96.95 n/a n/a - -
Ethylbenzene 100-41-4 106.16 0.092 0.40 [2]
Mercury 7439-97-6 n/a n/a - -
Methane 74-82-8 n/a n/a - -
Methylene Chloride (dichloromethane) 75-09-2 84.94 1.2 4.17 [2]
Naphthalene 91-20-3 128.16 0.0095 0.05 [2]
Phenanthrene 85-01-8 n/a n/a - -
Phenol 108-95-2 94.11 0.0045 0.02 [2]
Tetrachloroethene 127-18-4 165.84 2 13.57 [2]
Toluene 108-88-3 92.13 0.16 0.60 [1]
Trichloroethylene 79-01-6 131.40 0.50 2.69 [2]
Xylene 1330-20-7 106.16 0.081 0.35 [2]
Notes:
Conversion from ppm to mg/m3
(gram molecular weight of substance) x (TLV in ppm)
24.45
These formulas can be used when measurements are taken at 25°C and the air pressure is 760 torr (= 1
atmosphere or 760 mm Hg).
[1] Minimum odour threshold value from range of "Acceptable Values" from AIHA, 1989. Odour Thresholds for Chemicals with
Established Occupational Health Standards. Akron, Ohio.
[2] Minimum odour threshold value from range of "All Referenced Values" from AIHA, 1989. Odour Thresholds for Chemicals with
Established Occupational Health Standards. Akron, Ohio.

Appendix H8: SBR System Odour Emission Rates
Source Source Source Source Data LFG Emission Data
ID [1] Type [1] Description Stack Stack Stack Stack Stack Stack Source Contaminant CAS Maximum In-Stack Maximum Total Odour
Volumetric Exit Inner Exit Height Height Coordinates Number Emission In-Stack Odour Odour Odour Emission
Flow Gas Diameter Velocity Above Above X Y Rate Concentration Threshold Concentration Emission Rate
Rate Temp. Grade Roof Rate [1]
(Am³/s) (ºC) (m) (m/s) (m) (m) (m) (m) (g/s) (mg/m3) (mg/m
3) (OU/m
3) (OU/s) (OU/s)
1,2 Dichloroethane 107-06-2 1.64E-05 1.64E+02 2.43E+01 6.75E+00 6.75E-04
1,3,5 Trimethylbenzene 108-67-8 1.27E-05 1.27E+02 1.82E-01 6.99E+02 6.99E-02
1,4 Dichlorobenzene (-p) 106-46-7 2.62E-05 2.62E+02 9.02E+01 2.90E+00 2.90E-04
Ammonia 7664-41-7 3.06E-04 3.06E+03 3.00E-02 1.02E+05 1.02E+01
Benzene 71-43-2 5.48E-05 5.48E+02 1.09E+02 5.05E+00 5.05E-04
Chlorobenzene 108-90-7 9.90E-06 9.90E+01 4.01E-01 2.47E+02 2.47E-02
Chloroethylene (vinyl chloride) 75-01-4 1.25E-04 1.25E+03 2.56E+01 4.88E+01 4.88E-03
Chloromethane (methylchloride) 74-87-3 7.92E-05 7.92E+02 2.07E+01 3.84E+01 3.84E-03
Ethylbenzene 100-41-4 4.46E-04 4.46E+03 3.99E-01 1.12E+04 1.12E+00
Methylene Chloride (dichloromethane) 75-09-2 2.76E-03 2.76E+04 4.17E+00 6.62E+03 6.62E-01
Naphthalene 91-20-3 2.04E-05 2.04E+02 4.98E-02 4.10E+03 4.10E-01
Phenol 108-95-2 9.44E-07 9.44E+00 1.73E-02 5.45E+02 5.45E-02
Tetrachloroethene 127-18-4 1.04E-04 1.04E+03 1.36E+01 7.70E+01 7.70E-03
Toluene 108-88-3 1.74E-03 1.74E+04 6.03E-01 2.88E+04 2.88E+00
Trichloroethylene 79-01-6 2.04E-04 2.04E+03 2.69E+00 7.59E+02 7.59E-02
Xylene 1330-20-7 1.59E-03 1.59E+04 3.52E-01 4.53E+04 4.53E+00
1,2 Dichloroethane 107-06-2 3.63E-05 3.63E+02 2.43E+01 1.49E+01 1.49E-03
1,3,5 Trimethylbenzene 108-67-8 9.07E-06 9.07E+01 1.82E-01 4.99E+02 4.99E-02
1,4 Dichlorobenzene (-p) 106-46-7 3.36E-05 3.36E+02 9.02E+01 3.73E+00 3.73E-04
Ammonia 7664-41-7 0.103 1030000 0.030 34,388,044.78 3439
Benzene 71-43-2 1.45E-04 1.45E+03 1.09E+02 1.33E+01 1.33E-03
Chlorobenzene 108-90-7 2.53E-06 2.53E+01 4.01E-01 6.32E+01 6.32E-03
Chloroethylene (vinyl chloride) 75-01-4 1.12E-03 1.12E+04 2.56E+01 4.38E+02 4.38E-02
Chloromethane (methylchloride) 74-87-3 3.91E-04 3.91E+03 2.07E+01 1.89E+02 1.89E-02
Ethylbenzene 100-41-4 1.27E-03 1.27E+04 3.99E-01 3.18E+04 3.18E+00
Methylene Chloride (dichloromethane) 75-09-2 3.78E-02 3.78E+05 4.17E+00 9.07E+04 9.07E+00
Naphthalene 91-20-3 5.15E-05 5.15E+02 4.98E-02 1.03E+04 1.03E+00
Phenol 108-95-2 6.52E-08 6.52E-01 1.73E-02 3.76E+01 3.76E-03
Tetrachloroethene 127-18-4 5.31E-04 5.31E+03 1.36E+01 3.91E+02 3.91E-02
Toluene 108-88-3 5.09E-03 5.09E+04 6.03E-01 8.44E+04 8.44E+00
Trichloroethylene 79-01-6 9.65E-04 9.65E+03 2.69E+00 3.59E+03 3.59E-01
Xylene 1330-20-7 4.29E-03 4.29E+04 3.52E-01 1.22E+05 1.22E+01
424269 5014684
0.60.0001 6.6 5014732
20
3473424317
0.0001 0.2 0.003
0.2 0.003
25
32
6.6 0.6RAWLEACH
SBR Point Sequencing Batch Reactor Tank
Raw Leachate Equalization TankPoint
Page 2 of 3

Appendix H8: SBR System Odour Emission Rates
Source Source Source Source Data LFG Emission Data
ID [1] Type [1] Description Stack Stack Stack Stack Stack Stack Source Contaminant CAS Maximum In-Stack Maximum Total Odour
Volumetric Exit Inner Exit Height Height Coordinates Number Emission In-Stack Odour Odour Odour Emission
Flow Gas Diameter Velocity Above Above X Y Rate Concentration Threshold Concentration Emission Rate
Rate Temp. Grade Roof Rate [1]
(Am³/s) (ºC) (m) (m/s) (m) (m) (m) (m) (g/s) (mg/m3) (mg/m
3) (OU/m
3) (OU/s) (OU/s)
424269 5014684 200.0001 0.2 0.00325 6.6 0.6RAWLEACH Raw Leachate Equalization TankPoint
1,2 Dichloroethane 107-06-2 8.50E-06 8.50E+01 2.43E+01 3.50E+00 3.50E-04
1,3,5 Trimethylbenzene 108-67-8 7.52E-06 7.52E+01 1.82E-01 4.13E+02 4.13E-02
1,4 Dichlorobenzene (-p) 106-46-7 1.44E-05 1.44E+02 9.02E+01 1.60E+00 1.60E-04
Ammonia 7664-41-7 5.08E-06 5.08E+01 3.00E-02 1.70E+03 1.70E-01
Benzene 71-43-2 3.12E-05 3.12E+02 1.09E+02 2.87E+00 2.87E-04
Chlorobenzene 108-90-7 5.58E-06 5.58E+01 4.01E-01 1.39E+02 1.39E-02
EFFLUENT Point Effluent Equalization Tank 0.0001 25 0.2 0.003 6.6 0.6 424290 5014662 Chloroethylene (vinyl chloride) 75-01-4 8.24E-05 8.24E+02 2.56E+01 3.22E+01 3.22E-03
Chloromethane (methylchloride) 74-87-3 4.76E-05 4.76E+02 2.07E+01 2.31E+01 2.31E-03 6
Ethylbenzene 100-41-4 2.64E-04 2.64E+03 3.99E-01 6.61E+03 6.61E-01
Methylene Chloride (dichloromethane) 75-09-2 1.62E-03 1.62E+04 4.17E+00 3.88E+03 3.88E-01
Naphthalene 91-20-3 1.05E-05 1.05E+02 4.98E-02 2.11E+03 2.11E-01
Phenol 108-95-2 4.48E-07 4.48E+00 1.73E-02 2.59E+02 2.59E-02
Tetrachloroethene 127-18-4 6.62E-05 6.62E+02 1.36E+01 4.88E+01 4.88E-03
Toluene 108-88-3 1.03E-03 1.03E+04 6.03E-01 1.72E+04 1.72E+00
Trichloroethylene 79-01-6 1.22E-04 1.22E+03 2.69E+00 4.56E+02 4.56E-02
Xylene 1330-20-7 9.50E-04 9.50E+03 3.52E-01 2.70E+04 2.70E+00
1,2 Dichloroethane 107-06-2 1.23E-03 1.23E+04 2.43E+01 5.05E+02 5.05E-02
1,3,5 Trimethylbenzene 108-67-8 2.38E-04 2.38E+03 1.82E-01 1.31E+04 1.31E+00
1,4 Dichlorobenzene (-p) 106-46-7 8.96E-04 8.96E+03 9.02E+01 9.93E+01 9.93E-03
Ammonia 7664-41-7 1.64E-03 1.64E+04 3.00E-02 5.48E+05 5.48E+01
Benzene 71-43-2 3.18E-03 3.18E+04 1.09E+02 2.93E+02 2.93E-02
Chlorobenzene 108-90-7 3.96E-04 3.96E+03 4.01E-01 9.89E+03 9.89E-01
Chloroethylene (vinyl chloride) 75-01-4 4.62E-03 4.62E+04 2.56E+01 1.81E+03 1.81E-01
Chloromethane (methylchloride) 74-87-3 4.06E-03 4.06E+04 2.07E+01 1.97E+03 1.97E-01
Ethylbenzene 100-41-4 2.50E-02 2.50E+05 3.99E-01 6.26E+05 6.26E+01
Methylene Chloride (dichloromethane) 75-09-2 4.42E-01 4.42E+06 4.17E+00 1.06E+06 1.06E+02
Naphthalene 91-20-3 7.44E-04 7.44E+03 4.98E-02 1.49E+05 1.49E+01
Phenol 108-95-2 3.22E-05 3.22E+02 1.73E-02 1.86E+04 1.86E+00
Tetrachloroethene 127-18-4 3.82E-03 3.82E+04 1.36E+01 2.82E+03 2.82E-01
Toluene 108-88-3 1.48E-01 1.48E+06 6.03E-01 2.45E+06 2.45E+02
Trichloroethylene 79-01-6 1.01E-02 1.01E+05 2.69E+00 3.77E+04 3.77E+00
Xylene 1330-20-7 1.12E-01 1.12E+06 3.52E-01 3.17E+06 3.17E+02
Notes:
[1] Source ID, Source Type: should provide information on the modelling source type (e.g., Point, Area or Volume Source); the process source or sources within the modelling source (e.g., Process Line #1); and the stack or stacks within each process source.
[2] Emission Estimating Technique Short-Forms are V-ST (Validated Source Test), “ST” (Source Test), EF (Emission Factor), MB (Mass Balance), and EC (Engineering Calculation).
[3] Data Quality Categories: Highest; Above-Average; Average; and Marginal.
Sample CalculationsRAWLEACH In-Stack Concentration (1,2 Dichloroethane in mg/m3) = 1.64E-05 g s 1000 mg
s 0.0001 m3 1 g
RAWLEACH In-Stack Concentration (1,2 Dichloroethane in mg/m3) = 164
RAWLEACH In-Stack Allowable Concentration (1,2 Dichloroethane in OU/m3) = 1.64E+02 (In-stack Concentration)
2.43E+01 (Odour Threshold)
RAWLEACH In-Stack Allowable Concentration (1,2 Dichloroethane in OU/m3) = 6.75
RAWLEACH In-Stack Allowable Concentration (1,2 Dichloroethane in OU/s) = 6.75 OU 0.0001 m3
m3 s
RAWLEACH In-Stack Allowable Concentration (1,2 Dichloroethane in OU/s) = 6.75E-04
Total Odour Emission Rate for a source (OU/s) = Ʃ(Contaminants Maximum Odour Emission Rates for 1 source
50147084243406.6 0.60.2 0.003 809SLUDGE Point Sludge Tank 0.0001 25
Page 3 of 3

Employee Job Title
APPENDIX I

Appendix I1: Combustion Emission Rate Calculations for the Diesel-Fired Emergency Generatorbased on manufacturer specifications
Oxides of Nitrogen [1] - - 4.35 2262 0.63 A
Carbon Monoxide [1] - - 0.54 281 0.078 A
Particulate Matter [1] - - 0.05 26 0.007 A
Sulphur Dioxide [2] 0.00205 0.93 484 0.13 D
Notes:
[1] Emission Factors from specifications provided by Cummins for a DFEG-320 kW Generator
[2] Emission Factor from AP-42 Chapter 3.3 "Gasoline and Diesel Industrial Engines"
Additional Information from specifications provided by Cummins for a DFEG-320 kW Generator
HP at Rated kW = 520 hp based on Cummins Specifications
Exhaust Gas Flow = 2610 cfm
1.23 m3/s
Exhaust Temperature = 810oF
432oC
Sample Calculations:
Emission Rate (NOx in g/s) = 520 hp 4.35 g hr
hp-hr 3600 s
Emission Rate (NOx in g/s) = 0.63
Emission Rate
(g/s)
Data Quality
RatingContaminant
Emission Factor
(g/hp-hr)
Emission Rate
(g/hr)
Emission Factor
(lb/hp-hr)
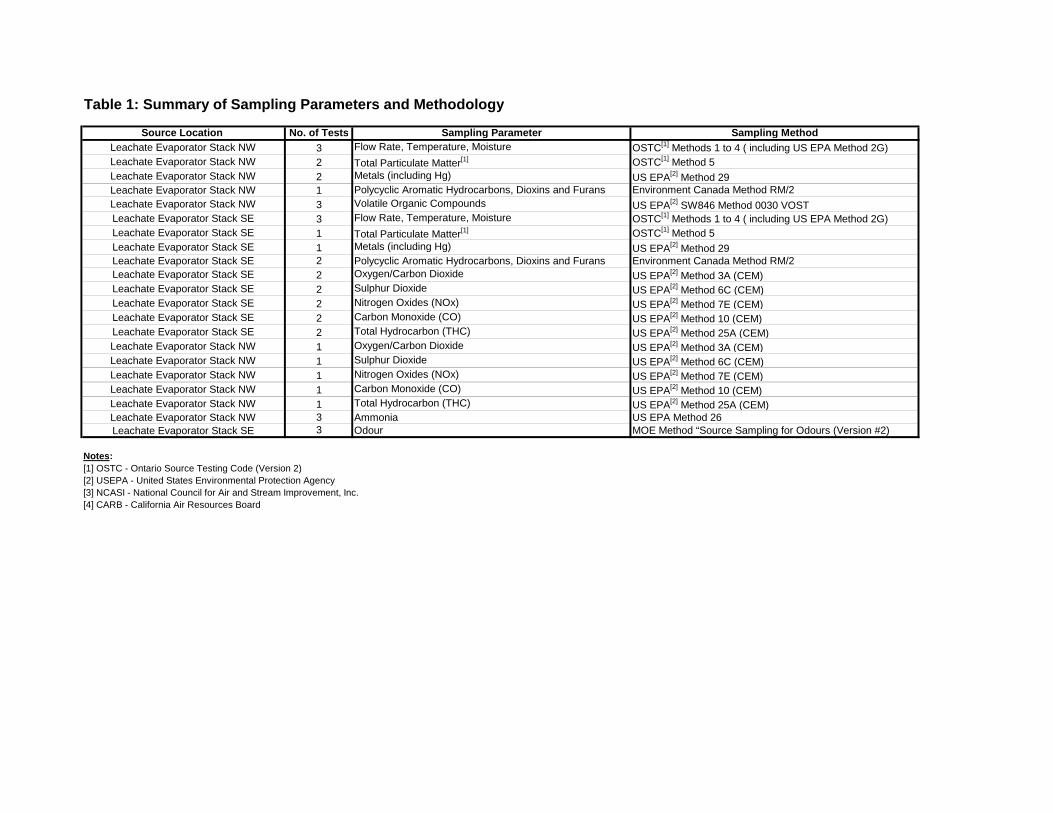
Table 1: Summary of Sampling Parameters and Methodology
Source Location No. of Tests Sampling Parameter Sampling MethodLeachate Evaporator Stack NW 3 Flow Rate, Temperature, Moisture OSTC[1] Methods 1 to 4 ( including US EPA Method 2G)Leachate Evaporator Stack NW 2 Total Particulate Matter[1] OSTC[1] Method 5Leachate Evaporator Stack NW 2 Metals (including Hg) US EPA[2] Method 29Leachate Evaporator Stack NW 1 Polycyclic Aromatic Hydrocarbons, Dioxins and Furans Environment Canada Method RM/2Leachate Evaporator Stack NW 3 Volatile Organic Compounds US EPA[2] SW846 Method 0030 VOSTLeachate Evaporator Stack SE 3 Flow Rate, Temperature, Moisture OSTC[1] Methods 1 to 4 ( including US EPA Method 2G)Leachate Evaporator Stack SE 1 Total Particulate Matter[1] OSTC[1] Method 5Leachate Evaporator Stack SE 1 Metals (including Hg) US EPA[2] Method 29Leachate Evaporator Stack SE 2 Polycyclic Aromatic Hydrocarbons, Dioxins and Furans Environment Canada Method RM/2Leachate Evaporator Stack SE 2 Oxygen/Carbon Dioxide US EPA[2] Method 3A (CEM)Leachate Evaporator Stack SE 2 Sulphur Dioxide US EPA[2] Method 6C (CEM)Leachate Evaporator Stack SE 2 Nitrogen Oxides (NOx) US EPA[2] Method 7E (CEM)Leachate Evaporator Stack SE 2 Carbon Monoxide (CO) US EPA[2] Method 10 (CEM)Leachate Evaporator Stack SE 2 Total Hydrocarbon (THC) US EPA[2] Method 25A (CEM)Leachate Evaporator Stack NW 1 Oxygen/Carbon Dioxide US EPA[2] Method 3A (CEM)Leachate Evaporator Stack NW 1 Sulphur Dioxide US EPA[2] Method 6C (CEM)Leachate Evaporator Stack NW 1 Nitrogen Oxides (NOx) US EPA[2] Method 7E (CEM)Leachate Evaporator Stack NW 1 Carbon Monoxide (CO) US EPA[2] Method 10 (CEM)Leachate Evaporator Stack NW 1 Total Hydrocarbon (THC) US EPA[2] Method 25A (CEM)Leachate Evaporator Stack NW 3 Ammonia US EPA Method 26Leachate Evaporator Stack SE 3 Odour MOE Method “Source Sampling for Odours (Version #2)
Notes:[1] OSTC - Ontario Source Testing Code (Version 2)[2] USEPA - United States Environmental Protection Agency[3] NCASI - National Council for Air and Stream Improvement, Inc.[4] CARB - California Air Resources Board

Table 2: Sampling Summary and Sample Log
Source and Test # Sampling Date Start Time End Time RWDI Sample ID Lab Sample ID
Velocity / Total Particulate / MetalsTest #1 27-Sep-11 9:45 AM 1:16 PM T1-BASELINE-M5/29 LC3471Test #2 28-Sep-11 8:13 AM 12:09 PM T2-BASELINE-M5/29 LC3472Test #3 28-Sep-11 1:47 PM 5:20 PM T3-BASELINE-M5/29 LC3473
Velocity / PAH / Dioxins and FuransTest #1 27-Sep-11 9:45 AM 1:20 PM T1-BASELINE- SVOC LC1531Test #2 28-Sep-11 10:15 AM 12:03 PM T2-BASELINE -SVOC LC1532Test #3 28-Sep-11 1:47 PM 5:12 PM T3-BASELINE- SVOC LC1533
Continuous Emissions Monitor[1]
Test #1 27-Sep-11 9:45 AM 1:16 PM - -Test #2 28-Sep-11 8:12 AM 12:10 PM - -Test #3 28-Sep-11 1:47 PM 5:22 PM - -
Volatile Organic CompoundsTest #1 27-Sep-11 11:39 AM 1:25 PM T1-BASELINE-PAIR 1 A/B LC1382Test #2 27-Sep-11 3:46 PM 4:46 PM T2-BASELINE-PAIR 2 A/B LC1384Test #3 27-Sep-11 4:38 PM 5:58 PM T3-BASELINE-PAIR3 A/B LC1386OdourTest #1 29-Sep-11 10:02 AM 10:22 AM Odour Baseline #1 / 21:1 1Test #2 29-Sep-11 10:25 AM 10:45 AM Odour Baseline #1 / 21:1 2Test #3 29-Sep-11 10:50 AM 11:10 AM Odour Baseline #1 / 21:1 3
AmmoniaTest #1 28-Sep-11 8:23 AM 9:23 AM T1-BASELINE-CTM27 LC1769Test #2 28-Sep-11 10:13 AM 11:15 AM T2-BASELINE-CTM27 LC1770Test #3 28-Sep-11 1:44 PM 2:44 PM T3-BASELINE-CTM27 LC1771
Notes:[1] CEM's: Sulphur Dioxide, Oxides of Nitrogen, Oxygen, Carbon Dioxide, Carbon Monoxide, Total Hydrocarbons

Table 3: Sampling Summary - Flow Characteristics
SVOC[1] TPM[2]Average SVOC[1] TPM[2]
Average SVOC[1] TPM[2]Average
-
Stack Temperature °F 183 182 183 184 182 183 185 182 184 183
°C 84 84 84 84 83 84 85 83 84 84
Moisture % 0.482 0.5 0.474 0.469 0.5 0.471 0.466 0.5 0.47 0.5
Velocity ft/s 67.6 61.8 64.7 65.5 57.9 61.7 63.8 58.8 61.3 62.6
m/s 20.6 18.8 19.7 19.9 17.7 18.8 19.5 17.9 18.7 19.1
Actual Flow Rate CFM 16,700 15,300 16,000 16,200 14,300 15,300 15,800 6,390 11,100 14,100
Referenced Flow Rate[3] CFM 7,230 6,840 7,040 7,160 6,310 6,740 7,020 181 3,600 5,790
m3/s 3.41 3.2 3.3 3.38 3.0 3.2 3.31 3.0 3.2 3.2Sampling Isokinetic Rate % 99 94.7 96.8 96 98 97 97 98 97.5 97
Notes:[1] SVOC = Sampling for PAH's, Dioxins, and Furans[2] TPM = Sampling for total particulate matter and metals[3] Referenced flow rate expressed as dry at 101.3 kPa, 25 °C, and Actual Oxygen
Test No. 3 TOTALAVERAGE
Testing Date
Stack Gas ParameterTest No. 1 Test No. 2

Employee Job Title
APPENDIX J

Ottawa Landfill Hourly Emission File Generator - Material Handling and Wind Erosion SourcesTSP Emissions
Threshold for Wind Erosion 6.25862069 Emission RatesTotal Hours with Emissions Turned Off: 120 11712 11812 18312 Moisture Content = 12.0% 12.0% 12.0% 12.0% 12.0% 12.0%
Hourly Material Handled (Mg) = 32 16 129 16 274 32
Wind Erosion Material Handlingk Factor (for Material Handling) or Wind Erosion Particulate Size Factor (for Wind Erosion) = 0.74 0.74 0.74 0.74 0.74 0.74
% control for months with precip 0% 0% 0% 0% 0% 0%Modelled Area Source (m2)
Precipitation (flag) Snow Cover Depth (cm) Landfill Working Construction Working Contaminated Soil Overburden Construction Working Landfill Working Threshold Threshold 2 Threshold 10 Stage-Active Face Stage Stockpiles Stockpiles Stage Stage
Material Handling Material Handling Material Handling Material Handling Material Unloading Material UnloadingData count 43824 43824 43818 43824 43818 43824 43824
Source ID ACTFCE CWS_MH CSS_MH OB_MH CF_UNL ACT_UNL
Year Month Day Hour Value On/Off Value On/Off Value Value (m/s) Value (m/s) rate (g/s) rate (g/s) rate (g/s) rate (g/s) rate (g/s) rate (g/s)
6 1 1 1 0 1 15 0 7.2 0 0 0.00E+00 0.00E+00 0.00E+00 0.00E+00 0.00E+00 0.00E+006 1 1 2 0 1 15 0 3.6 0 0 0.00E+00 0.00E+00 0.00E+00 0.00E+00 0.00E+00 0.00E+006 1 1 3 0 1 15 0 4.1 0 0 0.00E+00 0.00E+00 0.00E+00 0.00E+00 0.00E+00 0.00E+006 1 1 4 0 1 15 0 4.1 0 0 0.00E+00 0.00E+00 0.00E+00 0.00E+00 0.00E+00 0.00E+006 1 1 5 0 1 15 0 2.6 0 0 0.00E+00 0.00E+00 0.00E+00 0.00E+00 0.00E+00 0.00E+006 1 1 6 0 1 15 0 3.6 0 0 0.00E+00 0.00E+00 0.00E+00 0.00E+00 0.00E+00 0.00E+006 1 1 7 0 1 15 0 3.1 0 3.1 1.35E-03 6.73E-04 5.38E-03 6.73E-04 1.14E-02 1.35E-036 1 1 8 0 1 15 0 3.1 0 3.1 1.35E-03 6.73E-04 5.38E-03 6.73E-04 1.14E-02 1.35E-036 1 1 9 0 1 15 0 2.6 0 2.6 1.07E-03 5.36E-04 4.28E-03 5.36E-04 9.10E-03 1.07E-036 1 1 10 0 1 15 0 3.1 0 3.1 1.35E-03 6.73E-04 5.38E-03 6.73E-04 1.14E-02 1.35E-036 1 1 11 0 1 15 0 2.6 0 2.6 1.07E-03 5.36E-04 4.28E-03 5.36E-04 9.10E-03 1.07E-036 1 1 12 0 1 15 0 1.5 0 1.5 5.24E-04 2.62E-04 2.10E-03 2.62E-04 4.45E-03 5.24E-046 1 1 13 0 1 15 0 2.1 0 2.1 8.11E-04 4.06E-04 3.25E-03 4.06E-04 6.90E-03 8.11E-046 1 1 14 0 1 15 0 1 0 1 3.09E-04 1.55E-04 1.24E-03 1.55E-04 2.63E-03 3.09E-046 1 1 15 0 1 15 0 1 0 1 3.09E-04 1.55E-04 1.24E-03 1.55E-04 2.63E-03 3.09E-046 1 1 16 0 1 15 0 1 0 1 3.09E-04 1.55E-04 1.24E-03 1.55E-04 2.63E-03 3.09E-046 1 1 17 0 1 15 0 1 0 1 3.09E-04 1.55E-04 1.24E-03 1.55E-04 2.63E-03 3.09E-046 1 1 18 0 1 15 0 1 0 1 3.09E-04 1.55E-04 1.24E-03 1.55E-04 2.63E-03 3.09E-046 1 1 19 0 1 15 0 1 0 1 3.09E-04 1.55E-04 1.24E-03 1.55E-04 2.63E-03 3.09E-046 1 1 20 0 1 15 0 1 0 1 3.09E-04 1.55E-04 1.24E-03 1.55E-04 2.63E-03 3.09E-046 1 1 21 0 1 15 0 1 0 0 0.00E+00 0.00E+00 0.00E+00 0.00E+00 0.00E+00 0.00E+006 1 1 22 0 1 15 0 1 0 0 0.00E+00 0.00E+00 0.00E+00 0.00E+00 0.00E+00 0.00E+006 1 1 23 0 1 15 0 1 0 0 0.00E+00 0.00E+00 0.00E+00 0.00E+00 0.00E+00 0.00E+006 1 1 24 0 1 15 0 1 0 0 0.00E+00 0.00E+00 0.00E+00 0.00E+00 0.00E+00 0.00E+006 1 2 1 0 1 14 0 1 0 0 0.00E+00 0.00E+00 0.00E+00 0.00E+00 0.00E+00 0.00E+006 1 2 2 0 1 14 0 1 0 0 0.00E+00 0.00E+00 0.00E+00 0.00E+00 0.00E+00 0.00E+006 1 2 3 0 1 14 0 1 0 0 0.00E+00 0.00E+00 0.00E+00 0.00E+00 0.00E+00 0.00E+006 1 2 4 0 1 14 0 2.1 0 0 0.00E+00 0.00E+00 0.00E+00 0.00E+00 0.00E+00 0.00E+006 1 2 5 0 1 14 0 1.5 0 0 0.00E+00 0.00E+00 0.00E+00 0.00E+00 0.00E+00 0.00E+006 1 2 6 0 1 14 0 1 0 0 0.00E+00 0.00E+00 0.00E+00 0.00E+00 0.00E+00 0.00E+006 1 2 7 0 1 14 0 2.1 0 2.1 8.11E-04 4.06E-04 3.25E-03 4.06E-04 6.90E-03 8.11E-046 1 2 8 0 1 14 0 2.6 0 2.6 1.07E-03 5.36E-04 4.28E-03 5.36E-04 9.10E-03 1.07E-036 1 2 9 0 1 14 0 1 0 1 3.09E-04 1.55E-04 1.24E-03 1.55E-04 2.63E-03 3.09E-046 1 2 10 0 1 14 0 1.5 0 1.5 5.24E-04 2.62E-04 2.10E-03 2.62E-04 4.45E-03 5.24E-046 1 2 11 0 1 14 0 1.5 0 1.5 5.24E-04 2.62E-04 2.10E-03 2.62E-04 4.45E-03 5.24E-046 1 2 12 0 1 14 0 2.6 0 2.6 1.07E-03 5.36E-04 4.28E-03 5.36E-04 9.10E-03 1.07E-036 1 2 13 0 1 14 0 1.5 0 1.5 5.24E-04 2.62E-04 2.10E-03 2.62E-04 4.45E-03 5.24E-046 1 2 14 0 1 14 0 1.5 0 1.5 5.24E-04 2.62E-04 2.10E-03 2.62E-04 4.45E-03 5.24E-046 1 2 15 0 1 14 0 3.1 0 3.1 1.35E-03 6.73E-04 5.38E-03 6.73E-04 1.14E-02 1.35E-036 1 2 16 0 1 14 0 3.6 0 3.6 1.64E-03 8.18E-04 6.54E-03 8.18E-04 1.39E-02 1.64E-036 1 2 17 0 1 14 0 4.6 0 4.6 2.25E-03 1.12E-03 8.99E-03 1.12E-03 1.91E-02 2.25E-036 1 2 18 0 1 14 0 3.1 0 3.1 1.35E-03 6.73E-04 5.38E-03 6.73E-04 1.14E-02 1.35E-036 1 2 19 0 1 14 0 5.1 0 5.1 2.57E-03 1.29E-03 1.03E-02 1.29E-03 2.19E-02 2.57E-036 1 2 20 0 1 14 0 5.1 0 5.1 2.57E-03 1.29E-03 1.03E-02 1.29E-03 2.19E-02 2.57E-036 1 2 21 0 1 14 0 4.1 0 0 0.00E+00 0.00E+00 0.00E+00 0.00E+00 0.00E+00 0.00E+006 1 2 22 0 1 14 0 4.6 0 0 0.00E+00 0.00E+00 0.00E+00 0.00E+00 0.00E+00 0.00E+006 1 2 23 0 1 14 0 5.1 0 0 0.00E+00 0.00E+00 0.00E+00 0.00E+00 0.00E+00 0.00E+006 1 2 24 0 1 14 0 5.7 0 0 0.00E+00 0.00E+00 0.00E+00 0.00E+00 0.00E+00 0.00E+006 1 3 1 0 1 14 0 4.6 0 0 0.00E+00 0.00E+00 0.00E+00 0.00E+00 0.00E+00 0.00E+006 1 3 2 0 1 14 0 5.7 0 0 0.00E+00 0.00E+00 0.00E+00 0.00E+00 0.00E+00 0.00E+006 1 3 3 0 1 14 0 5.1 0 0 0.00E+00 0.00E+00 0.00E+00 0.00E+00 0.00E+00 0.00E+006 1 3 4 0 1 14 0 5.1 0 0 0.00E+00 0.00E+00 0.00E+00 0.00E+00 0.00E+00 0.00E+006 1 3 5 0 1 14 0 5.7 0 0 0.00E+00 0.00E+00 0.00E+00 0.00E+00 0.00E+00 0.00E+006 1 3 6 0 1 14 0 6.2 0 0 0.00E+00 0.00E+00 0.00E+00 0.00E+00 0.00E+00 0.00E+006 1 3 7 0 1 14 0 4.6 0 4.6 2.25E-03 1.12E-03 8.99E-03 1.12E-03 1.91E-02 2.25E-036 1 3 8 0 1 14 0 3.6 0 3.6 1.64E-03 8.18E-04 6.54E-03 8.18E-04 1.39E-02 1.64E-036 1 3 9 0 1 14 0 6.2 0 6.2 3.31E-03 1.66E-03 1.33E-02 1.66E-03 2.82E-02 3.31E-036 1 3 10 0 1 14 0 4.6 0 4.6 2.25E-03 1.12E-03 8.99E-03 1.12E-03 1.91E-02 2.25E-036 1 3 11 0 1 14 0 4.1 0 4.1 1.94E-03 9.68E-04 7.75E-03 9.68E-04 1.65E-02 1.94E-036 1 3 12 0 1 14 0 7.2 0 7.2 4.03E-03 2.01E-03 1.61E-02 2.01E-03 3.42E-02 4.03E-03
Wind Speed (m/s) Product of Precipitation Flag *
Wind Speed
Adjusted for hours of operation - 6:00 am to
8:00 pm

Employee Job Title
APPENDIX K

APPENDIX K1: Bulldozing at Overburden Pile and Construction Working Face - TSP Emission Rates--> Emission Factor Equations for Uncontrolled Open Dust Sources at Western Surface Coal Mines, AP-42 11.9-2
TSP = 2.6 (s)^1.2/(M)^1.3 (kg/hr)PM15 = 0.45(s)^1.5/(M)^1.4 (kg/hr)
M = 12% material moisture content (%) --> chosen from AP42 Table 13.2.4-1 to match parameters for Material Handling Sourcess = 9% material silt content (%) Material: Cover
TSP 1PM10 0.75*PM15PM2.5 0.105*TSP
4000 900
Overburden Pile
Construction WorkingFace
kg/hr g/s g/s*m2 g/s*m2
1:00 0 0 0 02:00 0 0 0 03:00 0 0 0 04:00 0 0 0 05:00 0 0 0 06:00 0 0 0 07:00 2.28 0.63 1.58E-04 7.02E-048:00 2.28 0.63 1.58E-04 7.02E-049:00 2.28 0.63 1.58E-04 7.02E-0410:00 2.28 0.63 1.58E-04 7.02E-0411:00 2.28 0.63 1.58E-04 7.02E-0412:00 2.28 0.63 1.58E-04 7.02E-0413:00 2.28 0.63 1.58E-04 7.02E-0414:00 2.28 0.63 1.58E-04 7.02E-0415:00 2.28 0.63 1.58E-04 7.02E-0416:00 2.28 0.63 1.58E-04 7.02E-0417:00 2.28 0.63 1.58E-04 7.02E-0418:00 2.28 0.63 1.58E-04 7.02E-0419:00 2.28 0.63 1.58E-04 7.02E-0420:00 2.28 0.63 1.58E-04 7.02E-0421:00 0 0 0 022:00 0 0 0 023:00 0 0 0 024:00 0 0 0 0
Scaling Factors
TSPHour of
Day
Surface Area (m2)

Employee Job Title
APPENDIX L

Appendix L1: Combustion Emission Rates for Impact Crusher Generator RWDI Project #1302177
RWDI Project Name: --> used Cambridge Aggregates specs for WM WCEC
RWDI Project Number:
Manufacturer:
Engine Model:
Parameter Units Value Site Specific Emission Factors Units Emission Factor
Engine Fuel Diesel Oxides of Sulphur (SOx) g/hp-hr
Fuel Heating Value (Btu/gal) 1020 Oxides of Nitrogen (NOx) lb/hp-hr
Stroke Cycle 4-Stroke Carbon Monoxide (CO) g/hp-hr
Engine Loading (%) 90-105% PM g/hp-hr
Burn Style Rich Source:
NOx Controlled? No
Rating (enter one set of units) Units Value
Engine Horsepower (hp) (hp) 300
Transfer Efficiency (%) 90
Calculated Input (hp) 300.00
Emission Factors Units Emission Factor
Oxides of Sulphur (SOx) lb/hp-hr 0.00205
Oxides of Nitrogen (NOx) lb/hp-hr 0.031
Carbon Monoxide (CO) lb/hp-hr 0.00668
PM lb/hp-hr 0.0022
Units Value
Exhaust Temperature (ºC) (ºC) 600
Calculated Exit Temperature (K) 873
Fuel Sulphur Information Units Value
Natural Gas Sulphur Content (%)
Fuel Oil Sulphur Content (%) 0.05
Emission Rates Units Emission Rate Quality
Oxides of Sulphur (SOx) (g/s) 7.75E-02 D
Oxides of Nitrogen (NOx) (g/s) 1.17E+00 D
Carbon Monoxide (CO) (g/s) 2.52E-01 D
Particulate Matter (PM) (g/s) 8.32E-02 D
Sample Calculation
Emission Rate (SOx in g/s) = 300 hp 0.00205 lb 453.5924 g 1 hr
hp-hr lb 3600
Emission Rate (SOx in g/s) = 0.0775
Cambridge Aggregates
1302177
300 HP Crusher Engine
AP 42 (10/1996) Ch 3.3, Tables 3.3-1
AP 42 (10/1996) Ch 3.3, Tables 3.3-1
AP 42 (10/1996) Ch 3.3, Tables 3.3-1
Source:
AP 42 (10/1996) Ch 3.3, Tables 3.3-1

Appendix L2: Crushed Stone Processing & Pulverized Mineral Processing TSP Emission Rates Project # 1302177CRUSHED STONE PROCESSING & PULVERIZED MINERAL PROCESSING - AP-42 Section 11.19.2
ID [1] Process Name / Description AP-42 Process Process Processing Rate Control Comments
Description Code [2] Hourly Daily Annual Efficiency
Applied [4]
(Mg/h) (Mg/d) (Mg/a) (%)
CR Impact Crusher 6 200 2400 876000 Emissions include feed and outlet conveyor
[1] ID corresponds to process flow diagram for facility and / or material
[2] Process code used by spreadsheet to pull correct factor based on slected activity - does not require entry.
[3] Enter the control efficiency for each source - if no controls are applied, leave blank
Sample calculation for TSP emissions from Source CR: Impact Crusher
200 Mgprocessed 0.00060 kgTSP 1 h 1000 gTSP 100% gTSP uncontrolled
1 h 1 Mgprocessed 3600 s 1 kgTSP 1 gTSP = 3.33E-02 gTSP / s
Primary crushing (controlled)

Employee Job Title
APPENDIX M

Frequency Analysis Based on Odour Emission RatesWM ECA Assessment RWDI Project #1302177
Receptor Information Maximum Predcited Excusrions Above Specified 10-Minute Values
ID# Description X Y Z Predicted Events > 1 OU Events > 3 OU Events > 5 OU
10-Minute Count Frequency Count Frequency Count Frequency
Concentration
(OU/m³)
R2 425095 5014365 1.5 2.5 142 0.32% 0 0.00% 0 0.0%
R4 423999 5013673 1.5 2.5 64 0.15% 0 0.00% 0 0.0%
R5 426965 5013887 1.5 0.5 0 0.00% 0 0.00% 0 0.0%
R6 423336 5016477 1.5 0.7 0 0.00% 0 0.00% 0 0.0%
R7 426103 5013580 1.5 0.7 0 0.00% 0 0.00% 0 0.0%
R8 424510 5013872 1.5 2.6 59 0.14% 0 0.00% 0 0.0%
R9 423804 5016030 1.5 1.3 40 0.09% 0 0.00% 0 0.0%
R10 420720 5013279 1.5 0.5 0 0.00% 0 0.00% 0 0.0%
R11 420960 5015092 1.5 0.7 0 0.00% 0 0.00% 0 0.0%
R12 421721 5014171 1.5 0.8 0 0.00% 0 0.00% 0 0.0%
R13 422987 5012721 1.5 1.0 0 0.00% 0 0.00% 0 0.0%
R14 422760 5015091 1.5 1.5 35 0.08% 0 0.00% 0 0.0%
R15 422484 5015393 1.5 1.1 3 0.01% 0 0.00% 0 0.0%
R16 422861 5017064 1.5 0.6 0 0.00% 0 0.00% 0 0.0%
R17 424773 5016880 1.5 0.5 0 0.00% 0 0.00% 0 0.0%
R18 424739 5013726 1.5 1.9 46 0.11% 0 0.00% 0 0.0%
R19 425302 5013206 1.5 1.0 0 0.00% 0 0.00% 0 0.0%
R20 426318 5013134 1.5 0.6 0 0.00% 0 0.00% 0 0.0%
R21 426338 5014149 1.5 0.6 0 0.00% 0 0.00% 0 0.0%
R22 427140 5014836 1.5 0.5 0 0.00% 0 0.00% 0 0.0%
R23 426659 5016723 1.5 0.4 0 0.00% 0 0.00% 0 0.0%
R24 426927 5017938 1.5 0.3 0 0.00% 0 0.00% 0 0.0%
43824 Total Number of Hours in the Met File
0 Number of Calm Hours
126 Number of Missing Hours
43698 Hours of valid Meterological Data (enter number of VALID hours in met data file)

Employee Job Title
APPENDIX N

Appendix N: Landfill Gas Calibration Factor
1.0 Background
As stated in the “Existing Conditions Report – Landfill Gas (VOC) Baseline Assessment”, the
landfill gas emission rate could be developed using the LANDGEM Model, which is a landfill gas
generation model, not a landfill gas emission model. The approach taken in this baseline
assessment, which was based on the metered landfill gas consumption data, also produces an
estimate of landfill gas generation rather than landfill gas emission. This is a very critical
distinction when assessing air quality. The effect of landfill gas passing through several feet of
moistened soil, full of microbes and reactive minerals, greatly reduces the emissions of many
landfill gas compounds. This is particularly true for reduced sulphur compounds such as
hydrogen sulphide.
As part of the assessment of landfill gas, an assessment has been made to determine the
applicability of a landfill emission rate calibration factor to account for soil attenuation effects.
The assessment was performed using vinyl chloride (to represent VOCs present in the landfill
gas) and hydrogen sulphide monitoring results.
Guidance to perform this assessment was provided in the Ministry of the Environment’s (MOE)
Combined Assessment of Modelled and Monitored Results (CAMM) Technical Bulletin, Version
4.0, August 2011. A CAMM assessment compares modelled concentrations to actual measured
(monitored) concentrations and identifies any systematic biases using the Initial Unpaired
Analysis.
Biases in the model could be due to numerous factors including meteorological inputs,
uncertainties in the emission data, or, in this instance, unaccounted soil attenuation effects. It is
assumed that monitoring concentrations are accurate and that the meteorology is reasonable
and therefore implying that any discrepancies between modelled and monitored results are
primarily due to uncertainties in the modelled emissions. This assumption, that systematic
biases encountered are due to uncertainty in the landfill gas emission rate, justifies only looking
at refining emission rates of the landfill.

2.0 Monitoring Data
Waste Management of Canada Corporation (WM) has retained RWDI Air Inc. to conduct
several ambient monitoring programs at the Ottawa Landfill facility. Continuous wind speed and
wind direction measurements were taken concurrently during the sample collection by the on-
site weather station installed by RWDI.
Reduced sulphur samples were collected using a continuous monitoring station in a fixed
location. The samples were collected between July 7 and October 7 of the year 2011. On-site
meteorological data was used to identify concentrations taken when the wind directions placed
the monitoring station downwind of the landfill and to exclude the concentrations taken when the
wind directions placed the monitoring station upwind.
VOC samples were collected between 2004 and 2011, excluding the years of 2005 and 2006 in
sample tubes in various locations around the landfill. A total of sixty (60) VOC samples were
collected during 30-minute time periods. Vinyl chloride was analyzed using selective ion mode
(SIM) to obtain lower detection limits. The ambient VOC samples were generally paired (with
exception of the samples collected in 2004) and collected at locations directly downwind and
upwind of the landfill mound. The sampling locations (upwind and downwind) were pre-selected
based on forecasts of wind directions provided by Environment Canada, information from the
on-site meteorological station, on-site observations, and any directives provided by the MOE.
The upwind concentrations, representing background levels of vinyl chloride, were removed
from the downwind concentration values in the CAMM assessment. The VOC samples were
screened for applicability and completeness and 42 of the samples results were deemed
suitable for use in the CAMM assessment.
3.0 Air Dispersion Modelling
As this assessment is to determine the accuracy of the landfill gas emission rate, the landfill
mound is the only source included in the CAMM modelling. AERMOD model runs were set up
to correspond directly to the time, sample location and meteorological conditions present at the
time of sample collection. The on-site meteorological data was provided to the MOE for
processing. This MOE processed meteorological dataset was used in the dispersion modelling.
The receptor configuration used in the modelling was chosen to be more conservative than the
configuration outlined in the MOE’s CAMM Technical Bulletin. Instead of a 5 receptor array (for

fixed location monitoring) or 10 receptor array (variable location monitoring), a grid of 81
receptors was used, with the center receptor positioned over the monitoring station location.
The dimension of the receptor grid, 40 metres by 40 metres , with an inter-receptor spacing of 5
meters, representing the monitoring station, was chosen as the distance between the landfill
and the monitoring location was a relatively small distance. Sampling height of the monitoring
station was approximately 1.5 m and therefore the receptor heights were set at 1.5 meters.
The modeling results that were reported and used in comparisons with the monitoring data were
the average of the results obtained for the 81 receptors for each sampling period. This
procedure reduces the impacts of discrepancies between the actual wind directions transporting
the landfill’s emissions and the wind directions in the MOE processed meteorological dataset
used for modelling.
4.0 Initial Unpaired Analysis
The accuracy of modeling results is improved by refining emission rates using a process that
the MOE has termed “Initial Unpaired Analysis” to identify and remove inherent bias, either high
or low, in POI concentrations predicted by dispersion models. This process involves a
comparison of modelled and monitored results to determine ifemission rate adjustments are
necessary to match dispersion model predicted POI concentrations with the monitored data.
Adjustments are made using a defined set of rules to ensure that no bias is introduced by the
individual making adjustments to the emission rates. The process has been defined by the
MOE in the CAMM Technical Bulletin.
As outlined in the MOE’s CAMM Technical Bulletin, the assessment primarily focuses on the
use of quantile:quantile (Q:Q)plots and other statistical measures to assess for systematic bias.
In accordance with the MOE, the Q:Q plot allows rapid identification of biases towards either the
modelling or monitoring results. The closer the points are to the center line (i.e. the 1-to-1 factor
line) the better the correlation between the modelling and the monitoring data. If values are
consistently beyond the “factor of two lines” or the “tolerance lines”, this would indicate a strong
bias towards modeling (either over predictions or under predictions).
As shown in Figure A2, a strong bias is presented in the Q:Q plot for hydrogen sulphide
modelled and monitored results, as all the points fall above the 1-to-1 factor line and outside of
the factor of two tolerance line. The AERMOD model appears to consistently overestimate the
hydrogen sulphide concentrations present in the ambient air. The strong bias towards over-

estimating modelled concentrations warrants further analysis to determine an emission rate
adjustment factor or calibration factor.
A Robust Highest Concentrations (RHC) analysis was used to determine the value of the
calibration factor used to adjust the hydrogen sulphide landfill gas emission rate. The RHC ratio
is less vulnerable to unusual events which may unnecessarily distort comparisons if the entire
distribution of these results were considered. The RHC ratio is calculated using the top 26
highest modelled and monitored concentration values.
The RHC calculated from the modelled and monitored hydrogen sulphide results was 0.137,
meaning the initial hydrogen sulphide emission rate could be divided by 7.3. However, to
maintain a relatively conservative approach, the calibration factor was reduced by approximately
40%, to a value of 3. All hydrogen sulphide concentration presented in the “Existing Conditions
Report – Landfill Gas (VOC) Baseline Assessment” represent a calibrated concentrations where
the emission rate was divided by a calibration factor of 3.
Figure A2: Initial Unpaired Analysis for Hydrogen Sulphide
0
0
1
10
100
1000
10000
100000
0.1 1 10 100 1000 10000
Mo
de
lled
(n
g/u
3 )
Monitored (ng/u3)

As previously mentioned, a total of 42 observations and model predictions were used to
construct the Q:Q plot for vinyl chloride, shown in Figure A3. The majority of the data points lie
within the factor of two tolerance lines, the outliers being lower value observations and model
predictions. This indicates that modeling results are reasonably well matched to the monitoring
results. Thus, no calibration factor was applied to vinyl chloride emission rates or any other
VOC emission rates found in the “Existing Conditions Report – Landfill Gas (VOC) Baseline
Assessment”.
Figure A3: Initial Unpaired Analysis for Vinyl Chloride
5.0 Conclusion
The MOE’s CAMM Technical Bulletin was used as guidance to determine the applicability of a
landfill emission ratecalibration factor to account for soil attenuation effects. A calibration factor
of 3 will be applied to the landfill’s hydrogen sulphide emission rate. A calibration factor was not
deemed necessary for the vinyl chloride emission rates or any of the VOCs that it is
representing.
0.01
0.1
1
10
100
1000
10000
0.1 1 10 100 1000
Mo
de
lled
(n
g/m
3 )
Monitored (ng/m3)

Start Time End Time Start Time End TimeSS 32 19-Jul-04 4:57 5:27 4-6 0.397 9.5 0.042 SS 16 29-Jul-04 8:26 9:07 0.034 12.8 0.003SS 28 22-Jul-04 8:35 9:05 8-10 0.721 9.7 0.074 STA05 17-Aug-04 9:53 10:23 0.043 11.3 0.004SS 4 26-Jul-04 8:29 8:59 8-9 0.095 9.9 0.010 SS33 31-Aug-04 8:53 9:23 0.052 10.3 0.005
SS 11 29-Jul-04 9:08 9:38 9-10 0.105 9.2 0.011 SS1 2-Sep-04 4:01 4:29 0.031 8.3 0.004SS 25 30-Jul-04 12:15 12:45 12-13 0.479 9.7 0.049 SS28 15-Sep-04 8:39 9:14 0.051 7.6 0.007
STA 04 9-Aug-04 5:18 5:48 5-6 0.187 7.8 0.024 SS31 17-Sep-04 2:48 3:23 0.084 7.2 0.0117SS 23 17-Aug-04 9:00 9:30 9-10 0.267 8.5 0.031 STA 04 24-Sep-04 8:27 9:02 0.151 8.6 0.0176SS14 24-Aug-04 8:38 9:08 8-10 0.042 7.9 0.005 SS25 30-Sep-04 8:19 8:48 0.24 8.5 0.0282SS31 25-Aug-04 8:40 9:10 8-10 0.185 8.3 0.022 SS43 11-Jun-07 10:37 11:07 0.090 7 0.013SS10 26-Aug-04 8:24 8:54 8-9 0.456 7.8 0.058 SS65 7-Jul-07 12:50 1:20 0.084 7 0.012SS29 31-Aug-04 8:26 9:01 8-10 0.155 9.6 0.016 SS35 23-Jul-07 2:25 2:55 0.001 6.9 0.000
STA02 1-Sep-04 8:33 9:03 8-10 0.179 8.4 0.021 SS81 20-Aug-07 15:18 15:57 0.125 8.2 0.015SS7 2-Sep-04 3:45 4:15 3-5 0.072 7.7 0.009 SS78 28-Aug-07 9:28 10:04 0.137 8.9 0.015
SS26 3-Sep-04 8:28 8:58 8-9 0.036 7.9 0.005 SS52 24-Jun-08 9:52 10:22 1.575 7 0.225SS24 7-Sep-04 7:55 8:25 7-9 0.644 7 0.092 SS53 26-Jun-08 14:35 15:05 0.515 6.9 0.075SS30 13-Sep-04 7:52 8:22 7-9 0.511 8.3 0.062 SS41 22-Jul-08 [1] [1] 0.604 7.1 0.085SS43 14-Sep-04 7:58 8:28 7-9 0.036 8.6 0.004 SS72 27-Aug-08 [1] [1] 1.47 20.8 0.071SS42 15-Sep-04 8:21 8:51 8-9 0.449 8.1 0.055 SS90 28-Aug-08 [1] [1] 0.252 20 0.013SS32 16-Sep-04 8:09 8:39 8-9 0.227 8 0.028 SS54 12-Aug-09 [1] [1] 0.178 7.2 0.025SS52 11-Jun-07 10:44 11:20 10-12 0.084 7 0.012 SS52 19-Aug-09 [1] [1] 0.042 6.8 0.006SS56 7-Jul-07 11:42 12:12 11-13 0.678 7 0.097 SS56 26-Aug-09 [1] [1] 0.063 6.5 0.010SS57 23-Jul-07 2:48 3:25 14-16 1.381 8.8 0.157 SS16 15-Jun-10 2:43 3:13 -- LOST 8.2SS83 20-Aug-07 15:12 15:12 15-16 0.127 2.5 0.051 SS36 27-Jul-10 3:06 3:36 0.083 7.8 0.011SS63 28-Aug-07 9:18 9:48 9-10 0.748 7.6 0.098 SS29 29-Jul-10 1:43 2:13 0.077 7.9 0.010SS54 24-Jun-08 [1] [1] 8-11 1.247 7 0.178 SS21 19-Aug-10 1:06 1:36 0.826 8.4 0.098SS55 26-Jun-08 14:24 14:54 14-15 0.404 6.7 0.060 SS25 31-Aug-10 3:11 3:41 0.046 7.8 0.006SS42 22-Jul-08 14:00 14:30 14-15 0.509 6.8 0.075 SS15 21-Jun-11 14:29 14:59 0.089 7.5 0.012SS74 27-Aug-08 13:25 13:55 13-14 0.633 20.8 0.030 SS14 28-Jun-11 12:04 12:34 0.127 7.5 0.017SS71 28-Aug-08 12:30 13:00 12-13 0.474 20.6 0.023 SS25 21-Jul-11 15:05 15:35 0.31 7.6 0.041SS58 12-Aug-09 [1] [1] 13-16 0.209 7.4 0.028 SS34 28-Jul-11 15:30 16:00 0.223 8.1 0.028SS51 19-Aug-09 [1] [1] 11-14 0.135 7 0.019 SS63 8-Sep-11 14:40 15:10 0.59 8 0.074SS55 26-Aug-09 [1] [1] 12-15 0.105 6.8 0.015SS19 15-Jun-10 14:27 14:57 14-15 0.095 7.4 0.013 Notes: [1] Field notes with exact start time and end time were missing for these samples.SS32 27-Jul-10 15:50 16:20 15-17 0.118 7.8 0.015 Upwind samples were not modelled.SS34 29-Jul-10 14:27 14:58 14-15 0.053 7.8 0.007SS22 19-Aug-10 13:50 14:20 13-15 0.618 7.9 0.078SS26 31-Aug-10 14:35 15:05 14-15 0.052 8.4 0.006SS12 21-Jun-11 15:26 15:56 15-16 0.0985 7.5 0.013SS16 28-Jun-11 11:22 11:52 11-12 0.772 7.1 0.109SS20 21-Jul-11 15:48 16:16 15-17 0.194 7.4 0.026SS32 28-Jul-11 14:26 14:56 14-15 0.405 8 0.051SS58 8-Sep-11 15:38 16:08 15-17 0.066 8.1 0.008
Notes: [1] Field notes with exact start time and end time were missing for these samples.Hours used in the creation of wind roses, were used for modelling purposes.
Amount(ng)
SampleVolume
MeasuredConcentration
Downwind Ambient Vinyl Chloride Sample Summary Upwind Ambient Vinyl Chloride Sample Summary
Amount(ng)
SampleVolume
MeasuredConcentration
TUBE No. DATESampling Time Period [1]
TUBE No. DATESampling Time Period [1] Hours
Modelled