SENATE BILL 1 THE EVIDENCE-BASED MODEL FOR SCHOOL …
30
SENATE BILL 1 THE EVIDENCE-BASED MODEL FOR SCHOOL FUNDING Ensuring equitable funding to help all students succeed.
Transcript of SENATE BILL 1 THE EVIDENCE-BASED MODEL FOR SCHOOL …

SENATE BILL 1
THE EVIDENCE-BASED MODEL
FOR SCHOOL FUNDING
Ensuring equitable funding to helpall students succeed.
EQUITABLE & ADEQUATE
SB1 Funding Formula Recognizes That All Students
Can Succeed, But Each Student Has Different Needs
2

*Low-Income quintiles are based on DHS %. Each
quintile represents a fifth of
the state’s student population.
1 2 3 4 5 CPS
$0
$2,000
$4,000
$6,000
$8,000
$10,000
$12,000
$14,000
$16,000
$18,000
0% - 22% 23% - 35% 36% - 52% 53% - 66% 66% - 100% CPS (84%)
Percent of Low-Income Students
Current Resources Gap to SB1 Adequacy Target
SB1 Adequacy Targets Are Progressive,
While Current Funding Is Regressive
3

LOCAL CAPACITY
How much can the district
contribute?
BASE FUNDING MINIMUM
How much does the state
currently contribute?
3. DISTRIBUTION FORMULA
How is new money from the state
distributed?
1. ADEQUACY TARGET
How much does providing
high quality education cost?
GAP TO ADEQUACY
2. PERCENT OF ADEQUACY
How well-funded is the district?
100% of Adequacy Target
District 1 District 2 District 3
HOW DOES SB1 WORK?
Overview Of The Model
4
HOW DOES SB1
RECOGNIZE INDIVIDUAL
STUDENT NEEDS?
5

Calculate Cost of 27 essential elements
Adjust salary-based elements for regional wage differences
Apply essential elements to individual districts based on demographics
Enrollment Low-IncomeSpecial NeedsEnglish Learners
DISTRICT ADEQUACY TARGET
STEP 1
STEP 2
=
STEP 3
6

Understanding CWI: The CWI
for Cook County is 6% above
the state average, and the
CWI for McLean County is
10% below the state average
SB1 ADJUSTS COSTS BASED ON REGIONAL VARIATION
No Region Is Below 0.9
Cook, Kane, Kendall,
DuPage, Will
1.06
DeKalb
1.06
Grundy
1.06
McLean County
0.90
Sangamon
0.94
Adams
0.75 0.9
Johnson
0.79 0.9 7

HOW DOES SB1 ASSESS
LOCAL ABILITY TO PAY &
ENSURE NO DISTRICTS
LOSE FUNDING?
8
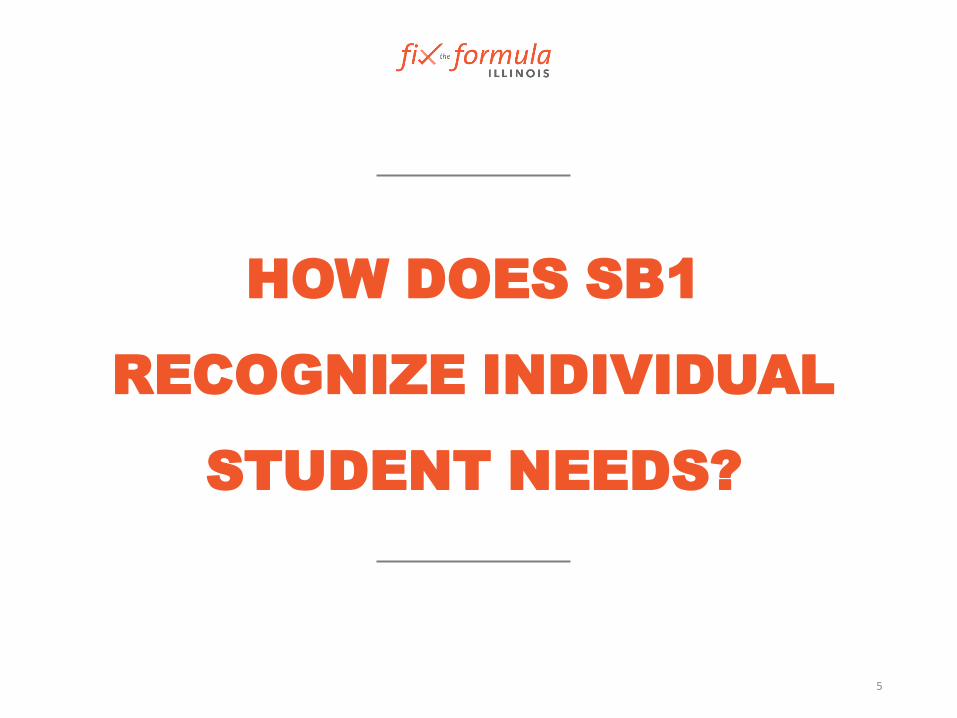
For example, if a district has an
Adequacy Target of $12,000 and receives
$4,000 in local funding and $5,000 in state
funding for a total of $9,000, it would be
at 75% of its Adequacy Target.
The current level of funding for a district is its Percent of Adequacy:
LOCAL
CAPACITY
BASE
FUNDING
MINIMUM
ADEQUACY
TARGET
75% of Adequacy
100% of
Adequacy
The Formula Distributes New Dollars Based On
How Far A District Is From Its Adequacy Target
GAP TO
ADEQUACY
9

• Every district keeps the amount of state funding it received in FY17. This is the initial Base Funding Minimum.
• Going forward, no district will receive less state funding than it received the prior year.
• Each new dollar a district receives from the state in Year 1 becomes a part of its Base Funding Minimum in Year 2 and so on.
• If the state does not appropriate enough to cover the cost of the Base Funding Minimum, then funds are first removed from the Base Funding Minimum from the most adequately funded districts. If that still isn’t enough, then further reductions are on a per pupil basis for all districts.
The Base Funding Minimum Ensures
No District Loses Money
BASE FUNDING
MINIMUM
10

To calculate how much a community can contribute to funding from local property taxes the model uses a Local Capacity Target (LCT).
• The LCT is the dollar amount a district would ideally contribute towards its Adequacy Target, based on a comparison of all districts in the state.
Districts With Higher Property Wealth
Are Expected To Contribute More
Local Capacity Reflects Local Resources That
Support Education
LOCAL
CAPACITY
11

For districts collecting taxes below their LCT:
• The formula uses their calculated LCT.
• This clearly shows that districts are responsible for a portion of how inadequately funded they are – when they tax low.
• If districts raise more revenue to reach their LCT, they do not lose any eligibility for state funding.
LOCAL CAPACITY TARGET
100% of
Adequacy
Target
DISTRICT TAXING BELOW LCT
Real Receipts
Local Capacity
used in model
For districts taxing above their LCT:
• Real receipts are adjusted downward towards their LCT.
• Even though they are more adequately funded, they will get more state funding.
• Districts can also lower their taxes and be eligible for more state funding (see next slide)
Gap to Adequacy
DISTRICT TAXING ABOVE LCT
The Local Capacity Target Provides Fairness In
An Inequitable Property Tax System
12
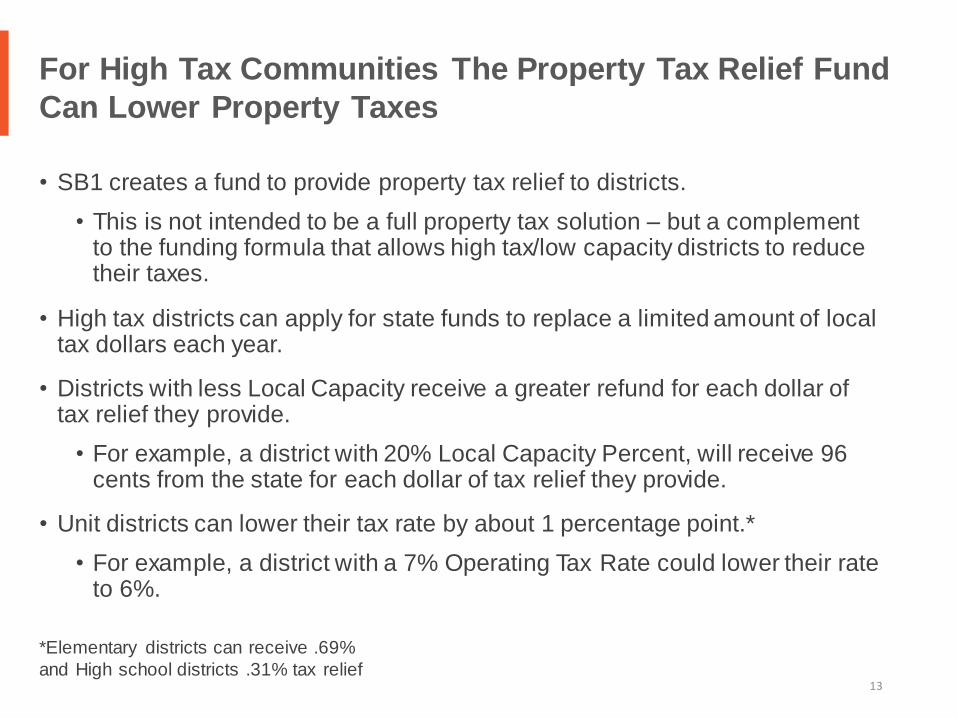
• SB1 creates a fund to provide property tax relief to districts.
• This is not intended to be a full property tax solution – but a complement to the funding formula that allows high tax/low capacity districts to reduce their taxes.
• High tax districts can apply for state funds to replace a limited amount of local tax dollars each year.
• Districts with less Local Capacity receive a greater refund for each dollar of tax relief they provide.
• For example, a district with 20% Local Capacity Percent, will receive 96 cents from the state for each dollar of tax relief they provide.
• Unit districts can lower their tax rate by about 1 percentage point.*
• For example, a district with a 7% Operating Tax Rate could lower their rate to 6%.
*Elementary districts can receive .69%
and High school districts .31% tax relief
For High Tax Communities The Property Tax Relief Fund
Can Lower Property Taxes
13

• 80% of districts in Illinois are funded below adequacy
• New funding is required to get to adequacy
• Therefore, no district should lose funding
In Sum, Most Districts Are
Far Away From Adequacy…
14
HOW DOES SB1 TREAT
CHICAGO PUBLIC SCHOOLS?
15

• The Chicago Block Grant is sunset.
• CPS will get its claims moving forward, like every other district.*
• CPS’ existing funding is included in the Base Funding Minimum, so CPS students don’t lose money.
• This is the same approach used for existing funding for every other district.
• The approach to calculating adequacy is the same for all districts moving forward.
• No district loses money compared to current funding levels, so there are #norednumbers
*There are no changes to
Early Childhood Education funding
The Chicago Block Grant Is Integrated Into The Formula &
CPS Does Not Lose Funding
16

Adequacy Target
Local Capacity
Base Funding Minimum
CPS
ADEQUACY
TARGET
$15,415
Existing Funding from
Block Grant included in
Base Funding Minimum
Gap to Adequacy
Decreases Gap to
Adequacy
The Chicago Block Grant Will Be Integrated
Into The Base Funding Minimum
17
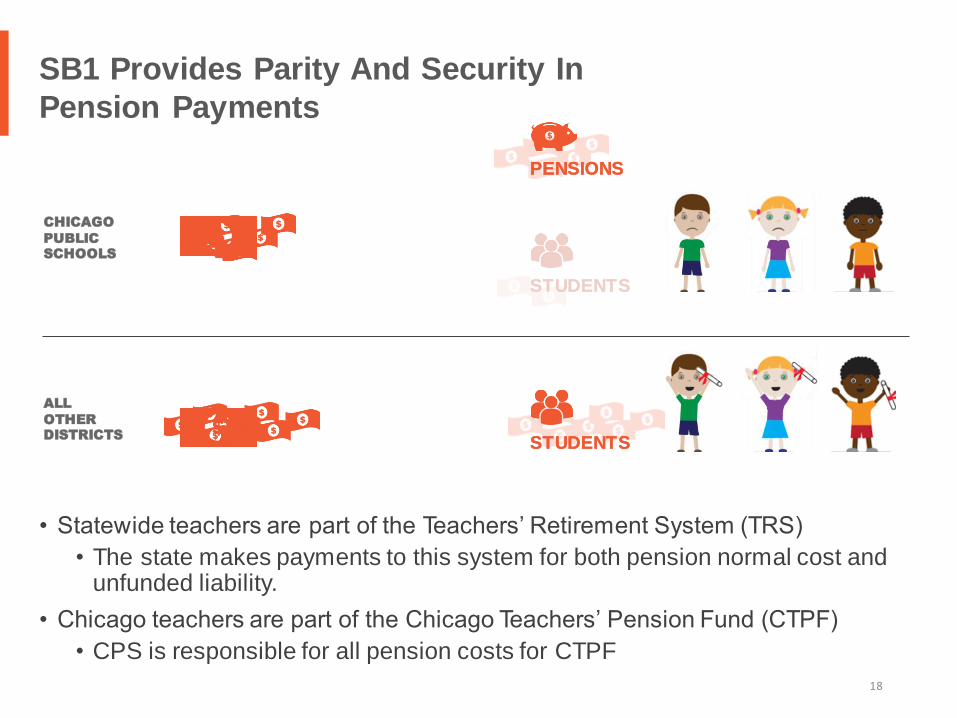
• Statewide teachers are part of the Teachers’ Retirement System (TRS)
• The state makes payments to this system for both pension normal cost and unfunded liability.
• Chicago teachers are part of the Chicago Teachers’ Pension Fund (CTPF)
• CPS is responsible for all pension costs for CTPF
SB1 Provides Parity And Security In
Pension Payments
STUDENTS
PENSIONS
STUDENTS
PENSIONSPENSIONSPENSIONSPENSIONS
STUDENTSSTUDENTSSTUDENTSSTUDENTS
CHICAGO
PUBLIC
SCHOOLS
ALL
OTHER
DISTRICTS
18
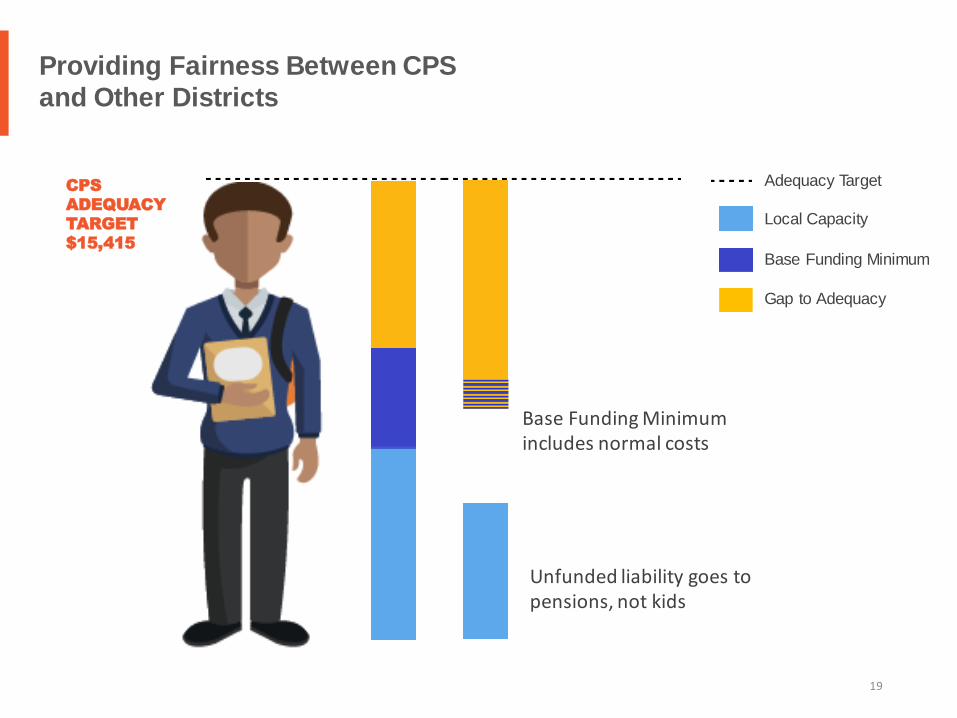
Base Funding Minimum includes normal costs
Unfunded liability goes to pensions, not kids
Providing Fairness Between CPS
and Other Districts
CPS
ADEQUACY
TARGET
$15,415
Adequacy Target
Local Capacity
Base Funding Minimum
Gap to Adequacy
19

• Chicago uses local property tax dollars for pension payments. Adequate funding for Chicago must account for pension costs:
• Chicago’s normal cost payments are part of adequate funding since they are for teachers currently in the classroom.
• Chicago’s unfunded liability are accounted for in their Local Capacity since these are local tax dollars that cannot be used for adequate school funding.
• CPS will continue to be responsible to make the pension payments to CTPF. Effectively, the state payment will pass through CPS for them to pay CTPF. (Note: this does not change existing pension law)
• If any other district was required to pay its pension costs, SB1 would treat that district the same way, providing security to all districts.
SB1 Provides Parity And Security
In Pension Payments
20

HOW DOES SB1 CLOSE
THE GAP TO ADEQUACY?
21

LOCAL CAPACITY
BASE FUNDING MINIMUM
3. DISTRIBUTION FORMULA
How is new money from the state
distributed?
1. ADEQUACY TARGET
GAP TO ADEQUACY
2. PERCENT OF ADEQUACY
100% of Adequacy Target
District 1 District 2 District 3
SB1 Invests Dollars Equitably On The Path To
Adequacy For All Districts
22
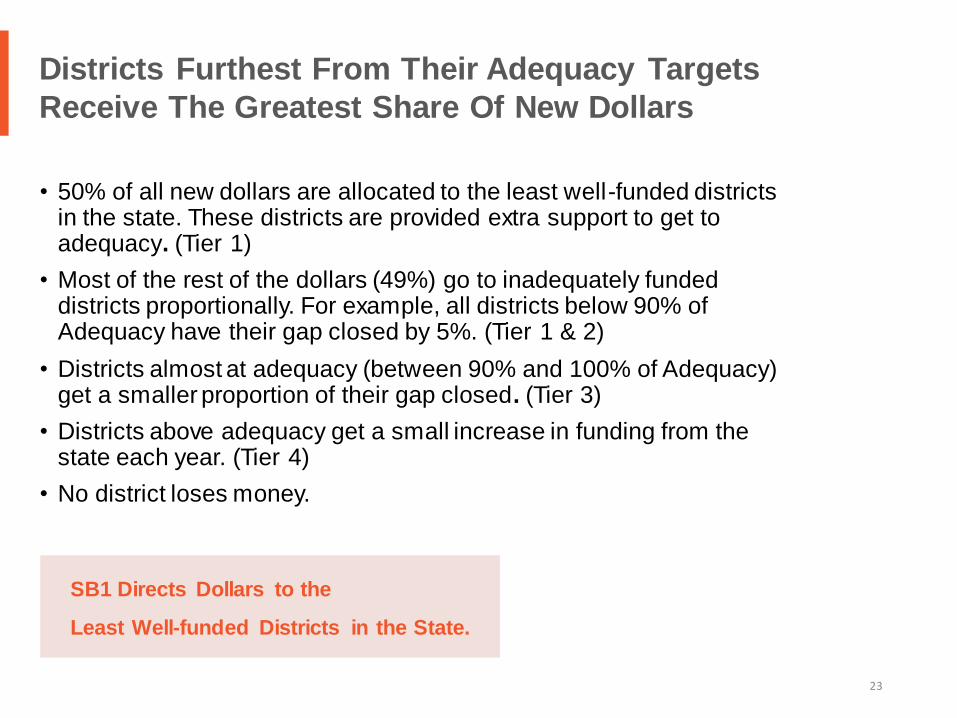
• 50% of all new dollars are allocated to the least well-funded districts in the state. These districts are provided extra support to get to adequacy. (Tier 1)
• Most of the rest of the dollars (49%) go to inadequately funded districts proportionally. For example, all districts below 90% of Adequacy have their gap closed by 5%. (Tier 1 & 2)
• Districts almost at adequacy (between 90% and 100% of Adequacy) get a smaller proportion of their gap closed. (Tier 3)
• Districts above adequacy get a small increase in funding from the state each year. (Tier 4)
• No district loses money.
Districts Furthest From Their Adequacy Targets
Receive The Greatest Share Of New Dollars
SB1 Directs Dollars to the
Least Well-funded Districts in the State.
23

IS
SB1 EQUITABLE?
24
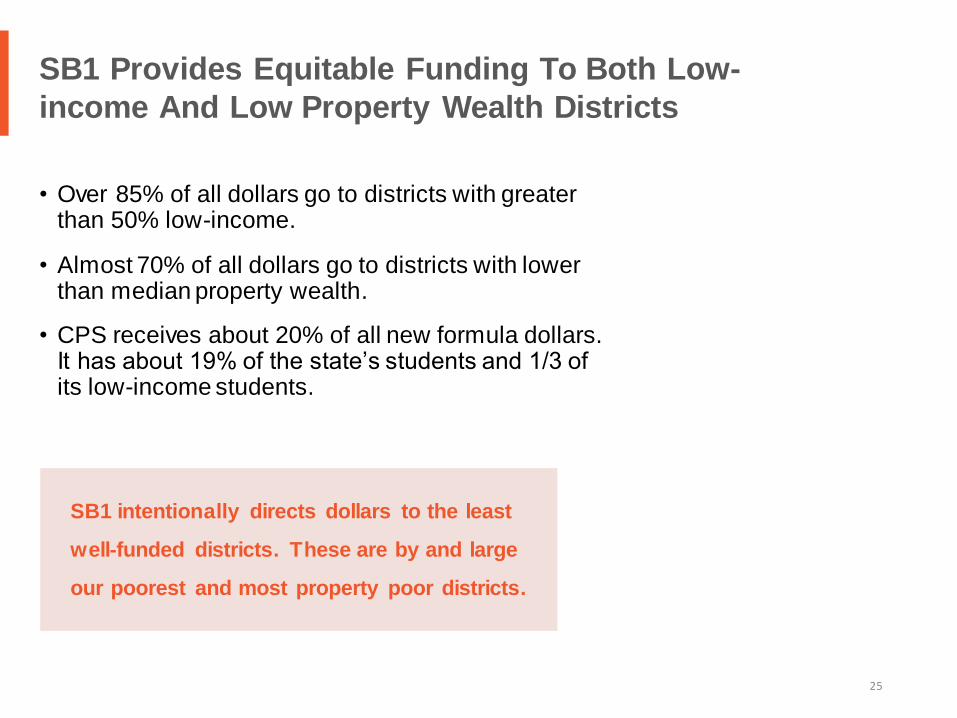
• Over 85% of all dollars go to districts with greater than 50% low-income.
• Almost 70% of all dollars go to districts with lower than median property wealth.
• CPS receives about 20% of all new formula dollars. It has about 19% of the state’s students and 1/3 of its low-income students.
SB1 Provides Equitable Funding To Both Low-
income And Low Property Wealth Districts
SB1 intentionally directs dollars to the least
well-funded districts. These are by and large
our poorest and most property poor districts.
25

$-
$20,000,000
$40,000,000
$60,000,000
$80,000,000
$100,000,000
$120,000,000
$140,000,000
$160,000,000
0% - 22% 23% - 35% 36% - 52% 53% - 66% 66% - 100% CPS 84%
Distribution of $350M in New Funding by Low-Income
*Analysis is based on public ISBE data. Data reflects FY17 simulation. FY18 numbers will vary.
$9M
$22M
$40M
$70M $70M
$138M
317,206 317,990 315,332 321,973 318,898 367,003Enrollment
% Low-Income
SB 1 Increases Equity By Sending New Dollars
To Neediest Districts
26
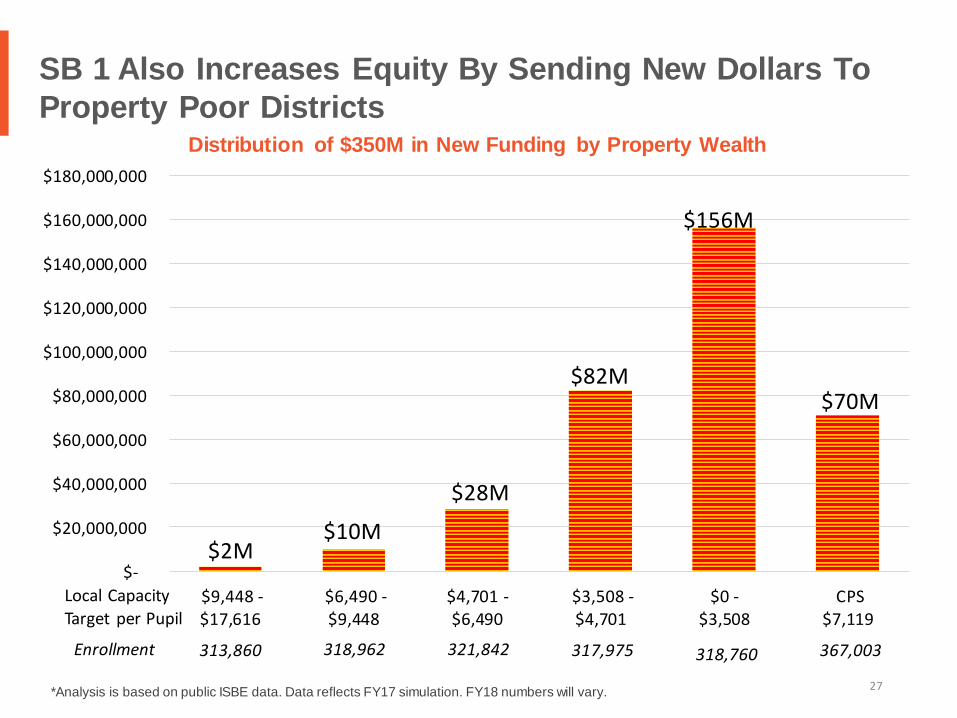
*Analysis is based on public ISBE data. Data reflects FY17 simulation. FY18 numbers will vary.
$-
$20,000,000
$40,000,000
$60,000,000
$80,000,000
$100,000,000
$120,000,000
$140,000,000
$160,000,000
$180,000,000
$9,448 -$17,616
$6,490 -$9,448
$4,701 -$6,490
$3,508 -$4,701
$0 -$3,508
CPS$7,119
Distribution of $350M in New Funding by Property Wealth
$70M
$156M
$82M
$28M
$10M$2M
Local Capacity
Target per Pupil
Enrollment 313,860 318,962 321,842 317,975 318,760 367,003
SB 1 Also Increases Equity By Sending New Dollars To
Property Poor Districts
27

WHY
SUPPORT SB1?
28

✓The new formula ties school funding to those evidence-based best practices the research shows enhance student achievement in the classroom.
✓Each school district is treated individually, with an Adequacy Target based on the needs of its student body. The greater the student need, the higher the Adequacy Target.
✓New dollars go to the neediest districts first—those furthest from their Adequacy Target. This will close the gaps in funding that exist in our current system.
✓SB1 treats students in Chicago the same way it treats students in every other school district in the state by getting rid of Block Grants and reconciling pension payments.
✓No district loses money. No exceptions. The starting point is the amount of funding the district has this year. All new state funding going forward is on top of what districts currently receive.
HIGHLIGHTS OF SB1
29
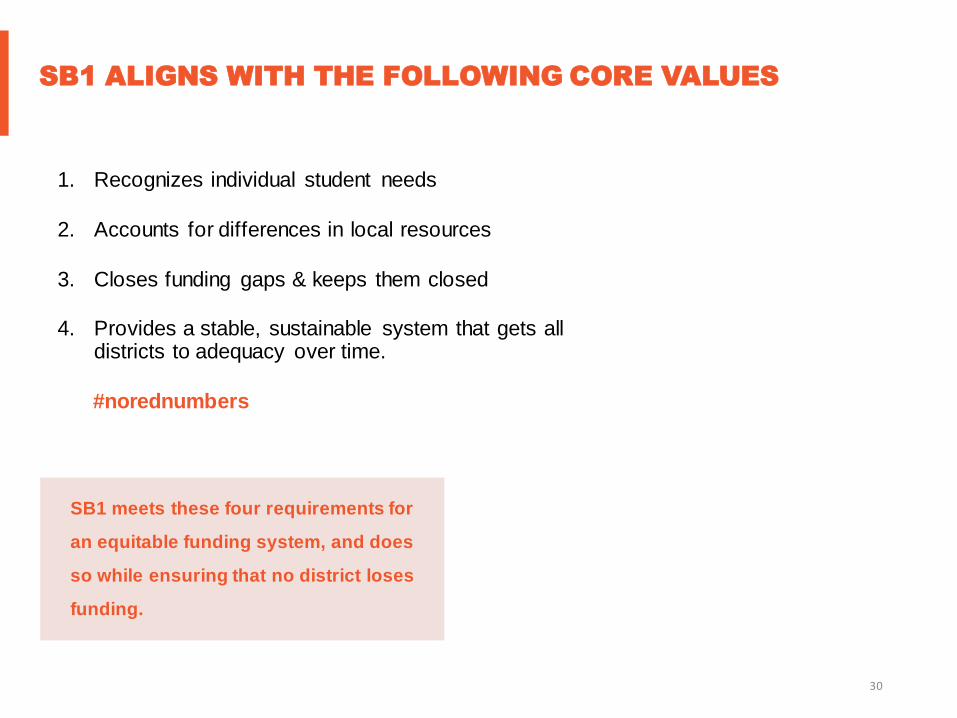
1. Recognizes individual student needs
2. Accounts for differences in local resources
3. Closes funding gaps & keeps them closed
4. Provides a stable, sustainable system that gets all districts to adequacy over time.
#norednumbers
SB1 ALIGNS WITH THE FOLLOWING CORE VALUES
SB1 meets these four requirements for
an equitable funding system, and does
so while ensuring that no district loses
funding.
30