
Seminoma and Embryonal Carcinoma Footprints Identified by ...
13
Seminoma and Embryonal Carcinoma Footprints Identified by Analysis of Integrated Genome-Wide Epigenetic and Expression Profiles of Germ Cell Cancer Cell Lines Yvonne G. van der Zwan 1 " , Martin A. Rijlaarsdam 1 " , Fernando J. Rossello 2 , Amanda J. Notini 3 , Suzan de Boer 3 , D. Neil Watkins 2 , Ad J. M. Gillis 1 , Lambert C. J. Dorssers 1 , Stefan J. White 3 , Leendert H. J. Looijenga 1 * 1 Department of Pathology, Erasmus MC - University Medical Center Rotterdam, Rotterdam, The Netherlands, 2 Centre for Cancer Research, MIMR-PHI Institute of Medical Research, Monash University, Clayton, Victoria, Australia, 3 Centre for Genetic Diseases, MIMR-PHI Institute of Medical Research, Monash University, Clayton, Victoria, Australia Abstract Background: Originating from Primordial Germ Cells/gonocytes and developing via a precursor lesion called Carcinoma In Situ (CIS), Germ Cell Cancers (GCC) are the most common cancer in young men, subdivided in seminoma (SE) and non- seminoma (NS). During physiological germ cell formation/maturation, epigenetic processes guard homeostasis by regulating the accessibility of the DNA to facilitate transcription. Epigenetic deregulation through genetic and environmental parameters (i.e. genvironment) could disrupt embryonic germ cell development, resulting in delayed or blocked maturation. This potentially facilitates the formation of CIS and progression to invasive GCC. Therefore, determining the epigenetic and functional genomic landscape in GCC cell lines could provide insight into the pathophysiology and etiology of GCC and provide guidance for targeted functional experiments. Results: This study aims at identifying epigenetic footprints in SE and EC cell lines in genome-wide profiles by studying the interaction between gene expression, DNA CpG methylation and histone modifications, and their function in the pathophysiology and etiology of GCC. Two well characterized GCC-derived cell lines were compared, one representative for SE (TCam-2) and the other for EC (NCCIT). Data were acquired using the Illumina HumanHT-12-v4 (gene expression) and HumanMethylation450 BeadChip (methylation) microarrays as well as ChIP-sequencing (activating histone modifications (H3K4me3, H3K27ac)). Results indicate known germ cell markers not only to be differentiating between SE and NS at the expression level, but also in the epigenetic landscape. Conclusion: The overall similarity between TCam-2/NCCIT support an erased embryonic germ cell arrested in early gonadal development as common cell of origin although the exact developmental stage from which the tumor cells are derived might differ. Indeed, subtle difference in the (integrated) epigenetic and expression profiles indicate TCam-2 to exhibit a more germ cell-like profile, whereas NCCIT shows a more pluripotent phenotype. The results provide insight into the functional genome in GCC cell lines. Citation: van der Zwan YG, Rijlaarsdam MA, Rossello FJ, Notini AJ, de Boer S, et al. (2014) Seminoma and Embryonal Carcinoma Footprints Identified by Analysis of Integrated Genome-Wide Epigenetic and Expression Profiles of Germ Cell Cancer Cell Lines. PLoS ONE 9(6): e98330. doi:10.1371/journal.pone.0098330 Editor: Amr H. Sawalha, University of Michigan, United States of America Received March 13, 2014; Accepted April 30, 2014; Published June 2, 2014 Copyright: ß 2014 van der Zwan et al. This is an open-access article distributed under the terms of the Creative Commons Attribution License, which permits unrestricted use, distribution, and reproduction in any medium, provided the original author and source are credited. Data Availability: The authors confirm that all data underlying the findings are fully available without restriction. Array and ChIP sequencing data is available at the Gene Expression Omnibus under accession number GSE56454. Funding: This work is supported by funding from the European Society for Pediatric Endocrinology Research Fellowship (YZ). MR is supported by a Translational Grant, Erasmus MC. SB is supported by APA and IPRS scholarships from Monash University. This work was supported by funding from Monash University (SW). MIMR receives support from the Victorian Government’s Operational Infrastructure Support Program. The funders had no role in study design, data collection and analysis, decision to publish, or preparation of the manuscript. Competing Interests: The authors have declared that no competing interests exist. * E-mail: [email protected] " These authors contributed equally to this work. These authors also contributed equally to this work. Introduction Type II (testicular) germ cell tumors, here referred to as Germ Cell Cancers (GCC), are the most common malignancy in Caucasian adolescents and young adults, and their incidence is still rising [1–3]. GCC originate from primordial germ cells or gonocytes, and are subdivided into seminomas (SE) and non- seminomas (NS), with carcinoma in situ (CIS) of the testis as their PLOS ONE | www.plosone.org 1 June 2014 | Volume 9 | Issue 6 | e98330 . . .
Transcript of Seminoma and Embryonal Carcinoma Footprints Identified by ...

Seminoma and Embryonal Carcinoma FootprintsIdentified by Analysis of Integrated Genome-WideEpigenetic and Expression Profiles of Germ Cell CancerCell LinesYvonne G. van der Zwan1
"
, Martin A. Rijlaarsdam1
"
, Fernando J. Rossello2, Amanda J. Notini3, Suzan de
Boer3, D. Neil Watkins2, Ad J. M. Gillis1, Lambert C. J. Dorssers1, Stefan J. White3 ,
Leendert H. J. Looijenga1*
1 Department of Pathology, Erasmus MC - University Medical Center Rotterdam, Rotterdam, The Netherlands, 2 Centre for Cancer Research, MIMR-PHI Institute of Medical
Research, Monash University, Clayton, Victoria, Australia, 3 Centre for Genetic Diseases, MIMR-PHI Institute of Medical Research, Monash University, Clayton, Victoria,
Australia
Abstract
Background: Originating from Primordial Germ Cells/gonocytes and developing via a precursor lesion called Carcinoma InSitu (CIS), Germ Cell Cancers (GCC) are the most common cancer in young men, subdivided in seminoma (SE) and non-seminoma (NS). During physiological germ cell formation/maturation, epigenetic processes guard homeostasis byregulating the accessibility of the DNA to facilitate transcription. Epigenetic deregulation through genetic andenvironmental parameters (i.e. genvironment) could disrupt embryonic germ cell development, resulting in delayed orblocked maturation. This potentially facilitates the formation of CIS and progression to invasive GCC. Therefore, determiningthe epigenetic and functional genomic landscape in GCC cell lines could provide insight into the pathophysiology andetiology of GCC and provide guidance for targeted functional experiments.
Results: This study aims at identifying epigenetic footprints in SE and EC cell lines in genome-wide profiles by studying theinteraction between gene expression, DNA CpG methylation and histone modifications, and their function in thepathophysiology and etiology of GCC. Two well characterized GCC-derived cell lines were compared, one representative forSE (TCam-2) and the other for EC (NCCIT). Data were acquired using the Illumina HumanHT-12-v4 (gene expression) andHumanMethylation450 BeadChip (methylation) microarrays as well as ChIP-sequencing (activating histone modifications(H3K4me3, H3K27ac)). Results indicate known germ cell markers not only to be differentiating between SE and NS at theexpression level, but also in the epigenetic landscape.
Conclusion: The overall similarity between TCam-2/NCCIT support an erased embryonic germ cell arrested in early gonadaldevelopment as common cell of origin although the exact developmental stage from which the tumor cells are derivedmight differ. Indeed, subtle difference in the (integrated) epigenetic and expression profiles indicate TCam-2 to exhibit amore germ cell-like profile, whereas NCCIT shows a more pluripotent phenotype. The results provide insight into thefunctional genome in GCC cell lines.
Citation: van der Zwan YG, Rijlaarsdam MA, Rossello FJ, Notini AJ, de Boer S, et al. (2014) Seminoma and Embryonal Carcinoma Footprints Identified by Analysisof Integrated Genome-Wide Epigenetic and Expression Profiles of Germ Cell Cancer Cell Lines. PLoS ONE 9(6): e98330. doi:10.1371/journal.pone.0098330
Editor: Amr H. Sawalha, University of Michigan, United States of America
Received March 13, 2014; Accepted April 30, 2014; Published June 2, 2014
Copyright: � 2014 van der Zwan et al. This is an open-access article distributed under the terms of the Creative Commons Attribution License, which permitsunrestricted use, distribution, and reproduction in any medium, provided the original author and source are credited.
Data Availability: The authors confirm that all data underlying the findings are fully available without restriction. Array and ChIP sequencing data is available atthe Gene Expression Omnibus under accession number GSE56454.
Funding: This work is supported by funding from the European Society for Pediatric Endocrinology Research Fellowship (YZ). MR is supported by a TranslationalGrant, Erasmus MC. SB is supported by APA and IPRS scholarships from Monash University. This work was supported by funding from Monash University (SW).MIMR receives support from the Victorian Government’s Operational Infrastructure Support Program. The funders had no role in study design, data collection andanalysis, decision to publish, or preparation of the manuscript.
Competing Interests: The authors have declared that no competing interests exist.
* E-mail: [email protected]
"
These authors contributed equally to this work.
These authors also contributed equally to this work.
Introduction
Type II (testicular) germ cell tumors, here referred to as Germ
Cell Cancers (GCC), are the most common malignancy in
Caucasian adolescents and young adults, and their incidence is
still rising [1–3]. GCC originate from primordial germ cells or
gonocytes, and are subdivided into seminomas (SE) and non-
seminomas (NS), with carcinoma in situ (CIS) of the testis as their
PLOS ONE | www.plosone.org 1 June 2014 | Volume 9 | Issue 6 | e98330
..
.
common precursor lesion [1], also known as Intratubular Germ
Cell Neoplasia Unclassified (IGCNU) [3]. In contrast to CIS and
SE, the stem cell component of NS (i.e., embryonal carcinoma,
EC) is characterized by pluripotent potential [4]. EC can
differentiate into somatic lineages and extra–embryonic tissues
(teratoma vs yolk sac tumor and choriocarcinoma, respectively),
including the germ cell lineage [4]. Various clinical, environmental
and genetic risk factors for GCC have been identified, although
the exact role of these factors is not completely clear. Clinical risk
factors constitute urological/andrological/gonadal aberrations [5–
8], while environmental factors focus on endocrine disruptors and
androgen - estrogen balance [9–11]. Genetic risk factors include a
number of susceptibility Single Nucleotide Polymorphisms, likely
related to early gonadal development [12–15] and an association
with familial predisposition [16]. Somatic mutations are rarely
found in GCC [17]. There are strong indications that the micro-
environment of the developing testis is of significant importance in
the pathogenesis of GCC. Patients with Testicular Dysgenesis
Syndrome (TDS) and specific forms of Disorders of Sex
Development (DSD) are known to have an increased risk of
developing GCC due to abnormal gonadal development, i.e.
hypovirilization [18].
Epigenetic processes have a clear role in both the initiation and
protection of pluripotency [19]. Deregulation of these tightly
controlled processes is known to be involved in the formation and
progression of various cancer types [20–24], including GCC [25].
During physiological germ cell formation and maturation,
epigenetic processes (e.g. DNA methylation, histone modifications)
guard homeostasis by regulating the accessibility of the DNA to
facilitate transcription [25,26]. The epigenome is highly dynamic,
and changes occur depending on cell type and developmental
stage, influenced by/reflecting the (micro-) environment. In spite
of this knowledge, little is known about the role of histone
modifications and DNA methylation regarding gene expression in
GCC in general, and the possible similarities and differences
between SE and EC [25,27]. Epigenetic deregulation through
genetic and environmental parameters (referred to as genviron-
ment) could disrupt physiological embryonic germ cell develop-
ment, resulting in delayed or blocked maturation, thereby
facilitating the formation of CIS, and potentially progression to
an invasive GCC [25,28–30]. Therefore, determining the epige-
netic and functional genomic landscape in GCC cell lines could
provide insight into the pathophysiology and etiology of GCC.
The results could provide guidance for targeted functional
experiments.
In this study, epigenetic footprints of SE and EC cell lines were
identified by studying the interaction between gene expression,
DNA methylation and histone modifications. Two well charac-
terized GCC-derived cell lines were used, one representative for
SE (TCam-2) [31,32] and the other for EC (NCCIT) [33]. Two
types of epigenetic modifications were investigated and related to
genome wide expression analysis: CpG DNA methylation status,
and enrichment of activating histone marks (H3K4me3,
H3K27ac).
Methods
Cell cultureTCam-2 [31,32,34] and NCCIT [33] cells were cultured in
DMEM medium (#31966-021, Thermo Fisher Scientific/Life
Technologies, Carlsbad, CA, USA) containing 10% fetal calf
serum (FCS, GE Healthcare Life Sciences, HyClone Laboratories,
Utah, USA) in T75 cm2 flasks to 75–90% confluence. For RNA
preparation, fresh medium was added 24 hours before harvest.
Cells were washed once with Hanks balanced Salt Solution
(HBSS, #14175-053, Thermo Fisher Scientific/Life Technolo-
gies, Carlsbad, CA, USA), and lysed with 7 ml of ice-cold RNA-
Bee (#Cs-105B, TEL-TEST Inc, Friendswood, Texas, USA). For
methylation, gene expression (biological duplicates) and ChiP-seq
analyses, different cultures of cells from a single source were used
(LEPO lab, Department of Pathology, Erasmus MC Rotterdam).
Biological replicates were started as independent cultures at
different days and processed similarly.
Methylation profilingDNA was isolated using the DNeasy kit according to
manufacturer’s instructions (#69504, QIAGEN, Hilden, Ger-
many). Bisulfite conversion (EZ DNA Methylation Gold Kit,
Zymo Research, Irvine, CA, USA) and methylation detection was
performed at ServiceXS (ServiceXS B.V., Leiden, The Nether-
lands). Illumina’s HumanMethylation450 BeadChip was used
(Illumina, Inc., San Diego, CA, U.S.A, processing and hybridiza-
tion according to the manufacturer’s instructions). Image process-
ing took place on the iScan system and the data was extracted
using GenomeStudio, using default analysis settings (including
background correction and normalization based on internal
controls) and v 1.2 of the annotation manifest (http://support.
illumina.com/downloads/humanmethylation450_15017482_v12.
ilmn). Further processing was carried out in R using the LUMI
(http://www.bioconductor.org/) package [35] following the opti-
mized ‘‘lumi: QN+BMIQ’’ pipeline [36] This includes exclusion of
poorly performing probes (p,0.01), color adjustment, quantile
normalization and correction for probe type bias (Infinium I vs II)
using the BMIQ algorithm [37]. All raw and processed data files
are submitted as a GEO SuperSeries and accessible via GSE56454
(http://www.ncbi.nlm.nih.gov/geo/). Differentially methylated
regions were identified using the DMRforPairs algorithm using
the default settings [38]. DMRforPairs is available via Biocon-
ductor: (http://www.bioconductor.org/packages/release/bioc/
html/DMRforPairs.html). Briefly, DMRforPairs defines genomic
regions using local probe density and optionally functional
homogeneity (e.g. all probes in a region should be gene associated).
It quantifies, tests and visualizes (differential) methylation patterns
between unique samples. Differences were calculated as NCCIT
versus TCam-2.
Gene expression profilingApproximately 20 mg of RNA was treated with RNase-free
DNaseI (#2238, Ambion, Ambion Inc., Austin, TX, U.S.A.) for
30 minutes at 37uC and subsequently purified using the RNeasy
mini kit (#74104, Qiagen, Hilden, Germany) according to the
manufacturer’s instructions. Pure RNA was eluted in 50 ml of
water, and quantified using a Nanodrop (Thermo Scientific).
Quality control, RNA labeling, hybridization and data extraction
were performed at ServiceXS B.V. (Leiden, The Netherlands)
according to their in-house protocol. Biotinylated cRNA was
prepared using the Illumina TotalPrep RNA Amplification Kit
(#AMIL1791, Ambion Inc., Austin, TX, USA) according to the
manufacturer’s specifications with an input of 200 ng total RNA.
Per sample, 750 ng of the biotinylated cRNA was hybridized onto
the Illumina HumanHT-12 v4 (Illumina, Inc., San Diego, CA,
U.S.A.) according to the Illumina Manual ‘‘Direct Hybridization
Assay Guide’’. Image processing took place on the iScan system
and the data was extracted using GenomeStudio (default settings).
Further processing was carried out in R using the LUMI package
(http://www.bioconductor.org/) [35]. Following the guidelines
presented in [39], robust spline normalization was applied to the
log2 transformed intensity values. Probes with pdetection.0.05 in
Genome-Wide Epigenetic Footprints of GCC Cell Lines
PLOS ONE | www.plosone.org 2 June 2014 | Volume 9 | Issue 6 | e98330
.50% of the samples were excluded from the analysis (n = 27,964
out of 47,323). Average log2 intensities of biological replicates and
per gene were used to assess expression levels (GEO accession
number GSE56454). Log2 ratios (R) of the average intensities in
the two cell lines (NCCIT/TCam-2) were used to identify
significantly differentially expressed genes. Genes with expression
levels outside the 99% confidence interval (CI) of this log ratio
were identified as differentially expressed between NCCIT and
TCam-2.
Histone modification profiling (H3K27ac, H3K4me3)The ChIP assay was performed according to the low cell
number ChIP protocol from Diagenode (Liege, Belgium), with
minor modifications. In brief, 16106 cells were cross-linked for
eight minutes by addition of formaldehyde to a final concentration
of 1%, followed by neutralization with 1.25 M glycine. The cells
were then lysed, and chromatin was sheared to ,500 bp
fragments using the Covaris sonicator under the following
conditions; duty cycle 20%, peak incident power 200 watts,
cycles/burst 200, time 5 min, temperature 4uC. Protein A-coated
Dynabeads (#10002D, Invitrogen, Thermo Fisher Scientific/Life
Technologies, Carlsbad, CA, USA) were incubated with 7 mg of
the following antibodies: H3K4me3 (Diagenode pAb-003-050) or
H3K27ac (Ab4729, Abcam, Cambridge, UK). The beads were
combined with chromatin from 16106 cells overnight on a
rotating wheel. The immunobeads were washed, and DNA was
purified using the iPure DNA purification kit (AL-100-0100,
Diagenode, Liege, Belgium) according to manufacturer’s instruc-
tions. DNA fragments were sheared a second time using a Covaris
sonicator (duty cycle 10%, peak incidence power 175 watts,
cycles/burst 200, time 5 minutes, temperature 4uC). Massively
parallel sequencing of ChIP DNA (ChIP-Seq) was performed
using the 5500xl SOLiDTM sequencing platform (Applied
Biosystems, Foster City, CA, USA) at the Monash Health
Translation Precinct Medical Genomics Facility. The sequencing
experiments were single-end with 50 nt read length (300 nt
average fragment size). Sequencing reads were aligned to the
complete hg19 human genome (UCSC version, February 2009)
using LifeScopeTM Genomic Analysis Software v2.5 (http://www.
lifetechnologies.com/lifescope). ChIP-Seq experimental samples
were normalized to a total of 107 uniquely mapped sequencing
tags. Data was processed in HOMER ([40], http://homer.salk.
edu/homer/chipseq/) to detect peaks and motif enrichments using
the default settings (except ‘‘fold enrichment over input’’; used 2;
threshold for p-value 0.01) (GEO accession number GSE56454).
Peak heights from HOMER were corrected for background
(lowest peak height detectable). Heights were then summed per
gene (SP) as annotated by HOMER and genes without any
detectable peak were set to 0. The difference in summed peak
heights (DSP =SPTCam-2-SPNCCIT) was used to quantify differ-
ences between the cell lines. Genes with significantly differential
histone modification patterns were identified for both marks
separately (outside 99% CI of DSP). Association of a peak with
TSS was used as annotated by HOMER (1 kb upstream of the
TSS - 100 bp downstream).
MLPA-DNaseI analysisMLPA probes were designed following previously described
criteria [41]. Based on differential modification patterns in NCCIT
and TCam-2 probes were designed for the following loci: NCCIT:
chr3:181425532-181425720, chr5:146699813-146699953, chr3:
181577755-181577830, chr6:15240050-15240160, chr15:93191596-
93191696, chr3:178908801-178908966, chr5:101550991-101551125,
TCam-2: chr11:10613134-10613220, chr1:201278163-201278251,
chr12:3091402-3091483, chr19:13985162-13985322, chr2:38323813-
38323931, chr9:843018-843110, chr5:140762378-140762475.
MLPA-DNaseI was performed as previously described [42], with
minor modifications. In brief, nuclei from 16106 cells were isolated,
and treated with a range of DNaseI concentrations (0; 2 and 5
Units). Digested genomic DNA was purified, and 50–100 ng was
used in an MLPA reaction. Following PCR amplification of ligated
probes, products were separated on an ABI3700 DNA sequencer.
Data was analyzed as previously described, with a reduction to 75%
of peak height in undigested DNA used as a threshold for defining
DNaseI-hypersensitivity [43].
SoftwareAnalyses were performed in R 3.0.1 (Windows 7664) and
2.15.2 (Redhat Linux 664). The networks/enrichment analyses
were performed in IPA (IngenuityH Systems, www.ingenuity.com).
Genomic positions reported in this manuscript are based on the
GRch37/hg19 assembly.
Results
To investigate epigenetic characteristics of SE and EC and their
relationship to gene expression, genome-wide histone modification
and DNA methylation patterns were investigated in the cell lines
TCam-2 (SE) and NCCIT (EC), and matched to gene expression
profiles. The differences between the two cell lines with regard to
histone modification and DNA methylation status were first
investigated separately. Subsequently, the resulting datasets were
integrated to identify (target) genes with a strong relationship
between primed DNA configuration and higher expression levels.
Histone modificationHistone modification patterns were assessed using chromatin
immunoprecipitation combined with high throughput sequencing
(ChIP-seq). Data analysis was performed as described in the
materials and methods section. Alterations in H3K4me3 and
H3K27ac were investigated, which are markers associated with
promoter activation (transcription start site (TSS), H3K4me3 and
H3K27ac) and enhancer activation (primarily H3K27ac) [44,45].
In addition to the analysis of (differential) modification patterns,
motif enrichment of the modified regions was investigated and
compared between the cell lines.
H3K4me3 and H3K27ac do not show differential
enrichment near transcription start sites and their peak
heights correlated within genes. Depending on the cell line,
10.2/11.3% of the H3K27ac enriched loci were located within
1 kb of a TSS against a comparable 14.7/16.8% of the H3K4me3
loci (TCam-2/NCCIT). This is in line with observations in other
cell types showing that, even though H3K4me3 is directly related
to promoter activation, a large majority of the H3K4me3 loci are
located distally of the TSS [46]. H3K27ac has no reported
preferential localization to TSS [47]. The level of summed peaks
per gene (SP, see Methods) was used to compare histone
modification patterns between the two histone marks. There was
significant correlation in both cell lines between the peak levels at
genes where both were present (rTCam-2 = 0.62, pTCam-2,0.001,
nTCam-2 = 1837; rNCCIT = 0.37, pNCCIT,0.001, nNCCIT = 746;
Spearman’s r). This is in line with their overlapping function:
open chromatin configuration is associated with both marks
[19,22] and allowed us to combine the histone modification results
in the subsequent analysis.
H3K4me3 and H3K27ac enrichment patterns in TCam-2
and NCCIT are in accordance with known SE/EC markers
specificity. We previously showed that active chromatin
Genome-Wide Epigenetic Footprints of GCC Cell Lines
PLOS ONE | www.plosone.org 3 June 2014 | Volume 9 | Issue 6 | e98330

modification patterns for SOX17 and SOX2 in the cell lines TCam-
2 and NCCIT match the expected pattern, based on gene and
protein expression and histological constitution (SOX17 active in
TCam-2, SOX2 active in NCCIT) [25]. In line with this, SOX17
and SOX2 were differentially enriched for both H3K4me3 and
H3K27ac in TCam-2 and NCCIT respectively (Figure 1). OCT3/
4 showed no enrichment within the coding sequence, however
there was enrichment of both markers close to the TSS in NCCIT
and TCam-2. This is consistent with known OCT3/4 mRNA and
protein expression in both cell lines [31,48]. NANOG was more
enriched for both markers in TCam-2, in line with differences in
expression level (see below).
On a genome-wide scale, 29,428 H3K4me3 enriched loci were
identified in TCam-2 and 19,015 in NCCIT. 25–41% more
enriched loci were identified for H3K27ac than for H3K4me3
(nTCam-2 = 41,569, nNCCIT = 23,763). Genes with significant dif-
ferences in summed peak height per gene (DSP, see Methods) were
selected for further analysis. For TCam-2, genes showing
differential histone modifications were higher in number for
H3K27ac (nTCam-2 = 433, NNCCIT = 28). For NCCIT, there were
substantially more genes selected for H3K4me3 compared to
H3K27ac (nTCam-2 = 215, NNCCIT = 325). For both marks, 86/11
genes overlapped between top differentiating lists in TCam-2 and
NCCIT respectively. These included the SE marker SOX17 in
TCam-2 and the EC marker SOX2 in NCCIT (Figure S1, Table
S1). Functionally, the gene lists of both cell lines showed significant
enrichment for (embryonic) stem cell maintenance/pluripotency
(Table S2). Enrichment of biological functions in TCam-2
indicated similarity to more mature germ cells, which was lacking
in the list of NCCIT (GO categories TCam-2 included develop-
ment of normal testis morphology and germ cell maintenance).
Moreover, two germ cell-specific canonical pathways IGF1
signaling (logp = 3.42) and germ cell-Sertoli cell Junction Signaling
(logp = 2.11)) showed enrichment. In TCam-2, two functional
networks were identified incorporating the AR pathway and lipid
metabolism (Table S2).
Germ cell markers AP-2a and AP-2c are top enriched
motifs in TCam-2, while embryonic stem cell specific
motifs SOX2/OCT4/TCF/NANOG are enriched in both
cell lines. Significantly enriched motifs were identified for each
cell line and histone mark (HOMER tool, see Methods). There
was strong overlap between the top-ranked enriched motifs in
NCCIT and TCam-2. This was true for both activating markers.
For example, for H3K4me3 the top enriched motif was MAZ for
both TCam-2 and NCCIT, a transcription factor associated with
MYC (binds to two sites in its promoter) and known to be involved
in transcription initiation as well as termination [49] (Figure 2A,B;
Table S3).
A limited number of markers showed differences in enrichment
between the cell lines (Figure 2C,D, Table S3). For H3K4me3,
five motifs were identified which showed sufficient difference. Four
were higher ranked in TCam-2 and one higher in NCCIT. The
top ranked TCam-2 motifs presented in this differentiating list
were EBF1 (role in developmental processes), AP-2a and AP-2c(known germ cell markers) and OCT4/SOX2/TCF/NANOG
(pluripotency motif). For NCCIT, E2F1 (cell cycle control, action
of tumor suppressor proteins, cell proliferation) was ranked higher.
For H3K27ac, there were four differentiating motifs, of which
Figure 1. Display of H3K4me3 and H3K27ac tracks for both NCCIT and TCam-2. (A) SOX17, (B) SOX2, (C) OCT3/4 (POU5F1), (D) NANOG.Arrows indicate direction of transcription. Green boxes indicate markers specific for the histological subtype represented by the cell line. Black boxes= no difference between the cell lines; red boxes = not a marker for that cell type. Note the different ranges on the y-axis for H3K4me3 and H3K27ac.doi:10.1371/journal.pone.0098330.g001
Genome-Wide Epigenetic Footprints of GCC Cell Lines
PLOS ONE | www.plosone.org 4 June 2014 | Volume 9 | Issue 6 | e98330
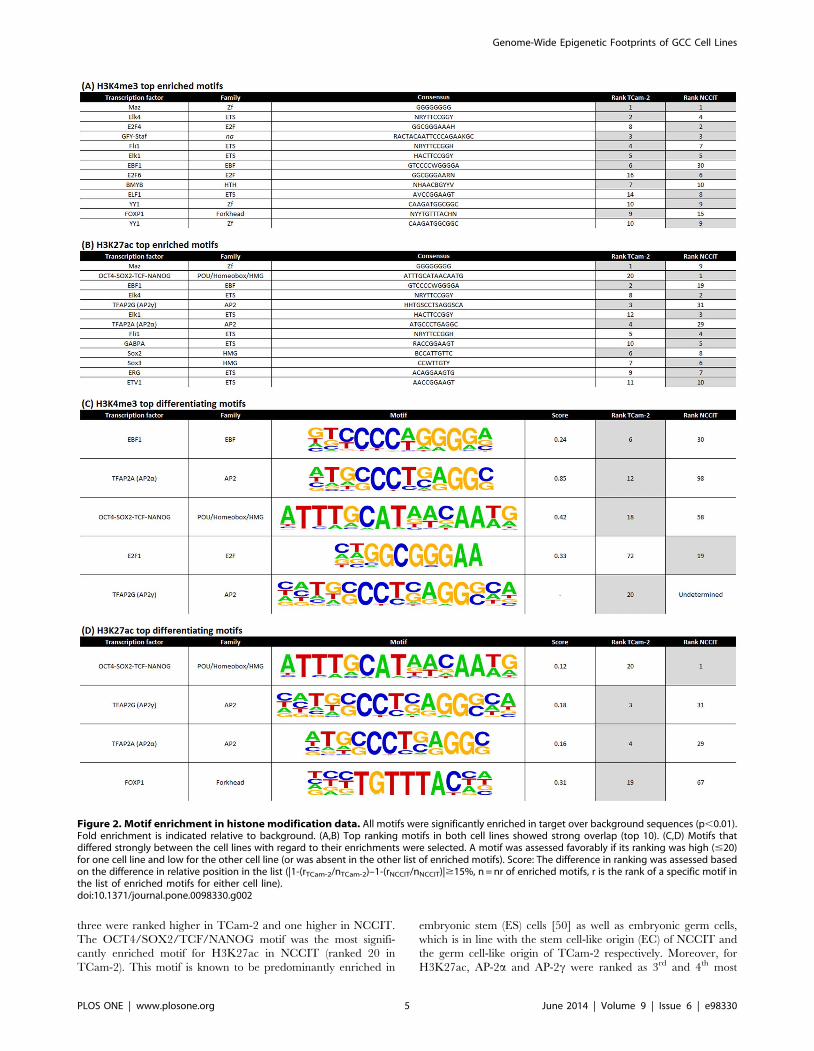
three were ranked higher in TCam-2 and one higher in NCCIT.
The OCT4/SOX2/TCF/NANOG motif was the most signifi-
cantly enriched motif for H3K27ac in NCCIT (ranked 20 in
TCam-2). This motif is known to be predominantly enriched in
embryonic stem (ES) cells [50] as well as embryonic germ cells,
which is in line with the stem cell-like origin (EC) of NCCIT and
the germ cell-like origin of TCam-2 respectively. Moreover, for
H3K27ac, AP-2a and AP-2c were ranked as 3rd and 4th most
Figure 2. Motif enrichment in histone modification data. All motifs were significantly enriched in target over background sequences (p,0.01).Fold enrichment is indicated relative to background. (A,B) Top ranking motifs in both cell lines showed strong overlap (top 10). (C,D) Motifs thatdiffered strongly between the cell lines with regard to their enrichments were selected. A motif was assessed favorably if its ranking was high (#20)for one cell line and low for the other cell line (or was absent in the other list of enriched motifs). Score: The difference in ranking was assessed basedon the difference in relative position in the list (|1-(rTCam-2/nTCam-2)–1-(rNCCIT/nNCCIT)|$15%, n = nr of enriched motifs, r is the rank of a specific motif inthe list of enriched motifs for either cell line).doi:10.1371/journal.pone.0098330.g002
Genome-Wide Epigenetic Footprints of GCC Cell Lines
PLOS ONE | www.plosone.org 5 June 2014 | Volume 9 | Issue 6 | e98330
enriched motif in TCam-2 (compared to 29th and 31st in NCCIT)
reflecting their (embryonic) germ cell origin (Figure 2C,D). For ES
cells the enrichment rankings for these two motifs were 87th and
105th [50]. These observations fit with the proposed more
differentiated (germ cell lineage) cell of origin of SE as compared
to EC [28], and are in line with the findings of related histone
peaks (see Discussion section).
Verification of the H3K4me3 & H3K27ac enrichment-
based open chromatin configuration was independently
confirmed using DNaseI-hypersensitivity. As the investigat-
ed chromatin marks (H3K4me3 & H3K27ac) are considered to be
associated with active chromatin, we explored whether their
presence was associated with another characteristic of active
chromatin: DNaseI-hypersensitivity [51]. Using a DNaseI-MLPA
approach [43] we targeted 14 regions which showed the greatest
differences in either H3K4me3 and/or H3K27ac enrichment
between the same two cell lines. Six of seven enriched regions in
NCCIT (Figure S2A: N1,N2,N3,N4,N6,N7), and five of seven
enriched regions in TCam-2 (Figure S2B: S1,S2,S5,S6,S7),
showed significant DNaseI-hypersensitivity in the respective cell
lines. In contrast, only one H3K27ac-negative locus in NCCIT
(Figure S2A, S1), and no H3K27ac-negative loci in TCam-2
(Figure S2B), showed DNaseI-hypersensitivity.
CpG MethylationThe DMRforPairs algorithm was used to identify differentially
methylated regions (DMR) [38]. The algorithm was set to detect
strong differences, i.e. using stringent settings. Regions containing
a minimum of four probes within 200 bp distance of each other
were considered for further analysis (n = 30,306). Regions in which
median methylation levels (M-values) between the samples differed
at least |1.4| (n = 5,139) were tested for statistical significance
(significant: p,0.05; Bonferroni adjusted, Wilcoxon-rank-sum test,
n = 143) (Output DMRforPairs: File S1).
Methylation patterns at DMRs are in line with marker
positivity in SE and EC. Because of the activating histone
modifications investigated, we focused on hypo- or absence of
DNA methylation. Global methylation levels were in line with the
hyper- and hypomethylated global status of NS and SE
respectively, and the previously shown intermediate status of
TCam-2 (Figure S3) [52,53]. After DMR identification using
DMRforPairs, a total of 99 DMRs (annotating to 170 unique gene
symbols) were hypomethylated in TCam-2, compared to 44 in
NCCIT (annotating to 64 unique gene symbols) (Table S1). In line
with the histone modifications (see above), the SOX2 promoter
region was found to be strongly hypomethylated in NCCIT
(Figure 3A). SOX2 was partly methylated in TCam-2, in line with
findings illustrating that TCam-2 can differentiate and become
SOX2 positive after extra-gonadal injection in mice [54]. A 220 bp
region directly upstream of the TSS of SOX2 (chr3:181429712) has
previously been shown to be completely hypomethylated in
TCam-2 [55]. This is in line with our findings as a consistently
hypomethylated region (chr3:181429233-181430485) is shown
directly upstream of the TSS while a 652 bp long DMR
(chr3:181428046-181428697) between NCCIT and TCam-2 is
detected by DMRforPairs in a region ca. 800 bp upstream of the
region sequenced by Nettersheim et al. SOX17 did not show a
significant differential methylation pattern, indicating that it is, in
principle, accessible for transcription in both cell types (Figure 3B).
Indeed, SOX17 expression can be induced in NCCIT (unpublished
observation). In line with known gene expression in both cell lines,
OCT3/4 showed an inconsistent, but non-differential methylation
pattern (Figure 3C). The TSS of NANOG was hypomethylated in
both cell lines (Figure 3D), in line with the expression data and
previous reports [56]. In the list of top DMRs, the miR-371/2/3
cluster stood out by significant differential hypermethylation in
NCCIT (Figure 3E). The promoter region of GATA4 was
significantly hypermethylated in TCam-2 (Figure 3F). In general,
33% (47/143) DMRs were annotated to TSSs (File S1, according
to Illumina’s manifest) which is similar to the fraction of TSS
associated regions identified by DMRforPairs (12,652/30,306).
Functionally, the DMR list of both cell lines showed enrichment
for (embryonic) stem cell maintenance/pluripotency. Biological
functions indicating similarity to more mature germ cells were
enriched in TCam-2 (Table S2).
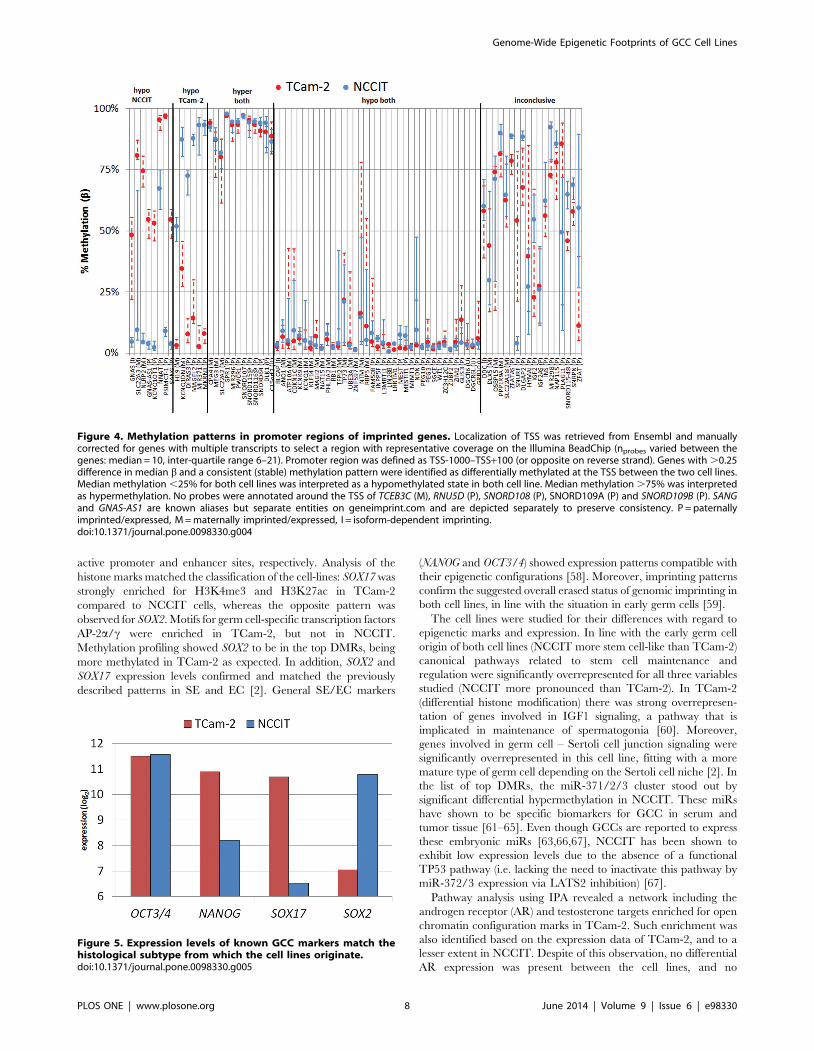
DMRs were significantly enriched for imprinted genes,
and 59% (51/86) of all imprinted genes showed loss of
methylation around their TSS in one or both cell
lines. From the list of verified imprinted human genes (n = 88
retrieved from geneimprint.com), 82 were also annotated in
Illumina’s manifest (total of 21,243 unique gene symbols
annotated) and 10 were present in the top DMRs between
TCam-2 and NCCIT. This overrepresentation of imprinted genes
in the list of DMRs was significant (p,0.0001, x2 test). When
investigating the region surrounding the TSS of the 86 imprinted
genes with known genomic localization, 14 showed a differential
status between the cell lines (8/6 hypomethylated in NCCIT and
TCam-2 respectively). In total, 37 imprinted genes displayed a
hypomethylated status in both cell lines, compared with 12
hypermethylated genes (Figure 4). In summary, these results
indicate an overall erased status of the imprinted regions in both
cell lines. Regarding genes with a differential methylation status,
there is no clear difference in number of hypermethylated genes
that would indicate a difference in maturation status or
environmental disruption.
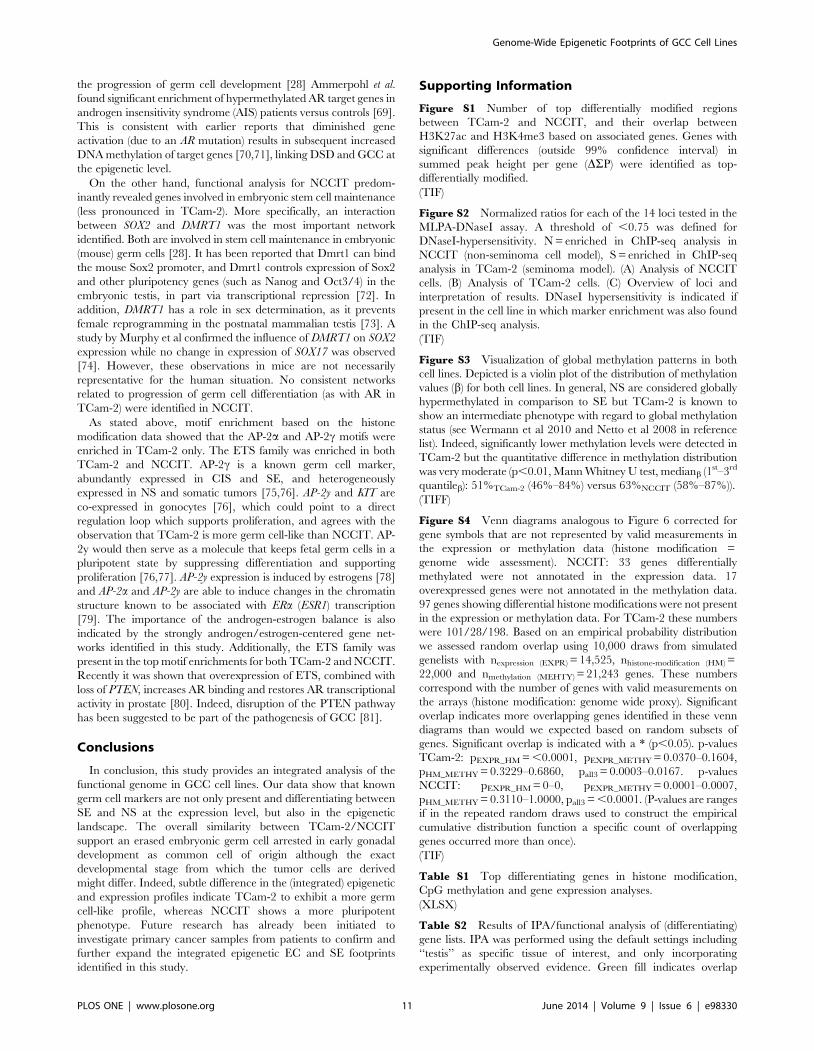
ExpressionExpression levels of markers matched histological origin
of both cell lines. In total, 257 genes were expressed higher in
TCam-2, compared to 149 in NCCIT (Table S1). Greater than
3.65 fold difference in expression level (99% confidence interval
(CI) of log2-ratio of intensities) was considered significant. The
expression levels were in agreement with the classification of the
cell lines: SOX17 was higher in TCam-2 compared with NCCIT,
with the opposite observed for SOX2 [57] (Figure 5). OCT3/4, a
general marker for the stem cell components (SE/EC) of GCC,
was expressed at equal levels in both cell lines. NANOG was
expressed higher in TCam-2, which is in line with the open histone
configuration (Figure 1D, transcription possible in both cell lines).
Functionally, the gene lists of both cell lines showed enrichment for
(embryonic) stem cell maintenance/pluripotency, and Wnt/b-
catenin signaling. Enrichment of biological functions consistent
with more mature germ cells was present in TCam-2, and absent
in NCCIT. In addition, network analysis revealed the androgen
pathway in TCam-2, represented by both the AR and testoster-
one, thus showing major overlap between the networks found by
genes that had differential histone modification patterns (Table
S2).
Integration of epigenetic and expression dataDifferential gene lists from histone modification,
methylation and expression data showed limited
overlap. Differentiating gene lists from the separate analyses
discussed above were matched based on Gene Symbol to assess the
relationship between active histone modifications, the absence of
CpG methylation and gene expression. Overlap between gene
expression and one of the epigenetic regulatory mechanisms is of
interest as expression of a specific gene does not need to be
Genome-Wide Epigenetic Footprints of GCC Cell Lines
PLOS ONE | www.plosone.org 6 June 2014 | Volume 9 | Issue 6 | e98330

regulated by both mechanisms. Figure 6 shows the overlap of the
different variables for the differentiating gene lists between TCam-
2 and NCCIT. In general, little overlap between relative
hypomethylation/histone marker enrichment and relatively high
expression is observed, but this overlap was significant (Figure S4).
In TCam-2, one gene, PRAME, was present in all three differential
lists. H19 and CHCHD5 were differentially hypomethylated in
TCam-2 and showed high expression compared to NCCIT, but
no differential enrichment for H3K27ac or H3K4me3. There
were 62 genes with overlapping active chromatin marks and
expression, including SOX17 and NANOG. In NCCIT, three genes
showed overlap between the histone marks, hypomethylation and
expression. Significantly, one of these genes was SOX2. An
additional 18 genes showed overlap between active chromatin
marks and expression.
Enrichment of both histone marks in general and absence
of DNA methylation around the TSS is related to higher
expression levels. Higher expression levels are present when
genes are more enriched for either histone mark. Quantification of
the fraction of genes with higher than median expression at
various intervals of summed peak heights confirmed the general
trend towards higher expression at higher levels of enrichment
(Figure 7A). DNA methylation levels were only correlated to
expression around the TSS: a fully methylated TSS is predom-
inantly associated with low gene expression levels while low
methylation status is not predictive of expression level (Figure 7B).
NCCIT and TCam-2 show a largely overlapping
epigenetically open network with specific elements that
are differentially regulated based on cell type. Histone
modification, methylation and gene expression data were analyzed
together using hierarchical clustering. This unsupervised clustering
procedure revealed specific groups of genes with a profile poised
for transcription. These gene clusters showed active histone marks,
combined with an activating methylation landscape and are
hypothesized to contain genes accessible for transcription (e.g.
epigenetically ON = transcription possible, Figure 8). Functionally,
the ON network for both cell lines showed a large degree of
overlap (related to the androgen pathway, lipid metabolism and
pluripotency) (Table S2). There was considerable overlap between
the genes found in this separate analysis and the differential gene
lists (Figure 6, overlap indicated by gene symbols in Figure 8).
Discussion
Histone and DNA methylation signatures were studied to
explore the epigenetic differences between representative cell lines
for the GCC histological subtypes and their relation to expression.
TCam-2 and NCCIT cells were used as representatives of SE and
EC respectively. Our study includes the generation, integration
and interpretation of genome-wide profiles for histone marks
(H3K4me3 and H3K27ac), DNA methylation and gene expres-
sion. H3K4me3 and H3K27ac are well-characterized markers for
Figure 3. Methylation patterns of known germ cell markers (A–D) and significant DMRs for both cell lines (E, F). Dots depict individualCpGs and black boxes denote DMRs identified by DMRforPairs. Percentages below indicate average CG density in the plotted regions (calculatedusing the Repitools R package, gcContentCalc function (http://www.bioconductor.org/)). (A) SOX2 [44%], (B) SOX17 [46%], (C) OCT3/4 (POU5F1), [52%](D) NANOG, [44%] (E) miR-371/2/3 cluster, [49%] (F) GATA4 [53%].doi:10.1371/journal.pone.0098330.g003
Genome-Wide Epigenetic Footprints of GCC Cell Lines
PLOS ONE | www.plosone.org 7 June 2014 | Volume 9 | Issue 6 | e98330
active promoter and enhancer sites, respectively. Analysis of the
histone marks matched the classification of the cell-lines: SOX17 was
strongly enriched for H3K4me3 and H3K27ac in TCam-2
compared to NCCIT cells, whereas the opposite pattern was
observed for SOX2. Motifs for germ cell-specific transcription factors
AP-2a/c were enriched in TCam-2, but not in NCCIT.
Methylation profiling showed SOX2 to be in the top DMRs, being
more methylated in TCam-2 as expected. In addition, SOX2 and
SOX17 expression levels confirmed and matched the previously
described patterns in SE and EC [2]. General SE/EC markers
(NANOG and OCT3/4) showed expression patterns compatible with
their epigenetic configurations [58]. Moreover, imprinting patterns
confirm the suggested overall erased status of genomic imprinting in
both cell lines, in line with the situation in early germ cells [59].
The cell lines were studied for their differences with regard to
epigenetic marks and expression. In line with the early germ cell
origin of both cell lines (NCCIT more stem cell-like than TCam-2)
canonical pathways related to stem cell maintenance and
regulation were significantly overrepresented for all three variables
studied (NCCIT more pronounced than TCam-2). In TCam-2
(differential histone modification) there was strong overrepresen-
tation of genes involved in IGF1 signaling, a pathway that is
implicated in maintenance of spermatogonia [60]. Moreover,
genes involved in germ cell – Sertoli cell junction signaling were
significantly overrepresented in this cell line, fitting with a more
mature type of germ cell depending on the Sertoli cell niche [2]. In
the list of top DMRs, the miR-371/2/3 cluster stood out by
significant differential hypermethylation in NCCIT. These miRs
have shown to be specific biomarkers for GCC in serum and
tumor tissue [61–65]. Even though GCCs are reported to express
these embryonic miRs [63,66,67], NCCIT has been shown to
exhibit low expression levels due to the absence of a functional
TP53 pathway (i.e. lacking the need to inactivate this pathway by
miR-372/3 expression via LATS2 inhibition) [67].
Pathway analysis using IPA revealed a network including the
androgen receptor (AR) and testosterone targets enriched for open
chromatin configuration marks in TCam-2. Such enrichment was
also identified based on the expression data of TCam-2, and to a
lesser extent in NCCIT. Despite of this observation, no differential
AR expression was present between the cell lines, and no
Figure 4. Methylation patterns in promoter regions of imprinted genes. Localization of TSS was retrieved from Ensembl and manuallycorrected for genes with multiple transcripts to select a region with representative coverage on the Illumina BeadChip (nprobes varied between thegenes: median = 10, inter-quartile range 6–21). Promoter region was defined as TSS-1000–TSS+100 (or opposite on reverse strand). Genes with .0.25difference in median b and a consistent (stable) methylation pattern were identified as differentially methylated at the TSS between the two cell lines.Median methylation ,25% for both cell lines was interpreted as a hypomethylated state in both cell line. Median methylation .75% was interpretedas hypermethylation. No probes were annotated around the TSS of TCEB3C (M), RNU5D (P), SNORD108 (P), SNORD109A (P) and SNORD109B (P). SANGand GNAS-AS1 are known aliases but separate entities on geneimprint.com and are depicted separately to preserve consistency. P = paternallyimprinted/expressed, M = maternally imprinted/expressed, I = isoform-dependent imprinting.doi:10.1371/journal.pone.0098330.g004
Figure 5. Expression levels of known GCC markers match thehistological subtype from which the cell lines originate.doi:10.1371/journal.pone.0098330.g005
Genome-Wide Epigenetic Footprints of GCC Cell Lines
PLOS ONE | www.plosone.org 8 June 2014 | Volume 9 | Issue 6 | e98330

enrichment of DMRs in AR targets was identified. Future
experiments are needed to validate the differential role of the
AR pathway between NCCIT and TCam-2 and their in vivo
counterparts. A second network was closely related, focused on
lipid metabolism (LEP central, late germ cell differentiation and
survival [68]). Androgens are well-known environmental and
physiological factors that influence epigenetic marks and phenotypes.
They are related to GCC risk and are considered to be crucial for
Figure 6. Overlap between top differentiating genes (methylation/histone modification/gene expression). (Hypo) methylation, (high)gene expression and histone marker (enrichment) should be interpreted relative to the other cell line. Criteria for selection are described in the maintext. Briefly, significant differential methylation of regions with sufficient probe density was identified by DMRforPairs (frequently, but not necessarilyclose to, the TSS). The difference in histone modification enrichment was assessed by significant differences in summed peak heights between thecell lines. Finally, a fold difference of 3.65 (boundary of 99% CI) was used as cutoff for differential gene expression. Gene lists are presented in TableS1, and overlap was determined based on matching gene symbol.doi:10.1371/journal.pone.0098330.g006
Figure 7. Relation between histone modification level (summed peak heights per gene) and expression level. Top and bottom rightimages depict the percentage of highly (.p50) expressed genes calculated for an interval of summed peaks. For example, 5% of genes with alog2(summed peak height) of <5.5–7.5 were highly expressed. (B) Relation between CpG methylation (TSS/no TSS) and gene expression.doi:10.1371/journal.pone.0098330.g007
Genome-Wide Epigenetic Footprints of GCC Cell Lines
PLOS ONE | www.plosone.org 9 June 2014 | Volume 9 | Issue 6 | e98330

Figure 8. Heat map of epigenetic markers and gene expression profiles. Genes with quantified methylation status around their TSS (basedon Illumina annotation) and valid (see Materials & Methods) measurement of their expression level were included (n = 11,620). Log-2 summed peakheights per gene were used as an estimate of histone marker enrichment. Variables scaled between 0 and 1. Hierarchical clustering was performedusing complete linkage. Clusters of interest were identified based on a consistent enriched state for one or more of the active histone markers and ahypomethylated state around the TSS. Number of genes in the displayed right panel (zoomed in heat maps, topRbottom): 899/892 (TCam-2) and1,224/37/308 (NCCIT). Gene expression was allowed to vary within clusters, but clusters with almost absent expression levels (completely red) werenot selected. Gene symbols indicate genes that overlap with the analysis of top differentiating genes between the cell lines (Figure 6). Gene symbolsare listed alphabetically. An indication of the level for each gene in each column is presented by the color/shade and a blue line (for each column:left = 0, right = 1).doi:10.1371/journal.pone.0098330.g008
Genome-Wide Epigenetic Footprints of GCC Cell Lines
PLOS ONE | www.plosone.org 10 June 2014 | Volume 9 | Issue 6 | e98330
the progression of germ cell development [28] Ammerpohl et al.
found significant enrichment of hypermethylated AR target genes in
androgen insensitivity syndrome (AIS) patients versus controls [69].
This is consistent with earlier reports that diminished gene
activation (due to an AR mutation) results in subsequent increased
DNA methylation of target genes [70,71], linking DSD and GCC at
the epigenetic level.
On the other hand, functional analysis for NCCIT predom-
inantly revealed genes involved in embryonic stem cell maintenance
(less pronounced in TCam-2). More specifically, an interaction
between SOX2 and DMRT1 was the most important network
identified. Both are involved in stem cell maintenance in embryonic
(mouse) germ cells [28]. It has been reported that Dmrt1 can bind
the mouse Sox2 promoter, and Dmrt1 controls expression of Sox2
and other pluripotency genes (such as Nanog and Oct3/4) in the
embryonic testis, in part via transcriptional repression [72]. In
addition, DMRT1 has a role in sex determination, as it prevents
female reprogramming in the postnatal mammalian testis [73]. A
study by Murphy et al confirmed the influence of DMRT1 on SOX2
expression while no change in expression of SOX17 was observed
[74]. However, these observations in mice are not necessarily
representative for the human situation. No consistent networks
related to progression of germ cell differentiation (as with AR in
TCam-2) were identified in NCCIT.
As stated above, motif enrichment based on the histone
modification data showed that the AP-2a and AP-2c motifs were
enriched in TCam-2 only. The ETS family was enriched in both
TCam-2 and NCCIT. AP-2c is a known germ cell marker,
abundantly expressed in CIS and SE, and heterogeneously
expressed in NS and somatic tumors [75,76]. AP-2y and KIT are
co-expressed in gonocytes [76], which could point to a direct
regulation loop which supports proliferation, and agrees with the
observation that TCam-2 is more germ cell-like than NCCIT. AP-
2y would then serve as a molecule that keeps fetal germ cells in a
pluripotent state by suppressing differentiation and supporting
proliferation [76,77]. AP-2y expression is induced by estrogens [78]
and AP-2a and AP-2y are able to induce changes in the chromatin
structure known to be associated with ERa (ESR1) transcription
[79]. The importance of the androgen-estrogen balance is also
indicated by the strongly androgen/estrogen-centered gene net-
works identified in this study. Additionally, the ETS family was
present in the top motif enrichments for both TCam-2 and NCCIT.
Recently it was shown that overexpression of ETS, combined with
loss of PTEN, increases AR binding and restores AR transcriptional
activity in prostate [80]. Indeed, disruption of the PTEN pathway
has been suggested to be part of the pathogenesis of GCC [81].
Conclusions
In conclusion, this study provides an integrated analysis of the
functional genome in GCC cell lines. Our data show that known
germ cell markers are not only present and differentiating between
SE and NS at the expression level, but also in the epigenetic
landscape. The overall similarity between TCam-2/NCCIT
support an erased embryonic germ cell arrested in early gonadal
development as common cell of origin although the exact
developmental stage from which the tumor cells are derived
might differ. Indeed, subtle difference in the (integrated) epigenetic
and expression profiles indicate TCam-2 to exhibit a more germ
cell-like profile, whereas NCCIT shows a more pluripotent
phenotype. Future research has already been initiated to
investigate primary cancer samples from patients to confirm and
further expand the integrated epigenetic EC and SE footprints
identified in this study.
Supporting Information
Figure S1 Number of top differentially modified regions
between TCam-2 and NCCIT, and their overlap between
H3K27ac and H3K4me3 based on associated genes. Genes with
significant differences (outside 99% confidence interval) in
summed peak height per gene (DSP) were identified as top-
differentially modified.
(TIF)
Figure S2 Normalized ratios for each of the 14 loci tested in the
MLPA-DNaseI assay. A threshold of ,0.75 was defined for
DNaseI-hypersensitivity. N = enriched in ChIP-seq analysis in
NCCIT (non-seminoma cell model), S = enriched in ChIP-seq
analysis in TCam-2 (seminoma model). (A) Analysis of NCCIT
cells. (B) Analysis of TCam-2 cells. (C) Overview of loci and
interpretation of results. DNaseI hypersensitivity is indicated if
present in the cell line in which marker enrichment was also found
in the ChIP-seq analysis.
(TIF)
Figure S3 Visualization of global methylation patterns in both
cell lines. Depicted is a violin plot of the distribution of methylation
values (b) for both cell lines. In general, NS are considered globally
hypermethylated in comparison to SE but TCam-2 is known to
show an intermediate phenotype with regard to global methylation
status (see Wermann et al 2010 and Netto et al 2008 in reference
list). Indeed, significantly lower methylation levels were detected in
TCam-2 but the quantitative difference in methylation distribution
was very moderate (p,0.01, Mann Whitney U test, medianb (1st–3rd
quantileb): 51%TCam-2 (46%–84%) versus 63%NCCIT (58%–87%)).
(TIFF)
Figure S4 Venn diagrams analogous to Figure 6 corrected for
gene symbols that are not represented by valid measurements in
the expression or methylation data (histone modification =
genome wide assessment). NCCIT: 33 genes differentially
methylated were not annotated in the expression data. 17
overexpressed genes were not annotated in the methylation data.
97 genes showing differential histone modifications were not present
in the expression or methylation data. For TCam-2 these numbers
were 101/28/198. Based on an empirical probability distribution
we assessed random overlap using 10,000 draws from simulated
genelists with nexpression (EXPR) = 14,525, nhistone-modification (HM) =
22,000 and nmethylation (MEHTY) = 21,243 genes. These numbers
correspond with the number of genes with valid measurements on
the arrays (histone modification: genome wide proxy). Significant
overlap indicates more overlapping genes identified in these venn
diagrams than would we expected based on random subsets of
genes. Significant overlap is indicated with a * (p,0.05). p-values
TCam-2: pEXPR_HM = ,0.0001, pEXPR_METHY = 0.0370–0.1604,
pHM_METHY = 0.3229–0.6860, pall3 = 0.0003–0.0167. p-values
NCCIT: pEXPR_HM = 0–0, pEXPR_METHY = 0.0001–0.0007,
pHM_METHY = 0.3110–1.0000, pall3 = ,0.0001. (P-values are ranges
if in the repeated random draws used to construct the empirical
cumulative distribution function a specific count of overlapping
genes occurred more than once).
(TIF)
Table S1 Top differentiating genes in histone modification,
CpG methylation and gene expression analyses.
(XLSX)
Table S2 Results of IPA/functional analysis of (differentiating)
gene lists. IPA was performed using the default settings including
‘‘testis’’ as specific tissue of interest, and only incorporating
experimentally observed evidence. Green fill indicates overlap
Genome-Wide Epigenetic Footprints of GCC Cell Lines
PLOS ONE | www.plosone.org 11 June 2014 | Volume 9 | Issue 6 | e98330
between TCam-2 and NCCIT. Reported log(p) values are the
result of IPA’s internal enrichment tests.
(XLSX)
Table S3 Detailed results of motif enrichment analysis (HO-
MER) per cell line and per histone mark.
(PDF)
File S1 ZIP file containing DMRforPairs output for significant
regions. Please start from the html files.
(ZIP)
Acknowledgments
The authors thank the Department of Bioinformatics, Erasmus MC,
Rotterdam, for their support. They especially thank Ms Sylvia de Does and
Mr Ivo Palli.
Author Contributions
Conceived and designed the experiments: YZ MR FR AN SB NW AG LD
SW LL. Performed the experiments: YZ AG LD NW SB. Analyzed the
data: FR MR YZ LD. Contributed reagents/materials/analysis tools: AN.
Contributed to the writing of the manuscript: YZ MR LD SW LL.
References
1. Looijenga LH (2009) Human testicular (non)seminomatous germ cell tumours:the clinical implications of recent pathobiological insights. J Pathol 218: 146–
162.
2. Oosterhuis JW, Looijenga LH (2005) Testicular germ-cell tumours in a broaderperspective. Nat Rev Cancer 5: 210–222.
3. Woodward PJ, Heidenreich A, Looijenga LHJ, Oosterhuis JW, McLeod DG, etal. (2004) Testicular germ cell tumors. In: Eble JN, Sauter G, Epstein JI,
Sesterhann IA, editors. World Health Organization Classification of Tumours
Pathology and Genetics of the Urinary System and Male Genital Organs. Lyon:IARC Press. pp. 217–278.
4. Looijenga LH, Gillis AJ, Stoop H, Biermann K, Oosterhuis JW (2011)Dissecting the molecular pathways of (testicular) germ cell tumour pathogenesis;
from initiation to treatment-resistance. Int J Androl 34: e234–251.
5. Banks K, Tuazon E, Berhane K, Koh CJ, De Filippo RE, et al. (2012)Cryptorchidism and testicular germ cell tumors: comprehensive meta-analysis
reveals that association between these conditions diminished over time and ismodified by clinical characteristics. Front Endocrinol (Lausanne) 3: 182.
6. Dieckmann KP, Pichlmeier U (2004) Clinical epidemiology of testicular germ
cell tumors. World J Urol 22: 2–14.
7. Elzinga-Tinke JE, Sirre ME, Looijenga LH, van Casteren N, Wildhagen MF, et
al. (2010) The predictive value of testicular ultrasound abnormalities forcarcinoma in situ of the testis in men at risk for testicular cancer. Int J Androl 33:
597–603.
8. Horwich A, Shipley J, Huddart R (2006) Testicular germ-cell cancer. Lancet367: 754–765.
9. Czene K, Lichtenstein P, Hemminki K (2002) Environmental and heritablecauses of cancer among 9.6 million individuals in the Swedish Family-Cancer
Database. Int J Cancer 99: 260–266.
10. Del-Mazo J, Brieno-Enriquez MA, Garcia-Lopez J, Lopez-Fernandez LA, De-Felici M (2013) Endocrine disruptors, gene deregulation and male germ cell
tumors. Int J Dev Biol 57: 225–239.
11. Godmann M, Lambrot R, Kimmins S (2009) The dynamic epigenetic program
in male germ cells: Its role in spermatogenesis, testis cancer, and its response to
the environment. Microsc Res Tech 72: 603–619.
12. Kanetsky PA, Mitra N, Vardhanabhuti S, Li M, Vaughn DJ, et al. (2009)
Common variation in KITLG and at 5q31.3 predisposes to testicular germ cellcancer. Nat Genet 41: 811–815.
13. Kanetsky PA, Mitra N, Vardhanabhuti S, Vaughn DJ, Li M, et al. (2011) A
second independent locus within DMRT1 is associated with testicular germ celltumor susceptibility. Hum Mol Genet 20: 3109–3117.
14. Rapley EA, Turnbull C, Al Olama AA, Dermitzakis ET, Linger R, et al. (2009)A genome-wide association study of testicular germ cell tumor. Nat Genet 41:
807–810.
15. Turnbull C, Rapley EA, Seal S, Pernet D, Renwick A, et al. (2010) Variants nearDMRT1, TERT and ATF7IP are associated with testicular germ cell cancer.
Nat Genet 42: 604–607.
16. Kratz CP, Mai PL, Greene MH (2010) Familial testicular germ cell tumours.
Best Pract Res Clin Endocrinol Metab 24: 503–513.
17. Bignell G, Smith R, Hunter C, Stephens P, Davies H, et al. (2006) Sequenceanalysis of the protein kinase gene family in human testicular germ-cell tumors of
adolescents and adults. Genes Chromosomes Cancer 45: 42–46.
18. Cools M, Drop SL, Wolffenbuttel KP, Oosterhuis JW, Looijenga LH (2006)
Germ cell tumors in the intersex gonad: old paths, new directions, moving
frontiers. Endocr Rev 27: 468–484.
19. Hawkins RD, Hon GC, Yang C, Antosiewicz-Bourget JE, Lee LK, et al. (2011)
Dynamic chromatin states in human ES cells reveal potential regulatorysequences and genes involved in pluripotency. Cell Res 21: 1393–1409.
20. De Carvalho DD, Sharma S, You JS, Su SF, Taberlay PC, et al. (2012) DNA
methylation screening identifies driver epigenetic events of cancer cell survival.Cancer Cell 21: 655–667.
21. Esteller M (2008) Epigenetics in cancer. N Engl J Med 358: 1148–1159.
22. Hawkins RD, Hon GC, Lee LK, Ngo Q, Lister R, et al. (2010) Distinct
epigenomic landscapes of pluripotent and lineage-committed human cells. Cell
Stem Cell 6: 479–491.
23. Jones PA, Baylin SB (2007) The epigenomics of cancer. Cell 128: 683–692.
24. Suva ML, Riggi N, Bernstein BE (2013) Epigenetic reprogramming in cancer.Science 339: 1567–1570.
25. Van Der Zwan YG, Stoop H, Rossello F, White SJ, Looijenga LH (2013) Role ofepigenetics in the etiology of germ cell cancer. Int J Dev Biol 57: 299–308.
26. Seisenberger S, Peat JR, Reik W (2013) Conceptual links between DNA
methylation reprogramming in the early embryo and primordial germ cells.Curr Opin Cell Biol 25: 281–288.
27. Amatruda JF, Ross JA, Christensen B, Fustino NJ, Chen KS, et al. (2013) DNAmethylation analysis reveals distinct methylation signatures in pediatric germ cell
tumors. BMC Cancer 13: 313.
28. Looijenga LH, Van Agthoven T, Biermann K (2013) Development of malignantgerm cells - the genvironmental hypothesis. Int J Dev Biol 57: 241–253.
29. Mirbahai L, Chipman JK (2014) Epigenetic memory of environmentalorganisms: A reflection of lifetime stressor exposures. Mutat Res 764–765: 10–
17.
30. Skinner MK, Haque CG, Nilsson E, Bhandari R, McCarrey JR (2013)Environmentally induced transgenerational epigenetic reprogramming of
primordial germ cells and the subsequent germ line. PLoS One 8: e66318.
31. de Jong J, Stoop H, Gillis AJ, Hersmus R, van Gurp RJ, et al. (2008) Further
characterization of the first seminoma cell line TCam-2. Genes Chromosomes
Cancer 47: 185–196.
32. Mizuno Y, Gotoh A, Kamidono S, Kitazawa S (1993) [Establishment and
characterization of a new human testicular germ cell tumor cell line (TCam-2)].Nihon Hinyokika Gakkai Zasshi 84: 1211–1218.
33. Teshima S, Shimosato Y, Hirohashi S, Tome Y, Hayashi I, et al. (1988) Four
new human germ cell tumor cell lines. Lab Invest 59: 328–336.
34. Eckert D, Nettersheim D, Heukamp LC, Kitazawa S, Biermann K, et al. (2008)
TCam-2 but not JKT-1 cells resemble seminoma in cell culture. Cell Tissue Res331: 529–538.
35. Du P, Kibbe WA, Lin SM (2008) lumi: a pipeline for processing Illumina
microarray. Bioinformatics 24: 1547–1548.
36. Marabita F, Almgren M, Lindholm ME, Ruhrmann S, Fagerstrom-Billai F, et
al. (2013) An evaluation of analysis pipelines for DNA methylation profilingusing the Illumina HumanMethylation450 BeadChip platform. Epigenetics 8:
333–346.
37. Teschendorff AE, Marabita F, Lechner M, Bartlett T, Tegner J, et al. (2013) Abeta-mixture quantile normalization method for correcting probe design bias in
Illumina Infinium 450 k DNA methylation data. Bioinformatics 29: 189–196.
38. Rijlaarsdam MA, Zwan YG vd, Dorssers LC, Looijenga LH (2014)
DMRforPairs: identifying Differentially Methylated Regions between unique
samples using array based methylation profiles. BMC Bioinformatics: in press.
39. Schmid R, Baum P, Ittrich C, Fundel-Clemens K, Huber W, et al. (2010)
Comparison of normalization methods for Illumina BeadChip HumanHT-12v3. BMC Genomics 11: 349.
40. Heinz S, Benner C, Spann N, Bertolino E, Lin YC, et al. (2010) Simple
combinations of lineage-determining transcription factors prime cis-regulatoryelements required for macrophage and B cell identities. Mol Cell 38: 576–589.
41. White SJ, Breuning MH, den Dunnen JT (2004) Detecting copy numberchanges in genomic DNA: MAPH and MLPA. Methods Cell Biol 75: 751–768.
42. Ohnesorg T, Eggers S, Leonhard W, Sinclair A, White S (2009) Rapid high-
throughput analysis of DNaseI hypersensitive sites using a modified MultiplexLigation-dependent Probe Amplification approach. BMC Genomics 10: 412.
43. Ohnesorg T, Eggers S, White SJ (2012) Detecting DNaseI-hypersensitivity siteswith MLPA. Methods Mol Biol 786: 201–210.
44. Rada-Iglesias A, Bajpai R, Swigut T, Brugmann SA, Flynn RA, et al. (2011) A
unique chromatin signature uncovers early developmental enhancers in humans.Nature 470: 279–283.
45. Clouaire T, Webb S, Skene P, Illingworth R, Kerr A, et al. (2012) Cfp1integrates both CpG content and gene activity for accurate H3K4me3
deposition in embryonic stem cells. Genes Dev 26: 1714–1728.
46. Guenther MG, Levine SS, Boyer LA, Jaenisch R, Young RA (2007) AChromatin Landmark and Transcription Initiation at Most Promoters in
Human Cells. Cell 130: 77–88.
47. Rada-Iglesias A, Wysocka J (2011) Epigenomics of human embryonic stem cellsand induced pluripotent stem cells: insights into pluripotency and implications
for disease. Genome Med 3: 36.
48. de Jong J, Stoop H, Dohle GR, Bangma CH, Kliffen M, et al. (2005) Diagnostic
value of OCT3/4 for pre-invasive and invasive testicular germ cell tumours.J Pathol 206: 242–249.
Genome-Wide Epigenetic Footprints of GCC Cell Lines
PLOS ONE | www.plosone.org 12 June 2014 | Volume 9 | Issue 6 | e98330
49. Bossone SA, Asselin C, Patel AJ, Marcu KB (1992) MAZ, a zinc finger protein,
binds to c-MYC and C2 gene sequences regulating transcriptional initiation andtermination. Proc Natl Acad Sci U S A 89: 7452–7456.
50. Bernstein BE, Birney E, Dunham I, Green ED, Gunter C, et al. (2012) An
integrated encyclopedia of DNA elements in the human genome. Nature 489:57–74.
51. Shu W, Chen H, Bo X, Wang S (2011) Genome-wide analysis of therelationships between DNaseI HS, histone modifications and gene expression
reveals distinct modes of chromatin domains. Nucleic Acids Res 39: 7428–7443.
52. Wermann H, Stoop H, Gillis AJ, Honecker F, van Gurp RJ, et al. (2010) GlobalDNA methylation in fetal human germ cells and germ cell tumours: association
with differentiation and cisplatin resistance. J Pathol 221: 433–442.53. Netto GJ, Nakai Y, Nakayama M, Jadallah S, Toubaji A, et al. (2008) Global
DNA hypomethylation in intratubular germ cell neoplasia and seminoma, butnot in nonseminomatous male germ cell tumors. Mod Pathol 21: 1337–1344.
54. Nettersheim D, Westernstroer B, Haas N, Leinhaas A, Brustle O, et al. (2012)
Establishment of a versatile seminoma model indicates cellular plasticity of germcell tumor cells. Genes Chromosomes Cancer 51: 717–726.
55. Nettersheim D, Gillis A, Biermann K, Looijenga LH, Schorle H (2011) Theseminoma cell line TCam-2 is sensitive to HDAC inhibitor depsipeptide but
tolerates various other chemotherapeutic drugs and loss of NANOG expression.
Genes Chromosomes Cancer 50: 1033–1042.56. Nettersheim D, Biermann K, Gillis AJ, Steger K, Looijenga LH, et al. (2011)
NANOG promoter methylation and expression correlation during normal andmalignant human germ cell development. Epigenetics 6: 114–122.
57. de Jong J, Stoop H, Gillis AJ, van Gurp RJ, van de Geijn GJ, et al. (2008)Differential expression of SOX17 and SOX2 in germ cells and stem cells has
biological and clinical implications. J Pathol 215: 21–30.
58. Rijlaarsdam MA, van Herk HA, Gillis AJ, Stoop H, Jenster G, et al. (2011)Specific detection of OCT3/4 isoform A/B/B1 expression in solid (germ cell)
tumours and cell lines: confirmation of OCT3/4 specificity for germ celltumours. Br J Cancer 6: 854–863.
59. MacDonald WA, Mann MR (2014) Epigenetic regulation of genomic imprinting
from germ line to preimplantation. Mol Reprod Dev 81: 126–140.60. Huang YH, Chin CC, Ho HN, Chou CK, Shen CN, et al. (2009) Pluripotency
of mouse spermatogonial stem cells maintained by IGF-1- dependent pathway.FASEB J 23: 2076–2087.
61. Belge G, Dieckmann KP, Spiekermann M, Balks T, Bullerdiek J (2012) Serumlevels of microRNAs miR-371-3: a novel class of serum biomarkers for testicular
germ cell tumors? Eur Urol 61: 1068–1069.
62. Dieckmann KP, Spiekermann M, Balks T, Flor I, Loning T, et al. (2012)MicroRNAs miR-371-3 in serum as diagnostic tools in the management of
testicular germ cell tumours. Br J Cancer 107: 1754–1760.63. Gillis AJ, Rijlaarsdam MA, Eini R, Dorssers LC, Biermann K, et al. (2013)
Targeted serum miRNA (TSmiR) test for diagnosis and follow-up of (testicular)
germ cell cancer patients: a proof of principle. Mol Oncol 7: 1083–1092.64. Murray MJ, Coleman N (2012) Testicular cancer: a new generation of
biomarkers for malignant germ cell tumours. Nat Rev Urol 9: 298–300.65. Murray MJ, Halsall DJ, Hook CE, Williams DM, Nicholson JC, et al. (2011)
Identification of microRNAs From the miR-371,373 and miR-302 clusters aspotential serum biomarkers of malignant germ cell tumors. Am J Clin Pathol
135: 119–125.
66. Gillis AJ, Stoop HJ, Hersmus R, Oosterhuis JW, Sun Y, et al. (2007) High-
throughput microRNAome analysis in human germ cell tumours. J Pathol 213:
319–328.
67. Voorhoeve PM, le Sage C, Schrier M, Gillis AJ, Stoop H, et al. (2006) A genetic
screen implicates miRNA-372 and miRNA-373 as oncogenes in testicular germ
cell tumors. Cell 124: 1169–1181.
68. Bhat GK, Sea TL, Olatinwo MO, Simorangkir D, Ford GD, et al. (2006)
Influence of a leptin deficiency on testicular morphology, germ cell apoptosis,
and expression levels of apoptosis-related genes in the mouse. J Androl 27: 302–
310.
69. Ammerpohl O, Bens S, Appari M, Werner R, Korn B, et al. (2013) Androgen
receptor function links human sexual dimorphism to DNA methylation. PLoS
One 8: e73288.
70. Stadler MB, Murr R, Burger L, Ivanek R, Lienert F, et al. (2011) DNA-binding
factors shape the mouse methylome at distal regulatory regions. Nature 480:
490–495.
71. Clark SJ, Melki J (2002) DNA methylation and gene silencing in cancer: which is
the guilty party? Oncogene 21: 5380–5387.
72. Krentz AD, Murphy MW, Kim S, Cook MS, Capel B, et al. (2009) The DM
domain protein DMRT1 is a dose-sensitive regulator of fetal germ cell
proliferation and pluripotency. Proc Natl Acad Sci U S A 106: 22323–22328.
73. Matson CK, Murphy MW, Sarver AL, Griswold MD, Bardwell VJ, et al. (2011)
DMRT1 prevents female reprogramming in the postnatal mammalian testis.
Nature 476: 101–104.
74. Murphy MW, Sarver AL, Rice D, Hatzi K, Ye K, et al. (2010) Genome-wide
analysis of DNA binding and transcriptional regulation by the mammalian
Doublesex homolog DMRT1 in the juvenile testis. Proceedings of the National
Academy of Sciences 107: 13360–13365.
75. Hoei-Hansen CE, Nielsen JE, Almstrup K, Sonne SB, Graem N, et al. (2004)
Transcription factor AP-2gamma is a developmentally regulated marker of
testicular carcinoma in situ and germ cell tumors. Clin Cancer Res 10: 8521–
8530.
76. Weber S, Eckert D, Nettersheim D, Gillis AJ, Schafer S, et al. (2010) Critical
function of AP-2 gamma/TCFAP2C in mouse embryonic germ cell mainte-
nance. Biol Reprod 82: 214–223.
77. Schemmer J, Arauzo-Bravo MJ, Haas N, Schafer S, Weber SN, et al. (2013)
Transcription factor TFAP2C regulates major programs required for murine
fetal germ cell maintenance and haploinsufficiency predisposes to teratomas in
male mice. PLoS One 8: e71113.
78. Orso F, Cottone E, Hasleton MD, Ibbitt JC, Sismondi P, et al. (2004) Activator
protein-2gamma (AP-2gamma) expression is specifically induced by oestrogens
through binding of the oestrogen receptor to a canonical element within the 59-
untranslated region. Biochem J 377: 429–438.
79. Schuur ER, McPherson LA, Yang GP, Weigel RJ (2001) Genomic structure of
the promoters of the human estrogen receptor-alpha gene demonstrate changes
in chromatin structure induced by AP2gamma. J Biol Chem 276: 15519–15526.
80. Demichelis F, Attard G (2013) A step toward functionally characterized prostate
cancer molecular subtypes. Nat Med 19: 966–967.
81. Andreassen KE, Kristiansen W, Karlsson R, Aschim EL, Dahl O, et al. (2013)
Genetic variation in AKT1, PTEN and the 8q24 locus, and the risk of testicular
germ cell tumor. Hum Reprod 28: 1995–2002.
Genome-Wide Epigenetic Footprints of GCC Cell Lines
PLOS ONE | www.plosone.org 13 June 2014 | Volume 9 | Issue 6 | e98330