Seminar Organised by INFORSE & EUFORES & EREF · 2 Seminar Organised by INFORSE & EUFORES & EREF...
5
1 Seminar Organised by INFORSE & EUFORES & EREF Brussels, November 9-10, 2004 Presentation by Giulio Volpi, WWF http://www.inforse.org/europe/seminar04nov9_10.htm Bioenergy Bioenergy for Europe for Europe status, trends, status, trends, gaps and future actions gaps and future actions Seminar on New and Upcoming EU Policies for Sustainable Energy and Climate Protection Organised by INFORSE - EUFORES – EREF Brussels, 9-10 November 2004 Giulio Volpi, WWF International www.panda.org/ powerswitch Bioenergy Bioenergy conversion chains conversion chains STATUS STATUS Bio Bio- energy use worldwide energy use worldwide • Global energy demand: ~420 EJ • About 10-15% (or 45 + 10 EJ) of this demand is covered by biomass resources: – Traditional biomass: ~29 – Commercial non-modern: 9 + 6 EJ – Commercial: ~7 EJ (16%) – Liquid biofuels ~0.5 EJ BIO BIO-POWERSWITCH! Study POWERSWITCH! Study Key findings: • 15% of OECD power demand by 2020 (30% under PowerSwitch Scenario) • Up to 1800 Mt of CO 2 emissions savings (between about 10% and 30% power sector CO 2 by 2020) • At least 400,000 full time equivalent jobs • About 2% of the total available land dedicated to biomass production Renewables Renewables targets (EU 15) targets (EU 15) Source: EC White Paper 1997
Transcript of Seminar Organised by INFORSE & EUFORES & EREF · 2 Seminar Organised by INFORSE & EUFORES & EREF...

1
Seminar Organised by INFORSE & EUFORES & EREFBrussels, November 9-10, 2004
Presentation by Giulio Volpi, WWF
http://www.inforse.org/europe/seminar04nov9_10.htm
BioenergyBioenergy for Europefor Europestatus, trends, status, trends,
gaps and future actionsgaps and future actionsSeminar on New and Upcoming EU Policies for
Sustainable Energy and Climate ProtectionOrganised by INFORSE - EUFORES – EREF
Brussels, 9-10 November 2004
Giulio Volpi, WWF Internationalwww.panda.org/ powerswitch
BioenergyBioenergy conversion chainsconversion chains
STATUSSTATUS
BioBio--energy use worldwideenergy use worldwide
• Global energy demand: ~420 EJ
• About 10-15% (or 45 + 10 EJ) of this demand is covered by biomass resources:– Traditional biomass: ~29
– Commercial non-modern: 9 + 6 EJ
– Commercial: ~7 EJ (16%)
– Liquid biofuels ~0.5 EJ
BIOBIO--POWERSWITCH! StudyPOWERSWITCH! Study
Key findings:
• 15% of OECD power demand by 2020 (30% under PowerSwitchScenario)
• Up to 1800 Mt of CO2 emissions savings (between about 10% and 30% power sector CO2 by 2020)
• At least 400,000 full time equivalent jobs
• About 2% of the total available land dedicated to biomass production
RenewablesRenewables targets (EU 15)targets (EU 15)
Source: EC White Paper 1997

2
Seminar Organised by INFORSE & EUFORES & EREFBrussels, November 9-10, 2004
Presentation by Giulio Volpi, WWF
http://www.inforse.org/europe/seminar04nov9_10.htm
The role of biomassThe role of biomass
• Biomass production in 2001: 56 Mtoe
• Additional estimated 79 Mtoe:
+34 Mtoe for power
+ 27 Mtoe for heating
+ 18 Mtoe for transport biofuels
2001Additional
contribution 2010Power 13 34 47Heat 42 27 69Transport 1 18 19Total 56 79 135
Energy production from biofuels (Mtoe)
PowerSwitch! ScenarioPowerSwitch! Scenario
0
500
1000
1500
2000
2500
3000
3500
4000
1997 BAU-2020 High Power Switch -2020
TW
h
Other renewablesSolar (Photovoltaics + Thermal)BiomassWind HydroOther FossilNatural Gas Coal Nuclear
- Energy saving by up to 30%- Biomass and wind are key
Biomass availabilityBiomass availability
• Not an issue! EC 2004 study “Bioenergy role in the EU market”
• Overall biomass availability in the EU 25: 140-150 Mtoe
• New Member States have high potential for both electricity and heat generation
• Untapped large biopower potential in Poland, Hungary, Czech Republic, Slovakia, Baltic countries
TRENDSTRENDS
How are we doing?How are we doing?
• The share of renewable energy was still only 6% in the year 2000
• The increase of bioenergy in the first 5 years from 1995 to 2001 was only 6 Mtoe equal to 7% of the proposed total increase in 15% years
• Production concentrated in 2 countries. Finland accounts for 30% and Sweden for 17%. Need for other countries to follow (Germany, Spain, France, Poland, Italy)
BiopowerBiopower
• 21% target will only be achieved if biomass contributes to 40% to it
• Biopower would need to grow by 18% per year over the next 8 years compared to the 7% average between 1997-2004
• An additional 32 Mtoe of biopower is need in the EU by 2010

3
Seminar Organised by INFORSE & EUFORES & EREFBrussels, November 9-10, 2004
Presentation by Giulio Volpi, WWF
http://www.inforse.org/europe/seminar04nov9_10.htm
Sweden: ~ 20% bioSweden: ~ 20% bio--energy in 2000energy in 2000
Heating sector
Power sector
GAPSGAPS
What is not working?What is not working?
• Demand side– Great potential in heating sector but competition
from large scale natural gas deployment (short -term solution)
– Lack of mandated markets for RES heating
• Supply side– Carbon trading is not expected to benefit bioenergy– Need to meet increasing demand for woody
biomass– Flow of solid and liquid biomass into EU– Lack of environmental certification
Energy cropsEnergy crops
• A additional 27 Mtoe of woody energy crops is needed
• Short rotation forestry (SRF) is a good replacement of annual food crops: more efficient and environmental friendly
• Large scale development is needed to reduce costs (e.g. Swedish strategy estimates to cost reduced by 20-25% if area = 100,000 ha)
• Market intervention needed to make SRF (e.g. Coppice or Miscanthus) competitive
• Current area-payment of EUR 45/ha is expected to have marginal effect on biogas -power and bioethanol, let alone woody crops.
FUTURE ACTIONSFUTURE ACTIONS
Actions neededActions needed
EU level• Adopt renewable heat directive• New area-based scheme for woody and grass energy crops
needed (EUR 300/ha) within the CAP reform• Prioritise bioenergy schemes with Structural Funds• Link incentives to sustainability certification schemes
National level• Adopt strategic national bioenergy plans and targets (heat
and power)• Implement realistic biopower and bioheat tariffs• Focus R&D on syngas based fuels (to allow biofuels from
woody crops)
4
Seminar Organised by INFORSE & EUFORES & EREFBrussels, November 9-10, 2004
Presentation by Giulio Volpi, WWF
http://www.inforse.org/europe/seminar04nov9_10.htm
• Bioenergy is key to meet renewables and climate goals
• Need to build political momentum for European biomass deployment strategy
• Strategic policy support has resulted in massive increase in some European countries
• CAP reform must prioritise perennial woody and grass crops
• Environmental certification is needed to guarantee sustainability
ConclusionsConclusions
www.panda.org/powerswitch
www.eugenestandard.org
More infoMore info
Assumption (conservative)• Recovery of 25% of technically recoverable forestry and agricultural
waste corresponding to 6 EJ of primary energy
• Conversion of 5% of crop, forest and wood land to energy plantations corresponding to 10 EJ of primary energy
Results
• 15% of the power demand - 30% under PowerSwitch Scenario
• No conflict between nature conservation and biomass production - about 2% of the total available land dedicated to biomass production
• Supply for at least 100,000,000 households - estimated additional capacity of 200 GW -
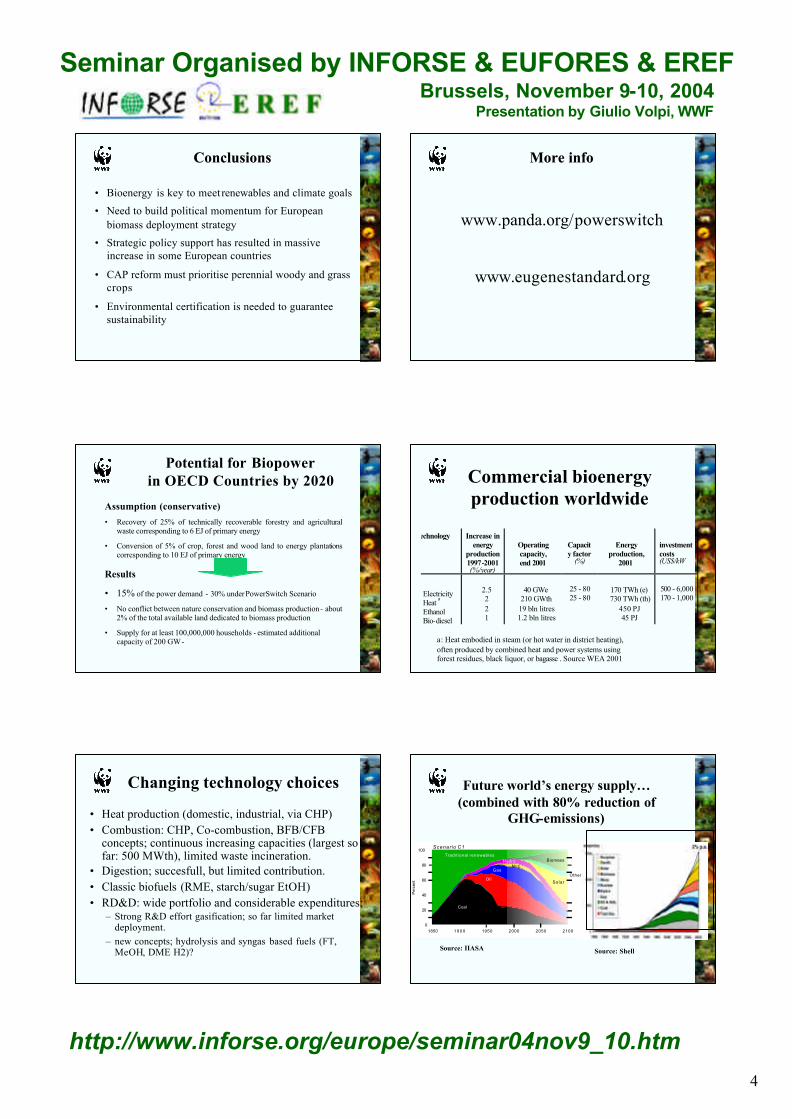
Potential for Biopower in OECD Countries by 2020 Commercial bioenergy
production worldwide
a: Heat embodied in steam (or hot water in district heating), often produced by combined heat and power systems using forest residues, black liquor, or bagasse . Source WEA 2001
Technology Increase in energy
production 1997-2001 (%/year)
Operating capacity, end 2001
Capacity factor
(%)
Energy production,
2001
investment costs (US$/kW
Electricity Heat
a
Ethanol Bio-diesel
∼ 2.5 ∼ 2 ∼ 2 ∼ 1
∼ 40 GWe
∼ 210 GWth ∼ 19 bln litres ∼ 1.2 bln litres
25 - 80 25 - 80
∼ 170 TWh (e)
∼ 730 TWh (th) ∼ 450 PJ ∼ 45 PJ
500 - 6,000 170 - 1,000
Changing technology choices
• Heat production (domestic, industrial, via CHP)• Combustion: CHP, Co-combustion, BFB/CFB
concepts; continuous increasing capacities (largest so far: 500 MWth), limited waste incineration.
• Digestion; succesfull, but limited contribution.• Classic biofuels (RME, starch/sugar EtOH)• RD&D: wide portfolio and considerable expenditures;
– Strong R&D effort gasification; so far limited market deployment.
– new concepts; hydrolysis and syngas based fuels (FT, MeOH, DME H2)?
Future world’s energy supply…(combined with 80% reduction of
GHG-emissions)
Scenario C1
1850 1 9 0 0 19500
20
40
60
80
100
2000 2050 2100
Oil
GasOther
Solar
Tradit ional renewablesBiomass
Nuc.Hydro
Coal
Per
cent
Source: IIASA Source: Shell

5
Seminar Organised by INFORSE & EUFORES & EREFBrussels, November 9-10, 2004
Presentation by Giulio Volpi, WWF
http://www.inforse.org/europe/seminar04nov9_10.htm
Breakdown of biomass increase
Source: EC White Paper 1997 - energy crops: 10 million hectares
3027
1815
0
5
10
15
20
25
30
35
Residues fromagri/forestry
Energy crops forheat/power
Energy crops forliquid biofuels
Biogas
Mto
e
Renewable energy (EU 15)
Contribution of Renewables to InlandConsumption in the EU-15
02000
4000
6000
800010000
12000
14000
1990
1995
2000
2010 T
argets
2020
Projectio
ns
Year
PJ
PV
Geothermal
Solar Thermal
Wind
Hydro
Biomass
Total primary energy consumption EU-15: 60,800 PJSource: EC 1997, Ecofys 2004, AEBIOM
Renewables power (EU-15)
Contribution of Renewables to Electricity Generation in the EU-15
0
200
400
600
800
1000
1200
1400
1990
1995
2000
2010
Targe
ts
2020 P
rojectio
ns
Year
TWh
Geothermal
PVBiomassWindHydro
Source: EC 1997, Ecofys 2004, AEBIOM
How are we doing?
• Heat: In 1990 the production of heat from biomass 1500 PJth to over 1800 PJth in 1999 (2% per year).
• Electricity: 54 PJe in 1990 to 166 PJe in 1999 (9% per year).
• Biofuels: Currently 25 PJfuel.– Biodiesel: 80 ktonne in 1993 to 780 ktonnes in 2001. (Germany
and France)
– Ethanol: 48 up to 216 ktonne in the same period. (France, Spain and Sweden)
Biopower markets (EU 15)
Source: AEBIOM 2004