Seminar on Reinsurance Philadelphia, PA June 3, 2003 Casualty Actuarial Society A SHPS Company.
34
Seminar on Reinsurance Philadelphia, PA June 3, 2003 Casualty Actuarial Society A SHPS Company
-
Upload
dale-owens -
Category
Documents
-
view
216 -
download
0
Transcript of Seminar on Reinsurance Philadelphia, PA June 3, 2003 Casualty Actuarial Society A SHPS Company.
Seminar on Reinsurance
Philadelphia, PAJune 3, 2003
Casualty Actuarial Society
A SHPS Company

David OlshoFSA, MAAA
Specialty Lines:Accident & Health
A SHPS Company

3
A SHPS Company
1
3
Today’s Agenda
1. Health Care Update
2. Medical Stop Loss Marketplace
3. Consumer Directed Health Plans
4. Predictive Modeling
5. Disease Management
6. SARS
7. Society of Actuaries Large Claim Study
8. Questions

4
A SHPS Company
1
4
Health Care Update

5
A SHPS Company
1
5
0
5
10
15
20
25
Year
Perc
ent o
f GD
P
National Health Expenditures as a Percentage of GDP
* Projection** 16 Year AverageSource: Bureau of Economic Analysis, Office of the Actuary
National Health Expenditures
National Defense Expenditures**

6
A SHPS Company
1
6
-3.00%
0.00%
3.00%
6.00%
9.00%
12.00%
15.00%
18.00%
1987 1989 1991 1993 1995 1997 1999 2001 2003
% Change Health Cost % Profit Health Plans
Change in Average Total Health Benefit Cost1987 – (2003 estimated)
Source: William M. Mercer Employee Benefit Survey NOTE: 1987-1998 are based on cost for active and retired combined; 1998-2002 is based on active employee cost only.

7
A SHPS Company
1
7
0% 10% 20% 30% 40% 50% 60% 70% 80%
Stock Opt.
Disability
LTC Ins.
Life Ins.
Pension
401 K
Health Ins.
Most Important Employee Benefit
Source: Employee Benefit Research Institute, WorldatWork
% Employees Listing as Most Important
8
A SHPS Company
1
8
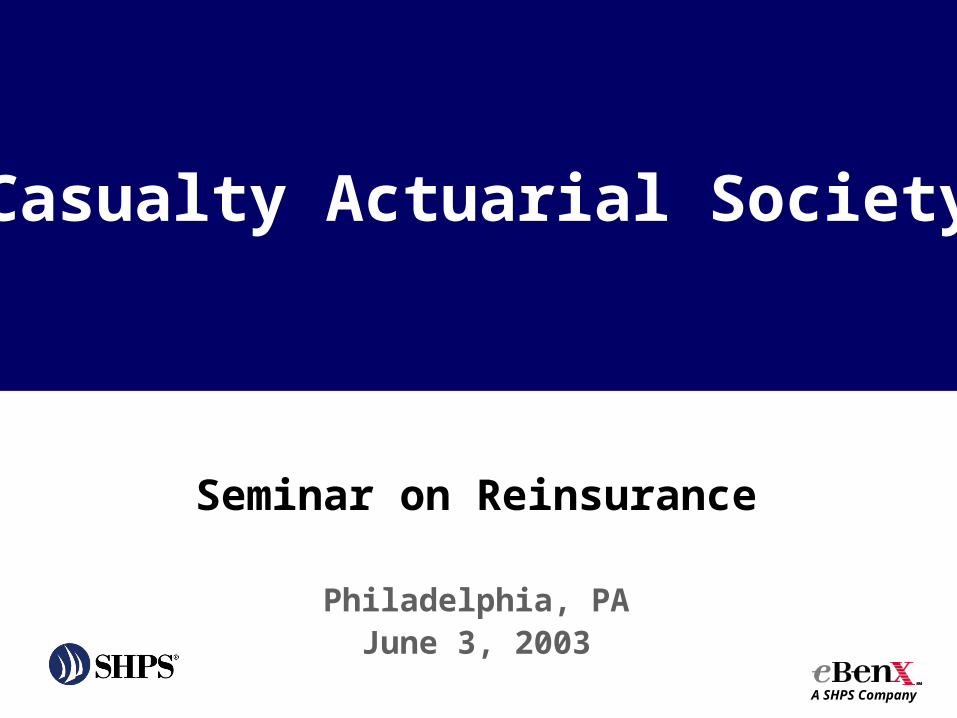
25th%ile 50th%ile 75th%ile 90th%ile
Pension 3.5% 4.5% 5.4% 6.5%
Cash Accumulation 2.5% 4.7% 5.7% 9.3%
Post-Retiree Medical 0.8% 1.5% 2.2% 2.8
All Retirement Benefits 5.0% 7.8% 10.2% 12.7%
Medical 7.3% 8.6% 9.8% 11.0%
Dental 0.7% 0.8% 1.0% 1.1%
Life/AD&D 0.3% 0.5% 0.7% 0.9%
STD/LTD 0.6% 0.9% 1.1% 1.3%
Vacation 5.6% 6.5% 7.1% 8.3%
Holiday/Sick Time 4.8% 4.8% 5.2% 5.8%
TOTAL 25.7% 29.8% 33.6% 36.9%
Benefit Costs as a Percentage of Base Pay

9
A SHPS Company
1
9
Medical Stop Loss Marketplace

10
A SHPS Company
1
10
Stop Loss Industry Results
2002- Profits Exceeded Target
Why?
Reinsurers got tough. MGUs lost their reinsurance Surviving MGUs had to write to set
RTMs

11
A SHPS Company
1
11
Stop Loss Industry Results
2002- Profits Exceeded Target 2003- Profits at Target 2004- Profits Below Target
(Losses?)

12
A SHPS Company
1
12
Stop Loss Industry Results
Why the negative trend?
Leveraged trend increase- 27%
vs
Sold trend increase- 21%
RTMs decrease

13
A SHPS Company
1
13
Stop Loss Industry Results
Why the negative trend? Increased start-up activity An underwriter at an MGU has said
“Fear has been replaced by greed.”

14
A SHPS Company
1
14
Stop Loss Industry Providers
Currently- 115 (approx)2002- asked to evaluate 1 start-up2003 (to date)- asked to evaluate 12
start-ups

15
A SHPS Company
1
15
Consumer Directed Health
Plans

16
A SHPS Company
1
16
Features:
• HRA
• High Deductible PPO Weak Discounts Weak Med Mgt
• High Administrative Fees
• Theory – Consumers seeking low cost providers will offset weak discounts and high administration fees
• Introduces “consumer cost impact”
Pre
ven
tive
Car
e 10
0%
Personal CareAccount
(Health Reimb.Account)
$1,000
Health InsurancePPO (80% IN,
60% OON)$1,500 deductible
MemberResponsibility
$500 Consumer
Directed
Consumer Directed Health Plans

17
A SHPS Company
1
17
Pre
ven
tive
Car
e 10
0%
Personal CareAccount
(Health Reimb.Account)
$1,000
Health InsurancePPO (80% IN,
60% OON)$1,500 deductible
MemberResponsibility
$500 Consumer
Directed
Internet
Provider Information Pricing Quality
Account Information Benefits Balances
General Health and Wellness Info
Health Risk Assessment
Voluntary Medical Management (“Health Coach”)
+
Consumer Directed Health Plans

18
A SHPS Company
1
18
Potential Benefits May reduce cost - May reduce unnecessary care - May reduce routine visits later in the year when HRA funds disappear
Encourages “consumerism” and the cost-effective use of services by exposing employees to cost impact
Encourages provider competition on both price and quality
Provides employees with useful information - Health risk assessments - Provider price and quality information - Nurse coaches and health interventions
Consumer Directed Health Plans

19
A SHPS Company
1
19
Potential Drawbacks
Entire premise might be flawed – not reduce cost - Not enough history for credible actuarial predictions - Very low enrollment history so far
Vendors / programs are not well established
Cost might increase - Adverse selection (only healthy people enroll) - Relatively weak discounts from “rented” networks - Employees waiving coverage historically might return to receive HRA funding - People may forego preventive care - Higher administrative fees
Consumer Directed Health Plans
20
A SHPS Company
1
20
Predictive Modeling

21
A SHPS Company
1
21
Predictive Modeling
Predictive Modeling – the use of artificial intelligence or “expert systems” to predict future chronic and catastrophic claimants.

22
A SHPS Company
1
22
ClaimsData
ClinicalRecords
ExpertOpinion
LiteratureReview
• Identify claimants with high risk of severe medical conditions
• Of those claimants, identify those for whom an appropriate intervention exists
• Design/determine interventions to be used
Predictive Modeling

23
A SHPS Company
1
23
0%
10%
20%
30%
40%
50%
60%
70%
80%
90%
100%
0% 10%
20%
30%
40%
50%
60%
70%
80%
90%
100%
% of Members
% o
f M
ed
ica
l Co
st
Bracket Study
62% mbrs, 3% care
87% mbrs, 41% care
99% mbrs, 69% care
Predictive Modeling

24
A SHPS Company
1
24
62%
25%
12%
1%3%
38%
27%31%
0%
10%
20%
30%
40%
50%
60%
70%
Healthy Acute Chronic Catastrophic
% Members % Cost
Claims PMPM $9.27 $179.76 $361.28 $4,790.63
Source: Aetna Healthcare
Predictive Modeling

25
A SHPS Company
1
25
Disease Management

26
A SHPS Company
1
26
Disease Management
Definition- the planned and systematic approach to caring for a population of patients with anticipatable needs and problems, typically defined by a chronic illness.
Source: Pacific Business Group on Health
27
A SHPS Company
1
27
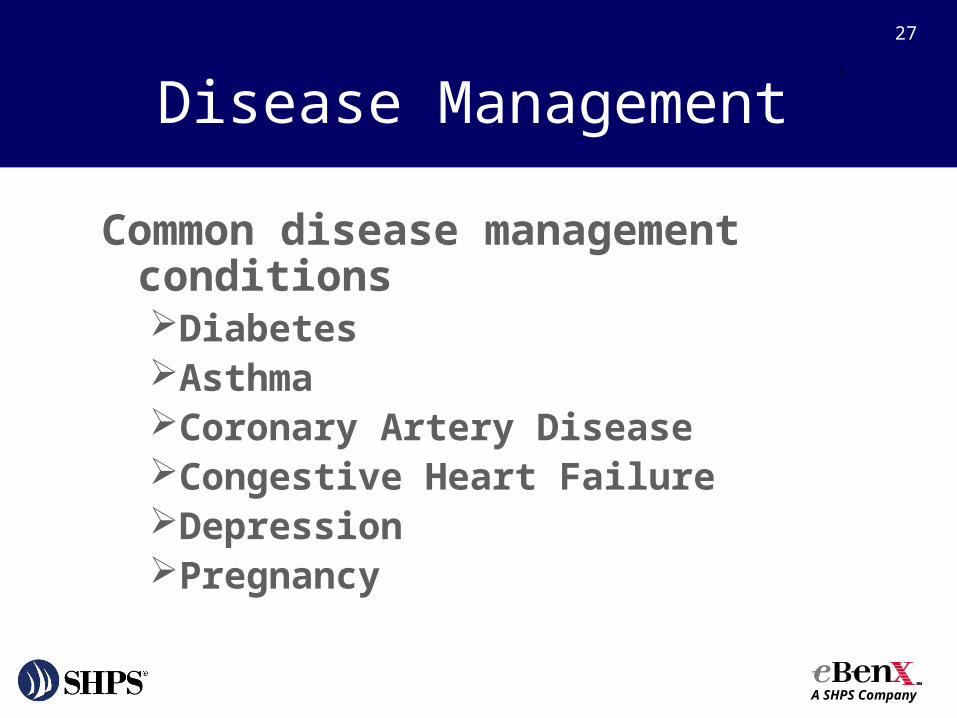
Disease Management
Common disease management conditionsDiabetesAsthmaCoronary Artery DiseaseCongestive Heart FailureDepressionPregnancy

28
A SHPS Company
1
28
Severe Acute Respiratory Syndrome
(SARS)

29
A SHPS Company
1
29
SARS
What are the actuarial implications?90% have mild symptoms10% have severe symptoms
15 day intensive care length of stay50% of these will die (5% mortality
rate )Could spread easily through workplace
and family
30
A SHPS Company
1
30
Society of Actuaries Large
Claim Study

31
A SHPS Company
1
31
Society of Actuaries Large
Claim Study
32
A SHPS Company
1
32
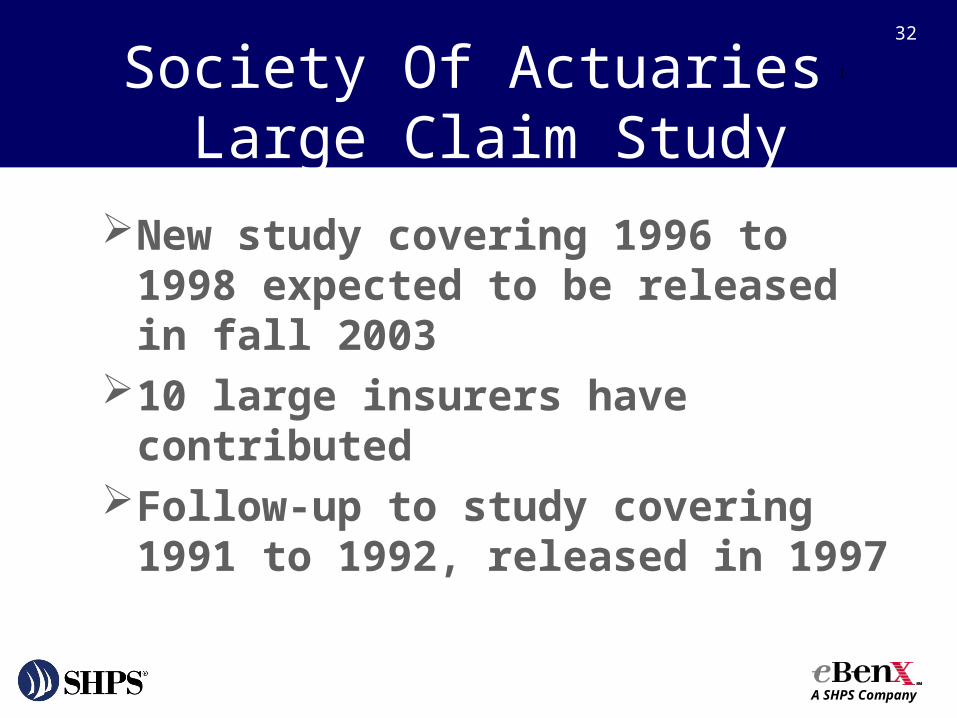
Society Of Actuaries Large Claim Study
New study covering 1996 to 1998 expected to be released in fall 2003
10 large insurers have contributedFollow-up to study covering 1991 to
1992, released in 1997

33
A SHPS Company
1
33
Questions ?

34
A SHPS Company
1
34
Thank You