Semi-automated detection of gully slivers from a Digital ...
7
Semi-automated detection of gully slivers from a Digital Surface Model in rough agricultural terrain George Olivier 1,2 ([email protected]), Marco J. Van De Wiel 1, Willem P. de Clerq 2 1 Centre for Agroecology, Water and Resilience - Coventry University, UK 2 Water Institute - Stellenbosch University, South Africa What it means … What we did Why we did it How we did it What we found What it means Final comments Use these for navigating the presentation
Transcript of Semi-automated detection of gully slivers from a Digital ...

Semi-automated detection of gully slivers from a Digital Surface Model in rough agricultural terrainGeorge Olivier1,2 ([email protected]), Marco J. Van De Wiel1, Willem P. de Clerq2
1 Centre for Agroecology, Water and Resilience - Coventry University, UK 2 Water Institute - Stellenbosch University, South Africa
What it means …
What we did Why we did it How we did it What we found What it means Final comments
Use these for navigating the presentation

Semi-automated detection of gully slivers from a Digital Surface Model in rough agricultural terrainGeorge Olivier1,2 ([email protected]), Marco J. Van De Wiel1, Willem P. de Clerq2
1 Centre for Agroecology, Water and Resilience - Coventry University, UK 2 Water Institute - Stellenbosch University, South Africa
What it means …
What we did
• We developed an improved method for the semi-automated detection of gullies, by focusing on the distinct morphology of gullies that make them so easily distinguishable in the field
• Development took place in the Sandspruit catchment, South Africa. We classified the Sandspruit catchment as having rough agricultural terrain
Why we did it How we did it What we found What it means Final comments
Semi-automated detection of gully slivers from a Digital Surface Model in rough agricultural terrainGeorge Olivier1,2 ([email protected]), Marco J. Van De Wiel1, Willem P. de Clerq2
1 Centre for Agroecology, Water and Resilience - Coventry University, UK 2 Water Institute - Stellenbosch University, South Africa
What it means …
Why we did itWhat we did How we did it What we found What it means Final comments
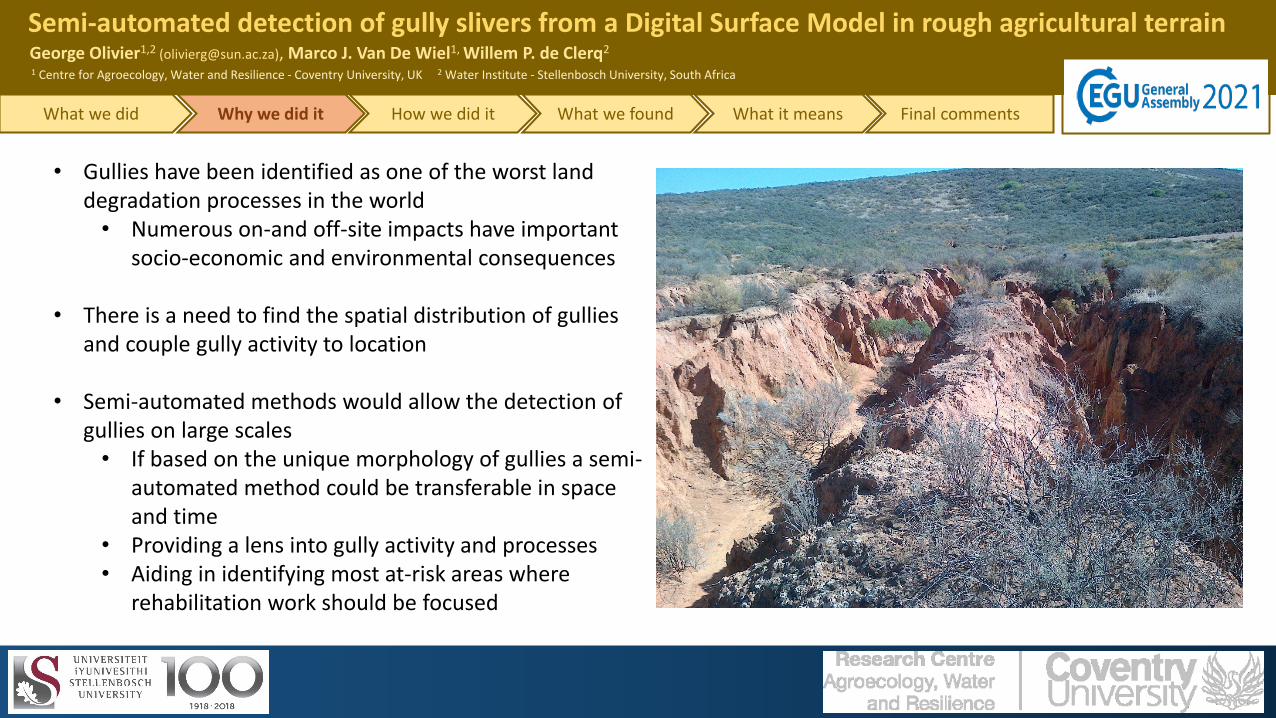
• Gullies have been identified as one of the worst land degradation processes in the world• Numerous on-and off-site impacts have important
socio-economic and environmental consequences
• There is a need to find the spatial distribution of gullies and couple gully activity to location
• Semi-automated methods would allow the detection of gullies on large scales • If based on the unique morphology of gullies a semi-
automated method could be transferable in space and time
• Providing a lens into gully activity and processes• Aiding in identifying most at-risk areas where
rehabilitation work should be focused

Semi-automated detection of gully slivers from a Digital Surface Model in rough agricultural terrainGeorge Olivier1,2 ([email protected]), Marco J. Van De Wiel1, Willem P. de Clerq2
1 Centre for Agroecology, Water and Resilience - Coventry University, UK 2 Water Institute - Stellenbosch University, South Africa
What it means …
How we did itWhat we did Why we did it What we found What it means Final comments
Object Based Image Analysis (OBIA) ruleset focusing on terrain derivatives
Refining classification by adding a 0.5m resolution RGB GeoEye-1 image

Semi-automated detection of gully slivers from a Digital Surface Model in rough agricultural terrainGeorge Olivier1,2 ([email protected]), Marco J. Van De Wiel1, Willem P. de Clerq2
1 Centre for Agroecology, Water and Resilience - Coventry University, UK 2 Water Institute - Stellenbosch University, South Africa
What it means …
What we foundWhat we did Why we did it How we did it What it means Final comments
• Moderate accuracies were obtained from using terrain derivatives as the main building blocks
• Gully detection accuracy was most notably influenced by:• Contour banks that mimic gully morphology to a
certain extent• Vegetation resulting in discontinuities of gully
channels• Vegetation resulting in sharp slope changes causing
false-positive detection• Numerous narrow gully channels in close proximity
upslope
• Applying a multi-resolution segmentation process on a high resolution (0.5m) GeoEye RGB image at the back-end of the workflow improved gully detection and limited false-positives
Manual mapping
OBIA (terrain derivatives only)
OBIA with RGB removal
OBIA with RBG removal and addition
Detected gullies (ha) 16.25 9.61 9.77 10.08
Misclassified gullies (ha) 0 4.02 1.51 1.50
User accuracy (Gully; Other)
- 0.40; 0.94 0.47; 0.99 0.47; 0.99
Producer accuracy (Gully; other)
- 0.79; 0.72 0.97; 0.69 0.97; 0.75
Overall accuracy - 0.74 0.79 0.79
Kappa index - 0.37 0.50 0.51

Semi-automated detection of gully slivers from a Digital Surface Model in rough agricultural terrainGeorge Olivier1,2 ([email protected]), Marco J. Van De Wiel1, Willem P. de Clerq2
1 Centre for Agroecology, Water and Resilience - Coventry University, UK 2 Water Institute - Stellenbosch University, South Africa
What it means …
What it meansWhat we did Why we did it How we did it What we found Final comments
• Individual gullies were detected well, but translating visual detection to an appropriate threshold for semi-auto detection was difficult (1 2)• Especially in rough agricultural terrain
• The addition of RGB imagery improved gully detection, but adding RGB imagery will restrict transferability
• The detection capability of these narrow gully slivers from a 2m DSM, however, is promising
• Future research steps may:• Investigate how using a DTM, derived from the DSM, in the
OBIA segmentation will influence gully detection• Apply the OBIA segmentation in an area with wider gullies• Compare this methodology with published methods that
show transferability potential
1
2

Semi-automated detection of gully slivers from a Digital Surface Model in rough agricultural terrainGeorge Olivier1,2 ([email protected]), Marco J. Van De Wiel1, Willem P. de Clerq2
1 Centre for Agroecology, Water and Resilience - Coventry University, UK 2 Water Institute - Stellenbosch University, South Africa
Final commentsWhat we did Why we did it How we did it What we found What it means
• I would like to thank you for your interest in my research
• If you would like any further information, discuss any of the material, or have any ideas you would like to share please contact George Olivier at [email protected]
Acknowledgements
• We would like to thank Prof. Adriaan van Niekerk for providing advice on the suitability of available data
• We greatly appreciate data support provided by the Centre of Geographic Analysis at Stellenbosch University
References• Castillo C, Taguas E V., Zarco-Tejada P, James MR, Gómez JA. 2014. The normalized
topographic method: An automated procedure for gully mapping using GIS. Earth Surface Processes and Landforms 39 : 2002–2015. DOI: 10.1002/esp.3595
• Evans M, Lindsay J. 2010. High resolution quantification of gully erosion in upland peatlands at the landscape scale. Earth Surface Processes and Landforms 35 : 876–886. DOI: 10.1002/esp.1918
• Francipane A, Cipolla G, Maltese A, La Loggia G, Noto L V. 2020. Using very high resolution (VHR) imagery within a GEOBIA framework for gully mapping: An application to the Calhoun Critical Zone Observatory. Journal of Hydroinformatics 22: 219–234. DOI: 10.2166/hydro.2019.083