Semi-annual Report iShares Asia Trust · – Investment Portfolio (unaudited) – Statement of...
136
Semi-annual Report iShares Asia Trust • iShares MSCI China Index ETF • iShares MSCI China A International Index ETF • iShares FTSE A50 China Index ETF • iShares Core S&P BSE SENSEX India Index ETF • iShares Core MSCI AC Asia ex Japan Index ETF • iShares MSCI Emerging Asia Index ETF • iShares Core CSI 300 Index ETF • iShares Core KOSPI 200 Index ETF • iShares Core MSCI Taiwan Index ETF • iShares DAX Index ETF • iShares EURO STOXX 50 Index ETF • iShares FTSE 100 Index ETF • iShares NASDAQ 100 Index ETF • iShares Core Hang Seng Index ETF (Sub-funds of iShares Asia Trust) For the Period ended 30th June 2018
Transcript of Semi-annual Report iShares Asia Trust · – Investment Portfolio (unaudited) – Statement of...

Semi-annual Report iShares Asia Trust• iShares MSCI China Index ETF
• iShares MSCI China A International Index ETF
• iShares FTSE A50 China Index ETF
• iShares Core S&P BSE SENSEX India Index ETF
• iShares Core MSCI AC Asia ex Japan Index ETF
• iShares MSCI Emerging Asia Index ETF
• iShares Core CSI 300 Index ETF
• iShares Core KOSPI 200 Index ETF
• iShares Core MSCI Taiwan Index ETF
• iShares DAX Index ETF
• iShares EURO STOXX 50 Index ETF
• iShares FTSE 100 Index ETF
• iShares NASDAQ 100 Index ETF
• iShares Core Hang Seng Index ETF
(Sub-funds of iShares Asia Trust)
For the Period ended 30th June 2018

Semi-annual Report 1
Contents
Report of the Manager to the Unitholders 3
Condensed Statement of Financial Position 22
Condensed Statement of Comprehensive Income 31
Condensed Statement of Changes in Net Assets Attributable to Unitholders 38
Condensed Statement of Cash Flows 41
Notes to the Unaudited Condensed Financial Statements 48
iShares MSCI China Index ETF 76
– Investment Portfolio (unaudited)
– Statement of Movements in Investment Portfolio (unaudited)
– Performance Record (unaudited)
iShares MSCI China A International Index ETF 81
– Investment Portfolio (unaudited)
– Statement of Movements in Investment Portfolio (unaudited)
– Performance Record (unaudited)
iShares FTSE A50 China Index ETF 84
– Investment Portfolio (unaudited)
– Statement of Movements in Investment Portfolio (unaudited)
– Holdings of Collateral (unaudited)
– Performance Record (unaudited)
iShares Core S&P BSE SENSEX India Index ETF 87
– Investment Portfolio (unaudited)
– Investment Portfolio of iShares BSE SENSEX Mauritius Company (unaudited)
– Statement of Movements in Investment Portfolio (unaudited)
– Performance Record (unaudited)
iShares Core MSCI AC Asia ex Japan Index ETF 91
– Investment Portfolio (unaudited)
– Statement of Movements in Investment Portfolio (unaudited)
– Performance Record (unaudited)
iShares MSCI Emerging Asia Index ETF 100
– Investment Portfolio (unaudited)
– Statement of Movements in Investment Portfolio (unaudited)
– Performance Record (unaudited)
iShares Core CSI 300 Index ETF 106
– Investment Portfolio (unaudited)
– Statement of Movements in Investment Portfolio (unaudited)
– Performance Record (unaudited)
iShares Core KOSPI 200 Index ETF 111
– Investment Portfolio (unaudited)
– Statement of Movements in Investment Portfolio (unaudited)
– Performance Record (unaudited)

2 iShares Asia Trust
iShares Core MSCI Taiwan Index ETF 115
– Investment Portfolio (unaudited)
– Statement of Movements in Investment Portfolio (unaudited)
– Performance Record (unaudited)
iShares DAX Index ETF 118
– Investment Portfolio (unaudited)
– Statement of Movements in Investment Portfolio (unaudited)
– Performance Record (unaudited)
iShares EURO STOXX 50 Index ETF 121
– Investment Portfolio (unaudited)
– Statement of Movements in Investment Portfolio (unaudited)
– Performance Record (unaudited)
iShares FTSE 100 Index ETF 124
– Investment Portfolio (unaudited)
– Statement of Movements in Investment Portfolio (unaudited)
– Performance Record (unaudited)
iShares NASDAQ 100 Index ETF 128
– Investment Portfolio (unaudited)
– Statement of Movements in Investment Portfolio (unaudited)
– Performance Record (unaudited)
iShares Core Hang Seng Index ETF 131
– Investment Portfolio (unaudited)
– Statement of Movements in Investment Portfolio (unaudited)
– Performance Record (unaudited)
Management and Administration 134
Contents (continued)

Semi-annual Report 3
iShares MSCI China Index ETFReport of the Manager to the Unitholders
(a Sub-Fund of iShares Asia Trust)
IntroductionThe iShares MSCI China Index ETF (the “MSCI China ETF”) (the “Sub-Fund”), a sub-fund of the iShares Asia Trust (the “Trust”), was launched on 23rd November 2001 and commenced trading under the stock code 2801 on The Stock Exchange of Hong Kong Limited (the “SEHK”) on 28th November 2001. The MSCI China ETF is a Hong Kong unit trust authorized under the Securities and Futures Ordinance (Cap. 571) of Hong Kong. The MSCI China ETF is benchmarked against the MSCI China Index. The manager of the MSCI China ETF is BlackRock Asset Management North Asia Limited (the “Manager”) and the trustee is HSBC Institutional Trust Services (Asia) Limited (the “Trustee”).
As of 30th June 2018, the MSCI China ETF invests in Chinese securities (including H-shares, Red Chips and P Chips) listed on the SEHK, A-shares and B-shares of Chinese securities listed on the Shanghai Stock Exchange and the Shenzhen Stock Exchange and depositary receipts. The Sub-Fund invests in China A-shares through Stock Connect.
Under the general taxing provision of the PRC corporate tax law, which came into effect on 1st January 2008, a non-PRC tax resident enterprise, e.g., QFII or RQFII, is subject to 10% withholding tax on PRC sourced interest income, dividends and capital gains provided that the non-PRC tax resident enterprise does not have its central management and control in the PRC or a PRC tax establishment.
Via the release of Caishui [2014] No. 79 (“Circular 79”), Caishui [2014] No. 81 (“Circular 81”) and Caishui [2016] No. 127 (“Circular 127”) by the Ministry of Finance (“MOF”) in the PRC, the China Securities Regulatory Commission (“CSRC”) and the State Administration of Taxation (“SAT”), acting with State Council’s approval, a temporary exemption from tax on capital gains derived from the trading of A-Shares on or after 17th November 2014 was provided to (i) QFIIs/RQFIIs; and (ii) foreign investors trading in A-Shares via Stock Connect.
As at 30th June 2018, no provision was made for taxation from such gains in the financial statements as the Manager believes that the MSCI China ETF can sustain a position for not filing a tax return based on the existing tax regulations including the above temporary tax exemptions and that the enforcement of such PRC tax on capital gains from other Chinese securities is not probable.
Fund PerformanceThe MSCI China ETF seeks to provide investment results, before fees and expenses, that closely correspond to the performance of the MSCI China Index in Hong Kong dollar (“HK$”) terms. As at 30th June 2018, the net asset value,
applicable to primary market creations and redemptions (“Dealing NAV”) per unit of the MSCI China ETF was HK$27.58, and there were 94,800,000 units outstanding. The total size of the Sub-Fund was approximately HK$2.6 billion.
A summary of the performance of the MSCI China ETF(a) is given below.
Total Return(b) in HK$
01.01.2018 to
30.06.2018
01.01.2017 to
31.12.2017
01.01.2016 to
31.12.2016
01.01.2015 to
31.12.2015
01.01.2014 to
31.12.2014
MSCI China Index(c) -1.39% 55.34% 0.94% -7.88% 7.98%MSCI China ETF
NAV-to-NAV(d) -1.67% 54.10% 0.34% -8.18% 7.33%
Total Return(b) in HK$
01.01.2013 to
31.12.2013
01.01.2012 to
31.12.2012
01.01.2011 to
31.12.2011
23.11.2001 (date of
inception) to 30.06.2018(e)
MSCI China Index(c) 3.68% 22.50% -18.48% 13.25%MSCI China ETF
NAV-to-NAV(d) 3.06% 21.46% -18.87% 12.31%
Source: BlackRock, MSCI Barra and WM/Reuters
The MSCI China Index is a free-float adjusted market capitalization-weighted index that is compiled and published by MSCI Inc. It is designed to track the equity market performance of (i) Chinese securities (H-shares, Red Chips and P Chips) listed on the SEHK (ii) B-shares of Chinese securities listed on the Shanghai Stock Exchange and the Shenzhen Stock Exchange (and effective from 1st June 2018, China A-shares) and (iii) companies traded outside the country of classification (i.e. foreign listed companies) including those traded by way of depositary receipts. The difference in performance between the MSCI China Index and the MSCI China ETF is mainly attributed to fees and expenses, and security misweights.
Fund ActivitiesThe average daily trading volume for the MSCI China ETF during the period was reported by Bloomberg to be approximately 201,035 units. As at 30th June 2018, the MSCI China ETF comprised 94,800,000 outstanding units.
Index ActivitiesThe MSCI China Index underwent two regular reviews during the period. Effective from 1st June 2018, the index includes A-Shares. As at 30th June 2018, the MSCI China ETF held 329 out of 447 constituents in the MSCI China Index.
(a) Past performance figures shown are not indicative of the future performance of the Sub-Fund.(b) Total return represents the rate that an investor would have earned (or lost) on an investment, assuming reinvestment of all dividends and distributions. Calculated as at 30th June/31st
December.(c) An investor cannot invest directly in an index and the index performance returns do not reflect management fees, transaction costs or other expenses, which would reduce performance
returns of the Sub-Fund.(d) Units in the Sub-Fund are issued and redeemed at NAV. Therefore, the Sub-Fund does not publish a bid price and the Sub-Fund’s returns have been calculated from NAV.(e) This is the annualized return since fund inception. The Sub-Fund inception date is 23rd November 2001.

4 iShares Asia Trust
iShares MSCI China A International Index ETFReport of the Manager to the Unitholders
(a Sub-Fund of iShares Asia Trust)
IntroductionThe iShares MSCI China A International Index ETF (the “MSCI China A ETF”) (the “Sub-Fund”), a sub-fund of the iShares Asia Trust (the “Trust”), was launched on 25th January 2016 and commenced trading under the stock codes 83162 for the RMB counter and 3162 for the HKD counter on The Stock Exchange of Hong Kong Limited (the “SEHK”) on 28th January 2016. The MSCI China A ETF is a Hong Kong unit trust authorized under the Securities and Futures Ordinance (Cap. 571) of Hong Kong. The MSCI China A ETF is benchmarked against the MSCI China A International Index (the “MSCI China A Index”). The manager of the MSCI China A ETF is BlackRock Asset Management North Asia Limited (the “Manager”) and the trustee is HSBC Institutional Trust Services (Asia) Limited (the “Trustee”).
The MSCI China A ETF may invest in China A-Shares through a combination of RQFII quota and Stock Connect. Via the release of Caishui [2014] No. 79 (“Circular 79”), Caishui [2014] No. 81 (“Circular 81”) and Caishui [2016] No. 127 (“Circular 127”) by the Ministry of Finance (“MOF”) in the PRC, the China Securities Regulatory Commission (“CSRC”) and the State Administration of Taxation (“SAT”), acting with State Council’s approval, a temporary exemption from tax on capital gains derived from the trading of A-Shares on or after 17th November 2014 was provided to (i) QFIIs/RQFIIs; and (ii) foreign investors trading in A-Shares via Stock Connect. No provision was made for taxation from such gains in the financial statements as the Sub-Fund began operations post this temporary exemption being granted.
Taking into account the relevant factors, including in particular the relatively small Net Asset Value of the Sub-Fund, the Manager decided to exercise its power under the Trust Deed to terminate the Sub-Fund. The Sub-Fund ceased trading on the SEHK from 5th March 2018. On 17th May 2018, all units in the Sub-Fund were compulsorily redeemed. On 1st June 2018, the Sub-Fund was delisted from the SEHK. The Sub-Fund will be terminated and seek to be de-authorized by the SFC on a date after the Manager and the Trustee have formed the view that there remains no actual or contingent assets or liabilities attributable to the Sub-Fund.

Semi-annual Report 5
IntroductionThe iShares FTSE A50 China Index ETF (the “A50 China ETF”) (the “Sub-Fund”), a sub-fund of the iShares Asia Trust (the “Trust”), was launched on 15th November 2004 and commenced trading on The Stock Exchange of Hong Kong Limited (the “SEHK”) under the stock codes 2823 for the HKD counter on 18th November 2004 and 82823 for the RMB counter on 7th July 2017. The A50 China ETF is a Hong Kong unit trust authorized under the Securities and Futures Ordinance (Cap. 571) of Hong Kong. The A50 China ETF is benchmarked against the FTSE China A50 Index (the “A50 Index”). The manager of the A50 China ETF is BlackRock Asset Management North Asia Limited (the “Manager”) and the trustee is HSBC Institutional Trust Services (Asia) Limited (the “Trustee”).
A50 China ETF changed its base currency from Hong Kong dollar (“HKD”) to Renminbi (“RMB”), effective 1st January 2018. This change has been made to align the base currency of the Sub-Fund with the currency of the Sub-Fund’s underlying index for performance measurement and for creation and redemption of units. Accordingly, the Sub-Fund has changed its functional and presentation currency from HKD to RMB, effective 1st January 2018.
On 30th June 2017, the Manager announced that, as a result of the transition from a “synthetic representative” sub-strategy to a “physical representative” sub-strategy, which resulted in the A50 China ETF’s holding in A-Shares and physical A-Share exchange traded funds (“Physical A-Share ETFs”) in aggregate, comprising more than 70% of the Net Asset Value of the A50 China ETF on an ongoing basis, the Manager had applied for and was granted approval by the Securities and Futures Commission of Hong Kong (“SFC”) to remove the SFC synthetic labelling condition (the “SFC Synthetic Labeling Condition”). The removal of the SFC Synthetic Labeling Condition took effect from 7th July 2017; accordingly, from that day onwards, the asterisk and annotation to the name of the A50 China ETF was removed and the name of A50 China ETF was changed from the “iShares FTSE A50 China Index ETF* (*This is a synthetic ETF)” to “iShares FTSE A50 China Index ETF”. On 1st December 2017, the Manager further announced that the A50 China ETF had completed its transition from a “synthetic representative” strategy to a “physical representative” strategy under which its holdings in A-Shares and Physical A-Share ETFs (for cash management and contingency purposes) in aggregate comprise 90% or more of its Net Asset Value on an ongoing basis, and that the Manager had applied to the SFC for, and has been granted, approval to remove the authorization condition imposed on the A50 China ETF by the SFC on 29th August 2011 whereby the Manager was (i) required to collateralise all counterparty exposures with a view to ensuring that the collateral held by the A50 China ETF must represent at least 100% of the A50 China ETF’s gross total counterparty exposure and (ii) where the A50 China ETF accepted collateral in the nature of equity
securities, the A50 China ETF had to obtain collateral that had a market value of at least 120%, and for non-equity collateral, the Manager was required to adopt a prudent haircut policy (“SFC Collateral Condition”). The removal of the SFC Collateral Condition took effect from 1st January 2018.
The A50 China ETF may invest in a combination of A-Shares and Physical A-Share ETFs (for cash management and contingency purposes and for up to 10% of Net Asset Value). The A50 China ETF will seek to invest in A-Shares and Physical A-Shares ETFs so that such investments in aggregate comprise 90% or more of the Net Asset Value of the A50 China ETF. The A50 China ETF may also invest in other investments including (i) China A-Share Access Products (“CAAPs”) for cash management and contingency purposes and (ii) futures contracts, index futures contracts (investments in index futures contracts in the PRC (including CSI 300 index futures) will be for hedging purposes only), options on futures contracts and options related to the A50 China ETF’s underlying index, local currency and forward currency exchange contracts, and cash and cash equivalents for both hedging and non-hedging purposes, which the Manager believes will help the A50 China ETF achieve its investment objective. CAAPs are derivative instruments linked to A-Shares or an A-Share index and are intended to provide economic performance equivalent to holding the underlying A-Shares or the A-Share index. The CAAPs are issued by one or more Qualified Foreign Institutional Investors (“QFIIs”) or their affiliates (together, “CAAP Issuers”). The Manager expanded the investment universe to include direct investments in A-Shares on behalf of the A50 China ETF through QFII quota, Renminbi Qualified Foreign Institutional Investor (“RQFII”) quota, the Shanghai-Hong Kong Stock Connect and the Shenzhen-Hong Kong Stock Connect on 2nd August 2013, 1st September 2014, 14th November 2014 and 5th December 2016 respectively.
During the period and as of 30th June 2018, the A50 China ETF did not invest into any Physical A-Share ETFs.
Under the general taxing provision of the PRC corporate tax law, which came into effect on 1st January 2008, a non-PRC tax resident enterprise, e.g., QFII or RQFII, is subject to 10% withholding tax on PRC sourced interest income, dividends and capital gains provided that the non-PRC tax resident enterprise does not have its central management and control in the PRC or a PRC tax establishment.
Via the release of Circular 79, Caishui [2014] No. 81 (“Circular 81”) and Caishui [2016] No. 127 (“Circular 127”) by the Ministry of Finance (“MOF”) in the PRC, the China Securities Regulatory Commission (“CSRC”), and the State Administration of Taxation (“SAT”) acting with State Council’s approval, a temporary exemption from tax on capital gains derived from the trading of A-Shares on or after 17th November 2014 was provided to (i) QFIIs/RQFIIs; and (ii) foreign investors trading in A-Shares via Stock Connect respectively.
iShares FTSE A50 China Index ETFReport of the Manager to the Unitholders
(a Sub-Fund of iShares Asia Trust)

6 iShares Asia Trust
iShares FTSE A50 China Index ETF (continued)
Report of the Manager to the Unitholders
(a Sub-Fund of iShares Asia Trust)
IntroductionPursuant to Circular 79, Circular 81 and Circular 127 the Manager realigned the provisioning policy of the A50 China ETF in respect of its underlying PRC investments in CAAPs and direct A-Shares. As at 30th June 2018, no provision was made for taxation from such gains in the financial statements based on the existing tax regulations including the above temporary tax exemptions.
Fund PerformanceThe A50 China ETF seeks to provide investment results, before fees and expenses, that closely correspond to the performance of the A50 Index in Renminbi (“RMB”) terms. As of 30th June 2018, the Dealing NAV per unit of the A50 China ETF was RMB11.13 and there were 1,526,000,000 units outstanding. The total size of the Sub-Fund was approximately RMB17.0 billion.
A summary of the performance of the A50 China ETF(a) is given below.
Total Return(b) in RMB(f)
01.01.2018 to
30.06.2018
01.01.2017 to
31.12.2017
01.01.2016 to
31.12.2016
01.01.2015 to
31.12.2015
01.01.2014 to
31.12.2014
A50 Index(c) -11.25% 44.89% -10.33% -10.59% 67.53%A50 China ETF
NAV-to-NAV(d) -11.68% 41.95% -8.97% -10.43% 61.21%
Total Return(b) in RMB(f)
01.01.2013 to
31.12.2013
01.01.2012 to
31.12.2012
01.01.2011 to
31.12.2011
15.11.2004 (date of
inception) to 30.06.2018(e)
A50 Index(c) -8.94% 15.50% -13.45% 9.59%A50 China ETF
NAV-to-NAV(d) -12.25% 10.38% -15.00% 8.14%
Source: BlackRock, FTSE and WM/Reuters
(a) Past performance figures shown are not indicative of the future performance of the Sub-Fund.(b) Total returns represent the rate that an investor would have earned (or lost) on an investment, assuming reinvestment of all dividends and distributions. Calculated as at 30th June/31st
December.(c) An investor cannot invest directly in an index and the index performance returns do not reflect management fees, transaction costs or other expenses, which would reduce performance
returns of the Sub-Fund.(d) Units in the Sub-Fund are issued and redeemed at NAV. Therefore, the Sub-Fund does not publish a bid price and the Sub-Fund’s returns have been calculated from NAV.(e) This is the annualized return since fund inception. The Sub-Fund inception date is 15th November 2004.(f) The base currency of the Sub-Fund changed from Hong Kong dollar (“HK$”) to Renminbi (“RMB”) on 1st January 2018. Accordingly, the total return of the Sub-Fund and benchmark index are
being shown in RMB. Prior to 1st January 2018, the total return of the Sub-Fund and benchmark index are being shown in HK$.
Effective from 4th February 2014, the Sub-Fund is tracking the Net Total Return Index that has taken into account the 10% withholding tax on dividends of China A-Shares. In the past, the Sub-Fund tracked the gross (of tax) total return index.
The A50 Index is a net total return index which means that the dividends of the securities of the A50 Index net of withholding tax are reinvested. It was launched on 13th December 2003 and is denominated in Renminbi (“RMB”). The base date of the A50 Index is 21st July 2003. The A50 Index is compiled and published by FTSE International Limited and comprises the top 50 A-Share companies by market capitalization. The difference in performance between the A50 Index and the A50 China ETF is mainly attributed to fees and expenses, including collateral costs, taxes on dividends and PRC capital gains, and a different currency exchange rate used for fund valuation and index calculation.
Fund ActivitiesThe average trading volume for the A50 China ETF during the period was reported by Bloomberg to be approximately 41.9 million units. As at 30th June 2018, there were 1,526,000,000 units outstanding.
Index ActivitiesThe A50 Index underwent two regular reviews during the period. As at 30th June 2018, the A50 China ETF held all the constituents in the A50 Index.

Semi-annual Report 7
iShares Core S&P BSE SENSEX India Index ETFReport of the Manager to the Unitholders
(a Sub-Fund of iShares Asia Trust)
IntroductionThe iShares Core S&P BSE SENSEX India Index ETF (the “SENSEX India ETF”) (the “Sub-Fund”), a sub-fund of the iShares Asia Trust (the “Trust”), was launched on 31st October 2006 and commenced trading under the stock code 2836 for the HKD counter on The Stock Exchange of Hong Kong Limited (the “SEHK”) on 2nd November 2006. The SENSEX India ETF commenced trading under the stock codes 9836 for the USD counter and 82836 for the RMB counter on the SEHK on 14th October 2016. The SENSEX India ETF is a Hong Kong unit trust authorized under the Securities and Futures Ordinance (Cap. 571) of Hong Kong. The SENSEX India ETF is benchmarked against the S&P BSE SENSEX Index (the “SENSEX Index”). The manager of the SENSEX India ETF is BlackRock Asset Management North Asia Limited (the “Manager”) and the trustee is HSBC Institutional Trust Services (Asia) Limited (the “Trustee”).
Until June 2009, the SENSEX India ETF invested solely in derivative instruments. These derivative instruments, referred to as India Access Products (“IAPs”) were linked to the underlying Indian shares and were intended to provide economic performance equivalent to holding the underlying Indian shares. On 10th June 2009, the Manager announced its intention to restructure the SENSEX India ETF to allow it to invest directly in Indian securities in addition to IAPs. The restructuring involved the establishment of iShares BSE SENSEX Mauritius Company, a wholly owned subsidiary of the SENSEX India ETF incorporated in Mauritius (the “Mauritius Subsidiary”), to invest in Indian securities and/or IAPs. The restructure was completed on 22nd June 2009.
Following the restructure: (a) the underlying investments of the Mauritius Subsidiary, together with the direct investments made by the SENSEX India ETF, must in aggregate comply with the SENSEX India ETF’s investment restrictions; (b) the SENSEX India ETF will not incur additional fees and expenses as a result of the establishment of the Mauritius Subsidiary as the Manager will rebate to the SENSEX India ETF the amount of ordinary fees and expenses incurred by the Mauritius Subsidiary (other than brokerage and transaction costs, fees and charges relating to the IAPs and equities and extra ordinary expenses, if any); and (c) the various reports required to be prepared for the SENSEX India ETF will be prepared in a single entity form as the Mauritius Subsidiary is no longer consolidated to SENSEX India ETF and is accounted for at fair value through profit or loss.
Following the restructure, the SENSEX India ETF may invest up to 15% of its net asset value in IAPs, with a maximum exposure to any single issuer of 10% of its net asset value. As indicated above, an IAP is a derivative instrument and is not the same as direct holding or investment in the underlying Indian shares.
SENSEX India ETF changed its base currency from Hong Kong dollar (“HKD”) to United States dollar (“USD”), effective 1st January 2018. This change has been made to align the base currency of the Sub-Fund with the currency of the Sub-Fund’s underlying index for performance measurement and for creation and redemption of units. Accordingly, the Sub-Fund has changed its functional and presentation currency from HKD to USD, effective 1st January 2018.
India Tax Law ChangesOn 10th May 2016, the Indian Tax Board announced a phased removal of the capital gains tax (“CGT”) exemption under the India-Mauritius Tax Treaty. The change, effective from 1st April 2017, resulted in India retaining taxation rights on capital gains arising from sales of shares of Indian resident companies acquired by a Mauritius entity on or after 1st April 2017. Shares acquired prior to 1st April 2017 would still be protected from taxing rights in India. There is a transition period from 1st April 2017 to 31st March 2019 where the tax rate will be limited to 50% of India’s domestic tax rate subject to a limitation of benefits clause. Taxation in India at the full domestic tax rate will apply from financial year 2019 – 2020 onwards.
Effective 1st April 2018, capital gains (exceeding INR 100,000) realized from the sale of direct investments in India-listed securities which were held for a period of more than 12 months are subject to long-term CGT under new provisions included in the Income Tax Act. For India-listed securities held on or before 31st January 2018, any notional long term capital gains up to that date are grandfathered and sheltered from tax via a cost base step up to fair market value as at 31st January 2018 (where applicable).
For the period ended 30th June 2018, gains arising on disposal of shares by the Mauritius subsidiary acquired prior to 1st April 2017 were not subject to tax in accordance with the above. Gains on disposal of shares acquired after 1st April 2017 will be subject to tax according to the relevant local laws. The Manager will continue to monitor the impact of India tax law changes on the SENSEX India ETF and the Mauritius subsidiary.

8 iShares Asia Trust
Fund PerformanceThe SENSEX India ETF seeks to provide investment results, before fees and expenses, that closely correspond to the performance of the SENSEX Index in United States dollar (“US$”) terms. As at 30th June 2018, the Dealing NAV per unit of the SENSEX India ETF was US$3.04, and there were 42,400,000 units outstanding. The total size of the Sub-Fund was approximately US$132.7 million.
A summary of the performance of the SENSEX India ETF(a) is given below.
Total Return(b) in US$(f)
01.01.2018 to
30.06.2018
01.01.2017 to
31.12.2017
01.01.2016 to
31.12.2016
01.01.2015 to
31.12.2015
01.01.2014 to
31.12.2014
SENSEX Index(c) -2.48% 38.91% 0.89% -8.15% 29.24%SENSEX India ETF
NAV-to-NAV(d) -3.12% 38.25% -0.01% -9.04% 27.78%
Total Return(b) in US$(f)
01.01.2013 to
31.12.2013
01.01.2012 to
31.12.2012
01.01.2011 to
31.12.2011
31.10.2006 (date of
inception) to 30.06.2018(e)
SENSEX Index(c) -1.90% 23.80% -35.76% 6.63%SENSEX India ETF
NAV-to-NAV(d) -2.89% 22.57% -36.38% 5.38%
Source: BlackRock, Asia Index Private Limited and WM/Reuters
(a) Past performance figures shown are not indicative of the future performance of the Sub-Fund.(b) Total returns represent the rate that an investor would have earned (or lost) on an investment, assuming reinvestment of all dividends and distributions. Calculated as at 30th June/31st
December.(c) An investor cannot invest directly in an index and the index performance returns do not reflect management fees, transaction costs or other expenses, which would reduce performance
returns of the Sub-Fund. Starting on the 14th September 2011, the calculation of the Total Return Index has been adjusted by the index provider as from the date of inception. The SENSEX Index performance for comparative periods has been restated accordingly.
(d) Units in the Sub-Fund are issued and redeemed at NAV. Therefore, the Sub-Fund does not publish a bid price and the Sub-Fund’s returns have been calculated from NAV.(e) This is the annualized return since fund inception. The Sub-Fund inception date is 31st October 2006.(f) The base currency of the Sub-Fund changed from Hong Kong dollars (“HK$”) to United States dollars (“US$”) on 1st January 2018. Accordingly, the total return of the Sub-Fund and
benchmark index are being shown in US$. Prior to 1st January 2018, the total return of the Sub-Fund and benchmark index are being shown in HK$.
The SENSEX Index is a float-adjusted market capitalization-weighted index that is compiled and published by Asia Index Private Limited, a joint venture company established by BSE (formerly known as Bombay Stock Exchange Limited) and S&P Dow Jones Indices LLC. It comprises the 30 largest and most actively traded stocks, representative of various sections, on BSE. The difference in performance between the SENSEX Index and the SENSEX India ETF is mainly attributed to fees and expenses, and a different currency exchange rate used for fund valuation and index calculation.
Fund ActivitiesThe average daily trading volume for the SENSEX India ETF during the period was reported by Bloomberg to be approximately 111,962 units. As at 30th June 2018, a total of 42,400,000 units were outstanding.
Index ActivitiesThe SENSEX Index had one regular review during the period. As at 30th June 2018, the SENSEX India ETF invested all, or substantially all, of its assets in Indian equity securities through the Mauritius Subsidiary, in substantially the same weightings as constituted in the SENSEX Index.
iShares Core S&P BSE SENSEX India Index ETF (continued)
Report of the Manager to the Unitholders
(a Sub-Fund of iShares Asia Trust)

Semi-annual Report 9
IntroductionThe iShares Core MSCI AC Asia ex Japan Index ETF (the “MSCI AC Asia ex Japan ETF”) (the “Sub-Fund”), a sub-fund of the iShares Asia Trust (the “Trust”), was launched on 12th March 2009 and commenced trading under the stock code 3010 for the HKD counter on The Stock Exchange of Hong Kong Limited (the “SEHK”) on 23rd April 2009. The MSCI AC Asia ex Japan ETF commenced trading under the stock codes 9010 for the USD counter and 83010 for the RMB counter on the SEHK on 14th October 2016. The MSCI AC Asia ex Japan ETF is a Hong Kong unit trust authorized under the Securities and Futures Ordinance (Cap. 571) of Hong Kong. The MSCI AC Asia ex Japan ETF is benchmarked against the MSCI All Country Asia ex Japan Index, and, prior to 27th July 2015, MSCI Asia APEX 50 Index. The manager of the MSCI AC Asia ex Japan ETF is BlackRock Asset Management North Asia Limited (the “Manager”) and the trustee is HSBC Institutional Trust Services (Asia) Limited (the “Trustee”).
MSCI AC Asia ex Japan ETF has changed its base currency from Hong Kong dollar (“HKD”) to United States dollar (“USD”), effective 1st January 2018. This change has been made to align the base currency of the Sub-Fund with the currency of the Sub-Fund’s underlying index for performance measurement and for creation and redemption of units. Accordingly, the Sub-Fund has changed its functional and presentation currency from HKD to USD, effective 1st January 2018.
The MSCI AC Asia ex Japan ETF invests primarily in securities (including depositary receipts and, effective from 1st June 2018, A-Shares (by investing via Stock Connect)) included in the MSCI All Country Asia ex Japan Index, or in securities that are not included in the MSCI All Country Asia ex Japan Index, but which the Manager believes will help the MSCI AC Asia ex Japan ETF achieve its investment objective.
The MSCI AC Asia ex Japan ETF obtains exposure to the India constituents in the MSCI All Country Asia ex Japan Index (“Indian Constituents”) by (i) investing directly in India-listed securities as a Foreign Portfolio Investor registered with the Securities and Exchange Board of India; and/or (ii) other ETFs tracking indices which are highly correlated with the India portion of the MSCI All Country Asia ex Japan Index (“Underlying Indian ETFs”). In addition to the Underlying Indian ETFs, the Manager may also invest up to 10% of the MSCI AC Asia ex Japan ETF’s NAV in other ETF(s) for cash management and contingency purposes. The MSCI AC Asia ex Japan ETF may invest in financial derivative instruments for reducing tracking error, hedging purposes or to achieve its investment objective.
Under the general taxing provision of the PRC corporate tax law, which came into effect on 1st January 2008, a non-PRC tax resident enterprise, e.g., QFII or RQFII, is subject to 10% withholding tax on PRC sourced interest income, dividends and capital gains provided that the non-PRC tax resident enterprise does not have its central management and control in the PRC or a PRC tax establishment.
Via the release of Circular 79, Caishui [2014] No. 81 (“Circular 81”) and Caishui [2016] No. 127 (“Circular 127”) by the Ministry of Finance (“MOF”) in the PRC, the China Securities Regulatory Commission (“CSRC”), and the State Administration of Taxation (“SAT”) acting with State Council’s approval, a temporary exemption from tax on capital gains derived from the trading of A-Shares on or after 17th November 2014 was provided to (i) QFIIs/RQFIIs; and (ii) foreign investors trading in A-Shares via Stock Connect respectively.
As at 30th June 2018, no provision was made for taxation from such gains in the financial statements based on the existing tax regulations including the above temporary tax exemptions.
India Tax Law ChangesEffective 1st April 2018, capital gains (exceeding INR 100,000) realized from the sale of direct investments in India-listed securities which were held for a period of more than 12 months are subject to long-term CGT under new provisions included in the Income Tax Act. For India-listed securities held on or before 31st January 2018, any notional long term capital gains up to that date are grandfathered and sheltered from tax via a cost base step up to fair market value as at 31st January 2018 (where applicable).
The Manager will continue to monitor the impact of India tax law changes on the MSCI AC Asia ex Japan ETF.
Fund PerformanceThe MSCI AC Asia ex Japan ETF seeks to provide investment results, before fees and expenses, that closely correspond to the performance of the MSCI All Country Asia ex Japan Index, and, prior to 27th July 2015, the MSCI Asia APEX 50 Index, in United States dollar (“US$”) terms. As at 30th June 2018, the Dealing NAV per unit of the MSCI AC Asia ex Japan ETF was US$6.82, and there were 105,840,000 units outstanding. The total size of the Sub-Fund was approximately US$721.9 million.
iShares Core MSCI AC Asia ex Japan Index ETFReport of the Manager to the Unitholders
(a Sub-Fund of iShares Asia Trust)

10 iShares Asia Trust
Fund PerformanceA summary of the performance of the MSCI AC Asia ex Japan ETF(a) is given below.
Total Return(b) in US$(f)
01.01.2018 to
30.06.2018
01.01.2017 to
31.12.2017
01.01.2016 to
31.12.2016
01.01.2015 to
31.12.2015
01.01.2014 to
31.12.2014
MSCI All Country Asia ex Japan Index(c) -4.76% 42.89% 5.48% -7.20% N/A
MSCI Asia APEX 50 Index(c) N/A N/A N/A N/A 4.41%
MSCI AC Asia ex Japan ETF NAV-to-NAV(d) -4.92% 42.47% 5.17% -8.10% 3.88%
Total Return(b) in US$(f)
01.01.2013 to
31.12.2013
01.01.2012 to
31.12.2012
01.01.2011 to
31.12.2011
12.03.2009 (date of
inception) to 30.06.2018(e)
MSCI All Country Asia ex Japan Index(c) N/A N/A N/A 13.79%
MSCI Asia APEX 50 Index(c) 6.34% 24.90% -12.71% N/A
MSCI AC Asia ex Japan ETF NAV-to-NAV(d) 5.51% 24.25% -13.45% 13.09%
Source: BlackRock, MSCI Barra and WM/Reuters
The MSCI All Country Asia ex Japan Index is a free-float adjusted market capitalization-weighted index that is compiled and published by MSCI Inc. It is designed to capture the large and mid-cap representation across two of three developed markets countries (excluding Japan) and nine emerging markets countries in Asia. The MSCI All Country Asia ex Japan Index was launched on 1st January 2001. The MSCI AC Asia ex Japan ETF tracks the total return version of the MSCI All Country Asia ex Japan Index, net of dividend withholding tax.
The difference in performance between the MSCI All Country Asia ex Japan Index and the MSCI AC Asia ex Japan ETF is mainly attributed to fees and expenses, and security misweights.
(a) Past performance figures shown are not indicative of the future performance of the Sub-Fund. The Index changed from the MSCI Asia APEX 50 Index to the MSCI All Country Asia ex Japan Index on 27th July 2015. The performance of the Sub-Fund prior 27th July 2015 was achieved under circumstances that no longer apply.
(b) Total returns represent the rate that an investor would have earned (or lost) on an investment, assuming reinvestment of all dividends and distributions. Calculated as at 30th June/31st December.
(c) An investor cannot invest directly in an index and the index performance returns do not reflect management fees, transaction costs or other expenses, which would reduce performance returns of the Sub-Fund.
(d) Units in the Sub-Fund are issued and redeemed at NAV. Therefore, the Sub-Fund does not publish a bid price and the Sub-Fund’s returns have been calculated from NAV.(e) This is the annualized return since fund inception. The Sub-Fund inception date is 12th March 2009.(f) The base currency of the Sub-Fund changed from Hong Kong dollars (“HK$”) to United States dollars (“US$”) on 1st January 2018. Accordingly, the total return of the Sub-Fund and
benchmark index are being shown in US$. Prior to 1st January 2018, the total return of the Sub-Fund and benchmark index are being shown in HK$.
Fund ActivitiesThe average daily trading volume for the MSCI AC Asia ex Japan ETF during the period was reported by Bloomberg to be approximately 109,350 units. As at 30th June 2018, MSCI AC Asia ex Japan ETF comprised 105,840,000 outstanding units.
Index ActivitiesThe MSCI All Country Asia ex Japan Index underwent two regular reviews during the period. Effective from 1st June 2018, the index includes A-shares. As at 30th June 2018, the MSCI AC Asia ex Japan ETF held 838* constituents versus the 940 constituents in the MSCI All country Asia ex Japan Index.
* The MSCI AC Asia ex Japan ETF directly held 759 constituents and indirectly held 79 constituents through SG MSCI India ETF and US MSCI India ETF, out of 940 constituents comprising the MSCI All country Asia ex Japan Index.
iShares Core MSCI AC Asia ex Japan Index ETF (continued)
Report of the Manager to the Unitholders
(a Sub-Fund of iShares Asia Trust)

Semi-annual Report 11
IntroductionThe iShares MSCI Emerging Asia Index ETF (the “MSCI Emerging Asia ETF”) (the “Sub-Fund”), a sub-fund of the iShares Asia Trust (the “Trust”), was launched on 12th March 2009 and commenced trading under the stock code 2802 on The Stock Exchange of Hong Kong Limited (the “SEHK”) on 23rd April 2009. The MSCI Emerging Asia ETF is a Hong Kong unit trust authorized under the Securities and Futures Ordinance (Cap. 571) of Hong Kong. The MSCI Emerging Asia ETF is benchmarked against the MSCI EM Asia Index. The manager of the MSCI Emerging Asia ETF is BlackRock Asset Management North Asia Limited (the “Manager”) and the trustee is HSBC Institutional Trust Services (Asia) Limited (the “Trustee”).
The MSCI Emerging Asia ETF invests primarily in securities (including (i) depositary receipts and (ii) effective from 1st June 2018, A-Shares (by investing via Stock Connect)) in the MSCI EM Asia Index, or in securities that are not included in the MSCI EM Asia Index, but which the Manager believes will help the Emerging Asia ETF achieve its investment objective.
The MSCI Emerging Asia ETF is not a registered Foreign Portfolio Investor (“FPI”) with the Securities and Exchange Investment Board of India (“SEBI”) and is investing in the iShares Core S&P BSE SENSEX India Index ETF to gain exposure to the Indian market segment of the MSCI EM Asia Index.
The Emerging Asia ETF may invest in financial derivative instruments to achieve its investment objective. The Manager may also invest up to 10% of the Emerging Asia ETF’s NAV in other exchange traded funds (ETFs) for cash management and contingency purposes only and if it considers that investing in them is in the best interests of the unitholders taking into account various factors including but not limited to returns to investors, fees, and market conditions.
Under the general taxing provision of the PRC corporate tax law, which came into effect on 1st January 2008, a non-PRC tax resident enterprise, e.g., QFII or RQFII, is subject to 10% withholding tax on PRC sourced interest income, dividends and capital gains provided that the non-PRC tax resident enterprise does not have its central management and control in the PRC or a PRC tax establishment.
Via the release of Circular 79, Caishui [2014] No. 81 (“Circular 81”) and Caishui [2016] No. 127 (“Circular 127”) by the Ministry of Finance (“MOF”) in the PRC, the China Securities Regulatory Commission (“CSRC”), and the State Administration of Taxation (“SAT”) acting with State Council’s approval, a temporary exemption from tax on capital gains derived from the trading of A-Shares on or after 17th November 2014 was provided to (i) QFIIs/RQFIIs; and (ii) foreign investors trading in A-Shares via Stock Connect respectively.
As at 30th June 2018, no provision was made for taxation from such gains in the financial statements based on the existing tax regulations including the above temporary tax exemptions.
Fund PerformanceThe MSCI Emerging Asia ETF seeks to provide investment results, before fees and expenses, that closely correspond to the performance of the MSCI EM Asia Index in Hong Kong dollar (“HK$”) terms. As at 30th June 2018, the Dealing NAV per unit of the MSCI Emerging Asia ETF was HK$53.76 and there were 3,200,000 units outstanding. The total size of the Sub-Fund was approximately HK$172.0 million.
A summary of the performance of the MSCI Emerging Asia ETF(a) is given below.
Total Return(b) in HK$
01.01.2018 to
30.06.2018
01.01.2017 to
31.12.2017
01.01.2016 to
31.12.2016
01.01.2015 to
31.12.2015
01.01.2014 to
31.12.2014
MSCI EM Asia Index(c) -4.72% 44.02% 6.18% -9.85% 4.91%MSCI Emerging Asia
ETF NAV-to-NAV(d) -4.60% 43.74% 5.61% -10.66% 5.12%
Total Return(b) in HK$
01.01.2013 to
31.12.2013
01.01.2012 to
31.12.2012
01.01.2011 to
31.12.2011
12.03.2009 (date of
inception) to 30.06.2018(e)
MSCI EM Asia Index(c) 2.02% 20.58% -17.52% 13.42%MSCI Emerging Asia
ETF NAV-to-NAV(d) 0.53% 18.34% -15.33% 13.11%
Source: BlackRock, MSCI Barra and WM/Reuters
(a) Past performance figures shown are not indicative of the future performance of the Sub-Fund.(b) Total returns represent the rate that an investor would have earned (or lost) on an investment, assuming reinvestment of all dividends and distributions. Calculated as at 30th June/31st
December.(c) An investor cannot invest directly in an index and the index performance returns do not reflect management fees, transaction costs or other expenses, which would reduce performance
returns of the Sub-Fund.(d) Units in the Sub-Fund are issued and redeemed at NAV. Therefore, the Sub-Fund does not publish a bid price and the Sub-Fund’s returns have been calculated from NAV.(e) This is the annualized return since fund inception. The Sub-Fund inception date is 12th March 2009.
iShares MSCI Emerging Asia Index ETFReport of the Manager to the Unitholders
(a Sub-Fund of iShares Asia Trust)

12 iShares Asia Trust
iShares MSCI Emerging Asia Index ETF (continued)
Report of the Manager to the Unitholders
(a Sub-Fund of iShares Asia Trust)
Fund PerformanceThe MSCI EM Asia Index is a free float-adjusted market capitalization-weighted index that is compiled and published by MSCI Inc. It is designed to track the equity market performance of emerging market countries of Asia.
The difference in performance between the MSCI EM Asia Index and the MSCI Emerging Asia ETF is mainly attributed to fees and expenses, and security misweights.
Fund ActivitiesThe average daily trading volume for the MSCI Emerging Asia ETF during the period was reported by Bloomberg to be approximately 12,509 units. As at 30th June 2018, the MSCI Emerging Asia ETF comprised 3,200,000 outstanding units.
Index ActivitiesThe MSCI EM Asia Index underwent two regular reviews during the period. Effective from 1st June 2018, the index includes A-shares. As at 30th June 2018, the MSCI Emerging Asia ETF held 503* constituents versus the 868 constituents in the MSCI EM Asia Index.
Effective from 1st June 2017, MSCI Inc. reclassified the MSCI Pakistan Index from Frontier Markets to Emerging Markets. As such, from 1st June 2017, MSCI Emerging Asia ETF may invest in such foreign listed companies as part of its investment strategy and to meet its investment objective.
* The MSCI Emerging Asia ETF directly held 476 constituents and indirectly held 27 constituents through Sensex India ETF, out of 868 constituents comprising the MSCI EM Asia Index.

Semi-annual Report 13
IntroductionThe iShares Core CSI 300 Index ETF (the “CSI 300 ETF”) (the “Sub-Fund”), a sub-fund of the iShares Asia Trust (the “Trust”), was launched on 12th November 2009 and commenced trading under the stock code 2846 on The Stock Exchange of Hong Kong Limited (the “SEHK”) on 18th November 2009. The CSI 300 ETF commenced trading under the stock codes 9846 for the USD counter and 82846 for the RMB counter on the SEHK on 28th February 2017. The CSI 300 ETF is a Hong Kong unit trust authorized under the Securities and Futures Ordinance (Cap. 571) of Hong Kong. The CSI 300 ETF is benchmarked against the CSI 300 Index. The manager of the CSI 300 ETF is BlackRock Asset Management North Asia Limited (the “Manager”) and the trustee is HSBC Institutional Trust Services (Asia) Limited (the “Trustee”).
CSI 300 ETF has changed its base currency from Hong Kong dollar (“HKD”) to Renminbi (“RMB”), effective 1st January 2018. This change has been made to align the base currency of the Sub-Fund with the currency of the Sub-Fund’s underlying index for performance measurement and for creation and redemption of units. Accordingly, the Sub-Fund has changed its functional and presentation currency from HKD to RMB, effective 1st January 2018.
On 18th November 2016, the Manager announced the investment strategy of the CSI 300 ETF would change, effective 21st November 2016 (“Effective Date”), to introduce a “physical representative” sub-strategy, and the Manager intended to seek to decrease the CSI 300 ETF’s reliance on the “synthetic representative” investment strategy. The “physical representative” sub-strategy consists of direct investments in A-Shares via (i) Stock Connect and (ii) the RQFII quota, as well as investments in Physical A-Share ETFs for cash management and contingency purposes. Prior to the Effective Date, the CSI 300 ETF adopted a “synthetic representative” investment strategy through investing solely in China A-Share Access Products (“CAAPs”) or a combination of CAAPs and the iShares CSI Sector Index Funds*. On 17th February 2017, the Manager announced that the CSI 300 ETF had completed its transition from a “synthetic representative” strategy to a “physical representative” strategy under which its holding in A-Shares and Physical A-Share ETFs (for cash management and contingency purposes) in aggregate comprise 90% or more of its Net Asset Value on an ongoing basis.
From 28th February 2017 onwards, the asterisk and annotation to the name of the CSI 300 ETF was removed and the name of CSI 300 ETF was changed from the “iShares CSI 300 A-Share Index ETF* (*This is a synthetic ETF)” to “iShares Core CSI 300 Index ETF”.
* “iShares CSI Sector Index Funds” means the (i) iShares CSI A-Share Energy Index ETF* (*This is a synthetic ETF); (ii) iShares CSI A-Share Materials Index ETF* (*This is a synthetic ETF); (iii) iShares CSI A-Share Financials Index ETF* (*This is a synthetic ETF); (iv) iShares CSI A-Share Infrastructure index ETF* (*This is a synthetic ETF); (v) iShares CSI A-Share Consumer Discretionary Index ETF* (*This is a synthetic ETF); and (vi) iShares CSI A-Share Consumer Staples Index ETF* (*This is a synthetic ETF). The iShares CSI Sector Index Funds were terminated in the first half of 2017.
Pursuant to the authorization conditions imposed on the CSI 300 ETF by the SFC on 29th August 2011, the Manager was required to collateralize all counterparty exposures with a view to ensuring that the collateral held by the CSI 300 ETF must represent at least 100% of the CSI 300 ETF’s gross total counterparty exposure. In addition, where the CSI 300 ETF accepted collateral in the nature of equity securities, the CSI 300 ETF had to obtain collateral that has a market value of at least 120%. Further, for non-equity collateral, the Manager was required to adopt a prudent haircut policy (the “SFC Collateral Condition”). As a result of the transition from a “synthetic representative” strategy to a “physical representative” strategy, the Manager applied to the SFC for, and was granted, approval to remove the SFC Collateral Condition with effect from 28th February 2017.
The CSI 300 ETF may also invest in other investments including (i) CAAPs for cash management and contingency purposes and (ii) futures contracts, index futures contracts (investments in index futures contracts in the PRC (including CSI 300 index futures) will be for hedging purposes only), options on futures contracts and options related to the CSI 300 Index, local currency and forward currency exchange contracts, and cash and cash equivalents for both hedging and non-hedging purposes, which the Manager believes will help the CSI 300 ETF achieve its investment objective. The CSI 300 ETF’s investment in financial derivative instruments for non-hedging purposes will not exceed 10% of its NAV.
Under the general taxing provision of the PRC corporate tax law, which came into effect on 1st January 2008, a non-PRC tax resident enterprise, e.g., QFII or RQFII, is subject to 10% withholding tax on PRC sourced interest income, dividends and capital gains, provided that the non-PRC tax resident enterprise does not have its central management and control in the PRC or a PRC tax establishment.
Via the release of Circular 79, Caishui [2014] No. 81 (“Circular 81”) and Caishui [2016] No. 127 (“Circular 127”) by the Ministry of Finance (“MOF”) in the PRC, the China Securities Regulatory Commission (“CSRC”), and the State Administration of Taxation (“SAT”) acting with State Council’s approval, a temporary exemption from tax on capital gains derived from the trading of A-Shares on or after 17th November 2014 was provided to (i) QFIIs/RQFIIs; and (ii) foreign investors trading in A-Shares via Stock Connect respectively.
Pursuant to Circular 79, the Manager realigned the provisioning policy of the CSI 300 ETF in respect of its underlying PRC investments in CAAPs. As at 30th June 2018, no provision was made for taxation from such gains in the financial statements based on the existing tax regulations including the above temporary tax exemptions.
iShares Core CSI 300 Index ETFReport of the Manager to the Unitholders
(a Sub-Fund of iShares Asia Trust)

14 iShares Asia Trust
Fund PerformanceThe CSI 300 ETF seeks to provide investment results, before fees and expenses, that closely correspond to the performance of the CSI 300 Index in Renminbi (“RMB”) terms. As at 30th June 2018, the Dealing NAV per unit of the CSI 300 ETF was RMB22.89, and there were 5,000,000 units outstanding. The total size of the Sub-Fund was approximately RMB114.4 million.
A summary of the performance of the CSI 300 ETF(a) is given below.
Total Return(b) in RMB(f)
01.01.2018 to
30.06.2018
01.01.2017 to
31.12.2017
01.01.2016 to
31.12.2016
01.01.2015 to
31.12.2015
01.01.2014 to
31.12.2014
CSI 300 Index(c) -12.11% 32.69% -15.21% 0.79% 54.92%CSI 300 ETF
NAV-to-NAV(d) -12.46% 30.46% -15.77% 0.34% 51.18%
Total Return(b) in RMB(f)
01.01.2013 to
31.12.2013
01.01.2012 to
31.12.2012
01.01.2011 to
31.12.2011
12.11.2009 (date of
inception) to 30.06.2018(e)
CSI 300 Index(c) -2.54% 10.70% -20.55% 1.76% CSI 300 ETF
NAV-to-NAV(d) -6.62% 1.56% -24.65% -0.40%
Source: BlackRock, China Securities Index Co Ltd (CSI) and WM/Reuters
(a) Past performance figures shown are not indicative of the future performance of the Sub-Fund.(b) Total returns represent the rate that an investor would have earned (or lost) on an investment, assuming reinvestment of all dividends and distributions. Calculated as at 30th June/31st
December.(c) An investor cannot invest directly in an index and the index performance returns do not reflect management fees, transaction costs or other expenses, which would reduce performance
returns of the Sub-Fund.(d) Units in the Sub-Fund are issued and redeemed at NAV. Therefore, the Sub-Fund does not publish a bid price and the Sub-Fund’s returns have been calculated from NAV.(e) This is the annualized return since fund inception. The Sub-Fund inception date is 12th November 2009.(f) The base currency of the Sub-Fund changed from Hong Kong dollar (“HK$”) to Renminbi (“RMB”) on 1st January 2018. Accordingly, the total return of the Sub-Fund and benchmark index are
being shown in RMB. Prior to 1st January 2018, the total return of the Sub-Fund and benchmark index are being shown in HK$.
The CSI 300 Index is a net total return index calculated daily by using the official closing price of each stock exchange on which the constituent stocks are listed and assumes reinvestment of dividends net of withholding tax. It was launched on 31st December 2004 and is denominated in Renminbi (“RMB”). The base date of the CSI 300 Index is 31st December 2004. The CSI 300 Index is a free-float market capitalization-weighted index that is compiled and published by China Securities Index Co. The CSI 300 Index is a diversified index consisting of 300 constituent stocks traded on the Shanghai and Shenzhen stock exchanges, representing about 70% capitalization of the two exchanges. The difference in performance between the CSI 300 Index and the CSI 300 ETF is mainly attributed to fees and expenses, including collateral costs, taxes on dividends and PRC capital gains, and a different currency exchange rate used for fund valuation and index calculation.
Effective from 4th February 2014, the Sub-Fund is tracking the Net Total Return Index that has taken into account the 10% withholding tax on dividends of China A-Shares. In the past, the Sub-Fund tracked the gross (of tax) total return index.
Fund ActivitiesThe average daily trading volume for the CSI 300 ETF during the period was reported by Bloomberg to be approximately 30,287 units. As at 30th June 2018, the CSI 300 ETF comprised 5,000,000 outstanding units.
Index ActivitiesThe CSI 300 Index underwent one regular reviews during the period. As at 30th June 2018, the CSI 300 ETF held 292 constituents versus the 300 constituents in the CSI 300 Index.
iShares Core CSI 300 Index ETF (continued)
Report of the Manager to the Unitholders
(a Sub-Fund of iShares Asia Trust)

Semi-annual Report 15
IntroductionThe iShares Core KOSPI 200 Index ETF (the “KOSPI 200 ETF”) (the “Sub-Fund”), a sub-fund of the iShares Asia Trust (the “Trust”), was launched on 22nd June 2016 and commenced trading under the stock codes 83170 for the RMB counter, 9170 for the USD counter and 3170 for the HKD counter on The Stock Exchange of Hong Kong Limited (the “SEHK”) on 29th June 2016. The KOSPI 200 ETF is a Hong Kong unit trust authorized under the Securities and Futures Ordinance (Cap. 571) of Hong Kong. The KOSPI 200 ETF is benchmarked against the KOSPI 200 Net Total Return USD Index. The manager of the KOSPI 200 ETF is BlackRock Asset Management North Asia Limited (the “Manager”) and the trustee is HSBC Institutional Trust Services (Asia) Limited (the “Trustee”).
Fund PerformanceThe KOSPI 200 ETF seeks to provide investment results, before fees and expenses, that closely correspond to the performance of the KOSPI 200 Net Total Return USD Index in United States dollar (“US$”) terms. As at 30th June 2018, the Dealing NAV per unit of the KOSPI 200 Index ETF was US$1.36 and there were 6,600,000 units outstanding. The total size of the Sub-Fund was approximately US$8.96 million.
A summary of the performance of the KOSPI 200 ETF(a) is given below.
Total Return(b) in US$
01.01.2018 to
30.06.2018
01.01.2017 to
31.12.2017
22.06.2016 (date of
inception) to 31.12.2016
22.06.2016 (date of
inception) to 30.06.2018 (e)
KOSPI 200 Net Total Return USD Index(c) -11.08% 44.53% 0.89% 13.70%
KOSPI 200 ETF NAV-to-NAV(d) -10.94% 42.47% 1.73% 13.45%
Source: BlackRock, MSCI Barra and WM/Reuters
(a) Past performance figures shown are not indicative of the future performance of the Sub-Fund.(b) Total returns represent the rate that an investor would have earned (or lost) on an investment, assuming reinvestment of all dividends and distributions. Calculated as at 30th June/31st
December.(c) An investor cannot invest directly in an index and the index performance returns do not reflect management fees, transaction costs or other expenses, which would reduce performance
returns of the Sub-Fund.(d) Units in the Sub-Fund are issued and redeemed at NAV. Therefore, the Sub-Fund does not publish a bid price and the Sub-Fund’s returns have been calculated from NAV.(e) This is the annualized return since fund inception. The Sub-Fund inception date is 22nd June 2016.
The KOSPI 200 Net Total Return USD Index is a free float-adjusted market capitalization-weighted index based on 200 blue chip companies listed on the Korea Stock Market, which are selected on the basis of such factors as their market and sector representation and liquidity. It is calculated and maintained by the Korea Exchange. The KOSPI 200 Net Total Return USD Index is a net total return index, meaning its performance is calculated on the basis that dividends net of tax are reinvested.
Fund ActivitiesThe average daily trading volume for the KOSPI 200 ETF during the period was reported by Bloomberg to be approximately 11,792 units. As at 30th June 2018, the KOSPI 200 ETF comprised 6,600,000 outstanding units.
Index ActivitiesThe KOSPI 200 Net Total Return USD Index underwent one regular reviews during the period. As at 30th June 2018, the KOSPI 200 ETF held 200 constituents versus the 201 constituents in the KOSPI 200 Net Total Return USD Index.
iShares Core KOSPI 200 Index ETFReport of the Manager to the Unitholders
(a Sub-Fund of iShares Asia Trust)

16 iShares Asia Trust
IntroductionThe iShares Core MSCI Taiwan Index ETF (the “MSCI Taiwan ETF”) (the “Sub-Fund”), a sub-fund of the iShares Asia Trust (the “Trust”), was launched on 22nd June 2016 and commenced trading under the stock codes 83074 for the RMB counter, 9074 for the USD counter and 3074 for the HKD counter on The Stock Exchange of Hong Kong Limited (the “SEHK”) on 29th June 2016. The MSCI Taiwan ETF is a Hong Kong unit trust authorized under the Securities and Futures Ordinance (Cap. 571) of Hong Kong. The MSCI Taiwan ETF is benchmarked against the MSCI Taiwan Index. The manager of the MSCI Taiwan ETF is BlackRock Asset Management North Asia Limited (the “Manager”) and the trustee is HSBC Institutional Trust Services (Asia) Limited (the “Trustee”).
Fund PerformanceThe MSCI Taiwan ETF seeks to provide investment results, before fees and expenses, that closely correspond to the performance of the MSCI Taiwan Index in United States dollar (“US$”) terms. As at 30th June 2018, the Dealing NAV per unit of the MSCI Taiwan ETF was US$1.39 and there were 109,600,000 units outstanding. The total size of the Sub-Fund was approximately US$152.8 million.
A summary of the performance of the MSCI Taiwan ETF(a) is given below.
Total Return(b) in US$
01.01.2018 to
30.06.2018
01.01.2017 to
31.12.2017
22.06.2016 (date of
inception) to 31.12.2016
22.06.2016 (date of
inception) to 30.06.2018(e)
MSCI Taiwan Index(c) -0.99% 27.53% 9.57% 17.42%MSCI Taiwan ETF
NAV-to-NAV(d) -1.24% 26.98% 9.31% 16.88%
Source: BlackRock, MSCI Barra and WM/Reuters
(a) Past performance figures shown are not indicative of the future performance of the Sub-Fund.(b) Total returns represent the rate that an investor would have earned (or lost) on an investment, assuming reinvestment of all dividends and distributions. Calculated as at 30th June/31st
December.(c) An investor cannot invest directly in an index and the index performance returns do not reflect management fees, transaction costs or other expenses, which would reduce performance
returns of the Sub-Fund.(d) Units in the Sub-Fund are issued and redeemed at NAV. Therefore, the Sub-Fund does not publish a bid price and the Sub-Fund’s returns have been calculated from NAV.(e) This is the annualized return since fund inception. The Sub-Fund inception date is 22nd June 2016.
The MSCI Taiwan Index is a free float-adjusted market capitalization covering approximately 85% of the Taiwan investable equity universe on a net total return basis with dividends net of tax reinvested, subject to a global minimum size requirement. It is calculated and maintained by MSCI Inc.
Fund Activities
The average daily trading volume for the MSCI Taiwan ETF during the period was reported by Bloomberg to be approximately 56,384 units. As at 30th June 2018, the MSCI Taiwan ETF comprised 109,600,000 outstanding units.
Index ActivitiesThe MSCI Taiwan Index underwent two regular reviews during the period. As at 30th June 2018, the MSCI Taiwan ETF held all constituents in the MSCI Taiwan Index.
iShares Core MSCI Taiwan Index ETFReport of the Manager to the Unitholders
(a Sub-Fund of iShares Asia Trust)

Semi-annual Report 17
IntroductionThe iShares DAX Index ETF (the “DAX ETF”) (the “Sub-Fund”), a sub-fund of the iShares Asia Trust (the “Trust”), was launched on 23rd June 2016 and commenced trading under the stock codes 83146 for the RMB counter, 9146 for the USD counter and 3146 for the HKD counter on The Stock Exchange of Hong Kong Limited (the “SEHK”) on 29th June 2016. The DAX ETF is a Hong Kong unit trust authorized under the Securities and Futures Ordinance (Cap. 571) of Hong Kong. The DAX ETF is benchmarked against the DAX Index. The manager of the DAX ETF is BlackRock Asset Management North Asia Limited (the “Manager”) and the trustee is HSBC Institutional Trust Services (Asia) Limited (the “Trustee”).
Fund PerformanceThe DAX ETF seeks to provide investment results, before fees and expenses, that closely correspond to the performance of the DAX Index in the Euro (“EUR”) terms. As at 30th June 2018, the Dealing NAV per unit of the DAX ETF was EUR1.11 and there were 2,400,000 units outstanding. The total size of the Sub-Fund was approximately EUR2.7 million.
A summary of the performance of the DAX ETF(a) is given below.
Total Return(b) in EUR
01.01.2018 to
30.06.2018
01.01.2017 to
31.12.2017
23.06.2016 (date of
inception) to 31.12.2016
23.06.2016 (date of
inception) 30.06.2018(e)
DAX Index(c) -4.73% 12.51% 11.93% 9.44%DAX ETF NAV-to-NAV(d) -5.26% 11.55% 11.82% 8.62%
Source: BlackRock, MSCI Barra and WM/Reuters
(a) Past performance figures shown are not indicative of the future performance of the Sub-Fund.(b) Total returns represent the rate that an investor would have earned (or lost) on an investment, assuming reinvestment of all dividends and distributions. Calculated as at 30th June/31st
December.(c) An investor cannot invest directly in an index and the index performance returns do not reflect management fees, transaction costs or other expenses, which would reduce performance
returns of the Sub-Fund.(d) Units in the Sub-Fund are issued and redeemed at NAV. Therefore, the Sub-Fund does not publish a bid price and the Sub-Fund’s returns have been calculated from NAV.(e) This is the annualized return since fund inception. The Sub-Fund inception date is 23rd June 2016.
The DAX Index is a free float-adjusted market capitalization weighted index that tracks the segment of the 30 largest and most important companies – known as blue chips – on the Frankfurt Stock Exchange. It is calculated and maintained by Deutsche Börse AG. The DAX Index is a gross total return index, meaning its performance is calculated on the basis that dividends gross of tax are reinvested.
Fund ActivitiesThe average daily trading volume for the DAX ETF during the period was reported by Bloomberg to be approximately 32,428 units. As at 30th June 2018, the DAX ETF comprised 2,400,000 outstanding units.
Index ActivitiesThe DAX Index underwent two regular reviews during the period. As at 30th June 2018, the DAX ETF held all constituents in the DAX Index.
iShares DAX Index ETFReport of the Manager to the Unitholders
(a Sub-Fund of iShares Asia Trust)

18 iShares Asia Trust
IntroductionThe iShares EURO STOXX 50 Index ETF (the “EURO STOXX 50 ETF”) (the “Sub-Fund”), a sub-fund of the iShares Asia Trust (the “Trust”), was launched on 23rd June 2016 and commenced trading under the stock codes 83155 for the RMB counter, 9155 for the USD counter and 3155 for the HKD counter on The Stock Exchange of Hong Kong Limited (the “SEHK”) on 29th June 2016. The EURO STOXX 50 ETF is a Hong Kong unit trust authorized under the Securities and Futures Ordinance (Cap. 571) of Hong Kong. The EURO STOXX 50 ETF is benchmarked against the EURO STOXX 50 Index. The manager of the EURO STOXX 50 ETF is BlackRock Asset Management North Asia Limited (the “Manager”) and the trustee is HSBC Institutional Trust Services (Asia) Limited (the “Trustee”).
Fund PerformanceThe EURO STOXX 50 ETF seeks to provide investment results, before fees and expenses, that closely correspond to the performance of the EURO STOXX 50 Index in the Euro (“EUR”) terms. As at 30th June 2018, the Dealing NAV per unit of the EURO STOXX 50 ETF was EUR1.10 and there were 3,000,000 units outstanding. The total size of the Sub-Fund was approximately EUR3.3 million.
A summary of the performance of the EURO STOXX 50 ETF(a) is given below.
Total Return(b) in EUR
01.01.2018 to
30.06.2018
01.01.2017 to
31.12.2017
23.06.2016 (date of
inception) to 31.12.2016
23.06.2016 (date of
inception) to 30.06.2018(e)
EURO STOXX 50 Index(c) -0.98% 9.15% 8.93% 8.42%
EURO STOXX 50 ETF NAV-to-NAV(d) -1.02% 8.96% 8.79% 8.23%
Source: BlackRock, MSCI Barra and WM/Reuters
(a) Past performance figures shown are not indicative of the future performance of the Sub-Fund.(b) Total returns represent the rate that an investor would have earned (or lost) on an investment, assuming reinvestment of all dividends and distributions. Calculated as at 30th June/31st
December.(c) An investor cannot invest directly in an index and the index performance returns do not reflect management fees, transaction costs or other expenses, which would reduce performance
returns of the Sub-Fund.(d) Units in the Sub-Fund are issued and redeemed at NAV. Therefore, the Sub-Fund does not publish a bid price and the Sub-Fund’s returns have been calculated from NAV.(e) This is the annualized return since fund inception. The Sub-Fund inception date is 23rd June 2016.
The EURO STOXX 50 Index is a free float-adjusted market capitalization-weighted index. It represents the 50 largest companies in terms of free-float market capitalization in 11 Eurozone countries. It is calculated and maintained by STOXX Limited. The EURO STOXX 50 Index is a net total return index, meaning its performance is calculated on the basis that dividends net of tax are reinvested.
Fund ActivitiesThe average daily trading volume for the EURO STOXX 50 ETF during the period was reported by Bloomberg to be approximately 34,527 units. As at 30th June 2018, the EURO STOXX 50 ETF comprised 3,000,000 outstanding units.
Index ActivitiesThe EURO STOXX 50 Index underwent two regular reviews during the period. As at 30th June 2018, the EURO STOXX 50 ETF held all constituents in the EURO STOXX 50 Index.
iShares EURO STOXX 50 Index ETFReport of the Manager to the Unitholders
(a Sub-Fund of iShares Asia Trust)

Semi-annual Report 19
IntroductionThe iShares FTSE 100 Index ETF (the “FTSE 100 ETF”) (the “Sub-Fund”), a sub-fund of the iShares Asia Trust (the “Trust”), was launched on 23rd June 2016 and commenced trading under the stock codes 82847 for the RMB counter, 9847 for the USD counter and 2847 for the HKD counter on The Stock Exchange of Hong Kong Limited (the “SEHK”) on 29th June 2016. The FTSE 100 ETF is a Hong Kong unit trust authorized under the Securities and Futures Ordinance (Cap. 571) of Hong Kong. The FTSE 100 ETF is benchmarked against the FTSE 100 Index. The manager of the FTSE 100 ETF is BlackRock Asset Management North Asia Limited (the “Manager”) and the trustee is HSBC Institutional Trust Services (Asia) Limited (the “Trustee”).
Fund PerformanceThe FTSE 100 ETF seeks to provide investment results, before fees and expenses, that closely correspond to the performance of the FTSE 100 Index in British Pound (“GBP”) terms. As at 30th June 2018, the Dealing NAV per unit of the FTSE 100 ETF was GBP0.94 and there were 2,600,000 units outstanding. The total size of the Sub-Fund was approximately GBP2.4 million.
A summary of the performance of the FTSE 100 ETF(a) is given below.
Total Return(b) in GBP
01.01.2018 to
30.06.2018
01.01.2017 to
31.12.2017
23.06.2016 (date of
inception) to 31.12.2016
23.06.2016 (date of
inception) to 30.06.2018(e)
FTSE 100 Index(c) 1.65% 11.91% 14.63% 14.05%FTSE 100 ETF NAV-to-
NAV(d) 1.41% 11.56% 14.46% 13.66%
Source: BlackRock, MSCI Barra and WM/Reuters
(a) Past performance figures shown are not indicative of the future performance of the Sub-Fund.(b) Total returns represent the rate that an investor would have earned (or lost) on an investment, assuming reinvestment of all dividends and distributions. Calculated as at 30th June/31st
December.(c) An investor cannot invest directly in an index and the index performance returns do not reflect management fees, transaction costs or other expenses, which would reduce performance
returns of the Sub-Fund.(d) Units in the Sub-Fund are issued and redeemed at NAV. Therefore, the Sub-Fund does not publish a bid price and the Sub-Fund’s returns have been calculated from NAV.(e) This is the annualized return since fund inception. The Sub-Fund inception date is 23rd June 2016.
The FTSE 100 Index is a free float market capitalization-weighted index of UK-listed blue chips companies. It is designed to measure the performance of the 100 largest UK companies listed on the London Stock Exchange (the “LSE”) by full market capitalization, i.e. before the application of any investability weights. It is calculated and maintained by FTSE International Limited (“FTSE”). The FTSE 100 Index is a net total return index, meaning its performance is calculated on the basis that dividends net of tax are reinvested.
Fund ActivitiesThe average daily trading volume for the FTSE 100 ETF during the period was reported by Bloomberg to be approximately 10,133 units. As at 30th June 2018, the FTSE 100 ETF comprised 2,600,000 outstanding units.
Index ActivitiesThe FTSE 100 Index underwent two regular reviews during the period. As at 30th June 2018, the FTSE 100 ETF held all constituents in the FTSE 100 Index.
iShares FTSE 100 Index ETFReport of the Manager to the Unitholders
(a Sub-Fund of iShares Asia Trust)

20 iShares Asia Trust
IntroductionThe iShares NASDAQ 100 Index ETF (the “NASDAQ 100 ETF”) (the “Sub-Fund”), a sub-fund of the iShares Asia Trust (the “Trust”), was launched on 22nd June 2016 and commenced trading under the stock codes 82834 for the RMB counter, 9834 for the USD counter and 2834 for the HKD counter on The Stock Exchange of Hong Kong Limited (the “SEHK”) on 29th June 2016. The NASDAQ 100 ETF is a Hong Kong unit trust authorized under the Securities and Futures Ordinance (Cap. 571) of Hong Kong. The NASDAQ 100 ETF is benchmarked against the NASDAQ 100 Index. The manager of the NASDAQ 100 ETF is BlackRock Asset Management North Asia Limited (the “Manager”) and the trustee is HSBC Institutional Trust Services (Asia) Limited (the “Trustee”).
Fund PerformanceThe NASDAQ 100 ETF seeks to provide investment results, before fees and expenses, that closely correspond to the performance of the NASDAQ 100 Index in United States dollar (“US$”) terms. As at 30th June 2018, the Dealing NAV per unit of the NASDAQ 100 ETF was US$1.68 and there were 7,000,000 units outstanding. The total size of the Sub-Fund was approximately US$10.1 million.
A summary of the performance of the NASDAQ 100 ETF(a) is given below.
Total Return(b) in US$
01.01.2018 to
30.06.2018
01.01.2017 to
31.12.2017
22.06.2016 (date of
inception) to 31.12.2016
22.06.2016 (date of
inception) to 30.06.2018(e)
NASDAQ 100 Index(c) 10.48% 32.53% 10.91% 27.09%NASDAQ 100 ETF
NAV-to-NAV(d) 10.27% 32.05% 10.73% 26.64%
Source: BlackRock, MSCI Barra and WM/Reuters
(a) Past performance figures shown are not indicative of the future performance of the Sub-Fund.(b) Total returns represent the rate that an investor would have earned (or lost) on an investment, assuming reinvestment of all dividends and distributions. Calculated as at 30th June/31st
December.(c) An investor cannot invest directly in an index and the index performance returns do not reflect management fees, transaction costs or other expenses, which would reduce performance
returns of the Sub-Fund.(d) Units in the Sub-Fund are issued and redeemed at NAV. Therefore, the Sub-Fund does not publish a bid price and the Sub-Fund’s returns have been calculated from NAV.(e) This is the annualized return since fund inception. The Sub-Fund inception date is 22nd June 2016.
The NASDAQ 100 Index is a modified market capitalization-weighted index. It includes 100 of the largest US and international non-financial companies listed on The NASDAQ Stock Market LLC (“NASDAQ”) based on market capitalization. It is calculated and maintained by The NASDAQ OMX Group Inc. or its affiliates. The NASDAQ 100 Index is a net total return index, meaning its performance is calculated on the basis that dividends net of tax are reinvested.
Fund ActivitiesThe average daily trading volume for the NASDAQ 100 ETF during the period was reported by Bloomberg to be approximately 58,123 units. As at 30th June 2018, the NASDAQ 100 ETF comprised 7,000,000 outstanding units.
Index ActivitiesThe NASDAQ 100 Index underwent two regular reviews during the period. As at 30th June 2018, the NASDAQ 100 ETF held all constituents in the NASDAQ 100 Index.
iShares NASDAQ 100 Index ETFReport of the Manager to the Unitholders
(a Sub-Fund of iShares Asia Trust)

Semi-annual Report 21
IntroductionThe iShares Core Hang Seng Index ETF (the “Hang Seng ETF”) (the “Sub-Fund”), a sub-fund of the iShares Asia Trust (the “Trust”), was launched on 18th November 2016 and commenced trading under the stock codes 83115 for the RMB counter, 9115 for the USD counter and 3115 for the HKD counter on The Stock Exchange of Hong Kong Limited (the “SEHK”) on 23rd November 2016. The Hang Seng ETF is a Hong Kong unit trust authorized under the Securities and Futures Ordinance (Cap. 571) of Hong Kong. The Hang Seng ETF is benchmarked against the Hang Seng Index (net total return version) (“HSI Net Total Return Index”). The manager of the Hang Seng ETF is BlackRock Asset Management North Asia Limited (the “Manager”) and the trustee is HSBC Institutional Trust Services (Asia) Limited (the “Trustee”).
Fund PerformanceThe Hang Seng ETF seeks to provide investment results, before fees and expenses, that closely correspond to the performance of the HSI Net Total Return Index. As at 30th June 2018, the Dealing NAV per unit of the Hang Seng ETF was HK$104.98 and there were 2,800,000 units outstanding. The total size of the Sub-Fund was approximately HK$294.0 million.
A summary of the performance of the Hang Seng ETF(a) is given below.
Total Return(b) in HK$
01.01.2018 to
30.06.2018
01.01.2017 to
31.12.2017
18.11.2016 (date of
inception) to 31.12.2016
18.11.2016 (date of
inception) to 30.06.2018(e)
HSI Net Total Return Index(c) -1.68% 41.04% -1.47% 21.30%
Hang Seng ETF NAV-to-NAV(d) -1.72% 40.70% -1.48% 21.08%
Source: BlackRock, MSCI Barra and WM/Reuters
(a) Past performance figures shown are not indicative of the future performance of the Sub-Fund.(b) Total returns represent the rate that an investor would have earned (or lost) on an investment, assuming reinvestment of all dividends and distributions. Calculated as at 30th June/31st
December.(c) An investor cannot invest directly in an index and the index performance returns do not reflect management fees, transaction costs or other expenses, which would reduce performance
returns of the Sub-Fund.(d) Units in the Sub-Fund are issued and redeemed at NAV. Therefore, the Sub-Fund does not publish a bid price and the Sub-Fund’s returns have been calculated from NAV.(e) This is the annualized return since fund inception. The Sub-Fund inception date is 18th November 2016.
The HSI Net Total Return Index adopts a free float adjusted market capitalization-weighted methodology with a 10% cap on individual securities. The universe of securities of HSI Net Total Return Index includes stocks and real estate investment trusts primarily listed on the main board of The Stock Exchange of Hong Kong Limited (“SEHK”), excluding securities that are secondary listings, foreign companies, preference shares, debt securities, mutual funds and other derivatives. Securities need to meet eligibility requirements based on market value, turnover and listing history, and H-shares are only included if they meet specific additional requirements. Final selections are based on the market capitalization and turnover rank of securities, the representation of the relevant sub-sector within the HSI Net Total Return Index directly reflecting that of the market and the financial performance. The review of HSI Net Total Return Index is conducted quarterly.
Fund ActivitiesThe average daily trading volume for the Hang Seng ETF during the period was reported by Bloomberg to be approximately 115,742 units. As at 30th June 2018, the Hang Seng ETF comprised 2,800,000 outstanding units.
In accordance with the Dividend Announcement on 25th May 2018, semi-annual distribution of HK$0.61 was declared, corresponding with an ex-dividend date of 19th June 2018, and a record date of 20th June 2018. The distribution was paid on 29th June 2018.
Index ActivitiesThe HSI Net Total Return Index underwent two regular reviews during the period. As at 30th June 2018, the Hang Seng held all constituents in the HSI Net Total Return Index.
iShares Core Hang Seng Index ETFReport of the Manager to the Unitholders
(a Sub-Fund of iShares Asia Trust)

22 iShares Asia Trust
Condensed Statement of Financial PositionAs at 30th June 2018
iShares MSCI China Index ETFiShares MSCI China A
International Index ETF
Note
30.06.2018(Unaudited)
HK$
31.12.2017(Audited)
HK$
30.06.2018(Unaudited)
RMB
31.12.2017(Audited)
RMB
AssetsCurrent AssetsFinancial assets at fair value through profit or loss 10 2,580,350,435 2,404,732,674 – 67,058,219Dividends receivable 12,436,306 180,089 – –Interest receivable 1,056 115 – 19Other accounts receivable – – 1,033,862 –Margin deposits 3,749,300 – – –Bank balances 5(e) 19,785,115 3,042,526 430,090 402,529 Total assets 2,616,322,212 2,407,955,404 1,463,952 67,460,767 LiabilitiesCurrent LiabilitiesFinancial liabilities at fair value through profit or loss 246,150 – – –Margin deposits – 38 – –Amounts due to brokers 49,821 – – –Management fee payable 5(a) 1,173,184 1,039,811 – 24,612Other accounts payable – 47,817 1,463,952 1,694 Total liabilities 1,469,155 1,087,666 1,463,952 26,306 Net assets attributable to unitholders 2,614,853,057 2,406,867,738 – 67,434,461
The accompanying notes form part of these condensed financial statements.

Semi-annual Report 23
Condensed Statement of Financial Position (continued)
As at 30th June 2018
iShares FTSE A50 China Index ETF
Note
30.06.2018(Unaudited)
RMB
31.12.2017(Audited)
(Restated)RMB
31.12.2016(Audited)
(Restated)RMB
AssetsCurrent AssetsFinancial assets at fair value through profit or loss 10 16,878,899,283 25,710,715,018 25,695,502,131Interest receivable – 29,765 141Bank balances 5(e) 123,277,061 156,534,838 120,181,851 Total assets 17,002,176,344 25,867,279,621 25,815,684,123 LiabilitiesCurrent LiabilitiesAmount due to unitholders for repayment of subscription 2,307,630 – –Management fee payable 5(a) 13,541,611 19,365,658 21,859,332Securities lending expenses payable in respect of the collateral arrangements – 10,227,936 22,821,864Other accounts payable 132,000 41,759 192,605 Total liabilities 15,981,241 29,635,353 44,873,801 Net assets attributable to unitholders 16,986,195,103 25,837,644,268 25,770,810,322
The accompanying notes form part of these condensed financial statements.

24 iShares Asia Trust
Condensed Statement of Financial Position (continued)
As at 30th June 2018
iShares Core S&P BSE SENSEX India Index ETF
Note
30.06.2018(Unaudited)
US$
31.12.2017(Audited)
(Restated)US$
31.12.2016(Audited)
(Restated)US$
AssetsCurrent AssetsFinancial assets at fair value through profit or loss 10 128,600,526 139,989,131 102,899,831Interest receivable 305 11 –Amounts due from brokers 3,639,638 – –Bank balances 5(e) 542,405 849,141 272,651 Total assets 132,782,874 140,838,283 103,172,482 LiabilitiesCurrent LiabilitiesAmounts due to unitholders for redemptions 3,653,520 – –Management fee payable 5(a) 38,491 45,452 39,934Other accounts payable 2,000 3,838 – Total liabilities 3,694,011 49,290 39,934 Net assets attributable to unitholders 129,088,863 140,788,993 103,132,548
The accompanying notes form part of these condensed financial statements.

Semi-annual Report 25
Condensed Statement of Financial Position (continued)
As at 30th June 2018
iShares Core MSCI AC Asia ex Japan Index ETF
Note
30.06.2018(Unaudited)
US$
31.12.2017(Audited)
(Restated)US$
31.12.2016(Audited)
(Restated)US$
AssetsCurrent AssetsFinancial assets at fair value through profit or loss 10 717,480,249 946,592,837 541,907,920Dividends receivable 2,653,922 1,296,777 88,992Interest receivable 9,635 84 1Bank balances 5(e) 1,924,117 2,696,433 1,345,287 Total assets 722,067,923 950,586,131 543,342,200 LiabilitiesCurrent LiabilitiesAmounts due to brokers 11,907 1,180,682 –Management fee payable 5(a) 113,282 111,695 61,828Tax payable 9,138 – –Other accounts payable 6,000 22,417 5,384 Total liabilities 140,327 1,314,794 67,212 Net assets attributable to unitholders 721,927,596 949,271,337 543,274,988
The accompanying notes form part of these condensed financial statements.

26 iShares Asia Trust
Condensed Statement of Financial Position (continued)
As at 30th June 2018
iShares MSCIEmerging Asia Index ETF iShares Core CSI 300 Index ETF
Note
30.06.2018(Unaudited)
HK$
31.12.2017(Audited)
HK$
30.06.2018(Unaudited)
RMB
31.12.2017(Audited)
(Restated)RMB
31.12.2016(Audited)
(Restated)RMB
AssetsCurrent AssetsFinancial assets at fair value through profit or loss 10 170,780,694 179,930,047 113,784,033 150,163,958 172,138,268Management fee reimbursement receivable – – 19,607 13,713 –Dividends receivable 638,745 263,633 – – 2,864Interest receivable 4 9 20 80 2Bank balances 5(e) 687,535 221,538 657,589 180,755 1,722,258 Total assets 172,106,978 180,415,227 114,461,249 150,358,506 173,863,392 LiabilitiesCurrent LiabilitiesManagement fee payable 5(a) 65,647 66,569 – – 150,719Securities lending expenses payable in respect of the
collateral arrangements – – – – 387,854Other accounts payable – 4,808 12,000 – 84,847 Total liabilities 65,647 71,377 12,000 – 623,420 Net assets attributable to unitholders 172,041,331 180,343,850 114,449,249 150,358,506 173,239,972
The accompanying notes form part of these condensed financial statements.

Semi-annual Report 27
Condensed Statement of Financial Position (continued)
As at 30th June 2018
iShares Core KOSPI200 Index ETF
iShares Core MSCITaiwan Index ETF
Note
30.06.2018(Unaudited)
US$
31.12.2017(Audited)
US$
30.06.2018(Unaudited)
US$
31.12.2017(Audited)
US$
AssetsCurrent AssetsFinancial assets at fair value through profit or loss 10 8,949,030 13,611,268 151,161,334 31,310,877Dividends receivable – 103,008 1,566,976 –Interest receivable 11 3 2,720 1Margin deposits – – 67,610 1Bank balances 5(e) 13,220 10,481 14,800 29,702 Total assets 8,962,261 13,724,760 152,813,440 31,340,581 LiabilitiesCurrent LiabilitiesManagement fee payable 5(a) 1,934 2,937 28,411 5,801Other accounts payable – 2,540 2,000 315 Total liabilities 1,934 5,477 30,411 6,116 Net assets attributable to unitholders 8,960,327 13,719,283 152,783,029 31,334,465
The accompanying notes form part of these condensed financial statements.

28 iShares Asia Trust
Condensed Statement of Financial Position (continued)
As at 30th June 2018
iShares DAX Index ETF iShares EURO STOXX 50 Index ETF
Note
30.06.2018(Unaudited)
EUR
31.12.2017(Audited)
EUR
30.06.2018(Unaudited)
EUR
31.12.2017(Audited)
EUR
AssetsCurrent AssetsFinancial assets at fair value through profit or loss 10 2,650,809 2,805,291 3,296,935 3,319,501Dividends receivable – – – 2,536Management fee reimbursement receivable 406 – 1,591 –Amounts due from brokers – 1,173,753 – 668,165Bank balances 5(e) 4,301 2,437 2,396 18,344 Total assets 2,655,516 3,981,481 3,300,922 4,008,546 LiabilitiesCurrent LiabilitiesAmounts due to unitholders for redemptions – 1,173,312 – 670,753Management fee payable 5(a) – 818 – 631Interest payable 4 34 4 24Other accounts payable – 4,321 – 2,221 Total liabilities 4 1,178,485 4 673,629 Net assets attributable to unitholders 2,655,512 2,802,996 3,300,918 3,334,917
The accompanying notes form part of these condensed financial statements.

Semi-annual Report 29
Condensed Statement of Financial Position (continued)
As at 30th June 2018
iShares FTSE 100 Index ETF iShares NASDAQ 100 Index ETF
Note
30.06.2018(Unaudited)
GBP
31.12.2017(Audited)
GBP
30.06.2018(Unaudited)
US$
31.12.2017(Audited)
US$
AssetsCurrent AssetsFinancial assets at fair value through profit or loss 10 2,423,000 2,762,021 11,749,555 9,116,638Dividends receivable 12,588 13,611 1,483 1,626Interest receivable 1 – 8 2Management fee reimbursement receivable 3 – – –Amounts due from brokers 118 736,856 – 4,173Amount due from unitholders for subscription – – 1,680,214 –Bank balances 5(e) 8,715 12,724 8,592 26,570 Total assets 2,444,425 3,525,212 13,439,852 9,149,009 LiabilitiesCurrent LiabilitiesAmounts due to brokers – – 1,677,934 4,764Amounts due to unitholders for redemptions – 741,564 – –Management fee payable 5(a) – 387 2,173 1,958Other accounts payable – 1,836 – 875 Total liabilities – 743,787 1,680,107 7,597 Net assets attributable to unitholders 2,444,425 2,781,425 11,759,745 9,141,412
The accompanying notes form part of these condensed financial statements.

30 iShares Asia Trust
Condensed Statement of Financial Position (continued)
As at 30th June 2018
iShares Core Hang Seng Index ETF
Note
30.06.2018(Unaudited)
HK$
31.12.2017(Audited)
HK$
AssetsCurrent AssetsFinancial assets at fair value through profit or loss 10 291,241,047 343,314,064Dividends receivable 1,540,948 –Interest receivable 14 35Margin deposits 216,410 19,850Bank balances 5(e) 980,350 468,849 Total assets 293,978,769 343,802,798 LiabilitiesCurrent LiabilitiesFinancial liabilities at fair value through profit or loss 8,750 –Management fee payable 5(a) 12,715 20,645Other accounts payable – 15,000 Total liabilities 21,465 35,645 Net assets attributable to unitholders 293,957,304 343,767,153
The accompanying notes form part of these condensed financial statements.

Semi-annual Report 31
Condensed Statement of Comprehensive IncomeFor the period ended 30th June 2018
iShares MSCI China Index ETFiShares MSCI China A
International Index ETF
Note
01.01.2018to 30.06.2018
(Unaudited)HK$
01.01.2017to 30.06.2017
(Unaudited)HK$
01.01.2018to 30.06.2018
(Unaudited)RMB
01.01.2017to 30.06.2017
(Unaudited)RMB
IncomeDividend income 25,473,141 20,344,184 13,043 575,397Bank interest income 1,288 254 21,192 598Net gain/(loss) on financial assets at fair value through
profit or loss (65,703,637) 342,826,939 44,065 6,072,003Other income 255 – – –Net foreign currency gain/(loss) (63,555) 18,194 (2,839) 190 Total net income/(loss) (40,292,508) 363,189,571 75,461 6,648,188 ExpensesManagement fee 5(a) (7,724,777) (4,735,438) (110,824) (204,016)Transaction handling fee 5(b) (5,676) (11,491) (156,212) (22,705)Transaction costs on financial assets at fair value through
profit or loss 5(d) (502,135) (47,553) (118,943) (8,072)Safe custody and bank charges 5(b) (7,132) (34,679) (69,552) (172,465) Total operating expenses (8,239,720) (4,829,161) (455,531) (407,258) Operating profit/(loss) (48,532,228) 358,360,410 (380,070) 6,240,930Finance CostsInterest expense – – (30) – Profit/(loss) before taxation (48,532,228) 358,360,410 (380,100) 6,240,930Taxation (1,733,678) (1,538,926) (1,340) (57,596) Total comprehensive income/(loss) (50,265,906) 356,821,484 (381,440) 6,183,334
The accompanying notes form part of these condensed financial statements.

32 iShares Asia Trust
Condensed Statement of Comprehensive Income (continued)
For the period ended 30th June 2018
iShares FTSEA50 China Index ETF
iShares Core S&P BSE SENSEXIndia Index ETF
Note
01.01.2018to 30.06.2018
(Unaudited)RMB
01.01.2017to 30.06.2017
(Unaudited)(Restated)
RMB
01.01.2018to 30.06.2018
(Unaudited)US$
01.01.2017to 30.06.2017
(Unaudited)(Restated)
US$
IncomeDividend income 224,150,441 243,129,523 – –Bank interest income 304,763 272,668 1,540 35Net gain/(loss) on financial assets at fair value through
profit or loss (1,867,030,446) 3,464,965,055 (4,094,927) 23,705,603Net foreign currency gain/(loss) (18,018,905) (40,319,270) (77) (1,524) Total net income/(loss) (1,660,594,147) 3,668,047,976 (4,093,464) 23,704,114 ExpensesManagement fee 5(a) (98,324,124) (121,670,630) (283,444) (272,484)Transaction handling fee 5(b) (57,890) (511,865) – –Transaction costs on financial assets at fair value through
profit or loss 5(d) (17,277,638) (29,368,358) – –Safe custody and bank charges 5(b) (16,256) (39,981) (102) (103)Securities lending expenses in respect of the collateral
arrangements (389,335) (82,748,723) – – Total operating expenses (116,065,243) (234,339,557) (283,546) (272,587) Operating profit/(loss) (1,776,659,390) 3,433,708,419 (4,377,010) 23,431,527Finance CostsInterest expense (254,762) (1,955,034) – – Profit/(loss) before taxation (1,776,914,152) 3,431,753,385 (4,377,010) 23,431,527Taxation (22,439,780) (24,336,503) – – Total comprehensive income/(loss) (1,799,353,932) 3,407,416,882 (4,377,010) 23,431,527
The accompanying notes form part of these condensed financial statements.

Semi-annual Report 33
Condensed Statement of Comprehensive Income (continued)
For the period ended 30th June 2018
iShares Core MSCI AC Asia ex Japan Index ETF
iShares MSCIEmerging Asia Index ETF
Note
01.01.2018to 30.06.2018
(Unaudited)US$
01.01.2017to 30.06.2017
(Unaudited)(Restated)
US$
01.01.2018to 30.06.2018
(Unaudited)HK$
01.01.2017to 30.06.2017
(Unaudited)HK$
IncomeDividend income 9,824,301 10,270,794 1,686,863 1,622,927Bank interest income 13,613 418 24 18Net gain/(loss) on financial assets at fair value through
profit or loss (37,963,560) 128,830,777 (9,245,905) 28,009,726Net foreign currency gain/(loss) (471,550) (10,668) (2,777) 25,451Other income – 41,968 – – Total net income/(loss) (28,597,196) 139,133,289 (7,561,795) 29,658,122 ExpensesManagement fee 5(a) (970,842) (696,066) (478,248) (346,306)Transaction handling fee 5(b) (1,905) (4,785) (2,196) (8,240)Transaction costs on financial assets at fair value through
profit or loss 5(d) (564,540) (594,881) (21,960) (1,509)Safe custody and bank charges 5(b) (11,861) (33,785) (13,838) (24,743) Total operating expenses (1,549,148) (1,329,517) (516,242) (380,798) Operating profit/(loss) (30,146,344) 137,803,772 (8,078,037) 29,277,324Finance CostsInterest expense – – – (37) Profit/(loss) before taxation (30,146,344) 137,803,772 (8,078,037) 29,277,287Taxation (936,141) (1,151,166) (224,482) (233,160) Total comprehensive income/(loss) (31,082,485) 136,652,606 (8,302,519) 29,044,127
The accompanying notes form part of these condensed financial statements.

34 iShares Asia Trust
Condensed Statement of Comprehensive Income (continued)
For the period ended 30th June 2018
iShares Core CSI 300 Index ETF iShares Core KOSPI 200 Index ETF
Note
01.01.2018to 30.06.2018
(Unaudited)RMB
01.01.2017to 30.06.2017
(Unaudited)(Restated)
RMB
01.01.2018to 30.06.2018
(Unaudited)US$
01.01.2017to 30.06.2017
(Unaudited)US$
IncomeDividend income 1,194,915 1,072,106 80,997 50,882Bank interest income 1,180 3,466 66 19Net gain/(loss) on financial assets at fair value through
profit or loss (16,362,679) 14,419,647 (1,131,824) 3,441,422Net foreign currency gain/(loss) (39,188) (795,292) 1,706 12,723 Total net income/(loss) (15,205,772) 14,699,927 (1,049,055) 3,505,046 ExpensesManagement fee 5(a) (242,984) (422,604) (15,539) (21,688)Transaction handling fee 5(b) – (192,828) (3,780) (4,260)Transaction costs on financial assets at fair value through
profit or loss 5(d) (33,207) (633,763) (13,833) (15,435)Safe custody and bank charges 5(b) – (30,333) (1,912) (1,931)Securities lending expenses in respect of the collateral
arrangements – (126,388) – – Total operating expenses (276,191) (1,405,916) (35,064) (43,314) Operating profit/(loss) (15,481,963) 13,294,011 (1,084,119) 3,461,732Finance CostsInterest expense (7) (31,798) – – Profit/(loss) before taxation (15,481,970) 13,262,213 (1,084,119) 3,461,732Taxation (119,586) (107,543) (17,685) (11,141) Total comprehensive income/(loss) (15,601,556) 13,154,670 (1,101,804) 3,450,591
The accompanying notes form part of these condensed financial statements.

Semi-annual Report 35
Condensed Statement of Comprehensive Income (continued)
For the period ended 30th June 2018
iShares Core MSCI Taiwan Index ETF iShares DAX Index ETF
Note
01.01.2018to 30.06.2018
(Unaudited)US$
01.01.2017to 30.06.2017
(Unaudited)US$
01.01.2018to 30.06.2018
(Unaudited)EUR
01.01.2017to 30.06.2017
(Unaudited)EUR
IncomeDividend income 1,991,380 247,932 77,158 175,190Bank interest income 2,915 20 – –Net gain/(loss) on financial assets at fair value through
profit or loss (9,334,994) 4,074,175 (208,088) 271,855Net foreign currency gain/(loss) (73,885) (427) (17) 177Other income – – 31 – Total net income/(loss) (7,414,584) 4,321,700 (130,916) 447,222 ExpensesManagement fee 5(a) (71,708) (32,958) (2,731) (6,365)Transaction handling fee 5(b) (675) (675) (448) (2,317)Transaction costs on financial assets at fair value through
profit or loss 5(d) (129,275) (416) (33) (386)Safe custody and bank charges 5(b) (102) (103) (83) (117) Total operating expenses (201,760) (34,152) (3,295) (9,185) Operating profit/(loss) (7,616,344) 4,287,548 (134,211) 438,037Finance CostsInterest expense – – (1) (2) Profit/(loss) before taxation (7,616,344) 4,287,548 (134,212) 438,035Taxation (415,364) (49,586) (13,272) (39,882) Total comprehensive income/(loss) (8,031,708) 4,237,962 (147,484) 398,153
The accompanying notes form part of these condensed financial statements.

36 iShares Asia Trust
Condensed Statement of Comprehensive Income (continued)
For the period ended 30th June 2018
iShares EURO STOXX 50 Index ETF iShares FTSE 100 Index ETF
Note
01.01.2018to 30.06.2018
(Unaudited)EUR
01.01.2017to 30.06.2017
(Unaudited)EUR
01.01.2018to 30.06.2018
(Unaudited)GBP
01.01.2017to 30.06.2017
(Unaudited)GBP
IncomeDividend income 91,164 137,955 55,596 103,530Bank interest income – – 2 –Net gain/(loss) on financial assets at fair value through
profit or loss (100,322) 241,932 (12,696) 83,140Net foreign currency gain/(loss) (38) 174 56 421Other income 21 – – – Total net income/(loss) (9,175) 380,061 42,958 187,091 ExpensesManagement fee 5(a) (3,323) (5,334) (2,387) (4,099)Transaction handling fee 5(b) (1,098) (2,272) (1,399) (1,728)Transaction costs on financial assets at fair value through
profit or loss 5(d) (179) (298) (595) (866)Safe custody and bank charges 5(b) (600) (1,849) (74) (82) Total operating expenses (5,200) (9,753) (4,455) (6,775) Operating profit/(loss) (14,375) 370,308 38,503 180,316Finance CostInterest expense – (4) (2) – Profit/(loss) before taxation (14,375) 370,304 38,501 180,316Taxation (19,624) (34,450) (1,585) (1,272) Total comprehensive income/(loss) (33,999) 335,854 36,916 179,044
The accompanying notes form part of these condensed financial statements.

Semi-annual Report 37
Condensed Statement of Comprehensive Income (continued)
For the period ended 30th June 2018
iShares NASDAQ 100 Index ETF iShares Core Hang Seng Index ETF
Note
01.01.2018to 30.06.2018
(Unaudited)US$
01.01.2017to 30.06.2017
(Unaudited)US$
01.01.2018to 30.06.2018
(Unaudited)HK$
18.11.2016(date of inception)
to 30.06.2017(Unaudited)
HK$
IncomeDividend income 50,762 49,272 5,051,103 9,892,624Bank interest income 40 8 57 83Net gain/(loss) on financial assets at fair value through
profit or loss 915,806 1,137,788 (7,688,730) 89,520,629Net foreign currency gain 2 7 1,419 4,232 Total net income/(loss) 966,610 1,187,075 (2,636,151) 99,417,568 ExpensesManagement fee 5(a) (13,628) (10,826) (145,561) (341,717)Transaction handling fee 5(b) (775) (1,275) – –Transaction costs on financial assets at fair value through
profit or loss 5(d) (246) (161) (29,052) (249,885)Safe custody and bank charges 5(b) (110) (118) – – Total operating expenses (14,759) (12,380) (174,613) (591,602) Operating profit/(loss) 951,851 1,174,695 (2,810,764) 98,825,966Finance CostInterest expense (1) – (1) – Profit/(loss) before taxation 951,850 1,174,695 (2,810,765) 98,825,966Taxation (13,731) (12,537) (143,764) (241,071) Total comprehensive income/(loss) 938,119 1,162,158 (2,954,529) 98,584,895
The accompanying notes form part of these condensed financial statements.

38 iShares Asia Trust
Condensed Statement of Changes in Net Assets Attributable to UnitholdersFor the period ended 30th June 2018
iShares MSCI China Index ETFiShares MSCI China A
International Index ETF
Note
01.01.2018to 30.06.2018
(Unaudited)HK$
01.01.2017to 30.06.2017
(Unaudited)HK$
01.01.2018to 30.06.2018
(Unaudited)RMB
01.01.2017to 30.06.2017
(Unaudited)RMB
Net assets attributable to unitholders at 1st January 2,406,867,738 1,408,875,090 67,434,461 66,072,138 Proceeds on issue of units 6
– in-kind 218,940,905 184,666,232 – –– cash component and cash subscription 92,696,170 64,797,209 – –
Payments on redemption of units 6– in-kind (39,501,718) – – –– cash component and cash redemption (13,884,132) – (67,053,021) –
258,251,225 249,463,441 (67,053,021) –
Total comprehensive income/(loss) for the period (50,265,906) 356,821,484 (381,440) 6,183,334 Net assets attributable to unitholders at 30th June 2,614,853,057 2,015,160,015 – 72,255,472
iShares FTSE A50China Index ETF
iShares Core S&P BSE SENSEXIndia Index ETF
Note
01.01.2018to 30.06.2018
(Unaudited)RMB
01.01.2017to 30.06.2017
(Unaudited)(Restated)
RMB
01.01.2018to 30.06.2018
(Unaudited)US$
01.01.2017to 30.06.2017
(Unaudited)(Restated)
US$
Net assets attributable to unitholders at 1st January 25,837,644,268 25,770,810,322 140,788,993 103,132,548 Proceeds on issue of units 6
– cash component and cash subscription 1,204,957,711 – – 9,741,151Payments on redemption of units 6
– in-kind – (1,452,553,674) – –– cash component and cash redemption (8,257,052,944) (1,923,740,722) (7,323,120) (7,438,089)
(7,052,095,233) (3,376,294,396) (7,323,120) 2,303,062
Total comprehensive income/(loss) for the period (1,799,353,932) 3,407,416,882 (4,377,010) 23,431,527 Net assets attributable to unitholders at 30th June 16,986,195,103 25,801,932,808 129,088,863 128,867,137
iShares Core MSCI AC Asia ex Japan Index ETF
iShares MSCIEmerging Asia Index ETF
Note
01.01.2018to 30.06.2018
(Unaudited)US$
01.01.2017to 30.06.2017
(Unaudited)(Restated)
US$
01.01.2018to 30.06.2018
(Unaudited)HK$
01.01.2017to 30.06.2017
(Unaudited)HK$
Net assets attributable to unitholders at 1st January 949,271,337 543,274,988 180,343,850 119,248,600 Proceeds on issue of units 6
– in-kind – 19,317,326 – –– cash component and cash subscription 58,115,027 377,912,601 – –
Payments on redemption of units 6– cash component and cash redemption (254,376,283) (200,003,177) – –
(196,261,256) 197,226,750 – –
Total comprehensive income/(loss) for the period (31,082,485) 136,652,606 (8,302,519) 29,044,127 Net assets attributable to unitholders at 30th June 721,927,596 877,154,344 172,041,331 148,292,727
The accompanying notes form part of these condensed financial statements.

Semi-annual Report 39
Condensed Statement of Changes in Net Assets Attributable to Unitholders (continued)
For the period ended 30th June 2018
iShares Core CSI 300 Index ETF iShares Core KOSPI 200 Index ETF
Note
01.01.2018to 30.06.2018
(Unaudited)RMB
01.01.2017to 30.06.2017
(Unaudited)(Restated)
RMB
01.01.2018to 30.06.2018
(Unaudited)US$
01.01.2017to 30.06.2017
(Unaudited)US$
Net assets attributable to unitholders at 1st January 150,358,506 173,239,972 13,719,283 13,482,417 Proceeds on issue of units 6
– cash component and cash subscription 6,213,600 – – –Payments on redemption of units 6
– cash component and cash redemption (26,521,301) (55,304,314) (3,657,152) (3,890,864)
(20,307,701) (55,304,314) (3,657,152) (3,890,864) Total comprehensive income/(loss) for the period (15,601,556) 13,154,670 (1,101,804) 3,450,591 Net assets attributable to unitholders at 30th June 114,449,249 131,090,328 8,960,327 13,042,144
iShares Core MSCI Taiwan Index ETF iShares DAX Index ETF
Note
01.01.2018to 30.06.2018
(Unaudited)US$
01.01.2017to 30.06.2017
(Unaudited)US$
01.01.2018to 30.06.2018
(Unaudited)EUR
01.01.2017to 30.06.2017
(Unaudited)EUR
Net assets attributable to unitholders at 1st January 31,334,465 19,839,444 2,802,996 6,072,518 Proceeds on issue of units 6
– cash component and cash subscription 129,480,272 – – –
129,480,272 – – – Total comprehensive income/(loss) for the period (8,031,708) 4,237,962 (147,484) 398,153 Net assets attributable to unitholders at 30th June 152,783,029 24,077,406 2,655,512 6,470,671
iShares EURO STOXX 50 Index ETF iShares FTSE 100 Index ETF
Note
01.01.2018to 30.06.2018
(Unaudited)EUR
01.01.2017to 30.06.2017
(Unaudited)EUR
01.01.2018to 30.06.2018
(Unaudited)GBP
01.01.2017to 30.06.2017
(Unaudited)GBP
Net assets attributable to unitholders at 1st January 3,334,917 5,100,840 2,781,425 3,988,702 Payments on redemption of units 6
– cash component and cash redemption – – (373,916) –
– – (373,916) – Total comprehensive income/(loss) for the period (33,999) 335,854 36,916 179,044 Net assets attributable to unitholders at 30th June 3,300,918 5,436,694 2,444,425 4,167,746
The accompanying notes form part of these condensed financial statements.

40 iShares Asia Trust
Condensed Statement of Changes in Net Assets Attributable to Unitholders (continued)
For the period ended 30th June 2018
iShares NASDAQ100 Index ETF
iShares Core Hang Seng Index ETF
Note
01.01.2018to 30.06.2018
(Unaudited)US$
01.01.2017to 30.06.2017
(Unaudited)US$
01.01.2018to 30.06.2018
(Unaudited)HK$
18.11.2016(date of inception)
to 30.06.2017(Unaudited)
HK$
Net assets attributable to unitholders at 1st January/date of inception 9,141,412 7,845,869 343,767,153 –
Proceeds on issue of units 6
– in-kind – – – 639,776,295– cash component and cash subscription 1,680,214 – – 139,222,269
Payments on redemption of units 6– in-kind – – (45,147,320) (602,462,363)– cash component and cash redemption – (953,455) – (15,367,613)
Distribution to unitholders – – (1,708,000) (2,236,500)
1,680,214 (953,455) (46,855,320) 158,932,088 Total comprehensive income/(loss) for the period 938,119 1,162,158 (2,954,529) 98,584,895 Net assets attributable to unitholders at 30th June 11,759,745 8,054,572 293,957,304 257,516,983
The accompanying notes form part of these condensed financial statements.
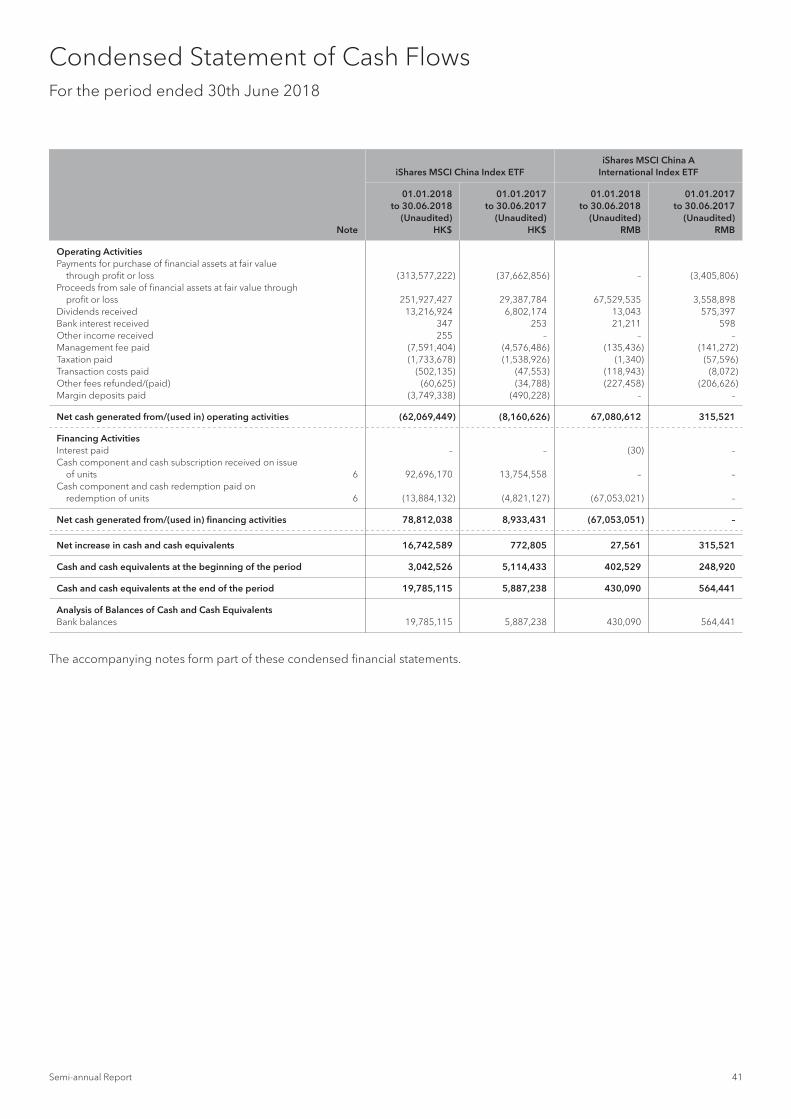
Semi-annual Report 41
Condensed Statement of Cash FlowsFor the period ended 30th June 2018
iShares MSCI China Index ETFiShares MSCI China A
International Index ETF
Note
01.01.2018to 30.06.2018
(Unaudited)HK$
01.01.2017to 30.06.2017
(Unaudited)HK$
01.01.2018to 30.06.2018
(Unaudited)RMB
01.01.2017to 30.06.2017
(Unaudited)RMB
Operating ActivitiesPayments for purchase of financial assets at fair value
through profit or loss (313,577,222) (37,662,856) – (3,405,806)Proceeds from sale of financial assets at fair value through
profit or loss 251,927,427 29,387,784 67,529,535 3,558,898Dividends received 13,216,924 6,802,174 13,043 575,397Bank interest received 347 253 21,211 598Other income received 255 – – –Management fee paid (7,591,404) (4,576,486) (135,436) (141,272)Taxation paid (1,733,678) (1,538,926) (1,340) (57,596)Transaction costs paid (502,135) (47,553) (118,943) (8,072)Other fees refunded/(paid) (60,625) (34,788) (227,458) (206,626)Margin deposits paid (3,749,338) (490,228) – – Net cash generated from/(used in) operating activities (62,069,449) (8,160,626) 67,080,612 315,521 Financing ActivitiesInterest paid – – (30) –Cash component and cash subscription received on issue
of units 6 92,696,170 13,754,558 – –Cash component and cash redemption paid on
redemption of units 6 (13,884,132) (4,821,127) (67,053,021) – Net cash generated from/(used in) financing activities 78,812,038 8,933,431 (67,053,051) – Net increase in cash and cash equivalents 16,742,589 772,805 27,561 315,521 Cash and cash equivalents at the beginning of the period 3,042,526 5,114,433 402,529 248,920 Cash and cash equivalents at the end of the period 19,785,115 5,887,238 430,090 564,441 Analysis of Balances of Cash and Cash EquivalentsBank balances 19,785,115 5,887,238 430,090 564,441
The accompanying notes form part of these condensed financial statements.

42 iShares Asia Trust
Condensed Statement of Cash Flows (continued)
For the period ended 30th June 2018
iShares FTSE A50 China Index ETF
iShares Core S&P BSE SENSEXIndia Index ETF
Note
01.01.2018to 30.06.2018
(Unaudited)RMB
01.01.2017to 30.06.2017
(Unaudited)(Restated)
RMB
01.01.2018to 30.06.2018
(Unaudited)US$
01.01.2017to 30.06.2017
(Unaudited)(Restated)
US$
Operating ActivitiesPayments for purchase of financial assets at fair value
through profit or loss (4,624,801,396) (11,183,801,783) – (92,458,045)Proceeds from sale of financial assets at fair value through
profit or loss 11,571,567,780 13,231,944,478 3,653,963 90,394,383Dividends received 224,150,441 237,803,589 – –Bank interest received 334,528 272,088 1,246 35Management fee paid (104,148,171) (123,683,881) (290,405) (262,107)Taxation paid (22,439,780) (24,336,503) – –Transaction costs paid (17,277,638) (29,368,358) – –Securities lending expenses paid in respect of the collateral
arrangements (10,617,271) (94,906,357) – –Other fees refunded/(paid) 16,095 (395,413) (1,940) (103) Net cash generated from/(used in) operating activities 7,016,784,588 2,013,527,860 3,362,864 (2,325,837) Financing ActivitiesInterest paid (254,762) (1,955,034) – –Cash component and cash subscription received on issue
of units 6 1,207,265,341 – – 9,741,151Cash component and cash redemption paid on
redemption of units 6 (8,257,052,944) (1,923,740,722) (3,669,600) (7,438,089) Net cash generated from/(used in) financing activities (7,050,042,365) (1,925,695,756) (3,669,600) 2,303,062 Net increase/(decrease) in cash and cash equivalents (33,257,777) 87,832,104 (306,736) (22,775) Cash and cash equivalents at the beginning of the period 156,534,838 120,181,851 849,141 272,651 Cash and cash equivalents at the end of the period 123,277,061 208,013,955 542,405 249,876 Analysis of Balances of Cash and Cash EquivalentsBank balances 123,277,061 208,013,955 542,405 249,876
The accompanying notes form part of these condensed financial statements.

Semi-annual Report 43
Condensed Statement of Cash Flows (continued)
For the period ended 30th June 2018
iShares Core MSCI AC Asia ex Japan Index ETF
iShares MSCIEmerging Asia Index ETF
Note
01.01.2018to 30.06.2018
(Unaudited)US$
01.01.2017to 30.06.2017
(Unaudited)(Restated)
US$
01.01.2018to 30.06.2018
(Unaudited)HK$
01.01.2017to 30.06.2017
(Unaudited)HK$
Operating ActivitiesPayments for purchase of financial assets at fair value
through profit or loss (106,260,949) (421,497,593) (9,149,434) (2,081,377)Proceeds from sale of financial assets at fair value through
profit or loss 295,769,652 239,775,204 9,050,105 1,234,697Dividends received 8,467,156 6,654,214 1,311,751 991,848Bank interest received 4,062 419 29 18Other income received – 41,968 – –Management fee paid (969,255) (683,472) (479,170) (337,263)Taxation paid (927,003) (1,151,166) (224,482) (233,160)Transaction costs paid (564,540) (594,881) (21,960) (1,509)Other fees paid (30,183) (39,851) (20,842) (40,424) Net cash generated from/(used in) operating activities 195,488,940 (177,495,158) 465,997 (467,170) Financing ActivitiesInterest paid – – – (37)Cash component and cash subscription received on issue
of units 6 58,115,027 377,912,601 – –Cash component and cash redemption paid on
redemption of units 6 (254,376,283) (200,003,177) – – Net cash generated from/(used in) financing activities (196,261,256) 177,909,424 – (37) Net increase/(decrease) in cash and cash equivalents (772,316) 414,266 465,997 (467,207) Cash and cash equivalents at the beginning of the period 2,696,433 1,345,287 221,538 667,971 Cash and cash equivalents at the end of the period 1,924,117 1,759,553 687,535 200,764 Analysis of Balances of Cash and Cash EquivalentsBank balances 1,924,117 1,759,553 687,535 200,764
The accompanying notes form part of these condensed financial statements.

44 iShares Asia Trust
Condensed Statement of Cash Flows (continued)
For the period ended 30th June 2018
iShares Core CSI 300 Index ETF iShares Core KOSPI 200 Index ETF
Note
01.01.2018to 30.06.2018
(Unaudited)RMB
01.01.2017to 30.06.2017
(Unaudited)(Restated)
RMB
01.01.2018to 30.06.2018
(Unaudited)US$
01.01.2017to 30.06.2017
(Unaudited)US$
Operating ActivitiesPayments for purchase of financial assets at fair value
through profit or loss (14,036,359) (134,395,513) (655,068) (877,587)Proceeds from sale of financial assets at fair value through
profit or loss 34,014,417 189,486,036 4,187,188 4,618,959Dividends received 1,194,915 1,074,970 184,005 208,421Bank interest received 1,240 3,468 58 19Management fee paid (248,878) (580,966) (16,542) (21,725)Taxation paid (119,586) (107,543) (17,685) (11,141)Transaction costs paid (33,207) (633,763) (13,833) (15,435)Securities lending expenses paid in respect of the collateral
arrangements – (514,242) – –Other fees refunded/(paid) 12,000 (284,008) (8,232) (4,961) Net cash generated from operating activities 20,784,542 54,048,439 3,659,891 3,896,550 Financing ActivitiesInterest paid (7) (31,798) – –Cash component and cash subscription received on issue
of units 6 6,213,600 – – –Cash component and cash redemption paid on
redemption of units 6 (26,521,301) (55,304,314) (3,657,152) (3,890,864) Net cash used in financing activities (20,307,708) (55,336,112) (3,657,152) (3,890,864) Net increase/(decrease) in cash and cash equivalents 476,834 (1,287,673) 2,739 5,686 Cash and cash equivalents at the beginning of the period 180,755 1,722,258 10,481 20,887 Cash and cash equivalents at the end of the period 657,589 434,585 13,220 26,573 Analysis of Balances of Cash and Cash EquivalentsBank balances 657,589 434,585 13,220 26,573
The accompanying notes form part of these condensed financial statements.

Semi-annual Report 45
Condensed Statement of Cash Flows (continued)
For the period ended 30th June 2018
iShares Core MSCI Taiwan Index ETF iShares DAX Index ETF
Note
01.01.2018to 30.06.2018
(Unaudited)US$
01.01.2017to 30.06.2017
(Unaudited)US$
01.01.2018to 30.06.2018
(Unaudited)EUR
01.01.2017to 30.06.2017
(Unaudited)EUR
Operating ActivitiesPayments for purchase of financial assets at fair value
through profit or loss (130,478,106) (125,888) (277,921) (470,262)Proceeds from sale of financial assets at fair value through
profit or loss 1,218,770 120,031 1,398,051 354,968Dividends received 424,404 49,745 77,158 175,190Bank interest received 196 20 – –Other income received – – 31 –Management fee paid (49,098) (32,368) (3,955) (6,587)Taxation paid (415,364) (49,586) (13,272) (39,882)Transaction costs paid (129,275) (416) (33) (386)Other fees refunded/(paid) 908 (2,803) (4,882) (7,774)Margin deposit paid (67,609) – – – Net cash generated from/(used in) operating activities (129,495,174) (41,265) 1,175,177 5,267 Financing ActivitiesInterest paid – – (1) (2)Cash component and cash subscription received on issue
of units 6 129,480,272 – – –Cash component and cash redemption paid on
redemption of units 6 – – (1,173,312) – Net cash generated from/(used in) financing activities 129,480,272 – (1,173,313) (2) Net increase/(decrease) in cash and cash equivalents (14,902) (41,265) 1,864 5,265 Cash and cash equivalents at the beginning of the period 29,702 78,395 2,437 16,906 Cash and cash equivalents at the end of the period 14,800 37,130 4,301 22,171 Analysis of Balances of Cash and Cash EquivalentsBank balances 14,800 37,130 4,301 22,171
The accompanying notes form part of these condensed financial statements.

46 iShares Asia Trust
Condensed Statement of Cash Flows (continued)
For the period ended 30th June 2018
iShares EURO STOXX 50 Index ETF iShares FTSE 100 Index ETF
Note
01.01.2018to 30.06.2018
(Unaudited)EUR
01.01.2017to 30.06.2017
(Unaudited)EUR
01.01.2018to 30.06.2018
(Unaudited)GBP
01.01.2017to 30.06.2017
(Unaudited)GBP
Operating ActivitiesPayments for purchase of financial assets at fair value
through profit or loss (263,485) (290,843) (154,496) (178,080)Proceeds from sale of financial assets at fair value through
profit or loss 853,856 188,364 1,217,615 90,608Dividends received 93,700 140,833 56,619 96,328Bank interest received – – 1 –Other income received 21 – – –Management fee paid (5,545) (5,618) (2,777) (4,351)Taxation paid (19,624) (34,450) (1,585) (1,272)Transaction costs paid (179) (298) (595) (866)Other fees paid (3,939) (9,761) (3,309) (4,254) Net cash generated from/(used in) operating activities 654,805 (11,773) 1,111,473 (1,887) Financing ActivitiesInterest paid – (4) (2) –Cash component and cash redemption paid on
redemption of units 6 (670,753) – (1,115,480) – Net cash used in financing activities (670,753) (4) (1,115,482) – Net decrease in cash and cash equivalents (15,948) (11,777) (4,009) (1,887) Cash and cash equivalents at the beginning of the period 18,344 27,172 12,724 14,809 Cash and cash equivalents at the end of the period 2,396 15,395 8,715 12,922 Analysis of Balances of Cash and Cash EquivalentsBank balances 2,396 15,395 8,715 12,922
The accompanying notes form part of these condensed financial statements.

Semi-annual Report 47
Condensed Statement of Cash Flows (continued)
For the period ended 30th June 2018
iShares NASDAQ 100 Index ETF iShares Core Hang Seng Index ETF
Note
01.01.2018to 30.06.2018
(Unaudited)US$
01.01.2017to 30.06.2017
(Unaudited)US$
01.01.2018to 30.06.2018
(Unaudited)HK$
18.11.2016(date of inception)
to 30.06.2017(Unaudited)
HK$
Operating ActivitiesPayments for purchase of financial assets at fair value
through profit or loss (228,015) (262,523) (13,723,658) (167,064,566)Proceeds from sale of financial assets at fair value through
profit or loss 188,249 1,179,918 12,970,794 39,916,660Dividends received 50,905 49,941 3,510,155 6,971,937Bank interest received 34 8 78 83Management fee paid (13,413) (11,288) (153,491) (329,966)Taxation paid (13,731) (12,537) (143,764) (241,071)Transaction costs paid (246) (161) (29,052) (249,885)Other fees refunded/(paid) (1,760) (7,318) (15,000) 30,000Margin deposits paid – – (196,560) (152,889) Net cash generated from/(used in) operating activities (17,977) 936,040 2,219,502 (121,119,697) Financing ActivitiesInterest paid (1) – (1) –Cash component and cash subscription received on issue
of units 6 – – – 139,222,269Cash component and cash redemption paid on
redemption of units 6 – (953,455) – (15,367,613)Distribution paid – – (1,708,000) (2,236,500) Net cash generated from/(used in) financing activities (1) (953,455) (1,708,001) 121,618,156 Net increase/(decrease) in cash and cash equivalents (17,978) (17,415) 511,501 498,459 Cash and cash equivalents at the beginning of the period 26,570 29,686 468,849 – Cash and cash equivalents at the end of the period 8,592 12,271 980,350 498,459 Analysis of Balances of Cash and Cash EquivalentsBank balances 8,592 12,271 980,350 498,459
The accompanying notes form part of these condensed financial statements.

48 iShares Asia Trust
Notes to the Unaudited Condensed Financial Statements
1 The TrustiShares Asia Trust (the “Trust”) is an umbrella unit trust governed by its Trust Deed dated 16th November 2001, as amended, (the “Trust Deed”) and authorized by the Securities and Futures Commission of Hong Kong (the “SFC”) pursuant to Section 104(1) of the Securities and Futures Ordinance.
As at 30th June 2018, the Trust has established fourteen sub-funds:
Name of Sub-Fund
Listing date on The Stock Exchange of Hong Kong Limited (The “SEHK”)
iShares MSCI China Index ETF 28th November 2001
iShares MSCI China A International Index ETF1
28th January 2016
iShares FTSE A50 China Index ETF 18th November 2004 for HKD counter
7th July 2017 for RMB counter
iShares Core S&P BSE SENSEX India Index ETF
2nd November 2006 for HKD counter
14th October 2016 for USD and RMB counter
iShares Core MSCI AC Asia ex Japan Index ETF
23rd April 2009 for HKD counter
14th October 2016 for USD and RMB counter
iShares MSCI Emerging Asia Index ETF 23rd April 2009
iShares Core CSI 300 Index ETF 18th November 2009 for HKD counter
28th February 2017 for USD and RMB counter
iShares Core KOSPI 200 Index ETF 29th June 2016
iShares Core MSCI Taiwan Index ETF 29th June 2016
iShares DAX Index ETF 29th June 2016
iShares EURO STOXX 50 Index ETF 29th June 2016
iShares FTSE 100 Index ETF 29th June 2016
iShares NASDAQ 100 Index ETF 29th June 2016
iShares Core Hang Seng Index ETF 23rd November 2016
1 On 1st June 2018, the Manager announced that the Sub-Fund was delisted from the SEHK.
The manager of the Trust is BlackRock Asset Management North Asia Limited (the “Manager”) and the trustee is HSBC Institutional Trust Services (Asia) Limited (the “Trustee”).
iShares MSCI China Index ETF (“MSCI China ETF”)The objective of the MSCI China ETF is to provide investment results that, before fees and expenses, closely correspond to the performance of the MSCI China Index. It is designed to track the equity market performance of (i) Chinese securities (including H-Shares, Red Chips and P Chips) listed on the SEHK (ii) B-shares of Chinese securities listed on the Shanghai Stock Exchange and Shenzhen Stock Exchange (and effective from 1st June 2018, China A-shares via Stock Connect) and (iii) companies traded outside the country of classification (i.e. foreign listed companies) including those traded by way of depositary receipts.
iShares MSCI China A International Index ETF (“MSCI China A ETF”)The objective of the MSCI China A ETF is to provide investment results that, before fees and expenses, closely correspond to the performance of the MSCI China A International Index. The MSCI China A International Index captures large and mid-cap representation of the Shanghai Stock Exchange and Shenzhen Stock Exchange and includes the China A-Share constituents of the MSCI China All Shares Index. The MSCI China A ETF may invest in China A-Shares through a combination of Renminbi Qualified Foreign Institutional Investor (“RQFII”) quota and the Stock Connect.
Taking into account the relevant factors, including in particular the relatively small Net Asset Value of the Sub-Fund, the Manager decided to exercise its power under the Trust Deed to terminate the Sub-Fund. The Sub-Fund ceased trading on the SEHK from 5th March 2018. On 17th May 2018, all unitholders in the Sub-Fund were compulsorily redeemed. On 1st June 2018, the Sub-Fund was delisted from the SEHK. The Sub-Fund will be terminated and seek to be de-authorized by the SFC on a date after the Manager and the Trustee have formed the view that there remains no actual or contingent assets or liabilities attributable to the Sub-Fund.
iShares FTSE A50 China Index ETF (“A50 China ETF”)The objective of the A50 China ETF is to provide investment results that, before fees and expenses, closely correspond to the performance of the FTSE China A50 Index. Until 2nd August 2013, the A50 China ETF did not hold A-Shares directly but rather gained access to the FTSE China A50 Index through China A-Share Access Products (“CAAPs”). Since 2nd August 2013, the A50 China ETF invests in A-Shares directly in addition to CAAPs. A CAAP represents only an obligation of each CAAP Issuer (“CAAP Issuer”) to provide the economic performance equivalent to holding the underlying A-Shares or A-Share index.

Semi-annual Report 49
Notes to the Unaudited Condensed Financial Statements (continued)
A50 China ETF changed its base currency from Hong Kong dollar (“HKD”) to Renminbi (“RMB”), effective 1st January 2018. This change has been made to align the base currency of the Sub-Fund with the currency of the Sub-Fund’s underlying index for performance measurement and for creation and redemption of units. Accordingly, the Sub-Fund has changed its functional and presentation currency from HKD to RMB, effective 1st January 2018.
On 30th June 2017, the Manager announced that, as a result of the transition from a “synthetic representative” sub-strategy to a “physical representative” sub-strategy, which resulted in the A50 China ETF’s holding in A-Shares and Physical A-Share ETF in aggregate, comprising more than 70% of the Net Asset Value of the A50 China ETF on an ongoing basis, the Manager had applied for and was granted approval by the Securities and Futures Commission of Hong Kong (“SFC”) to remove the SFC synthetic labelling condition (the “SFC Synthetic Labeling Condition”). The removal of the SFC Synthetic Labeling Condition took effect from 7th July 2017; accordingly, from that day onwards, the asterisk and annotation to the name of the A50 China ETF was removed and the name of A50 China ETF was changed from the “iShares FTSE A50 China Index ETF* (*This is a synthetic ETF)” to “iShares FTSE A50 China Index ETF”. On 1st December 2017, the Manager further announced that the A50 China ETF had completed its transition from a “synthetic representative” strategy to a “physical representative” strategy under which its holdings in A-Shares and Physical A-Share ETFs (for cash management and contingency purposes) in aggregate comprise 90% or more of its Net Asset Value on an ongoing basis, and that the Manager had applied to the SFC for, and has been granted, approval to remove the authorization condition imposed on the A50 China ETF by the SFC on 29th August 2011 whereby the Manager was (i) required to collateralize all counterparty exposures with a view to ensuring that the collateral held by the A50 China ETF must represent at least 100% of the A50 China ETF’s gross total counterparty exposure and (ii) where the A50 China ETF accepted collateral in the nature of equity securities, the A50 China ETF had to obtain collateral that has a market value of at least 120%, and for not-equity collateral, the Manager was required to adopt a prudent haircut policy (“SFC Collateral Condition”). The removal of the SFC Collateral Condition took effect from 1st January 2018.
As at 30th June 2018, there were seventeen (31st December 2017: seventeen) participating dealers and Nil (31st December 2017: one) CAAP Issuers for the A50 China ETF. A list of the CAAP Issuers as at 30th June 2018 and 31st December 2017 is set out in note 5(c).
iShares Core S&P BSE SENSEX India Index ETF (“SENSEX India ETF”)The objective of the SENSEX India ETF is to provide investment results that, before fees and expenses, closely correspond to the performance of the S&P BSE SENSEX Index.
The iShares BSE SENSEX Mauritius Company, a wholly-owned subsidiary of the SENSEX India ETF was incorporated in Mauritius (the “Mauritius Subsidiary”), to hold Indian securities and India Access Products (“IAPs”) on behalf of the SENSEX India ETF.
The SENSEX India ETF may invest up to 15% of its net asset value in IAPs; with a maximum exposure to any single issuer of 10% of its net asset value. For the period/year ended 30th June 2018 and 31st December 2017, the SENSEX India ETF did not hold any IAPs.
SENSEX India ETF has changed its base currency from Hong Kong dollar (“HKD”) to United States dollar (“USD”), effective 1st January 2018. This change has been made to align the base currency of the Sub-Fund with the currency of the Sub-Fund’s underlying index for performance measurement and for creation and redemption of units. Accordingly, the Sub-Fund has changed their functional and presentation currency from HKD to USD, effective 1st January 2018.
iShares Core MSCI AC Asia ex Japan Index ETF (“MSCI AC Asia ex Japan ETF”)The objective of the MSCI AC Asia ex Japan ETF is to provide investment results that, before fees and expenses, closely correspond to the performance of the MSCI All Country Asia ex Japan Index, and, prior to 27th July 2015, the MSCI Asia APEX 50 Index. The MSCI All Country Asia ex Japan Index consists of large and mid-cap stocks and the MSCI Asia APEX 50 Index consists of 50 largest stocks that meet the tradability criteria.
The MSCI AC Asia ex Japan ETF invests primarily in securities (including depositary receipts and, effective from 1st June 2018, A-Shares (by investing via Stock Connect)) included in the MSCI All Country Asia ex Japan Index, or in securities that are not included in the MSCI All Country Asia ex Japan Index, but which the Manager believes will help the MSCI AC Asia ex Japan ETF achieve its investment objective.
The MSCI AC Asia ex Japan ETF obtains exposure to the India constituents in the MSCI All Country Asia ex Japan Index (“Indian Constituents”) by (i) investing directly in India-listed securities as a Foreign Portfolio Investor registered with the Securities and Exchange Board of India; and/or (ii) other ETFs tracking indices which are highly correlated with the India portion of the MSCI All Country Asia ex Japan Index (“Underlying Indian ETFs”). In addition to the Underlying Indian ETFs, the Manager may also invest up to 10% of the MSCI AC Asia ex Japan ETF’s NAV in other ETF(s) for cash management and contingency purposes. There is no additional management fee charged to the MSCI AC Asia ex Japan ETF for holding any ETF managed by the Manager or an affiliate of the Manager, as detailed in note 5(a). The MSCI AC Asia ex Japan ETF may invest in financial derivative instruments for reducing tracking error, hedging purposes or to achieve its investment objective.

50 iShares Asia Trust
Notes to the Unaudited Condensed Financial Statements (continued)
MSCI AC Asia ex Japan ETF has changed its base currency from Hong Kong dollar (“HKD”) to United States dollar (“USD”), effective 1st January 2018. This change has been made to align the base currency of the Sub-Fund with the currency of the Sub-Fund’s underlying index for performance measurement and for creation and redemption of units. Accordingly, the Sub-Fund has changed its functional and presentation currency from HKD to USD, effective 1st January 2018.
iShares MSCI Emerging Asia Index ETF (“MSCI Emerging Asia ETF”)The objective of the MSCI Emerging Asia ETF is to provide investment results that, before fees and expenses, closely correspond to the performance of the MSCI EM Asia Index. The MSCI Emerging Asia ETF is designed to track the equity market performance of emerging countries in Asia. The MSCI Emerging Asia ETF invests primarily in securities (including (i) depositary receipts and (ii) effective from 1st June 2018, A-Shares (by investing via Stock Connect)) in the MSCI EM Asia Index, or in securities that are not included in the MSCI EM Asia Index, but which the Manager believes will help the Emerging Asia ETF achieve its investment objective.
The MSCI Emerging Asia ETF is not a registered Foreign Portfolio Investor (“FPI”) with the Securities and Exchange Investment Board of India (“SEBI”) and is investing in the SENSEX India ETF to gain exposure to the Indian market segment of the MSCI EM Asia Index. There is no additional management fee charged on MSCI Emerging Asia ETF’s holding of SENSEX India ETF, as detailed in note 5(a).
iShares Core CSI 300 Index ETF (“CSI 300 ETF”)The objective of the CSI 300 ETF is to provide investment results that, before fees and expenses, closely correspond to the performance of the CSI 300 Index. The CSI 300 Index is a diversified index consisting of 300 constituent stocks traded on the Shanghai and Shenzhen stock exchanges. Until 21st November 2016, the CSI 300 ETF did not hold A-Shares directly but rather gained access to the CSI 300 Index through investing in a combination of the iShares CSI Sector Index Funds2 and CAAPs or solely in CAAPs. Since 21st November 2016, the CSI 300 ETF primarily invests in A-Shares directly. On 17th February 2017, the Manager announced that the CSI 300 ETF had completed its transition from a “synthetic representative” strategy to a “physical representative” strategy under which its holding in A-Shares and Physical A-Share ETFs (for cash management and contingency purposes) in aggregate comprise 90% or more of its Net Asset Value on an ongoing basis. As at 30th June 2018 and 31st December 2017, the CSI 300 ETF solely invested in A-Share directly.
2 Referred to individually or collectively as the “CSI Sector Index Funds”.
CSI 300 ETF has changed its base currency from Hong Kong dollar (“HKD”) to Renminbi (“RMB”), effective 1st January 2018. This change has been made to align the base currency of the Sub-Fund with the currency of the Sub-Fund’s underlying index for performance measurement and for creation and redemption of units. Accordingly, the Sub-Fund has changed its functional and presentation currency from HKD to RMB, effective 1st January 2018.
iShares Core KOSPI 200 Index ETF (“KOSPI 200 ETF”)The objective of the KOSPI 200 ETF is to provide investment results that, before fees and expenses, closely correspond to the performance of the KOSPI 200 Net Total Return USD Index. The KOSPI 200 Net Total Return USD Index is a free float-adjusted market capitalization-weighted index based on 200 blue chip companies listed on the Korea Stock Market, which are selected on the basis of such factors as their market and sector representation and liquidity. It is calculated and maintained by the Korea Exchange. The KOSPI 200 Net Total Return USD Index is a net total return index, meaning that the performance of the KOSPI 200 Net Total Return USD Index is calculated on the basis that dividends net of tax are reinvested.
iShares Core MSCI Taiwan Index ETF (“MSCI Taiwan ETF”)The objective of the MSCI Taiwan ETF is to provide investment results that, before fees and expenses, closely correspond to the performance of the MSCI Taiwan Index. The MSCI Taiwan Index is a free float-adjusted market capitalization-weighted index covering approximately 85% of the Taiwan investable equity universe on a net total return basis with dividends net of tax reinvested, subject to a global minimum size requirement. It is calculated and maintained by MSCI Inc.
iShares DAX Index ETF (“DAX ETF”)The objective of the DAX ETF is to provide investment results that, before fees and expenses, closely correspond to the performance of the DAX Index. The DAX Index is a free float-adjusted market capitalization-weighted index that tracks the segment of the 30 largest and most important companies – known as blue chips – on the Frankfurt Stock Exchange. It is calculated and maintained by Deutsche Börse AG. The DAX Index is a gross total return index, meaning that the performance of the DAX Index is calculated on the basis that dividends gross of tax are reinvested.
iShares EURO STOXX 50 Index ETF (“EURO STOXX 50 ETF”)The objective of the EURO STOXX 50 ETF is to provide investment results that, before fees and expenses, closely correspond to the performance of the EURO STOXX 50 Index. The EURO STOXX 50 Index is a free float-adjusted market capitalization-weighted index. It represents the 50 largest companies – known as blue chips – in terms of free-float market capitalization in 12 Eurozone countries. It is calculated and maintained by STOXX Limited. The EURO STOXX 50 Index is net total return index, meaning the performance of the EURO STOXX 50 Index is calculated on the basis that dividends net of tax are reinvested.

Semi-annual Report 51
Notes to the Unaudited Condensed Financial Statements (continued)
iShares FTSE 100 Index ETF (“FTSE 100 ETF”)The objective of the FTSE 100 ETF is to provide investment results that, before fees and expenses, closely correspond to the performance of the FTSE 100 Index. The FTSE 100 Index is a free float market capitalization-weighted index of UK-listed blue chips companies. It is designed to measure the performance of the 100 largest UK companies listed on the London Stock Exchange (the “LSE”) by full market capitalization, i.e. before the application of any investability weights. It is calculated and maintained by FTSE International Limited (“FTSE”). The FTSE 100 Index is a net total return index, meaning the performance of the FTSE 100 Index is calculated on the basis that dividends net of tax are reinvested.
iShares NASDAQ 100 Index ETF (“NASDAQ 100 ETF”)The objective of the NASDAQ 100 ETF is to provide investment results that, before fees and expenses, closely correspond to the performance of the NASDAQ 100 Index. The NASDAQ 100 Index is a modified market capitalization-weighted index. It includes 100 of the largest US and international non-financial companies listed on The NASDAQ Stock Market LLC (“NASDAQ”) based on market capitalization. It is calculated and maintained by The NASDAQ OMX Group Inc. or its affiliates. The NASDAQ 100 Index is a net total return index, meaning the performance of the NASDAQ 100 Index is calculated on the basis that dividends net of tax are reinvested.
iShares Core Hang Seng Index ETF (“Hang Seng ETF”)The objective of the Hang Seng ETF is to provide investment results that, before fees and expenses, closely correspond to performance of the Hang Seng Index (net total return version) (“HSI Net Total Return Index”). The HSI Net Total Return Index is a net total return index, meaning that the performance of the index is calculated on the basis that dividends net of tax are reinvested. The HSI Net Total Return Index is compiled and managed by Hang Seng Indexes Company Limited (“HSIL”), a wholly-owned subsidiary of Hang Seng Bank Limited and which is a fellow subsidiary under the same group of the Trustee.
2 Summary of Significant Accounting Policies
These condensed semi-annual financial statements for the six months ended 30th June 2018 have been prepared in accordance with the International Accounting Standard (“IAS 34”) “Interim Financial Reporting”. The condensed semi-annual financial statements should be read in conjunction with the annual financial statements for the year ended 31st December 2017, which have been prepared in accordance with International Financial Reporting Standards (“IFRS”).
The accounting policies and methods of computation adopted in the preparation of the half year financial report are consistent with those of the annual financial statements for the year ended 31st December 2017, except for the translation of foreign currencies for A50 China ETF, SENSEX India ETF, MSCI AC Asia ex Japan ETF and CSI 300 ETF (see note 3(a)) as set out below.
Translation of foreign currencies
Functional and presentation currency
From 1st January 2018
A50 China ETF and CSI 300 ETFItems included in the financial statements are measured using the currency of the primary economic environment in which the Sub-Funds operate (the “functional currency”). The performance of the Sub-Funds are measured and reported to the unitholders in Renminbi (“RMB”). The Management considers the RMB as the currency that most faithfully represents the economic effects of the underlying transactions, events and conditions. The financial statements are presented in RMB, which is each Sub-Fund’s functional and presentation currency.
SENSEX India ETF and MSCI AC Asia ex Japan ETFItems included in the financial statements are measured using the currency of the primary economic environment in which the Sub-Funds operate (the “functional currency”). The performance of the Sub-Funds are measured and reported to the unitholders in the United States dollar (“US dollar”). The Management considers the US dollar as the currency that most faithfully represents the economic effects of the underlying transactions, events and conditions. The financial statements are presented in US dollar, which is each Sub-Fund’s functional and presentation currency.
Prior to 1st January 2018
A50 China ETF, SENSEX India ETF, MSCI AC Asia ex Japan ETF and CSI 300 ETFItems included in the financial statements are measured using the currency of the primary economic environment in which the Sub-Funds operate (the “functional currency”). The performance of the Sub-Funds are measured and reported to the unitholders in Hong Kong dollar. The Management considers the Hong Kong dollar as the currency that most faithfully represents the economic effects of the underlying transactions, events and conditions. The financial statements are presented in Hong Kong dollar, which is each Sub-Fund’s functional and presentation currency.

52 iShares Asia Trust
Notes to the Unaudited Condensed Financial Statements (continued)
3 Critical Accounting Estimates and Judgements
The preparation of condensed financial statements in conformity with IFRS requires the Management to make estimates and assumptions that affect the amounts reported in the financial statements and accompanying notes. Actual results could differ from those estimates.
Management makes estimates and assumptions concerning the future. The resulting accounting estimates will, by definition, seldom equal the related actual results. The estimates and assumptions that have a significant risk of causing a material adjustment to the carrying amounts of assets and liabilities within the next financial period are outlined below.
(a) Functional Currency
MSCI China ETF, MSCI Emerging Asia ETF and Hang Seng ETFManagement considers the Hong Kong dollar to be the currency that most faithfully represents the economic effect of the underlying transactions, events and conditions. The Hong Kong dollar is the currency in which the Sub-Funds measure their performance and report their results, as well as the currency in which the Sub-Funds determine the net asset value per unit at the time of issue or redemption. This determination also considers that the Sub-Funds are all listed on SEHK and their units are quoted in Hong Kong dollars.
MSCI China A ETFManagement considers the RMB to be the currency that most faithfully represents the economic effect of the underlying transactions, events and conditions. The RMB is the currency in which the Sub-Fund measures its performance and reports its results, as well as the currency in which the Sub-Fund determines the net asset value per unit at the time of issue or redemption. This determination also considers that the Sub-Fund is listed on SEHK with its units quoted in RMB.
A50 China ETF and CSI 300 ETFFrom 1st January 2018Management considers the RMB to be the currency that most faithfully represents the economic effect of the underlying transactions, events and conditions. The RMB is the currency in which the Sub-Fund measures its performance and reports its results, as well as the currency in which the Sub-Fund determines the net asset value per unit at the time of issue or redemption. This determination also considers that the Sub-Fund is listed on SEHK with its units quoted in RMB.
Prior to 1st January 2018Management considers the Hong Kong dollar to be the currency that most faithfully represents the economic effect of the underlying transactions, events and conditions. The Hong Kong dollar is the currency in which the Sub-Funds measure their performance and report their results, as well as the
currency in which the Sub-Funds determine the net asset value per unit at the time of issue or redemption. This determination also considers that the Sub-Funds are all listed on SEHK and their units are quoted in Hong Kong dollars.
SENSEX India ETF and MSCI AC Asia ex Japan ETFFrom 1st January 2018Management considers the US dollar to be the currency that most faithfully represents the economic effect of the underlying transactions, events and conditions. The US dollar is the currency in which the Sub-Funds measure their performance and report their results, as well as the currency in which the Sub-Funds determine the net asset value per unit at the time of issue or redemption. This determination also considers that the Sub-Funds are all listed on SEHK and their units are quoted in US dollar.
Prior to 1st January 2018Management considers the Hong Kong dollar to be the currency that most faithfully represents the economic effect of the underlying transactions, events and conditions. The Hong Kong dollar is the currency in which the Sub-Funds measure their performance and report their results, as well as the currency in which the Sub-Funds determine the net asset value per unit at the time of issue or redemption. This determination also considers that the Sub-Funds are all listed on SEHK and their units are quoted in Hong Kong dollars.
KOSPI 200 ETF, MSCI Taiwan ETF and NASDAQ 100 ETFManagement considers the US dollar to be the currency that most faithfully represents the economic effect of the underlying transactions, events and conditions. The US dollar is the currency in which the Sub-Funds measure their performance and report their results, as well as the currency in which the Sub-Funds determine the net asset value per unit at the time of issue or redemption. This determination also considers that the Sub-Funds are all listed on SEHK and their units are quoted in US dollar.
DAX ETF and EURO STOXX 50 ETFManagement considers the Euro (“EUR”) to be the currency that most faithfully represents the economic effect of the underlying transactions, events and conditions. The EUR is the currency in which the Sub-Funds measure their performance and report their results, as well as the currency in which the Sub-Funds determine the net asset value per unit at the time of issue or redemption.
FTSE 100 ETFManagement considers the British Pounds (“GBP”) to be the currency that most faithfully represents the economic effect of the underlying transactions, events and conditions. The GBP is the currency in which the Sub-Fund measures its performance and reports its results, as well as the currency in which the Sub-Fund determines the net asset value per unit at the time of issue or redemption.

Semi-annual Report 53
Notes to the Unaudited Condensed Financial Statements (continued)
(b) Fair value of securities not quoted in an active market
The fair value of such securities not quoted in an active market may be determined by the Management using reputable pricing sources (such as pricing agencies). Broker quotes as obtained from the pricing sources may be indicative and not executable or binding. The Management would exercise judgment and estimates on the quantity and quality of pricing sources used. Where no market data is available, the Management may value positions using their own models, which are usually based on valuation methods and techniques generally recognized as standard within the industry. The inputs into these models are primarily earning multiples and discounted cash flows. The models used to determine fair values are validated and periodically reviewed by experienced personnel at the Manager.
Models use observable data, to the extent practicable. However, areas such as credit risk (both own and counterparty), volatilities and correlations require the Management to make estimates. Changes in assumptions about these factors could affect the reported fair value of financial instruments.
The determination of what constitutes “observable” requires significant judgment by the Management. The Management considers observable data to be market data that is readily available, regularly distributed or updated, reliable and verifiable, not proprietary, and provided by independent sources that are actively involved in the relevant market.
4 Movement of the Redeemable Units
The movements of the redeemable units are as follows:
MSCI China ETFNumber of units
MSCI China A ETFNumber of units
01.01.2018to
30.06.2018(Unaudited)
01.01.2017to
30.06.2017(Unaudited)
01.01.2018to
30.06.2018(Unaudited)
01.01.2017to
30.06.2017(Unaudited)
Units in issue at the beginning of the period 85,800,000 76,200,000 9,000,000 10,500,000
Issue of units 10,800,000 10,800,000 – –Redemption of units (1,800,000) – (9,000,000) –
Units in issue at the end of the period 94,800,000 87,000,000 – 10,500,000
HK$ HK$ RMB RMB
Accounting NAV (per unit) 27.58 23.16 – 6.88
A50 China ETFNumber of units
SENSEX India ETFNumber of units
01.01.2018to
30.06.2018(Unaudited)
01.01.2017to
30.06.2017(Unaudited)
01.01.2018to
30.06.2018(Unaudited)
01.01.2017to
30.06.2017(Unaudited)
Units in issue at the beginning of the period 2,050,000,000 2,654,000,000 44,800,000 45,000,000
Issue of units 102,000,000 – – 3,800,000Redemption of units (626,000,000) (336,000,000) (2,400,000) (2,800,000)
Units in issue at the end of the period 1,526,000,000 2,318,000,000 42,400,000 46,000,000
RMB RMB(Restated)
US$ US$(Restated)
Accounting NAV (per unit) 11.13 11.13 3.04 2.80
MSCI AC Asia ex Japan ETFNumber of units
MSCI Emerging Asia ETFNumber of units
01.01.2018to
30.06.2018(Unaudited)
01.01.2017to
30.06.2017(Unaudited)
01.01.2018to
30.06.2018(Unaudited)
01.01.2017to
30.06.2017(Unaudited)
Units in issue at the beginning of the period 132,320,000 105,200,000 3,200,000 3,000,000
Issue of units 8,000,000 67,440,000 – –Redemption of units (34,480,000) (34,320,000) – –
Units in issue at the end of the period 105,840,000 138,320,000 3,200,000 3,000,000
US$ US$(Restated)
HK$ HK$
Accounting NAV (per unit) 6.82 6.34 53.76 49.43
CSI 300 ETFNumber of units
KOSPI 200 ETFNumber of units
01.01.2018to
30.06.2018(Unaudited)
01.01.2017to
30.06.2017(Unaudited)
01.01.2018to
30.06.2018(Unaudited)
01.01.2017to
30.06.2017(Unaudited)
Units in issue at the beginning of the period 5,750,000 8,000,000 9,000,000 12,600,000
Issue of units 250,000 – – –Redemption of units (1,000,000) (2,500,000) (2,400,000) (3,000,000)
Units in issue at the end of the period 5,000,000 5,500,000 6,600,000 9,600,000
RMB RMB(Restated)
US$ US$
Accounting NAV (per unit) 22.89 23.83 1.36 1.36

54 iShares Asia Trust
Notes to the Unaudited Condensed Financial Statements (continued)
MSCI Taiwan ETFNumber of units
DAX ETFNumber of units
01.01.2018to
30.06.2018(Unaudited)
01.01.2017to
30.06.2017(Unaudited)
01.01.2018to
30.06.2018(Unaudited)
01.01.2017to
30.06.2017(Unaudited)
Units in issue at the beginning of the period 22,200,000 17,600,000 2,400,000 5,800,000
Issue of units 87,400,000 – – –Redemption of units – – – –
Units in issue at the end of the period 109,600,000 17,600,000 2,400,000 5,800,000
US$ US$ EUR EUR
Accounting NAV (per unit) 1.39 1.37 1.11 1.12
EURO STOXX 50 ETFNumber of units
FTSE 100 ETFNumber of units
01.01.2018to
30.06.2018(Unaudited)
01.01.2017to
30.06.2017(Unaudited)
01.01.2018to
30.06.2018(Unaudited)
01.01.2017to
30.06.2017(Unaudited)
Units in issue at the beginning of the period 3,000,000 5,000,000 3,000,000 4,800,000
Issue of units – – – –Redemption of units – – (400,000) –
Units in issue at the end of the period 3,000,000 5,000,000 2,600,000 4,800,000
EUR EUR GBP GBP
Accounting NAV (per unit) 1.10 1.09 0.94 0.87
NASDAQ 100 ETFNumber of units
Hang Seng ETFNumber of units
01.01.2018to
30.06.2018(Unaudited)
01.01.2017to
30.06.2017(Unaudited)
01.01.2018to
30.06.2018(Unaudited)
18.11.2016(date of
inception) to30.06.2017(Unaudited)
Units in issue at the beginning of the period 6,000,000 6,800,000 3,200,000 –
Issue of units 1,000,000 – – 9,700,000Redemption of units – (800,000) (400,000) (6,950,000)
Units in issue at the end of the period 7,000,000 6,000,000 2,800,000 2,750,000
US$ US$ HK$ HK$
Accounting NAV (per unit) 1.68 1.34 104.98 93.64
5 Transactions with the Trustee, Manager and Connected Persons
The following is a summary of significant related party transactions/transactions entered into during the year between the Sub-Funds and the Trustee, the Manager and their Connected Persons. Connected Persons of the Manager are those as defined in the Code on Unit Trusts and Mutual Funds issued by the Securities and Futures Commission of Hong Kong (the “SFC Code”). All transactions entered into during the year between the Sub-Funds and the Manager and its Connected Persons were carried out in the normal course of business and on normal commercial terms. To the best of the Manager’s knowledge, the Sub-Funds do not have any other transactions with Connected Persons except for those disclosed below.
(a) Management Fee
MSCI China ETFThe Manager is entitled to receive a management fee, currently at the annual rate of 0.59% of the net asset value of the Sub-Fund. The fee is accrued daily and calculated as at each dealing day and payable monthly in arrears.
MSCI China A ETFThe Manager is entitled to receive a management fee, currently at the annual rate of 0.60% of the net asset value of the Sub-Fund. The fee is accrued daily and calculated as at each dealing day and payable monthly in arrears.
A50 China ETFThe Manager is entitled to receive a management fee, currently at the annual rate of 0.99% of the net asset values of the Sub-Funds. The fee is accrued daily and calculated as at each dealing day and payable monthly in arrears.
SENSEX India ETFPrior to 1st July 2016, the Manager was entitled to receive a management fee, at the annual rate of 0.99% of the net asset value of the Sub-Fund. The fee was accrued daily and calculated as at each dealing day and payable monthly in arrears. From 1st July 2016, the management fee was reduced from 0.99% to 0.64% per annum of the net asset value of the Sub-Fund. The management fee includes fees and expenses of the Mauritius Subsidiary but does not include certain expenses as disclosed in the prospectus. Included in “Other income” in the Statement of Comprehensive Income is a rebate from the Manager in respect of expenses of the Mauritius Subsidiary representing the amount which should have been deducted from the management fee of the Sub-Fund.

Semi-annual Report 55
Notes to the Unaudited Condensed Financial Statements (continued)
MSCI AC Asia ex Japan ETFPrior to 1st July 2016, the Manager was entitled to receive a management fee, at the annual rate of 0.59% of the net asset value of the Sub-Fund. The fee is accrued daily and calculated as at each dealing day and payable monthly in arrears. From 1st July 2016, the management fee was reduced from 0.59% to 0.28% per annum of the net asset value of the Sub-Fund.
During the period ended 30th June 2018, MSCI AC Asia ex Japan ETF invested in the iShares MSCI India Index ETF (the “SG MSCI India ETF”), an exchange traded fund managed by BlackRock (Singapore) Limited (“BSL”), and iShares MSCI India ETF (the “US MSCI India ETF”), an exchange traded fund managed by BlackRock Fund Advisors (“BFA”). BSL and BFA are affiliated companies of the Manager. The Manager has waived the portion of the management fee charged on the SG MSCI India ETF and the US MSCI India ETF, which represented MSCI AC Asia ex Japan ETF’s holding in the SG MSCI India ETF and the US MSCI India ETF.
MSCI Emerging Asia ETFThe Manager is entitled to receive a management fee, currently at the annual rate of 0.59% of the net asset value of the Sub-Fund. The fee is accrued daily and calculated as at each dealing day and payable monthly in arrears.
During the period/year ended 30th June 2018 and 31st December 2017, the Manager has waived the portion of the management fee charged on the SENSEX India ETF, which represented MSCI Emerging Asia ETF’s holding in the SENSEX India ETF.
CSI 300 ETFPrior to 28th February 2017, the Manager was entitled to receive a management fee, at the annual rate of 0.99% of the net asset value of the Sub-Fund. The fee is accrued daily and calculated as at each dealing day and payable monthly in arrears. From 28th February 2017, the management fee was reduced from 0.99% to 0.38% per annum of the net asset value of the Sub-Fund. As at 30th June 2018, the Sub-Fund had a receivable of RMB19,607 (31st December 2017: RMB13,713*) from the Manager for the expenses of the Sub-Fund paid on behalf of the Manager.
KOSPI 200 ETF and MSCI Taiwan ETFThe Manager is entitled to receive a management fee, currently at the annual rate of 0.30% of the net asset values of the Sub-Funds. The fee is accrued daily and calculated as at each dealing day and payable monthly in arrears.
* Restated
DAX ETF, EURO STOXX 50 ETF and FTSE 100 ETFThe Manager is entitled to receive a management fee, currently at the annual rate of 0.20% of the net asset values of the Sub-Funds. The fee is accrued daily and calculated as at each dealing day and payable monthly in arrears. As at 30th June 2018, DAX ETF, EURO STOXX 50 ETF and FTSE 100 ETF had a receivable of EUR406 (31st December 2017: EURNil), EUR1,591 (31st December 2017: EURNil), GBP3 (31st December 2017: GBPNil) respectively from the Manager for the expenses of the Sub-Funds paid on behalf of the Manager.
NASDAQ 100 ETFThe Manager is entitled to receive a management fee, currently at the annual rate of 0.28% of the net asset value of the Sub-Fund. The fee is accrued daily and calculated as at each dealing day and payable monthly in arrears.
Hang Seng ETFThe Manager is entitled to receive a management fee, currently at the annual rate of 0.09% of the net asset value of the Sub-Fund. The fee is accrued daily and calculated as at each dealing day and payable monthly in arrears.
Apart from the fees and expenses stated in notes 5(b) to (d) below, all other fees and expenses of each Sub-Fund are paid by the Manager.
(b) Fees and Charges Paid to the Trustee and its Connected Persons
The following fees and charges are paid to the Trustee and/or its Connected Persons by the Sub-Funds (with the exception of MSCI China ETF (effective from 30th April 2018), A50 China ETF (effective from 30th April 2018), SENSEX India ETF (effective from 30th April 2018), MSCI AC Asia ex Japan ETF (effective from 30th April 2018), MSCI Emerging Asia ETF (effective from 30th April 2018), CSI 300 ETF (effective from 28th February 2017), KOSPI 200 ETF (effective from 30th April 2018), MSCI Taiwan ETF (effective from 30th April 2018), DAX ETF (effective from 30th April 2018), EURO STOXX 50 ETF (effective from 30th April 2018), FTSE 100 ETF (effective from 30th April 2018), NASDAQ 100 ETF (effective from 30th April 2018) and Hang Seng ETF):

56 iShares Asia Trust
Notes to the Unaudited Condensed Financial Statements (continued)
(i) The transaction handling fees for the purchase and sale of investments and handling of CAAP Issuers’ collaterals across different markets.
Markets
Transaction handling fee
US$
Australia 10 Austria 30Belgium 20China A-shares 22China B-shares 45Euroclear 10France 15Finland 20Germany 10Greece 20Hong Kong 10India 25Indonesia 25Ireland 20Italy 15Japan 20Luxembourg 10Malaysia 20Netherlands 20Pakistan 50Philippines 35Portugal 20Shanghai – Hong Kong Stock Connect 10Singapore 15South Korea 15Spain 30Switzerland 15Taiwan 30Thailand 20The United Kingdom 10The United States of America 10
(ii) The administration fee for the purchase, sale and rebalancing of investments is US$15 per transaction.
All other fees payable to the Trustee and its Connected Persons are borne by the Manager.
(c) CAAP Maintenance Charge
A50 China ETF and CSI 300 ETFThe CAAP Issuers are entitled to a CAAP maintenance charge. The CAAP maintenance charge equals 0.3% per annum of the daily mark to market value of the CAAPs held by the above Sub-Funds, payable at the end of each quarter based on the period’s number of actual days.
From 1st April 2013, the CAAP maintenance charge was waived by the CAAP Issuers. A list of the CAAP Issuers as at 30th June 2018 and 31st December 2017 are set out as follows:
As at 30th June 2018 As at 31st December 2017
CAAP Issuers CAAP Issuers– JP Morgan Structured Products
B.V., guaranteed by JP Morgan Chase Bank, N.A.3
(d) Transaction Costs on Financial Assets at Fair Value through Profit or Loss
A50 China ETF and CSI 300 ETFThe CAAP Issuers also charge a 0.3% commission (excluding stamp duty of 0.1%) on each purchase and sale of each CAAP acquired for the account of the A50 China ETF and CSI 300 ETF. 0.1% stamp duty is payable on the sale of A-Shares and is added to the CAAP commission on sale.
The CAAP commission may be agreed from time to time between the Manager and the CAAP Issuers. HSBC Bank plc, the group company of the Trustee, was one of the CAAP Issuers. The transaction costs charged by HSBC Bank plc were RMBNil (30th June 2017: RMB2,033,510) and RMBNil (30th June 2017: RMB63,753) for A50 China ETF and CSI 300 ETF respectively during the period ended 30th June 2018.
SENSEX India ETFThe IAP Issuer also charges a 0.295% commission (including Indian stamp duty of 0.1%) on each purchase and sale of each IAP acquired for the account of the Mauritius Subsidiary. For the period and as of 30th June 2018 and 2017, the Mauritius Subsidiary did not hold any IAPs and therefore, did not incur any IAP transaction costs.
(e) Bank Balances
Bank balances are maintained with a group company of the Trustee, i.e. The Hongkong and Shanghai Banking Corporation Limited. Bank balances held with the group company of the Trustee as at 30th June 2018 and 31st December 2017 were as follows:
Sub-Funds
30th June 2018(Unaudited)
HK$
31st December 2017
(Audited)HK$
MSCI China ETF 19,785,115 3,042,526MSCI Emerging Asia ETF 687,535 221,538Hang Seng ETF 980,350 468,849
3 Applicable to A50 China ETF* Restated

Semi-annual Report 57
Notes to the Unaudited Condensed Financial Statements (continued)
Sub-Fund
30th June 2018(Unaudited)
RMB
31st December 2017
(Audited)RMB
MSCI China A ETF 393,555 159,936A50 China ETF – 54,744,913*CSI 300 ETF 44,563 34,205*
Sub-Funds
30th June 2018(Unaudited)
US$
31st December 2017
(Audited)US$
SENSEX India ETF 542,405 849,141*MSCI AC Asia ex Japan ETF 1,924,117 2,696,433*KOSPI 200 ETF 13,220 10,481MSCI Taiwan ETF 14,800 29,702NASDAQ 100 ETF 8,592 26,570
Sub-Funds
30th June 2018(Unaudited)
EUR
31st December 2017
(Audited)EUR
DAX ETF 4,301 2,437EURO STOXX 50 ETF 2,396 18,344
Sub-Fund
30th June 2018(Unaudited)
GBP
31st December 2017
(Audited)GBP
FTSE 100 ETF 8,715 12,724
Bank balances are maintained with a group company of the Trustee, i.e. HSBC Bank (China) Company Limited. Bank balances held with the group company of the Trustee as at 30th June 2018 and 31st December 2017 were as follows:
Sub-Fund
30th June 2018(Unaudited)
RMB
31st December 2017
(Audited)RMB
MSCI China A ETF 36,535 242,593A50 China ETF 114,652,628 93,179,228*CSI 300 ETF 613,026 146,550*
During the periods ended 30th June 2018 and 2017, the bank interest income of each Sub-Fund stated in the Condensed Statement of Comprehensive Income was earned from The Hongkong and Shanghai Banking Corporation Limited, a group company of the Trustee except for A50 China ETF.
* Restated
(f) Bank Overdraft
There was no bank overdraft held with the group company of the Trustee, i.e. The Hongkong and Shanghai Banking Corporation Limited, as at 30th June 2018 and 31st December 2017.
During the period ended 30th June 2018 and 2017, the interest expenses of each Sub-Fund stated in the Condensed Statement of Comprehensive Income were paid to The Hongkong and Shanghai Banking Corporation Limited.
(g) Bank Overdraft Facility
The Hongkong and Shanghai Banking Corporation Limited (“HSBC”), which is the group company of the Trustee, has granted uncommitted banking overdraft facility lines to the Sub-Funds. The facility limit for each of the following Sub-Funds shall be the lesser of (i) the limit applicable to such Sub-Fund or (ii) an amount which is 10% of the net asset value of such Sub-Fund, except for SENSEX India ETF, which shall be the lesser of (i) the limit applicable or (ii) an amount subject to 5% of it’s net asset value under the custody of HSBC, the Trustee or any of its affiliates. For the other Sub-Funds of the Trust, HSBC may grant temporary overdraft from time to time with prior approval for ad hoc funding purpose. As at 30th June 2018 and 31st December 2017, the banking overdraft facility lines available to the following Sub-Funds were as follows:
Sub-Funds
30th June 2018(Unaudited)
US$
31st December 2017
(Audited)US$
A50 China ETF 50,000,000 50,000,000SENSEX India ETF 5,000,000 5,000,000MSCI AC Asia ex Japan ETF 5,000,000 5,000,000MSCI Emerging Asia ETF 5,000,000 5,000,000CSI 300 ETF 5,000,000 5,000,000
(h) Financial Assets at Fair Value through Profit or Loss
MSCI AC Asia ex Japan ETFFor the Sub-Fund’s investments in the SG MSCI India ETF and the US MSCI India ETF, exchange traded funds managed by BSL and BFA, which are the affiliates of the Manager, please refer to Investment Portfolio for details.
As at 30th June 2018, the Sub-Fund had an investment of US$2,957,036 (31st December 2017: US$3,715,862*) in Hang Seng Bank Ltd, which is a fellow subsidiary of the Trustee.
During the period ended 30th June 2018, the Sub-Fund received dividend income of US$79,024 (30th June 2017: US$76,677*) from its investments in Hang Seng Bank Ltd, which is a fellow subsidiary of the Trustee.

58 iShares Asia Trust
Notes to the Unaudited Condensed Financial Statements (continued)
MSCI Emerging Asia ETFFor the Sub-Fund’s investments in the SENSEX India ETF, please refer to Investment Portfolio for details.
FTSE 100 ETFAs at 30th June 2018, the Sub-Fund had an investment of GBP175,273 (31st December 2017: GBP214,026) in HSBC Holdings Plc, which is the ultimate holding company of the Trustee.
During the period ended 30th June 2018, the Sub-Fund received dividend income of GBP5,496 (30th June 2017: GBP10,850) from its investments in HSBC Holdings Plc, which is the ultimate holding company of the Trustee.
Hang Seng ETFAs at 30th June 2018, the Sub-Fund had an investment of HK$29,733,811 in HSBC Holdings Plc, which is the ultimate holding company of the Trustee, and HK$4,773,350 in Hang Seng Bank Ltd, which is a fellow subsidiary of the Trustee.
During the period ended 30th June 2018, the Sub-Fund received dividend income of HK$949,335 from its investments in HSBC Holdings Plc, which is the ultimate holding company of the Trustee, and HK$107,048 from its investments in Hang Seng Bank Ltd, which is a fellow subsidiary of the Trustee.
(i) CAAPs, Collaterals and Securities Lending Expenses in respect of the Securities Lending Arrangements
A50 China ETFDuring the period ended 30th June 2018, the Sub-Fund paid RMB Nil (30th June 2017: RMB5,438,579*) securities lending expenses in respect of the securities lending arrangements to HSBC Bank plc.
CSI 300 ETFDuring the period ended 30th June 2018, the Sub-Fund paid RMB Nil (30th June 2017: RMB14,134*) securities lending expenses in respect of the securities lending arrangements to HSBC Bank plc.
(j) Unitholders
For the periods ended 30th June 2018 and 2017, the following table discloses the units subscribed and redeemed by one of the Participating Dealers of the Sub-Funds, The Hongkong and Shanghai Banking Corporation Limited, which is a group company of the Trustee:
* Restated
Sub-Funds
30th June 2018Subscriptions/ (Redemptions)
(Unaudited)units
30th June 2017Subscriptions/ (Redemptions)
(Unaudited) units
MSCI China A ETF (2,200,000) –A50 China ETF (10,000,000) (90,000,000)KOSPI 200 ETF (2,400,000) –FTSE 100 ETF (400,000) –Hang Seng ETF – 3,900,000
(k) Suspended Stocks Purchase Agreement
As disclosed in the Compulsory Redemption Announcement on 18th May 2018, the MSCI China A ETF held 14 Suspended Stocks, the fair value of which was approximately RMB1,401,788 and accounted for 3.3% of it’s Net Asset Value as of the Compulsory Redemption Date. There was no active market on any stock exchange or current market price for such Suspended Stocks.
To allow Unitholders to receive redemption proceeds of Units at fair value without undue delay, the Manager entered into a purchase agreement with the Trustee (acting on behalf of the MSCI China A ETF) (the “Suspended Stocks Purchase Agreement”), pursuant to which the Manager purchased the receivables from the Suspended Stocks, comprising (i) the dividends (if any) from the Suspended Stocks and (ii) proceeds from disposal of the Suspended Stocks as and when they become liquid (the “Suspended Stocks Receivables”), in consideration for a cash payment by the Manager to the MSCI China A ETF at the fair value of the Suspended Stocks, as valued at the Compulsory Redemption Date (the “Suspended Stocks Purchase Price”). The Manager paid the Suspended Stocks Purchase Price to the Trustee (on behalf of the MSCI China A ETF) on the Compulsory Redemption Date, so that the Suspended Stocks Purchase Price formed part of the Redemption Value. Pursuant to Chapter 10.11 of the Code, these transactions carried out on behalf of the MSCI China A ETF were at arm’s length. The fair value of the suspended stocks was reviewed by the Trustee.
Upon payment of the Redemption Payment, the Suspended Stocks would be held by the Trustee on trust in the name of the MSCI China A ETF. When the Suspended Stocks become liquid or are otherwise disposed of, the Manager will, pursuant to the Suspended Stocks Purchase Agreement, be entitled to receive a payment from the Trustee (acting on behalf of the MSCI China A ETF) out of the Suspended Stocks Receivables, up to the Suspended Stocks Purchase Price. If the value of the Suspended Stocks Receivables is lower than the Suspended
Semi-annual Report 59
Notes to the Unaudited Condensed Financial Statements (continued)
Stocks Purchase Price (i.e. the amount the Manager paid to the MSCI China A ETF), the Manager will only recover up to the value of Suspended Stocks Receivables available and it will bear the loss in its corporate capacity, and neither the Trustee nor any Unitholder will be liable for the shortfall. If the value of the Suspended Stocks Receivables is higher than the Suspended Stocks Purchase Price, the Manager will receive the amount at the Suspended Stocks Purchase Price, and the Trustee shall donate the excess amount (after deducting the costs of holding and disposing of the Suspended Stocks following the compulsory redemption of Units) to a charity chosen by the Manager upon consultation with the Trustee, in accordance with Clause 35.8B of the Trust Deed.
6 Major Non-Cash Transactions
(a) Subscriptions
Until 14th November 2008, units could only be subscribed in kind and not for cash. Since 14th November 2008, units can be subscribed either (a) in-kind for an “Application Basket” plus a “Cash Component” (where the “Application Basket” means a portfolio of securities determined by the Manager for the relevant Sub-Fund at the start of business on the relevant dealing day for the purpose of the creation and redemption of units in an Application Unit size, notified on the relevant date by the Manager to Participating Dealers for the relevant Sub-Fund, the “Cash Component” means the difference between the aggregate Net Asset Value of the units comprising an Application Unit and the “Application Basket Value”, and the “Application Basket Value” means the aggregate value of the securities constituting the Application Basket as at the valuation point on the relevant dealing day) or (b) for a cash payment equivalent to the relevant Application Basket Value plus an amount equivalent to any Cash Component, which the Manager shall use to purchase the securities comprised in the Application Basket to replicate the underlying index applicable to that Sub-Fund, provided that the Manager shall be entitled in its discretion to charge (for the account of the relevant Sub-Fund) to the applicant of any units for which cash is paid in lieu of delivering any securities such additional sum as represents the appropriate provision for duties and charges.
During the periods ended 30th June 2018 and 2017, the Sub-Funds issued units through cash subscriptions and/or in exchange for Application Baskets consisting of investments plus the relevant cash component as stated in the Condensed Statement of Changes in Net Assets Attributable to Unitholders.
(b) Redemptions
Until 14th November 2008, units could only be redeemed in kind and not for cash. Since 14th November 2008, units can be redeemed either (a) in-kind for an Application Basket plus a cash component or (b) for a cash amount equivalent to the Application Basket Value plus a cash component.
During the periods ended 30th June 2018 and 2017, the Sub-Funds redeemed units through cash redemptions and/or in exchange for Application Baskets consisting of investments plus the relevant cash component as stated in the Condensed Statement of Changes in Net Assets Attributable to Unitholders.
7 Soft Commission Arrangements
The Manager confirms that there have been no soft commission arrangements existing during the year in relation to directing transactions of the Sub-Funds through a broker or dealer (30th June 2017: Nil).
8 Investment Limitation and Prohibitions under the SFC Code
Pursuant to the SFC’s Guidelines for Regulating Index Tracking Exchange Traded Funds (the “ETF Guidelines”), the Manager is permitted to overweight the holdings of the Sub-Funds relative to their respective weightings in the underlying index, on the condition that the maximum extra weighting in any constituent securities will not exceed the maximum limit reasonably determined by the Sub-Funds and after consultation with the SFC. The maximum limit for each of the Sub-Funds has been disclosed in their respective prospectus.
The Manager and Trustee have confirmed that all Sub-Funds have complied with this limit during the periods ended 30th June 2018 and 2017.
The SFC Code allows the Sub-Funds to invest in constituent securities issued by a single issuer for more than 10% of the Sub-Funds’ net asset value provided that the investment is limited to any constituent securities that each accounts for more than 10% of the weighting of the Index and the Sub-Funds’ holding of any such constituent securities may not exceed their respective weightings in the Index (except as a result of changes in the composition of the Index and the excess is transitional and temporary in nature).
The following Sub-Funds held constituent securities that individually accounted for more than 10% of the Sub-Funds’ net asset value and their respective weightings of the underlying index as at 30th June 2018 and 31st December 2017:

60 iShares Asia Trust
Notes to the Unaudited Condensed Financial Statements (continued)
MSCI China ETF
Respective weightingin the Index (%) % of net asset value
30.06.2018(Unaudited)
31.12.2017(Audited)
30.06.2018(Unaudited)
31.12.2017(Audited)
Alibaba Group Holding – SP ADR 12.50 12.34 12.34 12.32
Tencent Holdings Ltd 16.68 18.37 16.46 18.36
29.18 30.71 28.80 30.68
A50 China ETF
Respective weightingin the Index (%) % of net asset value
30.06.2018(Unaudited)
31.12.2017(Audited)
30.06.2018(Unaudited)
31.12.2017(Audited)
Ping An Insurance Group Co – A 11.08 12.08 11.02 12.03
SENSEX India ETF
Respective weightingin the Index (%) % of net asset value
30.06.2018 (Unaudited)
31.12.2017 (Audited)
30.06.2018 (Unaudited)
31.12.2017 (Audited)
HDFC Bank Limited 12.25 11.42 12.16 11.39
KOSPI 200 ETF
Respective weightingin the Index (%) % of net asset value
30.06.2018 (Unaudited)
31.12.2017 (Audited)
30.06.2018 (Unaudited)
31.12.2017 (Audited)
Samsung Electronics Co Ltd 25.85 27.29 25.83 27.06
MSCI Taiwan ETF
Respective weightingin the Index (%) % of net asset value
30.06.2018 (Unaudited)
31.12.2017 (Audited)
30.06.2018 (Unaudited)
31.12.2017 (Audited)
Taiwan Semiconductor Manufac 28.70 31.04 28.42 31.01
DAX ETF
Respective weightingin the Index (%) % of net asset value
30.06.2018 (Unaudited)
31.12.2017 (Audited)
30.06.2018 (Unaudited)
31.12.2017 (Audited)
SAP SE 10.08 9.42 10.07 9.42
NASDAQ 100 ETF
Respective weightingin the Index (%) % of net asset value
30.06.2018 (Unaudited)
31.12.2017 (Audited)
30.06.2018 (Unaudited)
31.12.2017 (Audited)
Amazon.com Inc 10.35 7.70 10.31 7.65Apple Inc 11.41 11.87 11.42 11.91
21.76 19.57 21.73 19.56
Hang Seng ETF
Respective weightingin the Index (%) % of net asset value
30.06.2018 (Unaudited)
31.12.2017 (Audited)
30.06.2018 (Unaudited)
31.12.2017 (Audited)
HSBC Holdings Plc 10.22 10.29 10.12 10.28Tencent Holdings Ltd 10.32 9.60 10.22 9.58
20.54 19.89 20.34 19.86
Except as disclosed above, there were no other securities that individually accounted for more than 10% of the net asset value of the respective Sub-Funds as at 30th June 2018 and 31st December 2017.

Semi-annual Report 61
Notes to the Unaudited Condensed Financial Statements (continued)
The following table presents the movement in the Sub-Funds’ NAV per unit and their underlying index during the periods ended 30th June 2018 and 2017.
Sub-Funds Underlying indexMovement in the NAV per unit (%)
Movement in the underlying index (%)
01.01.2018to
30.06.2018(Unaudited)
01.01.2017to
30.06.2017(Unaudited)
01.01.2018to
30.06.2018(Unaudited)
01.01.2017to
30.06.2017(Unaudited)
MSCI China ETF MSCI China Index (1.67) 25.27 (1.39) 25.72MSCI China A ETF4 MSCI China A
International Index N/A 9.36 N/A 9.76A50 China ETF5 FTSE China A50 Index (11.68) 18.11 (11.25) 19.50SENSEX India ETF6 BSE SENSEX Index (3.12) 23.08 (2.48) 23.67MSCI AC Asia ex
Japan ETF6
MSCI All Country Asia ex Japan Index (4.92) 23.60 (4.76) 23.66
MSCI Emerging Asia ETF
MSCI EM Asia Index(4.60) 24.35 (4.72) 24.02
CSI 300 ETF5 CSI 300 Index (12.46) 13.41 (12.11) 15.03KOSPI 200 ETF KOSPI 200 Net Total
Return USD Index (10.94) 26.97 (11.08) 28.25MSCI Taiwan ETF MSCI Taiwan Index (1.24) 21.35 (0.99) 21.58DAX ETF DAX Index (5.26) 6.55 (4.73) 7.35EURO STOXX 50 ETF EURO STOXX 50 Index (1.02) 6.58 (0.98) 6.71FTSE 100 ETF FTSE 100 Index 1.41 4.49 1.65 4.66NASDAQ 100 ETF NASDAQ 100 Index 10.27 16.35 10.48 16.56Hang Seng ETF HSI Net Total Return
Index (1.72) 17.51 (1.68) 17.67
9 Interest in other entities
The Sub-Funds’ investments in other funds are subject to the terms and conditions of the other fund’s prospectuses and are susceptible to market price risk arising from uncertainties about future values of those other funds. The Manager makes investment decisions after extensive due diligence of the other funds and their strategy.
As at 30th June 2018 and 31st December 2017, no Sub-Funds held investments in other funds, except for SENSEX India ETF, MSCI AC Asia ex Japan ETF and MSCI Emerging Asia ETF.
SENSEX India ETF
As at 30th June 2018 and 31st December 2017, SENSEX India ETF invested in the Mauritius Subsidiary. The right of the SENSEX India ETF to request redemption of its investments in the Mauritius Subsidiary is on a daily basis.
4 On 1st June 2018, the Manager announced that the Sub-Fund was delisted from the SEHK.5 The base currency of the Sub-Fund changed from HK$ to RMB on 1st January 2018. Accordingly, the Movement in the NAV and Underlying index are being shown in RMB. Prior to 1st
January 2018, it was shown in HK$.6 The base currency of the Sub-Fund changed from HK$ to US$ on 1st January 2018. Accordingly, the Movement in the NAV and Underlying index are being shown in US$. Prior to 1st January
2018, it was shown in HK$.* Restated
SENSEX India ETF’s exposure to investments in Mauritius Subsidiary at fair value is disclosed in the following table. These investments are included in financial assets at fair value through profit or loss in the Condensed Statement of Financial Position.
As at 30th June 2018 (Unaudited)
Strategy
Net asset value of Mauritius
SubsidiaryInvestment
fair value% of net asset
value
US$ million US$
Equity index tracking 129 128,600,526 99.62
As at 31st December 2017 (Audited)
Strategy
Net asset value of Mauritius
SubsidiaryInvestment
fair value% of net asset
value
US$ million* US$*
Equity index tracking 140 139,989,131 99.43
SENSEX India ETF’s maximum exposure to loss from its interests in the Mauritius Subsidiary is equal to the total fair value of its investments in the Mauritius Subsidiary.
Once the SENSEX India ETF has disposed of its shares in the Mauritius Subsidiary, the SENSEX India ETF ceases to be exposed to any risk from the Mauritius Subsidiary.
The SENSEX India ETF’s investment strategy entails trading in Mauritius Subsidiary on a regular basis. There were no purchases in the Mauritius Subsidiary during the period ended 30th June 2018. Total purchases in the Mauritius Subsidiary during the period ended 30th June 2017 were US$9,712,128*.
As at 30th June 2018 and 31st December 2017, there were no capital commitment obligations and no amounts due to the Mauritius Subsidiary for unsettled purchases.
During the period ended 30th June 2018, total net losses incurred on investments in the Mauritius Subsidiary were US$4,094,927 (30th June 2017: net gains of US$23,705,603*).

62 iShares Asia Trust
Notes to the Unaudited Condensed Financial Statements (continued)
MSCI AC Asia ex Japan ETF
As at 30th June 2018 and 31st December 2017, MSCI AC Asia ex Japan ETF invested in the SG MSCI India ETF and the US MSCI India ETF, to gain access to the India securities comprised in the Underlying Index. The rights of the MSCI AC Asia ex Japan ETF to request redemption of its investments in the SG MSCI India ETF and the US MSCI India ETF are on a daily basis.
MSCI AC Asia ex Japan ETF’s exposure to investments in the SG MSCI India ETF and the US MSCI India ETF at fair value is disclosed in the following table. These investments are included in financial assets at fair value through profit or loss in the Condensed Statement of Financial Position.
As at 30th June 2018 (Unaudited)
Strategy Net asset value Investment
fair value% of net asset
value
US$ million US$
Equity index tracking– SG MSCI India ETF 245 6,482,614 0.90– US MSCI India ETF 4,799 56,733,251 7.86
63,215,865 8.76
As at 31st December 2017 (Audited)
Strategy Net asset value Investment
fair value% of net asset
value
US$ million* US$*
Equity index tracking– SG MSCI India ETF 363 34,132,010 3.60– US MSCI India ETF 5,519 60,395,680 6.36
94,527,690 9.96
MSCI AC Asia ex Japan ETF’s maximum exposure to loss from its interests in the SG MSCI India ETF and the US MSCI India ETF are equal to the total fair value of its investments in the SG MSCI India ETF and the US MSCI India ETF.
Once the MSCI AC Asia ex Japan ETF has disposed of its shares in the SG MSCI India ETF and the US MSCI India ETF, the MSCI AC Asia ex Japan ETF ceases to be exposed to any risk from the SG MSCI India ETF and the US MSCI India ETF.
The MSCI AC Asia ex Japan ETF’s investment strategy entails trading in the SG MSCI India ETF and the US MSCI India ETF on a regular basis. Total purchases in the SG MSCI India ETF and US MSCI India ETF during the period ended 30th June 2018 was US$1,097,327 (30th June 2017: US$73,158,920*).
* Restated
As at 30th June 2018 and 31st December 2017, there were no capital commitment obligations and no amounts due to the SG MSCI India ETF and the US MSCI India ETF for unsettled purchases.
During the period ended 30th June 2018, total net loss incurred on investments in the SG MSCI India ETF and the US MSCI India ETF was US$6,623,231 (30th June 2017: net gains of US$11,110,090*).
MSCI Emerging Asia ETF
As at 30th June 2018 and 31st December 2017, MSCI Emerging Asia ETF invested in the SENSEX India ETF. The right of the MSCI Emerging Asia ETF to request redemption of its investments in the SENSEX India ETF is on a daily basis.
MSCI Emerging Asia ETF’s exposure to investments in the SENSEX India ETF at fair value is disclosed in the following table. These investments are included in financial assets at fair value through profit or loss in the Condensed Statement of Financial Position.
As at 30th June 2018 (Unaudited)
StrategyNet asset value ofSENSEX India ETF
Investment fair value
% of net assetvalue
HK$ million HK$
Equity index tracking 1,013 19,742,240 11.48
As at 31st December 2017 (Audited)
StrategyNet asset value ofSENSEX India ETF
Investment fair value
% of net assetvalue
HK$ million HK$
Equity index tracking 1,100 20,978,315 11.63
MSCI Emerging Asia ETF’s maximum exposure to loss from its interests in the SENSEX India ETF is equal to the total fair value of its investments in the SENSEX India ETF.
Once the MSCI Emerging Asia ETF has disposed of its shares in the SENSEX India ETF, the MSCI Emerging Asia ETF ceases to be exposed to any risk from the SENSEX India ETF.
The MSCI Emerging Asia ETF’s investment strategy entails trading in the SENSEX India ETF on a regular basis. Total purchases in the SENSEX India ETF during the period ended 30th June 2018 were HK$239,000 (30th June 2017: HK$440,100).
As at 30th June 2018 and 31st December 2017, there were no capital commitment obligations and no amounts due to the SENSEX India ETF for unsettled purchases.

Semi-annual Report 63
Notes to the Unaudited Condensed Financial Statements (continued)
During the period ended 30th June 2018, total net loss incurred on investments in the SENSEX India ETF were HK$650,075 (30th June 2017: net gains of HK$3,229,586).
10 Fair Value Estimation
The fair value of investments traded in active markets (such as publicly traded derivatives and trading securities) are based on quoted market prices at the close of trading on the reporting date. Investments that are listed or traded on an exchange are fair valued based on the last traded market prices.
An active market is a market in which transactions for the asset or liability take place with sufficient frequency and volume to provide pricing information on an ongoing basis.
As at 30th June 2018, 100% (31st December 2017: 100%) of the financial assets at fair value through profit or loss relate to the SENSEX India ETF’s investment in the Mauritius Subsidiary that has been fair valued in accordance with the policies set out in note 2(d) of the annual financial statements for year ended 31st December 2017. The shares of the Mauritius Subsidiary are not publicly traded; redemptions can only be made by the SENSEX India ETF on the redemption dates as specified in the offering document. As a result, the carrying value of the Mauritius Subsidiary may not be indicative of the value ultimately realized on redemption.
The fair value of the investment in Mauritius Subsidiary is primarily based on the latest net asset value of the Mauritius Subsidiary’s participating shares as reported by its administrator. The SENSEX India ETF may make adjustments to the value based on considerations such as; liquidity of the SENSEX India ETF’s holding in the Mauritius Subsidiary or its underlying investments.
IFRS 13 requires the Sub-Funds to classify their fair value measurements using a fair value hierarchy that reflects the significance of the inputs used in making the measurements. The fair value hierarchy has the following levels:
• Quoted prices (unadjusted) in active markets for identical assets or liabilities that the entity can access at the measurement date (level 1).
• Inputs other than quoted prices included within level 1 that are observable for the asset or liability, either directly or indirectly (level 2).
• Inputs for the asset or liability that are unobservable inputs (level 3).
The level in the fair value hierarchy within which the fair value measurement is categorized in its entirety is determined on the basis of the lowest level input that is significant to the fair value measurement in its entirety. For this purpose, the significance of an input is assessed against the fair value measurement in its entirety. If a fair value measurement uses observable inputs that require significant adjustment based on unobservable inputs, that measurement is a level 3 measurement. Assessing the significance of a particular input to the fair value measurement in its entirety requires judgment, considering factors specific to the asset or liability.
The determination of what constitutes “observable” requires significant judgment by the Manager. The Manager considers observable data to be that market data that is readily available, regularly distributed or updated, reliable and verifiable, not proprietary, and provided by independent sources that are actively involved in the relevant market.
The following tables analyze within the fair value hierarchy the Sub-Funds’ financial assets at fair value through profit or loss (by class) measured at fair value at 30th June 2018 and 31st December 2017:
MSCI China ETF
30th June 2018 (Unaudited)
Level 1 Level 2 Level 3 Total
RMB RMB RMB RMB
AssetsFinancial assets at fair value
through profit or loss– Equity securities 2,580,277,629 – 72,806 2,580,350,435
Total assets 2,580,277,629 – 72,806 2,580,350,435
LiabilitiesFinancial liabilities at fair value
through profit or loss– Futures (246,150) – – (246,150)
Total liabilities (246,150) – – (246,150)
31st December 2017 (Audited)
Level 1 Level 2 Level 3 Total
HK$ HK$ HK$ HK$
AssetsFinancial assets at fair value
through profit or loss– Equity securities 2,404,732,633 – 41 2,404,732,674
Total assets 2,404,732,633 – 41 2,404,732,674

64 iShares Asia Trust
Notes to the Unaudited Condensed Financial Statements (continued)
MSCI China A ETF
30th June 2018 (Unaudited)
Level 1 Level 2 Level 3 Total
RMB RMB RMB RMB
AssetsFinancial assets at fair value
through profit or loss– Equity securities – – – –
Total assets – – – –
31st December 2017 (Audited)
Level 1 Level 2 Level 3 Total
RMB RMB RMB RMB
AssetsFinancial assets at fair value
through profit or loss– Equity securities 64,430,441 853,712 1,774,066 67,058,219
Total assets 64,430,441 853,712 1,774,066 67,058,219
A50 China ETF
30th June 2018 (Unaudited)
Level 1 Level 2 Level 3 Total
RMB RMB RMB RMB
AssetsFinancial assets at fair value
through profit or loss– Equity securities 16,747,409,848 131,489,435 – 16,878,899,283
Total assets 16,747,409,848 131,489,435 – 16,878,899,283
31st December 2017 (Audited)*
Level 1 Level 2 Level 3 Total
RMB RMB RMB RMB
AssetsFinancial assets at fair value
through profit or loss– Equity securities 24,019,518,420 – – 24,019,518,420– CAAPs – 1,691,196,598 – 1,691,196,598
Total assets 24,019,518,420 1,691,196,598 – 25,710,715,018
* Restated# Amount is less than US$1
SENSEX India ETF
30th June 2018 (Unaudited)
Level 1 Level 2 Level 3 Total
US$ US$ US$ US$
AssetsFinancial assets at fair value
through profit or loss– Investment fund – 128,600,526 – 128,600,526
Total assets – 128,600,526 – 128,600,526
31st December 2017 (Audited)*
Level 1 Level 2 Level 3 Total
US$ US$ US$ US$
AssetsFinancial assets at fair value
through profit or loss– Investment fund – 139,989,131 – 139,989,131
Total assets – 139,989,131 – 139,989,131
MSCI AC Asia ex Japan ETF
30th June 2018 (Unaudited)
Level 1 Level 2 Level 3 Total
US$ US$ US$ US$
AssetsFinancial assets at fair value
through profit or loss– Equity securities 652,462,765 1,794,923 6,696 654,264,384– Unlisted securities# – – 0 0– Unlisted rights# – 0 – 0– Exchange traded fund 63,215,865 – – 63,215,865
Total assets 715,678,630 1,794,923 6,696 717,480,249
31st December 2017 (Audited)*
Level 1 Level 2 Level 3 Total
US$ US$ US$ US$
AssetsFinancial assets at fair value
through profit or loss– Equity securities 852,065,146 – 1 852,065,147– Unlisted equities – – 0 0– Exchange traded fund 94,527,690 – – 94,527,690
Total assets 946,592,836 – 1 946,592,837

Semi-annual Report 65
Notes to the Unaudited Condensed Financial Statements (continued)
MSCI Emerging Asia ETF
30th June 2018 (Unaudited)
Level 1 Level 2 Level 3 Total
HK$ HK$ HK$ HK$
AssetsFinancial assets at fair value
through profit or loss– Equity securities 150,483,105 554,212 1,138 151,038,455– Exchange traded fund 19,742,239 – – 19,742,239– Unlisted rights# – 0 – 0
Total assets 170,225,344 554,212 1,138 170,780,694
31st December 2017 (Audited)
Level 1 Level 2 Level 3 Total
HK$ HK$ HK$ HK$
AssetsFinancial assets at fair value
through profit or loss– Equity securities 158,951,731 – 1 158,951,732– Exchange traded fund 20,978,315 – – 20,978,315
Total assets 179,930,046 – 1 179,930,047
CSI 300 ETF
30th June 2018 (Unaudited)
Level 1 Level 2 Level 3 Total
RMB RMB RMB RMB
AssetsFinancial assets at fair value
through profit or loss– Equity securities 110,362,289 1,895,552 1,526,192 113,784,033
Total assets 110,362,289 1,895,552 1,526,192 113,784,033
31st December 2017 (Audited)*
Level 1 Level 2 Level 3 Total
RMB RMB RMB RMB
AssetsFinancial assets at fair value
through profit or loss– Equity securities 145,978,089 1,113,650 3,072,219 150,163,958
Total assets 145,978,089 1,113,650 3,072,219 150,163,958
* Restated# Amount is less than US$1
KOSPI 200 ETF
30th June 2018 (Unaudited)
Level 1 Level 2 Level 3 Total
US$ US$ US$ US$
AssetsFinancial assets at fair value
through profit or loss– Equity securities 8,913,667 35,363 – 8,949,030
Total assets 8,913,667 35,363 – 8,949,030
31st December 2017 (Audited)
Level 1 Level 2 Level 3 Total
US$ US$ US$ US$
AssetsFinancial assets at fair value
through profit or loss– Equity securities 13,581,218 30,050 – 13,611,268
Total assets 13,581,218 30,050 – 13,611,268
MSCI Taiwan ETF
30th June 2018 (Unaudited)
Level 1 Level 2 Level 3 Total
US$ US$ US$ US$
AssetsFinancial assets at fair value
through profit or loss– Equity securities 149,481,660 1,671,984 – 151,153,644– Futures 7,690 – – 7,690– Unlisted rights# – 0 – 0
Total assets 149,489,350 1,671,984 – 151,161,334
31st December 2017 (Audited)
Level 1 Level 2 Level 3 Total
US$ US$ US$ US$
AssetsFinancial assets at fair value
through profit or loss– Equity securities 31,310,877 – – 31,310,877
Total assets 31,310,877 – – 31,310,877

66 iShares Asia Trust
Notes to the Unaudited Condensed Financial Statements (continued)
DAX ETF
30th June 2018 (Unaudited)
Level 1 Level 2 Level 3 Total
EUR EUR EUR EUR
AssetsFinancial assets at fair value
through profit or loss– Equity securities 2,650,809 – – 2,650,809
Total assets 2,650,809 – – 2,650,809
31st December 2017 (Audited)
Level 1 Level 2 Level 3 Total
EUR EUR EUR EUR
AssetsFinancial assets at fair value
through profit or loss– Equity securities 2,805,291 – – 2,805,291
Total assets 2,805,291 – – 2,805,291
EURO STOXX 50 ETF
30th June 2018 (Unaudited)
Level 1 Level 2 Level 3 Total
EUR EUR EUR EUR
AssetsFinancial assets at fair value
through profit or loss– Equity securities 3,296,935 – – 3,296,935– Unlisted rights+ – 0 – 0
Total assets 3,296,935 0 – 3,296,935
31st December 2017 (Audited)
Level 1 Level 2 Level 3 Total
EUR EUR EUR EUR
AssetsFinancial assets at fair value
through profit or loss– Equity securities 3,319,501 – – 3,319,501
Total assets 3,319,501 – – 3,319,501
+ Amount is less than EUR1
FTSE 100 ETF
30th June 2018 (Unaudited)
Level 1 Level 2 Level 3 Total
GBP GBP GBP GBP
AssetsFinancial assets at fair value
through profit or loss– Equity securities 2,422,858 – – 2,422,858– Unlisted equities – – 142 142
Total assets 2,422,858 – 142 2,423,000
31st December 2017 (Audited)
Level 1 Level 2 Level 3 Total
GBP GBP GBP GBP
AssetsFinancial assets at fair value
through profit or loss– Equity securities 2,761,857 – – 2,761,857– Unlisted equities – – 164 164
Total assets 2,761,857 – 164 2,762,021
NASDAQ 100 ETF
30th June 2018 (Unaudited)
Level 1 Level 2 Level 3 Total
US$ US$ US$ US$
AssetsFinancial assets at fair value
through profit or loss– Equity securities 11,749,555 – – 11,749,555
Total assets 11,749,555 – – 11,749,555
31st December 2017 (Audited)
Level 1 Level 2 Level 3 Total
US$ US$ US$ US$
AssetsFinancial assets at fair value
through profit or loss– Equity securities 9,116,638 – – 9,116,638
Total assets 9,116,638 – – 9,116,638

Semi-annual Report 67
Notes to the Unaudited Condensed Financial Statements (continued)
Hang Seng ETF
30th June 2018 (Unaudited)
Level 1 Level 2 Level 3 Total
HK$ HK$ HK$ HK$
AssetsFinancial assets at fair value
through profit or loss– Equity securities 291,241,047 – – 291,241,047
Total assets 291,241,047 – – 291,241,047
LiabilitiesFinancial liabilities at fair value
through profit or loss– Future (8,750) – – (8,750)
Total liabilities (8,750) – – (8,750)
31st December 2017 (Audited)
Level 1 Level 2 Level 3 Total
HK$ HK$ HK$ HK$
AssetsFinancial assets at fair value
through profit or loss– Equity securities 343,310,604 – – 343,310,604– Future 3,460 – – 3,460
Total assets 343,314,064 – – 343,314,064
Investments whose values are based on quoted market prices in active markets are classified within level 1. The Sub-Funds do not adjust the quoted price for these instruments.
Investments that trade in markets that are not considered to be active but are valued based on quoted market prices, dealer quotations or alternative pricing sources supported by observable inputs are classified within level 2. The Sub-Funds’ level 2 investments are mainly CAAPs and suspended equity securities.
As at 30th June 2018 and 31st December 2017, the SENSEX India ETF classified its investment in the Mauritius Subsidiary as level 2 within the fair value hierarchy, as the Manager believes the SENSEX India ETF could have redeemed its investment at the net asset value per share, as at the condensed statement of financial position date. The investment was valued at fair value using the net asset value as reported by the Mauritius Subsidiary’s administrator.
Investments classified within level 3 have significant unobservable inputs, as they are infrequently traded. As at 30th June 2018, the level 3 investments consisted of equity securities held by the MSCI China ETF, MSCI AC Asia ex Japan ETF, MSCI Emerging Asia ETF, CSI 300 ETF and FTSE 100 ETF priced using an external pricing source, that are suspended from trading and unlisted equities.
Level 3 valuations are reviewed bi-monthly by the Manager’s valuation committee who evaluates the appropriateness of the valuation of the investments.
The following present the sensitivity analysis for the level 3 investments held by the Sub-Funds as at 30th June 2018 and 31st December 2017.
MSCI China ETF
As at 30th June 2018 Fair value
Valuation technique
Unobservable inputs
Weighted average
input
Reasonable possible shift +/-
(absolute value)
Change in
valuation
HK$ HK$
Equity Securities
– Consumer Staples 72,772
Value by third party dealers or
vendors N/A N/A N/A N/A
– Information Technology 34
Value by third party dealers or
vendors N/A N/A N/A N/A
A sensitivity analysis for level 3 investments held by the MSCI China ETF as at 31st December 2017 was not presented, as it was deemed that the impact of reasonable changes in inputs was not significant.
MSCI China A ETFAs at 30th June 2018, there was no investments held by MSCI China A ETF. As at 31st December 2017, the level 3 investments included certain illiquid equity securities held by MSCI China A ETF.

68 iShares Asia Trust
Notes to the Unaudited Condensed Financial Statements (continued)
As at 31st December 2017 Fair value
Valuation technique
Unobservable inputs
Weighted average
input
Reasonable possible shift +/-
(absolute value)
Change in
valuation
RMB RMB
Equity Securities
– Consumer Discretionary 251,590
Value by third party dealers or
vendors N/A N/A N/A N/A
– Consumer Staples 27,252
Value by third party dealers or
vendors N/A N/A N/A N/A
– Health Care 261,615
Value by third party dealers or
vendors N/A N/A N/A N/A
– Industrials 152,083
Value by third party dealers or
vendors N/A N/A N/A N/A
– Information Technology 225,186
Value by third party dealers or
vendors N/A N/A N/A N/A
– Materials 636,240
Value by third party dealers or
vendors N/A N/A N/A N/A
– Real Estate 220,100
Value by third party dealers or
vendors N/A N/A N/A N/A
MSCI AC Asia ex Japan ETFA sensitivity analysis for level 3 investments held by the MSCI AC Asia ex Japan ETF as at 30th June 2018 and 31st December 2017 was not presented, as it was deemed that the impact of reasonable changes in inputs was not significant.
MSCI Emerging Asia ETFA sensitivity analysis for level 3 investments held by the MSCI Emerging Asia ETF as at 30th June 2018 and 31st December 2017 was not presented, as it was deemed that the impact of reasonable changes in inputs was not significant.
CSI 300 ETFAs at 30th June 2018, the level 3 investments included certain illiquid equity securities held by CSI 300 ETF. As at 31st December 2017, the level 3 investments included certain illiquid equity securities held by CSI 300 ETF.
As at 30th June 2018 Fair value
Valuation technique
Unobservable inputs
Weighted average
input
Reasonable possible shift +/-
(absolute value)
Change in
valuation
RMB RMB
Equity Securities
– Consumer Discretionary 327,348
Value by third party dealers or
vendors N/A N/A N/A N/A
– Energy 71,133
Value by third party dealers or
vendors N/A N/A N/A N/A
– Financials 114,960
Value by third party dealers or
vendors N/A N/A N/A N/A
– Health Care 248,940
Value by third party dealers or
vendors N/A N/A N/A N/A
– Industrials 225,492
Value by third party dealers or
vendors N/A N/A N/A N/A
– Information Technology 303,849
Value by third party dealers or
vendors N/A N/A N/A N/A
– Real Estate 234,470
Value by third party dealers or
vendors N/A N/A N/A N/A

Semi-annual Report 69
Notes to the Unaudited Condensed Financial Statements (continued)
As at 31st December 2017 Fair value
Valuation technique
Unobservable inputs
Weighted average
input
Reasonable possible shift +/-
(absolute value)
Change in
valuation
RMB RMB
Equity Securities
– Consumer Discretionary 356,517
Value by third party
dealers or vendors N/A N/A N/A N/A
– Health Care 409,458
Value by third party
dealers or vendors N/A N/A N/A N/A
– Industrials 336,489
Value by third party
dealers or vendors N/A N/A N/A N/A
– Information Technology 882,871
Value by third party
dealers or vendors N/A N/A N/A N/A
– Materials 803,860
Value by third party
dealers or vendors N/A N/A N/A N/A
– Real Estate 283,024
Value by third party
dealers or vendors N/A N/A N/A N/A
FTSE 100 ETFA sensitivity analysis for level 3 investments held by the FTSE 100 ETF as at 30th June 2018 and 31st December 2017 was not presented, as it was deemed that the impact of reasonable changes in inputs were not significant.
During the period/year ended 30th June 2018 and 31st December 2017, there were no transfers between levels of investments held by the Sub-Funds, except for the below.
The following table presents the transfers between levels of investments held for the period ended 30th June 2018 (Unaudited):
A50 China ETF
Level 1 Level 2 Level 3
RMB RMB RMB
Transfers from levels 1 to 2:AssetsFinancial assets at fair value through
profit or loss– Equity SecuritiesIndustrials (131,489,435) 131,489,435 –
(131,489,435) 131,489,435 –
The equity securities transferred from level 1 to level 2 related to securities which were suspended over two months from trading as at 30th June 2018 but were actively traded on 31st December 2017.
MSCI AC Asia ex Japan ETF
Level 1 Level 2 Level 3
US$ US$ US$
Transfers from levels 1 to 2:AssetsFinancial assets at fair value through
profit or loss– Equity SecuritiesConsumer Discretionary (243,945) 243,945 –Materials (521,211) 521,211 –Information Technology (1,029,767) 1,029,767 –
(1,794,923) 1,794,923 –
– Unlisted rights#
Financials (0) 0 –
(0) 0 –
(1,794,923) 1,794,923 –
The equity securities transferred from level 1 to level 2 related to securities which were suspended over two months from trading as at 30th June 2018 but were actively traded on 31st December 2017. The unlisted rights transferred from level 1 to level 2 related to rights which were unlisted as at 30th June 2018.
# Amount is less than US$1

70 iShares Asia Trust
Notes to the Unaudited Condensed Financial Statements (continued)
MSCI Emerging Asia ETF
Level 1 Level 2 Level 3
HK$ HK$ HK$
Transfers from levels 1 to 2: AssetsFinancial assets at fair value through
profit or loss– Equity SecuritiesConsumer Discretionary (43,861) 43,861 –Materials (97,158) 97,158 –Information Technology (413,193) 413,193 –
(554,212) 554,212 –
– Unlisted rights#
Financials (0) 0 –
(0) 0 –
(554,212) 554,212 –
The equity securities transferred from level 1 to level 2 related to securities which were suspended over two months from trading as at 30th June 2018 but were actively traded on 31st December 2017. The unlisted rights transferred from level 1 to level 2 related to rights which were unlisted as at 30th June 2018.
CSI 300 ETF
Level 1 Level 2 Level 3
RMB RMB RMB
Transfers from levels 1 to 2:AssetsFinancial assets at fair value through
profit or loss– Equity SecuritiesConsumer Discretionary (113,750) 113,750 –Industrials (880,322) 880,322 –Materials (901,480) 901,480 –
(1,895,552) 1,895,552 –
Transfers from levels 1 to 3:AssetsFinancial assets at fair value through
profit or loss– Equity SecuritiesEnergy (71,133) – 71,133Financials (114,960) – 114,960Health Care (248,940) – 248,940Industrials (225,492) – 225,492
(660,525) – 660,525
# Amount is less than HK$1
Level 1 Level 2 Level 3
RMB RMB RMB
Transfers from levels 2 to 1:AssetsFinancial assets at fair value through
profit or loss– Equity SecuritiesEnergy 124,600 (124,600) –Materials 909,035 (909,035) –
1,033,635 (1,033,635) –
Transfers from levels 3 to 1:AssetsFinancial assets at fair value through
profit or loss– Equity SecuritiesHealth Care 216,885 – (216,885)Materials 358,464 – (358,464)
575,349 – (575,349)
The equity securities transferred from level 1 to level 2 related to securities which were suspended from trading for two months or less as at 30th June 2018 but were actively traded on 31st December 2017. The equity securities transferred from level 1 to level 3 related to securities which were suspended over two months from trading as at 30th June 2018 but were actively traded on 31st December 2017. The equity securities transferred from level 2 to level 1 related to securities which were actively traded on 30th June 2018 but were suspended from trading for two months or less as at 31st December 2017. The equity securities transferred from level 3 to level 1 related to securities with active trading as at 30th June 2018 but were suspended over two months from trading on 31st December 2017.
KOSPI 200 ETF
Level 1 Level 2 Level 3
US$ US$ US$
Transfers from levels 1 to 2:AssetsFinancial assets at fair value through
profit or loss– Equity SecuritiesMaterials (35,363) 35,363 –
(35,363) 35,363 –
Transfers from levels 2 to 1:AssetsFinancial assets at fair value through
profit or loss– Equity SecuritiesConsumer Discretionary 2,867 (2,867) –Materials 3,373 (3,373) –
6,240 (6,240) –

Semi-annual Report 71
Notes to the Unaudited Condensed Financial Statements (continued)
The equity securities transferred from level 1 to level 2 related to securities which were suspended from trading for two months or less as at 30th June 2018 but were actively traded on 31st December 2017. The equity securities transferred from level 2 to level 1 related to securities which were actively traded on 30th June 2018 but were suspended from trading for two months or less as at 31st December 2017.
MSCI Taiwan ETF
Level 1 Level 2 Level 3
US$ US$ US$
Transfers from levels 1 to 2:AssetsFinancial assets at fair value through
profit or loss– Equity SecuritiesInformation Technology (1,671,984) 1,671,984 –
(1,671,984) 1,671,984 –
– Unlisted rights#
Financials (0) 0 –
(0) 0 –
(1,671,984) 1,671,984 –
The equity securities transferred from level 1 to level 2 related to securities which were suspended from trading for two months or less as at 30th June 2018 but were actively traded on 31st December 2017. The unlisted rights transferred from level 1 to level 2 related to rights which were unlisted as at 30th June 2018.
EURO STOXX 50 Index
Level 1 Level 2 Level 3
EUR EUR EUR
Transfers from levels 1 to 2:AssetsFinancial assets at fair value through
profit or loss– Unlisted rights+
Financials (0) 0 –
(0) 0 –
The unlisted rights transferred from level 1 to level 2 related to rights which were unlisted as at 30th June 2018.
# Amount is less than US$1+ Amount is less than EUR1
FTSE 100 ETF
Level 1 Level 2 Level 3
GBP GBP GBP
Transfers from levels 1 to 3:AssetsFinancial assets at fair value through
profit or loss– Equity SecuritiesIndustrials (142) – 142
(142) – 142
The equity securities transferred from level 1 to level 3 related to securities which were unlisted as at 30th June 2018.
The following table presents the transfers between levels of investments held for the year ended 31st December 2017 (Audited):
MSCI China ETF
Level 1 Level 2 Level 3
HK$ HK$ HK$
Transfers from levels 1 to 3:AssetsFinancial assets at fair value through
profit or loss– Equity securitiesConsumer Staples (7) – 7
(7) – 7
The equity securities transferred from level 1 to level 3 related to securities with active trading as at 31st December 2017 but were suspended from trading on 31st December 2016.

72 iShares Asia Trust
Notes to the Unaudited Condensed Financial Statements (continued)
MSCI China A ETF
Level 1 Level 2 Level 3
RMB RMB RMB
Transfers from levels 1 to 2:AssetsFinancial assets at fair value through
profit or loss– Equity securitiesEnergy (93,744) 93,744 –Health Care (88,564) 88,564 –Industrials (108,639) 108,639 –Information Technology (48,789) 48,789 –Materials (461,082) 461,082 –Utilities (52,894) 52,894 –
(853,712) 853,712 –
Transfers from levels 1 to 3:AssetsFinancial assets at fair value through
profit or loss– Equity securitiesConsumer Discretionary (251,590) – 251,590 Consumer Staples (27,252) – 27,252 Health Care (261,615) – 261,615 Industrials (152,083) – 152,083 Materials (419,240) – 419,240 Real Estate (89,956) – 89,956
(1,201,736) – 1,201,736
Transfers from levels 2 to 1: AssetsFinancial assets at fair value through
profit or loss– Equity securitiesConsumer Discretionary 65,412 (65,412) –
65,412 (65,412) –
Transfers from levels 2 to 3: AssetsFinancial assets at fair value through
profit or loss– Equity securitiesInformation Technology – (181,866) 181,866 Real Estate – (130,144) 130,144
– (312,010) 312,010
Transfers from levels 3 to 1: AssetsFinancial assets at fair value through
profit or loss– Equity securitiesConsumer Discretionary 49,602 – (49,602)Financials 34,000 – (34,000)
83,602 – (83,602)
The equity securities transferred from level 1 to level 2 related to securities which were suspended from trading for two months or less as at 31st December 2017 but were actively traded on 31st December 2016. The equity securities transferred from level 1 to level 3 related to securities which were suspended over two months from trading as at 31st December 2017 but were actively traded on 31st December 2016. The equity securities transferred from level 2 to level 1 related to securities which were actively traded on 31st December 2017 but were suspended from trading for two months or less as at 31st December 2016. The equity securities transferred from level 2 to level 3 related to securities which were suspended over two months from trading as at 31st December 2017 but were suspended from trading for two months or less as at 31st December 2016. The equity securities transferred from level 3 to level 1 related to securities with active trading as at 31st December 2017 but were suspended over two months from trading on 31st December 2016.
MSCI AC Asia ex Japan ETF
Level 1 Level 2 Level 3
US$ US$ US$
Transfers from levels 1 to 3:AssetsFinancial assets at fair value through
profit or loss– Equity securitiesFinancials (1) – 1
(1) – 1
The equity securities transferred from level 1 to level 3 related to securities which were suspended over two months from trading as at 31st December 2017 but were actively traded on 31st December 2016.
MSCI Emerging Asia ETF
Level 1 Level 2 Level 3
HK$ HK$ HK$
Transfers from levels 1 to 3:AssetsFinancial assets at fair value through
profit or loss– Equity SecuritiesConsumer Staples* (0) – 0
(0) – 0
The equity securities transferred from level 1 to level 3 related to securities which were suspended over two months from trading as at 31st December 2017 but were actively traded on 31st December 2016.
* Amount less than HK$1

Semi-annual Report 73
Notes to the Unaudited Condensed Financial Statements (continued)
CSI 300 ETF
Level 1 Level 2 Level 3
RMB RMB RMB
Transfers from levels 1 to 2:AssetsFinancial assets at fair value through
profit or loss– Equity SecuritiesEnergy (223,440) 223,440 –Materials (890,210) 890,210 –
(1,113,650) 1,113,650 –
Transfers from levels 1 to 3:AssetsFinancial assets at fair value through
profit or loss– Equity Securities Consumer Discretionary (356,517) – 356,517Health Care (409,458) – 409,458Industrials (336,489) – 336,489Information Technology (396,112) – 396,112Materials (803,860) – 803,860Real Estate (283,024) – 283,024
(2,585,460) – 2,585,460
Transfers from levels 2 to 1:AssetsFinancial assets at fair value through
profit or loss– Equity SecuritiesFinancials 193,550 (193,550) –
193,550 (193,550) –
Transfers from levels 2 to 3:AssetsFinancial assets at fair value through
profit or loss– Equity SecuritiesInformation Technology – (486,759) 486,759
– (486,759) 486,759
The equity securities transferred from level 1 to level 2 related to securities which were suspended from trading for two months or less as at 31st December 2017 but were actively traded on 31st December 2016. The equity securities transferred from level 1 to level 3 related to securities which were suspended over two months from trading as at 31st December 2017 but were actively traded on 31st December 2016. The equity securities transferred from level 2 to level 1 related to securities which were actively traded on 31st December 2017 but were suspended from trading for two months or less as at 31st December 2016. The equity securities transferred from level 2 to level 3 related to securities which were suspended over two months from trading as at 31st December 2017 but were suspended from trading for two months or less as at 31st December 2016.
KOSPI 200 ETF
Level 1 Level 2 Level 3
US$ US$ US$
Transfers from levels 1 to 2:AssetsFinancial assets at fair value through
profit or loss– Equity SecuritiesConsumer Discretionary (7,398) 7,398 –Materials (22,652) 22,652 –
(30,050) 30,050 –
The equity securities transferred from level 1 to level 2 were related to securities which were suspended from trading for two months or less as at 31st December 2017.
FTSE 100 ETF
Level 1 Level 2 Level 3
GBP GBP GBP
Transfers from levels 1 to 3:AssetsFinancial assets at fair value through
profit or loss– Equity SecuritiesIndustrials (164) – 164
(164) – 164
The equity securities transferred from level 1 to level 3 related to securities which were unlisted as at 31st December 2017.
The following table represents the movement in level 3 equity securities held by MSCI China ETF for the period/year ended 30th June 2018 and 31st December 2017.
As at30th June 2018
(Unaudited)HK$
As at31st December
2017(Audited)
HK$
Equity securitiesOpening balance 41 34Transfers from level 1 to level 3 – 7Sales (35,246) –Gains recognized in Condensed
Statement of Comprehensive Income 108,011 –
Closing balance 72,806 41
Total gains/(losses) for the period/year included in Condensed Statement of Comprehensive Income for assets held at the end of the reporting period/year 72,768 (2,167,569)

74 iShares Asia Trust
Notes to the Unaudited Condensed Financial Statements (continued)
The following table represents the movement in level 3 equity securities held by MSCI China A ETF for the periods ended 30th June 2018 and 31st December 2017.
As at30th June 2018
(Unaudited)RMB
As at31st December
2017(Audited)
RMB
Equity securitiesOpening balance 1,774,066 1,265,617Transfers from level 1 into level 3 – 1,201,736Transfers from level 2 into level 3 – 312,010Transfers from level 3 into level 1 – (83,602)Sales (1,508,251) (857,508)Losses recognized in Condensed
Statement of Comprehensive Income (265,815) (64,187)
Closing balance – 1,774,066
Total gains for the period included in Condensed Statement of Comprehensive Income for assets held at the end of the reporting period/year – 218,595
The following table represents the movement in level 3 equity securities held by MSCI AC Asia ex Japan ETF for the period/year ended 30th June 2018 and 31st December 2017.
As at30th June 2018
(Unaudited)US$
As at31st December
2017(Audited)
US$
Equity securitiesOpening balance 1 –Transfers from level 1 into level 3 – 1Sales (3,243) –Gains recognized in Condensed
Statement of Comprehensive Income 9,938 –
Closing balance 6,696 1
Total gains/(losses) for the period/year included in Condensed Statement of Comprehensive Income for assets held at the end of the reporting period/year 6,695 (201,810)
The following table represents the movement in level 3 equity securities held by MSCI Emerging Asia ETF for the period/year ended 30th June 2018 and 31st December 2017.
As at30th June 2018
(Unaudited)HK$
As at31st December
2017(Audited)
HK$
Equity securitiesOpening balance 1 1Transfers from level 1 into level 3* – 0Sales (551) –Losses recognized in Condensed
Statement of Comprehensive Income 1,688 –
Closing balance 1,138 1
Total gains/(losses) for the year included in Condensed Statement of Comprehensive Income for assets held at the end of the reporting period/year 1,137 (33,862)
The following table represents the movement in level 3 derivative instruments and equity securities held by CSI 300 ETF for the period/year ended 30th June 2018 and 31st December 2017.
As at30th June 2018
(Unaudited)RMB
As at31st December
2017(Audited)
RMB
CAAPs and equity securitiesOpening balance 3,072,219 191,122Transfers from level 1 to level 3 660,525 2,585,460Transfers from level 2 to level 3 – 486,759Transfers from level 3 to level 1 (575,349) –Sales (604,228) (186,371)Losses recognized in Condensed
Statement of Comprehensive Income (1,026,975) (4,751)
Closing balance 1,526,192 3,072,219
Total (losses)/gains for the period/year included in Condensed Statement of Comprehensive Income for assets held at the end of the reporting period/year (321,794) 309,920
* Amount is less than HK$1

Semi-annual Report 75
Notes to the Unaudited Condensed Financial Statements (continued)
The following table represents the movement in level 3 equity securities held by KOSPI 200 ETF for the periods ended 30th June 2018 and 31st December 2017.
As at30th June 2018
(Unaudited)US$
As at31st December
2017(Audited)
US$
Equity securitiesOpening balance – 9,681Transfers from level 1 into level 3 – –Sales – (4,570)Losses recognized in Condensed
Statement of Comprehensive Income – (5,111)
Closing balance – –
Total gains/losses for the period/year included in Condensed Statement of Comprehensive Income for assets held at the end of the reporting period/year – –
The following table represents the movement in level 3 equity securities held by FTSE 100 ETF for the periods ended 30th June 2018 and 31st December 2017.
As at30th June 2018
(Unaudited)GBP
As at31st December
2017(Audited)
GBP
Equity securitiesOpening balance 164 313Transfers from level 1 into level 3 142 164Sales (164) (313)
Closing balance 142 164
Total gains for the period/year included in Condensed Statement of Comprehensive Income for assets held at the end of the reporting period/year 142 164
11 Distribution
Hang Seng ETF
01.01.2018to 30.06.2018
(Unaudited)HK$
18.11.2016 (date of inception)
to 30.06.2017(Unaudited)
HK$
Distribution– HK$0.610 on 2,800,000 units
paid on 29th June 2018 (1,708,000) –– HK$0.710 on 3,150,000 units
paid on 30th June 2017 – (2,236,500)
12 Segment Information
The Manager makes the strategic resource allocations on behalf of the Sub-Funds and has determined the operating segments based on the reports reviewed which are used to make strategic decisions.
The Manager considers that each Sub-Fund has a single operating segment which is investing in securities. The objectives of the Sub-Funds are to track the performance of their respective index and invest in substantially all the index constituents with security weight and industry weight that are closely aligned with the characteristics of the tracked indices.
The internal financial information used by the Manager for the Sub-Funds’ assets, liabilities and performance is the same as that disclosed in the Condensed Statement of Financial Position and Condensed Statement of Comprehensive Income.
The Sub-Funds are domiciled in Hong Kong. All of the Sub-Funds’ income is derived from investments in securities which constitute the relevant tracked indices. The Sub-Funds’ investments have been categorized by relevant geography but no geographical information for performance is provided as the Manager considers that the cost to develop it would be excessive and the information is generally not used by the Manager in managing the Sub-Funds.
The Sub-Funds have no assets classified as non-current assets. The Sub-Funds have portfolios that closely correspond to the security weight and industry weight of the relevant tracked indices. Refer to note 8 for investment holdings that account for more than 10% of each Sub-Fund’s net asset value.
13 Subsequent Event
No significant events have occurred since the period end date which would impact the financial position of the Sub-Funds disclosed in the Condensed Statement of Financial Position as at 30th June 2018 or on the results and cash flows of the Sub-Funds for the period ended on that date.

76 iShares Asia Trust
iShares MSCI China Index ETF Investment Portfolio (unaudited) as at 30th June 2018
HoldingsFair value
HK$
% of Net
Assets
Investments (98.67%)
Listed equities (98.68%)
China (98.68%)220,576 3Sbio Inc 3,930,664 0.15
4,756 51Job Inc – ADR 3,643,237 0.1417,753 58.Com Inc – ADR 9,657,694 0.37
140,476 AAC Technologies Holdings In 15,522,598 0.594,600 AECC Aviation Power Co – A 121,535 0.00
334,737 Agile Group Holdings Ltd 4,472,086 0.1799,400 Agricultural Bank of China – A 404,756 0.02
5,572,772 Agricultural Bank of China – H 20,452,073 0.78404,127 Air China Ltd – H 3,063,283 0.12221,675 Alibaba Group Holding – SP ADR 322,662,668 12.34650,318 Alibaba Health Information T 4,922,907 0.19
2,545,648 Alibaba Pictures Group Ltd 2,189,257 0.08740,651 Aluminum Corp of China Ltd – H 2,562,652 0.10
28,800 Angang Steel Co Ltd – A 189,887 0.01204,000 Angang Steel Co Ltd – H 1,444,320 0.05
5,900 Anhui Conch Cement Co Ltd – A 233,822 0.01242,096 Anhui Conch Cement Co Ltd – H 10,894,320 0.42207,511 Anta Sports Products Ltd 8,622,082 0.33
11,162 Autohome Inc – ADR 8,844,662 0.3424,699 Avic Capital Co Ltd – A 136,535 0.00
469,762 Avichina Industry & Tech – H 2,193,789 0.08332,000 Baic Motor Corp Ltd – H 2,490,000 0.09
52,942 Baidu Inc – Spon ADR 100,930,977 3.8637,500 Bank of Beijing Co Ltd – A 267,668 0.0174,500 Bank of China Ltd – A 318,355 0.01
15,210,154 Bank of China Ltd – H 59,167,499 2.2658,700 Bank of Communications Co – A 398,840 0.01
1,642,528 Bank of Communications Co – H 9,871,593 0.3823,099 Bank of Jiangsu Co Ltd – A 175,267 0.0115,800 Bank of Nanjing Co Ltd – A 144,572 0.01
9,600 Bank of Ningbo Co Ltd – A 185,115 0.0113,500 Bank of Shanghai Co Ltd – A 251,848 0.0128,400 Baoshan Iron & Steel Co – A 261,881 0.01
437,000 BBMG Corp – H 1,267,300 0.05334,069 Beijing Capital Intl Airpo – H 2,762,751 0.11
98,556 Beijing Enterprises Hldgs 3,764,839 0.141,041,015 Beijing Enterprises Water Gr 4,455,544 0.17
3,300 Beijing Tongrentang Co – A 137,813 0.0037,700 BOC Aviation Ltd 1,837,875 0.0754,600 BOE Technology Group Co Lt – A 228,794 0.01
580,299 Brilliance China Automotive 8,217,034 0.313,300 BYD Co Ltd – A 186,251 0.01
129,723 BYD Co Ltd – H 6,168,329 0.24145,137 BYD Electronic Intl Co Ltd 1,558,771 0.06140,000 CAR Inc 1,097,600 0.04
2,066,640 CGN Power Co Ltd – H 4,195,279 0.1620,600 Changjiang Securities Co L – A 132,408 0.00
361,000 China Agri-Industries Hldgs 1,083,000 0.041,719,923 China Cinda Asset Manageme – H 4,334,206 0.171,740,042 China Citic Bank Corp Ltd – H 8,543,606 0.33
358,000 China Coal Energy Co – H 1,163,500 0.04850,552 China Communications Const – H 6,447,184 0.25529,262 China Communications Servi – H 2,630,432 0.10315,979 China Conch Venture Holdings 9,068,597 0.35
24,100 China Construction Bank – A 186,856 0.0118,402,206 China Construction Bank – H 133,415,994 5.10
39,199 China Eastern Airlines Co – A 307,172 0.01270,000 China Eastern Airlines Co – H 1,433,700 0.05
90,600 China Everbright Bank Co – A 392,516 0.01434,134 China Everbright Bank Co L – H 1,463,032 0.06475,439 China Everbright Intl Ltd 4,820,951 0.18181,282 China Everbright Ltd 2,610,461 0.10505,958 China Evergrande Group 10,119,160 0.39606,000 China First Capital Group Lt 3,030,000 0.12
HoldingsFair value
HK$
% of Net
Assets
China (98.68%) Continued4,700 China Fortune Land Develop – A 143,260 0.01
654,279 China Galaxy Securities Co – H 2,636,744 0.10327,309 China Gas Holdings Ltd 10,326,599 0.39
1,929,532 China Huarong Asset Manage – H 4,380,038 0.17485,149 China Huishan Dairy Holdings 72,772 0.00192,400 China International Capita – H 2,689,752 0.10
82,200 China International Marine – H 845,016 0.033,600 China International Travel – A 274,476 0.018,400 China Intl Marine Contain – A 132,046 0.00
975,188 China Jinmao Holdings Group 3,842,241 0.151,431,996 China Life Insurance Co – H 28,997,919 1.11
34,400 China Literature Ltd 2,535,280 0.10604,995 China Longyuan Power Group – H 3,823,568 0.15281,846 China Medical System Holding 4,419,345 0.17527,166 China Mengniu Dairy Co 14,022,616 0.54
29,800 China Merchants Bank – A 932,666 0.04750,560 China Merchants Bank – H 21,728,712 0.83254,709 China Merchants Port Holding 4,060,061 0.15
10,199 China Merchants Securities – A 165,155 0.0110,598 China Merchants Shekou Ind – A 238,983 0.0143,900 China Minsheng Banking – A 363,757 0.01
1,263,019 China Minsheng Banking – H 7,085,537 0.271,177,339 China Mobile Ltd 82,060,528 3.14
626,541 China Molybdenum Co Ltd – H 2,380,856 0.09745,520 China National Building Ma – H 5,792,690 0.22
28,700 China National Nuclear Pow – A 191,946 0.01331,925 China Oilfield Services – H 2,459,564 0.09739,805 China Overseas Land & Invest 19,123,959 0.73
9,000 China Pacific Insurance Gr – A 339,313 0.01500,683 China Pacific Insurance Gr – H 15,195,729 0.58
39,800 China Petroleum & Chemical – A 305,757 0.014,873,066 China Petroleum & Chemical – H 34,160,193 1.31
753,000 China Power International 1,362,930 0.0519,100 China Railway Construction – A 194,890 0.01
375,861 China Railway Construction – H 2,988,095 0.11755,934 China Railway Group Ltd – H 4,475,129 0.17267,000 China Railway Signal & Com – H 1,487,190 0.06
1,000,000 China Reinsurance Group Co – H 1,720,000 0.07279,205 China Resources Beer Holding 10,637,711 0.41372,000 China Resources Cement 2,957,400 0.11171,959 China Resources Gas Group Lt 5,846,606 0.22534,130 China Resources Land Ltd 14,127,739 0.54312,857 China Resources Pharmaceutic 3,397,627 0.13371,050 China Resources Power Holdin 5,127,911 0.20652,152 China Shenhua Energy Co – H 12,143,070 0.46
11,100 China Southern Airlines Co – A 111,027 0.00402,391 China Southern Airlines Co – H 2,482,752 0.09
64,960 China State Construction – A 419,843 0.02403,029 China State Construction Int 3,244,383 0.12309,851 China Taiping Insurance Hold 7,606,842 0.29
2,674,072 China Telecom Corp Ltd – H 9,813,844 0.37430,000 China Traditional Chinese Me 2,919,700 0.11402,000 China Travel Intl Inv HK 1,230,120 0.05
1,176,366 China Unicom Hong Kong Ltd 11,528,387 0.4414,100 China Vanke Co Ltd – A 410,585 0.02
233,573 China Vanke Co Ltd – H 6,411,579 0.2422,500 China Yangtze Power Co Ltd – A 429,867 0.02
298,400 China Zhongwang Holdings Ltd 1,238,360 0.053,212,000 Chong Sing Holdings Fintech 2,922,920 0.11
16,700 Chongqing Changan Automob – A 177,913 0.01120,100 Chongqing Changan Automobi – B 952,393 0.04451,106 Chongqing Rural Commercial – H 2,106,665 0.08625,588 CIFI Holdings Group Co Ltd 3,121,684 0.12
1,117,053 Citic Ltd 12,354,606 0.4715,300 Citic Securities Co – A 300,098 0.01
450,324 Citic Securities Co Ltd – H 7,061,080 0.273,428,308 CNOOC Ltd 46,419,290 1.77

Semi-annual Report 77
iShares MSCI China Index ETF (continued)
Investment Portfolio (unaudited) as at 30th June 2018
HoldingsFair value
HK$
% of Net
Assets
China (98.68%) Continued719,000 Cosco Shipping Development – H 941,890 0.04200,000 Cosco Shipping Energy Tran – H 756,000 0.03
25,000 Cosco Shipping Holdings Co – A 145,597 0.01495,500 Cosco Shipping Holdings Co – H 1,783,800 0.07360,996 Cosco Shipping Ports Ltd 2,360,914 0.09
1,454,733 Country Garden Holdings Co 20,075,315 0.7731,400 CRRC Corp Ltd – A 286,199 0.01
787,235 CRRC Corp Ltd – H 4,794,261 0.18902,739 CSPC Pharmaceutical Group Lt 21,394,914 0.82
75,333 Ctrip.Com International – ADR 28,150,344 1.08377,000 Dali Foods Group Co Ltd 2,280,850 0.09
24,100 Daqin Railway Co Ltd – A 234,212 0.01554,000 Datang Intl Power Gen Co – H 1,329,600 0.05500,385 Dongfeng Motor Grp Co Ltd – H 4,153,196 0.16145,050 ENN Energy Holdings Ltd 11,190,608 0.43
10,500 Everbright Securitie Co – A 136,471 0.0039,496 Fang Holdings Ltd – Adr 1,202,272 0.05
447,665 Far East Horizon Ltd 3,406,731 0.1320,160 Focus Media Information Te – A 228,376 0.01
3,900 Foshan Haitian Flavouring – A 339,959 0.01496,573 Fosun International Ltd 7,329,418 0.28
23,900 Founder Securities Co Ltd – A 189,266 0.011,330,384 Fullshare Holdings Ltd 5,161,890 0.20
338,000 Future Land Development Hold 2,399,800 0.093,800 Future Land Holdings Co – A 139,307 0.01
103,853 Fuyao Glass Industry Group – H 2,752,105 0.102,291,178 GCL-Poly Energy Holdings Ltd 1,695,472 0.06
11,293 GDS Holdings Ltd – ADR 3,551,921 0.14946,761 Geely Automobile Holdings Lt 19,266,586 0.74150,000 Genscript Biotech Corp 3,255,000 0.12
10,100 GF Securities Co Ltd – A 158,650 0.01301,917 GF Securities Co Ltd – H 3,453,931 0.13
2,481,575 Gome Retail Holdings Ltd 1,985,260 0.08593,334 Great Wall Motor Company – H 3,560,004 0.14
4,800 Gree Electric Appliances I – A 267,899 0.0116,500 Greenland Holdings Corp Lt – A 127,735 0.00
163,500 Greentown China Holdings 1,720,020 0.07595,206 Guangdong Investment Ltd 7,416,267 0.28589,872 Guangzhou Automobile Group – H 4,524,318 0.17175,694 Guangzhou R&F Properties – H 2,782,993 0.11
11,000 Guosen Securities Co Ltd – A 118,490 0.0025,900 Guotai Junan Securities Co – A 451,904 0.0293,600 Guotai Junan Securities Co – H 1,561,248 0.06
235,892 Haier Electronics Group Co 6,333,700 0.24115,780 Haitian International Hldgs 2,144,246 0.08646,776 Haitong Securities Co Ltd – H 5,128,934 0.20
3,353,670 Hanergy Thin Film Power Grou 34 0.0014,500 Hangzhou Hikvision Digital – A 637,296 0.02
2,200 Han’s Laser Technology In – A 138,516 0.015,600 Henan Shuanghui Investment – A 175,067 0.01
139,049 Hengan Intl Group Co Ltd 10,498,200 0.404,232,000 Hengten Networks Group Ltd 1,184,960 0.05
32,800 Huadian Power Intl Corp – A 152,198 0.01286,000 Huadian Power Intl Corp – H 886,600 0.03
3,000 Huadong Medicine Co Ltd – A 171,343 0.01825,618 Huaneng Power Intl Inc – H 4,293,214 0.16883,101 Huaneng Renewables Corp – H 2,304,894 0.09
8,700 Huatai Securities Co Ltd – A 154,166 0.01324,005 Huatai Securities Co Ltd – H 4,043,582 0.15
23,500 Huaxia Bank Co Ltd – A 207,240 0.015,700 Huayu Automotive Systems – A 160,044 0.01
25,158 Huazhu Group Ltd – Adr 8,287,811 0.323,699 Iflytek Co Ltd – A 140,421 0.01
77,000 Ind & Comm Bk of China – A 484,898 0.0213,286,688 Ind & Comm Bk of China – H 77,992,859 2.98
31,900 Industrial Bank Co Ltd – A 543,753 0.0221,400 Industrial Securities Co – A 133,497 0.00
HoldingsFair value
HK$
% of Net
Assets
China (98.68%) Continued85,400 Inner Mongolia Baotou Ste – A 156,689 0.01
9,700 Inner Mongolia Yili Indus – A 320,350 0.01192,600 Inner Mongolia Yitai Coal – B 2,056,517 0.08138,433 JD.Com Inc – ADR 42,302,395 1.62221,727 Jiangsu Express Co Ltd – H 2,073,147 0.08
6,200 Jiangsu Hengrui Medicine C – A 556,007 0.022,300 Jiangsu Yanghe Brewery – A 358,288 0.01
276,694 Jiangxi Copper Co Ltd – H 2,766,940 0.11186,000 Jiayuan International Group 2,529,600 0.10403,000 Kaisa Group Holdings Ltd 1,350,050 0.05
8,899 Kingboard Holdings Ltd – A (formerly known as Kingboard Chemical Holdings – A) 241,016 0.01
136,941 Kingboard Chemical Holdings 3,930,207 0.15203,500 Kingboard Laminates Hldg Ltd 1,971,915 0.08380,000 Kingdee International Sftwr 3,051,400 0.12148,971 Kingsoft Corp Ltd 3,545,510 0.14619,452 Kunlun Energy Co Ltd 4,255,635 0.16
1,842 Kweichow Moutai Co Ltd – A 1,594,882 0.06239,000 KWG Property Holding Ltd 2,356,540 0.09277,404 Lee & Man Paper Manufacturin 2,202,588 0.08
61,900 Legend Holdings Corp – H 1,479,410 0.061,406,145 Lenovo Group Ltd 5,976,116 0.23
258,000 Logan Property Holdings Co L 2,739,960 0.10283,079 Longfor Group Holdings Ltd
(formerly known as Longfor Properties) 5,987,121 0.23
5,600 Longi Green Energy Technol – A 110,635 0.005,900 Luxshare Precision Industr – A 157,418 0.01
217,500 Luye Pharma Group Ltd 1,750,875 0.072,600 Luzhou Laojiao Co Ltd – A 187,307 0.017,800 Meinian Onehealth Healthca – A 208,666 0.01
339,451 Meitu Inc 2,325,239 0.0956,200 Metallurgical Corp of Chin – A 221,528 0.01
400,000 Metallurgical Corp of Chin – H 928,000 0.0410,121 Midea Group Co Ltd – A 625,617 0.02
452,000 MMG Ltd 2,481,480 0.0921,546 Momo Inc – Spon ADR 7,353,156 0.2815,199 Netease Inc – ADR 30,129,127 1.15
4,100 New China Life Insurance C – A 208,107 0.01156,939 New China Life Insurance C – H 5,124,058 0.20
27,315 New Oriental Educatio – SP ADR 20,285,493 0.78187,255 Nexteer Automotive Group Ltd 2,172,158 0.08316,004 Nine Dragons Paper Holdings 3,160,040 0.12
23,700 Ningbo Zhoushan Port Co Lt – A 118,108 0.005,451 Noah Holdings Ltd – Spon Ads 2,230,223 0.09
12,499 Orient Securities Co Ltd – A 135,081 0.001,398,785 People’s Insurance Co Grou – H 5,161,517 0.20
23,200 Petrochina Co Ltd – A 211,734 0.014,069,604 Petrochina Co Ltd – H 24,295,536 0.931,331,529 PICC Property & Casualty – H 11,278,051 0.43
26,500 Ping An Bank Co Ltd – A 285,140 0.0115,800 Ping An Insurance Group Co – A 1,095,607 0.04
998,568 Ping An Insurance Group Co – H 72,096,610 2.7618,298 Poly Real Estate Group Co – A 264,248 0.01
521,000 Postal Savings Bank of Chi – H 2,662,310 0.1026,200 Power Construction Corp of – A 166,232 0.0110,800 Qingdao Haier Co Ltd – A 246,223 0.0111,899 Saic Motor Corp Ltd – A 492,836 0.02
7,898 Sanan Optoelectronics Co L – A 179,688 0.0114,496 Sany Heavy Industry Co Ltd – A 153,918 0.01
541,099 Semiconductor Manufacturing 5,519,210 0.21385,146 Shandong Weigao Gp Medical – H 2,137,560 0.08625,539 Shanghai Electric Grp Co L – H 1,651,423 0.06
3,800 Shanghai Fosun Pharmaceuti – A 186,178 0.0192,296 Shanghai Fosun Pharmaceuti – H 3,973,343 0.15
112,011 Shanghai Industrial Hldg Ltd 2,047,561 0.08

78 iShares Asia Trust
iShares MSCI China Index ETF (continued)
Investment Portfolio (unaudited) as at 30th June 2018
HoldingsFair value
HK$
% of Net
Assets
China (98.68%) Continued198,099 Shanghai Lujiazui Fin&Trad – B 2,225,580 0.08
8,799 Shanghai Oriental Pearl Gr – A 156,858 0.0110,500 Shanghai Pharmaceuticals – A 297,054 0.01
175,639 Shanghai Pharmaceuticals – H 3,802,584 0.1544,500 Shanghai Pudong Devel Bank – A 503,578 0.0254,200 Shenwan Hongyuan Group Co – A 280,368 0.0134,100 Shenzhen Energy Group Co L – A 199,402 0.01
168,000 Shenzhen Intl Holdings 2,728,320 0.10500,000 Shenzhen Investment Ltd 1,430,000 0.05
15,700 Shenzhen Overseas Chinese – A 134,365 0.00144,483 Shenzhou International Group 13,993,179 0.53220,194 Shimao Property Holdings Ltd 4,535,996 0.17654,500 Shui On Land Ltd 1,302,455 0.05
13,300 Sichuan Chuantou Energy Co – A 137,283 0.01808,658 Sihuan Pharmaceutical Hldgs 1,415,152 0.05
12,262 Sina Corp 8,147,255 0.311,285,248 Sino Biopharmaceutical 15,474,386 0.59
609,318 Sino-Ocean Group Holding Ltd 2,778,490 0.11243,500 Sinopec Engineering Group – H 1,996,700 0.08656,317 Sinopec Shanghai Petrochem – H 3,137,195 0.12229,393 Sinopharm Group Co – H 7,237,349 0.28374,000 Sinotrans Limited – H 1,548,360 0.06130,500 Sinotruk Hong Kong Ltd 1,686,060 0.06326,000 Skyworth Digital Hldgs Ltd 1,141,000 0.04343,761 Soho China Ltd 1,282,229 0.05284,000 SSY Group Ltd 2,473,640 0.09462,686 Sun Art Retail Group Ltd 4,747,158 0.18463,843 Sunac China Holdings Ltd 12,732,490 0.49
16,798 Suning.Com Co Ltd – A 279,968 0.01136,713 Sunny Optical Tech 19,960,098 0.76
63,522 Tal Education Group – ADR 18,339,599 0.701,092,672 Tencent Holdings Ltd 430,294,234 16.46
383,311 Tingyi (Cayman Isln) Hldg Co 6,976,260 0.27103,000 Tong Ren Tang Technologies – H 1,283,380 0.05
4,600 Tonghua Dongbao Pharmaceut – A 130,519 0.0053,800 Tongling Nonferrous Metals – A 140,742 0.01
186,000 Towngas China Co Ltd 1,415,460 0.05181,935 Travelsky Technology Ltd – H 4,157,215 0.16
80,406 Tsingtao Brewery Co Ltd – H 3,465,499 0.136,400 Tus-Sound Environmen-Res A 132,425 0.00
243,000 Uni-President China Holdings 2,449,440 0.0985,055 Vipshop Holdings Ltd – ADR 7,240,148 0.28
952,452 Want Want China Holdings Ltd 6,648,115 0.258,933 Weibo Corp-Spon ADR 6,220,603 0.24
359,721 Weichai Power Co Ltd – H 3,892,181 0.155,800 Wuliangye Yibin Co Ltd – A 521,783 0.02
94,000 Wuxi Biologics Cayman Inc 8,210,900 0.31119,000 Xinjiang Goldwind Sci&Tec – H 1,136,450 0.04
10,699 Xinjiang Goldwind Sci&Tech – A 160,081 0.01552,000 Xinyi Solar Holdings Ltd 1,330,320 0.05354,097 Yanzhou Coal Mining Co – H 3,633,035 0.14
17,100 Yonghui Superstores Co Ltd – A 154,646 0.011,232,000 Yuexiu Property Co Ltd 1,848,000 0.07
70,420 Yum China Holdings Inc 21,248,250 0.811,800 Yunnan Baiyao Group Co Ltd – A 227,899 0.01
313,000 Yuzhou Properties Co 1,442,930 0.058,626 YY Inc – ADR 6,799,292 0.261,199 Zhangzhou Pientzehuang Pha – A 158,860 0.01
208,000 Zhaojin Mining Industry – H 1,245,920 0.0529,400 Zhejiang China Commodities – A 149,994 0.01
3,900 Zhejiang Chint Electrics – A 103,040 0.005,600 Zhejiang Dahua Technology – A 149,480 0.01
242,994 Zhejiang Expressway Co – H 1,700,958 0.061,000 Zhejiang Huayou Cobalt Co – A 115,377 0.00
21,700 Zhejiang Zheneng Electric – A 119,700 0.0031,000 Zhongan Online P&C Insuran – H 1,536,050 0.06
107,500 Zhongsheng Group Holdings 2,531,625 0.10
HoldingsFair value
HK$
% of Net
Assets
China (98.68%) Continued104,573 Zhuzhou CRRC Times Electri – H 3,900,573 0.15
1,113,299 Zijin Mining Group Co Ltd – H 3,339,897 0.13151,871 ZTE Corp – H 1,810,302 0.07
Total listed equity 2,580,350,435 98.68
Futures (-0.01%)
China (-0.01%)57 HSCEI Futures Jul 18 (246,150) (0.01)
Total futures (246,150) (0.01)
Total investments 2,580,104,285 98.67Other net assets 34,748,772 1.33
Net assets attributable to
unitholders at 30th June 2018 2,614,853,057 100.00
Total investments, at cost 2,153,930,645

Semi-annual Report 79
iShares MSCI China Index ETF Statement of Movements in Investment Portfolio (unaudited) For the period ended 30th June 2018
% of net asset value 30th June
2018
% of net asset value
31st December 2017
Financial assetsListed equities – By SectorConsumer Discretionary 9.50 9.31Consumer Staples 2.54 2.12Energy 5.00 4.66Financials 21.03 22.83Health Care 3.60 2.42Industrials 4.39 4.23Information Technology 38.76 41.12Materials 1.84 1.54Real Estate 5.34 4.71Telecommunication Services 4.05 4.86Utilities 2.63 2.11
98.68 99.91 FuturesHSCEI Futures Jul 2018 (0.01) – Total investments 98.67 99.91Other net assets 1.33 0.09 Net assets attributable to unitholders 100.00 100.00

80 iShares Asia Trust
iShares MSCI China Index ETF Performance Record (unaudited)
Net Asset Value
DealingNet asset value
per unitHK$
DealingNet asset value
of the Sub-FundHK$
At end of financial period dated31st December 2016 18.49 1,408,897,97231st December 2017 28.05 2,406,867,73830th June 2018 27.58 2,614,853,057
Highest and lowest net asset value per unit
Highest net assetvalue per unit
HK$
Lowest net assetvalue per unit
HK$
Financial period ended31st December 2009 22.61 11.5831st December 2010 24.50 18.5731st December 2011 23.35 15.0031st December 2012 20.66 16.9231st December 2013 21.89 17.0031st December 2014 22.56 18.1031st December 2015 27.37 18.2131st December 2016 21.02 15.2831st December 2017 29.42 18.5830th June 2018 32.11 26.94

Semi-annual Report 81
iShares MSCI China A International Index ETF Investment Portfolio (unaudited) as at 30th June 2018
HoldingsFair value
RMB
% ofNet
Assets
Investments
Listed equities
China11,846 Beijing Xinwei Technology – A 176,562 –
3,900 China Media Group – A 30,186 –40,400 Hainan Airlines Holding Co – A 120,546 –
3,600 Hainan Haiyao Co Ltd – A 54,864 –4,500 Hengkang Medical Group Co – A 63,900 –4,800 HNA Technology Co Ltd – A (formerly
known as Tianjin Tianhai Investment – A) 29,040 –
10,000 Jiangsu Shagang Co Ltd – A 206,200 –10,600 Kaidi Ecological – A 52,894 –
3,400 Wanda Film Holding Co Ltd – A 176,664 –24,900 Zhongtian Financial Group – A 123,006 –
Total investments 1,033,862 –Other net liabilities (1,033,862) –
Net assets attributable to
unitholders at 30th June 2018 – –
Total investments, at cost 1,120,431
Remark: Percentage of net asset value is not presented due to net asset value is zero as at 30th June 2018.Note: As pursuant to the Suspended Stocks Purchase Agreement, the suspended stocks listed above are currently held by the Trustee on trust in the name of the MSCI China A ETF.

82 iShares Asia Trust
iShares MSCI China A International Index ETF (continued)
Statement of Movements in Investment Portfolio (unaudited) as at 30th June 2018
% of net asset value 30th June
2018
% of net asset value
31st December 2017
Financial assets at fair value through profit or lossListed equitiesConsumer Discretionary – 10.67Consumer Staples – 10.34Energy – 2.22Financials – 26.58Health Care – 6.28Industrials – 15.61Information Technology – 9.19Materials – 9.97Real Estate – 5.53Telecommunication Services – 0.11Utilities – 2.94 Total investments – 99.44Other net assets/(liabilities) – 0.56 Net assets attributable to unitholders – 100.00
Remark: Percentage of net asset value is not presented due to net asset value is zero as at 30th June 2018.Note: As pursuant to the Suspended Stocks Purchase Agreement, the suspended stocks listed above are currently held by the Trustee on trust in the name of the MSCI China A ETF.

Semi-annual Report 83
iShares MSCI China A International Index ETF Performance Record (unaudited)
Net Asset Value
DealingNet asset value
per unitRMB
DealingNet asset value
of the Sub-FundRMB
At end of financial period dated31st December 2016 6.29 66,073,23431st December 2017 7.49 67,434,46030th June 2018 – –
Highest and lowest net asset value per unit
Highest net assetvalue per unit
RMB
Lowest net assetvalue per unit
RMB
Financial period ended31st December 2016 (since inception) 6.86 5.4431st December 2017 7.81 6.2930th June 2018 8.07 7.08

84 iShares Asia Trust
HoldingsFair value
RMB
% ofNet
Assets
Investments (99.37%)
Listed equities (99.37%)
China (99.37%)122,194,811 Agricultural Bank of China – A 420,350,150 2.48
6,055,167 Anhui Conch Cement Co Ltd – A 202,726,991 1.1944,324,559 Bank of Beijing Co Ltd – A 267,277,091 1.5773,541,311 Bank of China Ltd – A 265,484,133 1.5669,372,636 Bank of Communications Co – A 398,198,931 2.3411,139,356 Bank of Shanghai Co Ltd – A 175,556,251 1.0318,440,283 Baoshan Iron & Steel Co – A 143,649,805 0.8572,369,174 Boe Technology Group Co Lt – A 256,186,876 1.51
2,618,101 BYD Co Ltd – A 124,831,056 0.749,315,988 China Citic Bank Corp Ltd – A 57,852,285 0.344,820,524 China Communications Const – A 54,905,768 0.32
31,532,153 China Construction Bank – A 206,535,602 1.2249,031,623 China Everbright Bank Co – A 179,455,740 1.06
4,984,425 China Life Insurance Co – A 112,249,251 0.6640,695,921 China Merchants Bank – A 1,076,000,151 6.33
7,266,690 China Merchants Shekou Ind – A 138,430,445 0.8279,755,775 China Minsheng Banking – A 558,290,425 3.29
8,729,388 China Molybdenum Co Ltd – A 54,907,851 0.328,756,135 China Pacific Insurance Gr – A 278,882,900 1.64
33,319,000 China Petroleum & Chemical – A 216,240,310 1.2717,602,334 China Railway Group Ltd – A 131,489,435 0.77
6,767,697 China Shenhua Energy Co – A 134,947,878 0.7958,186,316 China State Construction – A 317,697,285 1.8726,023,453 China United Network – A 128,035,389 0.7522,379,730 China Vanke Co Ltd – A 550,541,358 3.2413,860,183 China Yangtze Power Co Ltd – A 223,703,354 1.3226,899,325 Citic Securities Co – A 445,721,815 2.6225,466,173 CRRC Corp Ltd – A 196,089,532 1.1523,516,186 Focus Media Information Te – A 225,049,900 1.33
935,183 Foshan Haitian Flavouring – A 68,866,876 0.413,868,378 Foxconn Industrial Interne – A 71,332,890 0.42
14,724,439 Gree Electric Appliances I – A 694,257,299 4.0911,666,852 Guotai Junan Securities Co – A 171,969,398 1.01
9,668,530 Hangzhou Hikvision Digital – A 358,992,519 2.1174,739,270 Ind & Comm Bk of China – A 397,612,916 2.3447,950,570 Industrial Bank Co Ltd – A 690,488,208 4.0717,250,747 Inner Mongolia Yili Indus – A 481,295,841 2.83
5,860,913 Jiangsu Hengrui Medicine C – A 444,022,769 2.611,544,943 Jiangsu Yanghe Brewery – A 203,314,499 1.201,529,997 Kweichow Moutai Co Ltd – A 1,119,131,606 6.59
13,583,893 Midea Group Co Ltd – A 709,350,892 4.182,241,537 New China Life Insurance C – A 96,117,107 0.57
14,155,488 Petrochina Co Ltd – A 109,138,812 0.6425,210,824 Ping An Bank Co Ltd – A 229,166,390 1.3531,953,386 Ping An Insurance Group Co – A 1,871,829,352 11.0223,763,859 Poly Real Estate Group Co – A 289,919,080 1.71
9,414,600 Saic Motor Corp Ltd – A 329,416,854 1.9410,489,273 Shanghai International Por – A 62,516,067 0.3749,777,522 Shanghai Pudong Devel Bank – A 475,873,110 2.80
6,092,090 Wuliangye Yibin Co Ltd – A 462,998,840 2.73
Total investments 16,878,899,283 99.37Other net assets 107,295,820 0.63
Net assets attributable to
unitholders at 30th June 2018 16,986,195,103 100.00
Total investments, at cost 15,177,960,972
iShares FTSE A50 China Index ETFInvestment Portfolio (unaudited) as at 30th June 2018
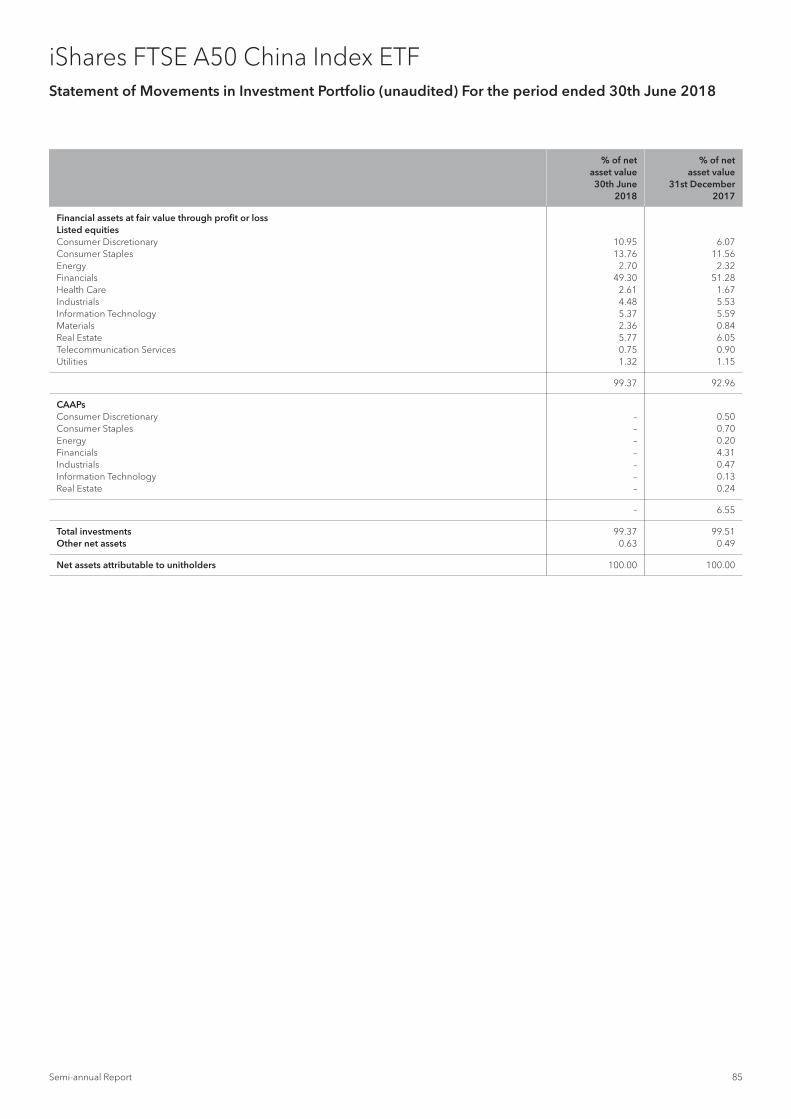
Semi-annual Report 85
iShares FTSE A50 China Index ETFStatement of Movements in Investment Portfolio (unaudited) For the period ended 30th June 2018
% of net asset value 30th June
2018
% of net asset value
31st December 2017
Financial assets at fair value through profit or lossListed equitiesConsumer Discretionary 10.95 6.07Consumer Staples 13.76 11.56Energy 2.70 2.32Financials 49.30 51.28Health Care 2.61 1.67Industrials 4.48 5.53Information Technology 5.37 5.59Materials 2.36 0.84Real Estate 5.77 6.05Telecommunication Services 0.75 0.90Utilities 1.32 1.15
99.37 92.96 CAAPsConsumer Discretionary – 0.50Consumer Staples – 0.70Energy – 0.20Financials – 4.31Industrials – 0.47Information Technology – 0.13Real Estate – 0.24
– 6.55 Total investments 99.37 99.51Other net assets 0.63 0.49 Net assets attributable to unitholders 100.00 100.00

86 iShares Asia Trust
iShares FTSE A50 China Index ETFPerformance Record (unaudited)
Net Asset Value
DealingNet asset value
per unit
DealingNet asset value
of the Sub-Fund
At end of financial period dated31st December 2016 HK$10.86 HK$28,814,166,35231st December 2017 HK$15.08 HK$30,916,836,53130th June 2018* RMB11.13 RMB16,986,195,097
Highest and lowest net asset value per unit
Highest net assetvalue per unit
Lowest net assetvalue per unit
Financial period ended31st December 2009 HK$16.49 HK$8.3931st December 2010 HK$14.69 HK$10.4631st December 2011 HK$12.73 HK$9.4531st December 2012 HK$10.85 HK$8.7931st December 2013 HK$11.55 HK$8.5331st December 2014 HK$14.00 HK$7.8431st December 2015 HK$18.18 HK$9.9931st December 2016 HK$11.99 HK$9.7031st December 2017 HK$15.97 HK$10.9430th June 2018* RMB14.15 RMB10.86
* For iShares FTSE A50 China Index ETF, the base currency was changed from Hong Kong dollar (“HK$”) to Renminbi (“RMB”), effective from 1st January 2018.

Semi-annual Report 87
iShares Core S&P BSE SENSEX India Index ETF Investment Portfolio (unaudited) as at 30th June 2018
HoldingsFair value
US$
% ofNet
Assets
Investments (99.62%)
India (99.62%)
Investment fund39,861,300 iShares BSE SENSEX Mauritius
Company 128,600,526 99.62
Total investments 128,600,526 99.62Other net assets 488,337 0.38
Net assets attributable to
unitholders at 30th June 2018 129,088,863 100.00
Total investments, at cost 81,398,489

88 iShares Asia Trust
iShares Core S&P BSE SENSEX India Index ETF Investment Portfolio of iShares BSE SENSEX Mauritius Company (unaudited) as at 30th June 2018
HoldingsFair value
US$
% ofNet
Assets
Investments (99.64%)
India (99.64%)
Listed equities198,778 Adani Ports and Special Econ 1,079,259 0.84113,880 Asian Paints Ltd 2,101,083 1.63454,746 Axis Bank Ltd 3,387,614 2.63
34,355 Bajaj Auto Ltd 1,409,575 1.10282,718 Bharti Airtel Ltd 1,572,146 1.22329,280 Coal India Ltd 1,270,694 0.99510,172 HDFC Bank Limited 15,696,827 12.21
32,469 Hero Motocorp Ltd 1,645,391 1.28178,790 Hindustan Unilever Ltd 4,284,410 3.33420,393 Housing Development Finance 11,703,081 9.10
1,607,277 ICICI Bank Ltd 6,462,889 5.03127,183 Indusind Bank Ltd 3,599,883 2.80476,122 Infosys Ltd 9,080,821 7.06
2,133,491 ITC Ltd 8,284,540 6.44295,723 Kotak Mahindra Bank Ltd 5,791,449 4.50305,311 Larsen & Toubro Ltd 5,665,064 4.40232,441 Mahindra & Mahindra Ltd 3,042,445 2.37
33,283 Maruti Suzuki India Ltd 4,285,135 3.33770,634 NTPC Ltd 1,793,441 1.39713,164 Oil & Natural Gas Corp Ltd 1,646,684 1.28555,027 Power Grid Corp of India Ltd 1,512,016 1.18809,302 Reliance Industries Ltd 11,492,525 8.94961,570 State Bank of India 3,639,132 2.83267,865 Sun Pharmaceutical Indus 2,191,516 1.70249,420 Tata Consultancy Svcs Ltd 6,724,493 5.23474,075 Tata Motors Ltd 1,863,364 1.45130,907 Tata Motors Ltd – A-Dvr 303,217 0.24196,367 Tata Steel Ltd 1,627,483 1.26465,702 Vedanta Ltd 1,602,412 1.25289,608 Wipro Ltd 1,104,919 0.86459,259 Yes Bank Ltd 2,276,353 1.77
Total investments 128,139,861 99.64Other net assets 458,200 0.36
Net assets attributable to
unitholders at 30th June 2018 128,598,061 100.00

Semi-annual Report 89
iShares Core S&P BSE SENSEX India Index ETF Statement of Movements in Investment Portfolio (unaudited) For the period ended 30th June 2018
% of net asset value 30th June
2018
% of net asset value
31st December 2017
Financial assets at fair value through profit or lossInvestment FundiShares BSE SENSEX Mauritius Company 99.62 99.43 Total investments 99.62 99.43Other net assets 0.38 0.57 Net assets attributable to unitholders 100.00 100.00

90 iShares Asia Trust
iShares Core S&P BSE SENSEX India Index ETF Performance Record (unaudited)
Net Asset Value
DealingNet asset value
per unit
DealingNet asset value
of the Sub-Fund
At end of financial period dated31st December 2016 HK$17.77 HK$799,612,92031st December 2017 HK$24.57 HK$1,100,585,94030th June 2018* US$3.04 US$132,742,383
Highest and lowest net asset value per unit
Highest net assetvalue per unit
Lowest net assetvalue per unit
Financial period ended31st December 2009 HK$16.54 HK$6.9831st December 2010 HK$20.86 HK$14.9231st December 2011 HK$20.29 HK$12.6931st December 2012 HK$16.57 HK$12.5831st December 2013 HK$16.58 HK$11.8031st December 2014 HK$20.75 HK$14.4331st December 2015 HK$21.59 HK$16.8031st December 2016 HK$19.82 HK$15.0931st December 2017 HK$24.57 HK$17.6730th June 2018* US$3.36 US$2.95
* For iShares Core S&P BSE SENSEX India Index ETF, the base currency was changed from Hong Kong dollar (“HK$”) to United States dollar (“US$”), effective from 1st January 2018.

Semi-annual Report 91
iShares Core MSCI AC Asia ex Japan Index ETF Investment Portfolio (unaudited) as at 30th June 2018
HoldingsFair value
US$
% ofNet
Assets
Investments (99.38%)
Listed equities (90.62%)
China (41.59%)166,444 3Sbio Inc 378,058 0.05
3,797 51Job Inc – ADR 370,739 0.0514,315 58.Com Inc – ADR 992,602 0.14
113,187 AAC Technologies Holdings In 1,594,193 0.22245,232 Agile Group Holdings Ltd 417,605 0.06153,392 Agricultural Bank of China – A 79,614 0.01
4,383,163 Agricultural Bank of China – H 2,050,387 0.281,865,105 AIA Group Ltd 16,308,332 2.26
315,328 Air China Ltd – H 304,659 0.04179,618 Alibaba Group Holding – SP ADR 33,324,528 4.62539,115 Alibaba Health Information T 520,187 0.07
2,130,498 Alibaba Pictures Group Ltd 233,540 0.03616,955 Aluminum Corp of China Ltd – H 272,089 0.04
56,291 Angang Steel Co Ltd – A 47,307 0.01113,382 Angang Steel Co Ltd – H 102,320 0.01195,577 Anhui Conch Cement Co Ltd – H 1,121,792 0.16167,811 Anta Sports Products Ltd 888,738 0.12
46,807 Asm Pacific Technology 591,840 0.089,136 Autohome Inc – ADR 922,736 0.13
352,597 Avichina Industry & Tech – H 209,883 0.03262,426 BAIC Motor Corp Ltd – H 250,871 0.03
42,724 Baidu Inc – Spon ADR 10,381,932 1.4456,691 Bank of Beijing Co Ltd – A 51,578 0.0187,942 Bank of China Ltd – A 47,900 0.01
12,253,934 Bank of China Ltd – H 6,075,853 0.8445,558 Bank of Communications Co – A 39,455 0.01
1,472,588 Bank of Communications Co – H 1,128,075 0.16194,625 Bank of East Asia Ltd 777,711 0.11336,198 BBMG Corp – H 124,273 0.02263,864 Beijing Capital Intl Airpo – H 278,143 0.04
81,582 Beijing Enterprises Hldgs 397,228 0.05825,375 Beijing Enterprises Water Gr 450,274 0.06571,496 BOC Hong Kong Holdings Ltd 2,691,595 0.37468,945 Brilliance China Automotive 846,384 0.12100,910 BYD Co Ltd – H 611,599 0.08115,642 BYD Electronic Intl Co Ltd 158,308 0.02
97,538 CAR Inc 97,470 0.011,657,123 CGN Power Co Ltd – H 428,778 0.06
254,504 China Agri – Industries Holdings 97,319 0.011,431,823 China Cinda Asset Manageme – H 459,909 0.061,409,243 China Citic Bank Corp Ltd – H 881,961 0.12
268,611 China Coal Energy Co – H 111,273 0.02666,189 China Communications Const – H 643,649 0.09439,097 China Communications Servi – H 278,163 0.04245,773 China Conch Venture Holdings 899,080 0.12
34,262 China Construction Bank – A 33,860 0.0014,859,344 China Construction Bank – H 13,731,557 1.90
76,346 China Eastern Airlines Co – A 76,256 0.01133,437 China Eastern Airlines Co – H 90,314 0.01509,615 China Everbright Bank Co L – H 218,904 0.03374,078 China Everbright Intl Ltd 483,484 0.07152,921 China Everbright Ltd 280,680 0.04406,484 China Evergrande Group 1,036,229 0.14485,479 China First Capital Group Lt 309,402 0.04475,325 China Galaxy Securities Co – H 244,162 0.03275,693 China Gas Holdings Ltd 1,108,683 0.15
1,674,818 China Huarong Asset Manage – H 484,591 0.07350,205 China Huishan Dairy Holdings 6,696 0.00152,754 China International Capita – H 272,196 0.04
55,254 China International Marine – H 72,400 0.014,411 China International Travel – A 42,867 0.01
817,503 China Jinmao Holdings Group 410,552 0.061,155,246 China Life Insurance Co – H 2,981,822 0.41
25,796 China Literature Ltd 242,327 0.03
HoldingsFair value
US$
% ofNet
Assets
China (41.59%) Continued499,026 China Longyuan Power Group – H 401,997 0.06215,772 China Medical System Holding 431,244 0.06429,387 China Mengniu Dairy Co 1,455,837 0.20
25,840 China Merchants Bank – A 103,082 0.01604,415 China Merchants Bank – H 2,230,314 0.31188,571 China Merchants Port Holding 383,129 0.05
11,196 China Merchants Shekou Ind – A 32,180 0.0034,162 China Minsheng Banking – A 36,080 0.00
1,082,654 China Minsheng Banking Cor – H 774,167 0.11949,269 China Mobile Ltd 8,433,429 1.17639,744 China Molybdenum Co Ltd – H 309,865 0.04588,594 China National Building Ma – H 582,933 0.08299,191 China Oilfield Services – H 282,585 0.04604,022 China Overseas Land & Invest 1,990,194 0.28
7,323 China Pacific Insurance Gr – A 35,191 0.00422,278 China Pacific Insurance Gr – H 1,633,576 0.23
46,595 China Petroleum & Chemical – A 45,626 0.013,941,721 China Petroleum & Chemical – H 3,521,973 0.49
498,849 China Power International 115,088 0.02327,604 China Railway Construction – H 331,970 0.05651,075 China Railway Group Ltd – H 491,287 0.07241,871 China Railway Signal & Com – H 171,720 0.02797,411 China Reinsurance Group Co – H 174,821 0.02229,581 China Resources Beer Holding 1,114,918 0.15281,981 China Resources Cement 285,739 0.04137,765 China Resources Gas Group Lt 597,035 0.08428,554 China Resources Land Ltd 1,444,819 0.20254,580 China Resources Pharmaceutic 352,400 0.05302,814 China Resources Power Holdin 533,416 0.07527,948 China Shenhua Energy Co – H 1,253,005 0.17
24,503 China South Publishing – A 46,730 0.01297,031 China Southern Airlines Co – H 233,598 0.03
65,846 China State Construction – A 54,244 0.01295,525 China State Construction Int 303,230 0.04252,477 China Taiping Insurance Hold 790,052 0.11
2,204,595 China Telecom Corp Ltd – H 1,031,281 0.14341,945 China Traditional Chinese Me 295,943 0.04291,877 China Travel Intl Inv Hk 113,842 0.02970,225 China Unicom Hong Kong Ltd 1,211,939 0.17
12,533 China Vanke Co Ltd – A 46,518 0.01192,425 China Vanke Co Ltd – H 673,265 0.09
25,103 China Yangtze Power Co Ltd – A 61,131 0.01220,479 China Zhongwang Holdings Ltd 116,627 0.02
2,945,926 Chong Sing Holdings Fintech 341,700 0.0533,325 Chongqing Changan Automob – A 45,253 0.0165,113 Chongqing Changan Automobi – B 65,815 0.01
414,423 Chongqing Rural Commercial – H 246,685 0.03544,209 CIFI Holdings Group Co Ltd 346,137 0.05919,877 Citic Ltd 1,296,782 0.18
15,245 Citic Securities Co – A 38,114 0.01355,586 Citic Securities Co Ltd – H 710,678 0.10253,427 CLP Holdings Ltd 2,729,554 0.38
2,768,309 CNOOC Ltd 4,777,661 0.6641,646 Cosco Shipping Developme – A 15,646 0.00
579,806 Cosco Shipping Development – H 96,814 0.01105,167 Cosco Shipping Energy Tran – H 50,670 0.01
47,132 Cosco Shipping Holdings Co – A 34,987 0.00328,276 Cosco Shipping Holdings Co – H 150,634 0.02263,880 Cosco Shipping Ports Ltd 219,971 0.03
1,171,510 Country Garden Holdings Co 2,060,664 0.2929,757 CRRC Corp Ltd – A 34,571 0.00
676,642 CRRC Corp Ltd – H 525,241 0.07728,224 CSPC Pharmaceutical Group Lt 2,199,862 0.30
60,673 Ctrip.Com International – ADR 2,889,855 0.40282,718 Dali Foods Group Co Ltd 218,017 0.03397,100 Datang Intl Power Gen Co – H 121,477 0.02439,116 Dongfeng Motor Grp Co Ltd – H 464,558 0.06

92 iShares Asia Trust
iShares Core MSCI AC Asia ex Japan Index ETF (continued)
Investment Portfolio (unaudited) as at 30th June 2018
HoldingsFair value
US$
% ofNet
Assets
China (41.59%) Continued121,497 ENN Energy Holdings Ltd 1,194,768 0.17
30,534 Fang Holdings Ltd – ADR 118,472 0.02308,233 Far East Horizon Ltd 298,983 0.04
5,048 Foshan Haitian Flavouring – A 56,087 0.01392,223 Fosun International Ltd 737,907 0.10
1,128,474 Fullshare Holdings Ltd 558,092 0.08266,874 Future Land Development Holdings 241,516 0.03
79,360 Fuyao Glass Industry Group – H 268,059 0.042,028,309 GCL-Poly Energy Holdings Ltd 191,315 0.03
9,041 GDS Holdings Ltd – ADR 362,454 0.05763,702 Geely Automobile Holdings Lt 1,980,936 0.27120,067 Genscript Biotech Corp 332,097 0.05238,000 GF Securities Co Ltd – H 347,044 0.05
1,497,316 Gome Retail Holdings Ltd 152,681 0.02463,000 Great Wall Motor Company – H 354,091 0.05144,742 Greentown China Holdings 194,085 0.03458,976 Guangdong Investment Ltd 728,937 0.10474,219 Guangzhou Automobile Group – H 463,614 0.06158,695 Guangzhou R&F Properties – H 320,406 0.04
8,615 Guotai Junan Securities Co – A 19,159 0.0092,590 Guotai Junan Securities Co – H 196,853 0.03
199,576 Haier Electronics Group Co 683,022 0.0988,512 Haitian International Hldgs 208,942 0.0332,421 Haitong Securities Co Ltd – A 46,324 0.01
498,890 Haitong Securities Co Ltd – H 504,267 0.07145,960 Hang Lung Group Ltd 409,297 0.06118,243 Hang Seng Bank Ltd 2,957,036 0.41
14,507 Hangzhou Hikvision Digital – A 81,271 0.01112,425 Hengan Intl Group Co Ltd 1,081,912 0.15
3,370,139 Hengten Networks Group Ltd 120,278 0.021,426,259 Hong Kong & China Gas 2,730,552 0.38
175,284 Huadian Power Intl Corp – H 69,261 0.01616,631 Huaneng Power Intl Inc – H 408,706 0.06705,334 Huaneng Renewables Corp – H 234,648 0.03
19,118 Huatai Securities Co Ltd – A 43,181 0.01227,042 Huatai Securities Co Ltd – H 361,163 0.05
35,699 Huaxia Bank Co Ltd – A 40,128 0.0120,320 Huazhu Group Ltd – ADR 853,237 0.1269,462 Ind & Comm Bk of China – A 55,756 0.01
10,732,839 Ind & Comm Bk of China – H 8,030,357 1.1134,762 Industrial Bank Co Ltd – A 75,526 0.01
9,359 Inner Mongolia Yili Indus – A 39,397 0.01166,588 Inner Mongolia Yitai Coal – B 226,726 0.03111,506 JD.Com Inc – ADR 4,343,159 0.60200,901 Jiangsu Express Co Ltd – H 239,429 0.03
7,822 Jiangsu Hengrui Medicine C – A 89,410 0.012,074 Jiangsu Yanghe Brewery – A 41,181 0.01
207,238 Jiangxi Copper Co Ltd – H 264,151 0.04146,807 Jiayuan International Group 254,488 0.04365,826 Kaisa Group Holdings Ltd 156,207 0.02
14,307 Kangmei Pharmaceutical Co – A 49,390 0.01109,578 Kingboard Holdings Ltd (formerly
known as Kingboard Chemical Holdings) 400,855 0.06
300,299 Kingdee International Sftwr 307,363 0.04124,875 Kingsoft Corp Ltd 378,821 0.05500,663 Kunlun Energy Co Ltd 438,414 0.06
1,561 Kweichow Moutai Co Ltd – A 172,276 0.02187,654 KWG Property Holding Ltd 235,840 0.03270,264 Lee & Man Paper Manufacturin 273,521 0.04
48,869 Legend Holdings Corp – H 148,872 0.021,156,420 Lenovo Group Ltd 626,450 0.09
205,235 Logan Property Holdings Co Ltd 277,817 0.04223,085 Longfor Group Holdings Ltd
(formerly known as Longfor Properties) 601,399 0.08
171,073 Luye Pharma Group Ltd 175,533 0.0211,911 Meinian Onehealth Healthca – A 40,615 0.01
HoldingsFair value
US$
% ofNet
Assets
China (41.59%) Continued260,709 Meitu Inc 227,630 0.03
37,379 Melco Resorts & Entert – ADR 1,046,612 0.1489,316 Metallurgical Corp of Chin – A 44,875 0.01
277,770 Metallurgical Corp of Chin – H 82,140 0.019,902 Midea Group Co Ltd – A 78,017 0.01
110,772 Minth Group Ltd 468,054 0.06360,464 MMG Ltd 252,241 0.04
17,595 Momo Inc – Spon ADR 765,383 0.11240,808 MTR Corp 1,332,118 0.18
12,311 Netease Inc – ADR 3,110,620 0.43129,676 New China Life Insurance C – H 539,666 0.07
21,842 New Oriental Educatio – SP ADR 2,067,564 0.29149,558 Nexteer Automotive Group Ltd 221,131 0.03265,278 Nine Dragons Paper Holdings 338,130 0.05
4,427 Noah Holdings Ltd – Spon ADR 230,868 0.031,234,296 People’s Insurance Co Grou – H 580,534 0.083,311,547 Petrochina Co Ltd – H 2,519,924 0.351,072,889 PICC Property & Casualty – H 1,158,298 0.16
25,103 Ping An Bank Co Ltd – A 34,429 0.0013,870 Ping An Insurance Group Co – A 122,590 0.02
804,435 Ping An Insurance Group Co – H 7,403,043 1.0317,081 Poly Real Estate Group Co – A 31,442 0.00
394,626 Postal Savings Bank of Chi – H 257,033 0.0449,069 Power Construction Corp of – A 39,683 0.0111,933 SAIC Motor Corp Ltd – A 62,998 0.01
374,238 Sands China Ltd 2,001,069 0.28429,330 Semiconductor Manufacturing 558,179 0.08350,495 Shandong Weigao Gp Medical – H 247,946 0.03527,864 Shanghai Electric Grp Co L – H 177,627 0.02
9,903 Shanghai Fosun Pharmaceuti – A 61,843 0.0165,600 Shanghai Fosun Pharmaceuti – H 359,964 0.0587,631 Shanghai Industrial Hldg Ltd 204,181 0.03
118,373 Shanghai Lujiazui Fin&Trad – B 169,510 0.0216,578 Shanghai Oriental Pearl Gr – A 37,669 0.0012,532 Shanghai Pharmaceuticals – A 45,191 0.01
127,967 Shanghai Pharmaceuticals – H 353,133 0.0546,095 Shanghai Pudong Devel Bank – A 66,488 0.01
201,472 Shangri-La Asia Ltd 379,038 0.05121,504 Shenwan Hongyuan Group Co – A 80,113 0.01127,989 Shenzhen Intl Holdings 264,936 0.04498,849 Shenzhen Investment Ltd 181,852 0.03117,726 Shenzhou International Group 1,453,296 0.20194,976 Shimao Property Holdings Ltd 511,954 0.07478,057 Shui On Land Ltd 121,259 0.02617,911 Sihuan Pharmaceutical Hldgs 137,831 0.02
9,889 Sina Corp 837,499 0.121,039,616 Sino Biopharmaceutical 1,595,444 0.22
491,134 Sino-Ocean Group Holding Ltd 285,461 0.04176,758 Sinopec Engineering Group – H 184,746 0.03616,631 Sinopec Shanghai Petrochem – H 375,695 0.05186,009 Sinopharm Group Co – H 748,024 0.10275,296 Sinotrans Limited – H 145,272 0.02100,012 Sinotruk Hong Kong Ltd 164,701 0.02240,134 Skyworth Digital Hldgs Ltd 107,128 0.01396,466 Soho China Ltd 188,494 0.03392,837 Sun Art Retail Group Ltd 513,738 0.07375,047 Sunac China Holdings Ltd 1,312,231 0.18
20,792 Suning.Com Co Ltd – A 44,170 0.01110,382 Sunny Optical Tech 2,054,155 0.28
51,145 Tal Education Group – ADR 1,882,136 0.26884,647 Tencent Holdings Ltd 44,404,590 6.15296,688 Tingyi (Cayman Isln) Hldg Co 688,262 0.10
74,272 Tong Ren Tang Technologies – H 117,957 0.02121,804 Towngas China Co Ltd 118,149 0.02132,000 Travelsky Technology Ltd – H 384,452 0.05
5,848 Tsingtao Brewery Co Ltd – A 38,673 0.0149,099 Tsingtao Brewery Co Ltd – H 269,732 0.0411,833 Tus-Sound Environmen-Res A 31,208 0.00

Semi-annual Report 93
iShares Core MSCI AC Asia ex Japan Index ETF (continued)
Investment Portfolio (unaudited) as at 30th June 2018
HoldingsFair value
US$
% ofNet
Assets
China (41.59%) Continued185,917 Uni-President China Holdings 238,870 0.03
66,377 Vipshop Holdings Ltd – ADR 720,190 0.10772,435 Want Want China Holdings Ltd 687,226 0.10
7,271 Weibo Corp – Spon ADR 645,374 0.09310,882 Weichai Power Co Ltd – H 428,751 0.06287,715 Wilmar International Ltd 645,697 0.09
5,148 Wuliangye Yibin Co Ltd – A 59,031 0.0175,509 Wuxi Biologics Cayman Inc 840,705 0.1273,335 Xinjiang Goldwind Sci&Tec – H 89,268 0.0120,355 Xinjiang Goldwind Sci&Tech – A 38,819 0.01
443,889 Xinyi Solar Holdings Ltd 136,356 0.02357,140 Yangzijiang Shipbuilding 237,046 0.03291,094 Yanzhou Coal Mining Co – H 380,682 0.05917,484 Yuexiu Property Co Ltd 175,417 0.02
56,725 Yum China Holdings Inc 2,181,644 0.302,674 Yunnan Baiyao Group Co Ltd – A 43,153 0.01
242,809 Yuzhou Properties Co 142,675 0.027,056 YY Inc – ADR 708,916 0.10
131,463 Zhaojin Mining Industry – H 100,372 0.01263,864 Zhejiang Expressway Co – H 235,429 0.03
22,029 Zhongan Online P&C Insuran – H 139,130 0.0284,168 Zhongsheng Group Holdings 252,650 0.0388,267 Zhuzhou CRRC Times Electri – H 419,652 0.06
947,663 Zijin Mining Group Co Ltd – H 362,374 0.05130,555 ZTE Corp – H 198,359 0.03
300,197,817 41.59
Hong Kong (6.50%)
399,998 CK Asset Holdings Ltd 3,176,347 0.44417,430 CK Hutchison Holdings Ltd 4,426,792 0.61105,064 CK Infrastructure Holdings L 778,728 0.11
48,276 Dairy Farm Intl Holdings Ltd 424,346 0.06366,933 Galaxy Entertainment Group L 2,841,288 0.39294,401 Hang Lung Properties Ltd 607,156 0.08204,314 Henderson Land Development 1,080,758 0.15383,600 HK Electric Investments – SS 365,731 0.05618,537 HKT Trust and HKT Ltd – SS 789,979 0.11183,517 Hong Kong Exchanges & Clear 5,520,399 0.77181,156 Hongkong Land Holdings Ltd 1,295,265 0.18105,064 Hysan Development Co 586,557 0.08
33,595 Jardine Matheson Hldgs Ltd 2,119,844 0.2934,230 Jardine Strategic Hldgs Ltd 1,248,710 0.17
109,733 Kerry Properties Ltd 525,206 0.07158,440 Kingboard Laminates Hldg Ltd 195,691 0.03919,607 Li & Fung Ltd 337,580 0.05335,381 Link Reit 3,062,928 0.43144,257 MGM China Holdings Ltd 334,650 0.05958,447 New World Development 1,348,712 0.19258,889 Nws Holdings Ltd 448,121 0.06749,768 PCCW Ltd 422,407 0.06213,183 Power Assets Holdings Ltd 1,490,429 0.21497,913 Sino Land Co 809,816 0.11306,201 SJM Holdings Ltd 380,924 0.05220,280 SSY Group Ltd 244,554 0.03239,510 Sun Hung Kai Properties 3,614,577 0.50
76,323 Swire Pacific Ltd – Cl A 808,423 0.11190,679 Swire Properties Ltd 704,828 0.10212,378 Techtronic Industries Co Ltd 1,184,322 0.16
1,348,052 WH Group Ltd 1,097,968 0.15187,052 Wharf Holdings Ltd 600,821 0.08187,823 Wharf Real Estate Investment 1,337,070 0.19126,315 Wheelock & Co Ltd 879,888 0.12240,734 Wynn Macau Ltd 774,785 0.11114,425 Yue Yuen Industrial Hldg 323,055 0.05
46,188,655 6.40
HoldingsFair value
US$
% ofNet
Assets
India (0.95%)7,118 Adani Ports and Special Econ 38,766 0.015,851 Ambuja Cements Ltd 17,716 0.00
11,487 Ashok Leyland Ltd 21,091 0.002,835 Asian Paints Ltd 52,320 0.012,592 Aurobindo Pharma Ltd 22,967 0.00
17,598 Axis Bank Ltd 131,198 0.02810 Bajaj Auto Ltd 33,224 0.01
1,675 Bajaj Finance Ltd 56,139 0.01405 Bajaj Finserv Ltd 34,409 0.01
2,044 Bharat Forge Ltd 18,279 0.008,652 Bharat Heavy Electricals 9,061 0.007,442 Bharat Petroleum Corp Ltd 40,547 0.01
13,102 Bharti Airtel Ltd 73,040 0.014,247 Bharti Infratel Ltd 18,630 0.00
81 Bosch Ltd 20,701 0.00262 Britannia Industries Ltd 23,761 0.00
2,025 Cadila Healthcare Ltd 11,154 0.003,402 Cipla Ltd 30,619 0.006,708 Coal India Ltd 25,881 0.00
810 Container Corp of India Ltd 7,711 0.005,196 Dabur India Ltd 29,687 0.001,134 Dr. Reddy’s Laboratories 36,993 0.01
162 Eicher Motors Ltd 67,601 0.016,624 Gail India Ltd 32,895 0.011,377 Glenmark Pharmaceuticals Ltd 11,718 0.002,349 Godrej Consumer Products Ltd 42,022 0.013,233 Grasim Industries Ltd 47,510 0.012,449 Havells India Ltd 19,421 0.005,446 HCL Technologies Ltd 73,624 0.01
486 Hero Motocorp Ltd 24,639 0.0011,430 Hindalco Industries Ltd 38,453 0.01
5,984 Hindustan Petroleum Corp 22,638 0.0010,818 Hindustan Unilever Ltd 259,125 0.0428,063 Housing Development Finance 781,537 0.1141,392 ICICI Bank Ltd 166,378 0.0217,615 Idea Cellular Ltd 15,259 0.00
3,130 Indiabulls Housing Finance L 52,193 0.0111,406 Indian Oil Corp Ltd 25,970 0.0039,325 Infosys Ltd 750,283 0.10
105,636 ITC Ltd 410,425 0.068,328 JSW Steel Ltd 39,723 0.01
17,639 Larsen & Toubro Ltd 328,271 0.052,916 LIC Housing Finance Ltd 19,946 0.002,187 Lupin Ltd 28,849 0.002,802 Mahindra & Mahindra Fin Secs 19,207 0.007,309 Mahindra & Mahindra Ltd 95,764 0.014,426 Marico Ltd 21,424 0.003,210 Maruti Suzuki India Ltd 413,489 0.066,203 Motherson Sumi Systems Ltd 25,775 0.00
243 Nestle India Ltd 34,793 0.0116,175 NTPC Ltd 37,690 0.0112,564 Oil & Natural Gas Corp Ltd 29,047 0.00
5,411 Petronet LNG Ltd 17,311 0.00810 Piramal Enterprises Ltd 29,985 0.00
57,881 Reliance Industries Ltd 821,519 0.116,789 Rural Electrification Corp 10,370 0.00
81 Shree Cement Ltd 18,389 0.001,458 Shriram Transport Finance 27,652 0.00
729 Siemens Ltd 10,431 0.0016,926 State Bank of India 64,070 0.01
9,405 Sun Pharmaceutical Indus 77,420 0.0124,904 Tata Consultancy Svcs Ltd 671,625 0.0915,561 Tata Motors Ltd 61,163 0.0110,863 Tata Power Co Ltd 11,614 0.00
3,421 Tata Steel Ltd 28,348 0.004,588 Tech Mahindra Ltd 43,891 0.013,049 Titan Co Ltd 39,094 0.01
891 Ultratech Cement Ltd 49,659 0.01

94 iShares Asia Trust
iShares Core MSCI AC Asia ex Japan Index ETF (continued)
Investment Portfolio (unaudited) as at 30th June 2018
HoldingsFair value
US$
% ofNet
Assets
India (0.95%) Continued2,835 United Spirits Ltd 27,514 0.003,502 UPL Ltd 31,629 0.014,150 Vakrangee Ltd 4,049 0.00
14,589 Vedanta Ltd 50,294 0.0111,087 Wipro Ltd 42,316 0.01
6,379 Yes Bank Ltd 31,623 0.005,174 Zee Entertainment Enterprise 41,077 0.01
6,900,606 0.95
Indonesia (2.19%)
2,064,128 Adaro Energy TBK PT 257,836 0.04294,114 Akr Corporindo TBK PT 88,255 0.01
3,067,480 Astra International TBK PT 1,412,796 0.201,524,542 Bank Central Asia TBK PT 2,284,685 0.32
455,748 Bank Danamon Indonesia TBK 202,749 0.032,879,681 Bank Mandiri Persero TBK PT 1,376,540 0.191,129,951 Bank Negara Indonesia Perser 555,908 0.088,430,803 Bank Rakyat Indonesia Perser 1,670,864 0.23
725,168 Bank Tabungan Negara Persero 123,982 0.021,362,652 Bumi Serpong Damai PT 148,817 0.021,133,870 Charoen Pokphand Indonesi PT 291,182 0.04
79,276 Gudang Garam TBK PT 372,038 0.051,521,504 Hm Sampoerna TBK PT 380,111 0.05
412,944 Indah Kiat Pulp & Paper TBK 535,992 0.07295,712 Indocement Tunggal Prakarsa 281,680 0.04353,853 Indofood Cbp Sukses Makmur T 218,534 0.03594,971 Indofood Sukses Makmur TBK P 276,103 0.04
13,809 Jardine Cycle & Carriage Ltd 322,261 0.05407,675 Jasa Marga (Persero) TBK PT 118,917 0.02
3,474,930 Kalbe Farma TBK PT 295,842 0.04390,474 Matahari Department Store Tb 239,789 0.03
2,809,306 Pakuwon Jati TBK PT 103,903 0.011,796,969 Perusahaan Gas Negara Perser 250,171 0.04
488,550 Semen Indonesia Persero TBK 242,911 0.031,084,828 Surya Citra Media PT TBK 155,949 0.027,816,248 Telekomunikasi Indonesia Per 2,045,424 0.28
357,210 Tower Bersama Infrastructure 124,388 0.02229,511 Unilever Indonesia TBK PT 738,343 0.10263,416 United Tractors TBK PT 580,875 0.08786,645 Waskita Karya Persero TBK PT 105,673 0.01
15,802,518 2.19
Malaysia (2.63%)
207,328 Airasia Group BHD 153,462 0.02195,663 Alliance Bank Malaysia BHD 195,687 0.03237,060 AMMB Holdings BHD 220,071 0.03291,000 Astro Malaysia Holdings BHD 114,541 0.02382,312 Axiata Group Berhad 359,645 0.05
22,142 British American Tobacco BHD 190,642 0.03715,464 Cimb Group Holdings BHD 965,287 0.13500,256 Dialog Group BHD 382,669 0.05446,865 Digi.Com BHD 459,089 0.06238,080 FGV Holdings BHD (formerly known
as Felda Global Ventures) 88,996 0.0118,818 Fraser & Neave Holdings BHD 181,775 0.03
304,249 Gamuda BHD 246,291 0.03332,732 Genting BHD 692,728 0.10466,936 Genting Malaysia BHD 564,092 0.08
42,279 Genting Plantations BHD 98,907 0.0193,060 Hap Seng Consolidated 225,768 0.03
217,104 Hartalega Holdings BHD 321,934 0.0585,662 Hong Leong Bank Berhad 385,951 0.0543,183 Hong Leong Financial Group 192,423 0.03
326,128 IHH Healthcare BHD 492,482 0.07356,538 IJM Corp BHD 157,991 0.02328,325 IOI Corp BHD 369,005 0.05361,451 IOI Properties Group BHD 143,167 0.02
HoldingsFair value
US$
% ofNet
Assets
Malaysia (2.63%) Continued70,303 Kuala Lumpur Kepong BHD 420,478 0.06
599,043 Malayan Banking BHD 1,334,667 0.19142,127 Malaysia Airports Hldgs BHD 309,622 0.04309,240 Maxis BHD 417,985 0.06207,341 MISC BHD 303,864 0.04
9,920 Nestle (Malaysia) Berhad 362,223 0.05384,970 Petronas Chemicals Group BHD 801,485 0.11
28,076 Petronas Dagangan BHD 172,369 0.02113,397 Petronas Gas BHD 485,646 0.07
84,991 PPB Group Berhad 414,067 0.06224,101 Press Metal Aluminium Holdin 241,881 0.03452,532 Public Bank Berhad 2,616,945 0.36147,666 RHB Bank BHD 199,593 0.03399,308 Sime Darby Berhad 242,185 0.03374,105 Sime Darby Plantation BHD 493,620 0.07399,308 Sime Darby Property BHD 118,621 0.02202,874 SP Setia BHD 155,690 0.02207,341 Telekom Malaysia BHD 159,631 0.02484,477 Tenaga Nasional BHD 1,755,847 0.24100,912 Top Glove Corp Bhd 303,273 0.04
70,785 UMW Holdings BHD 104,614 0.02189,456 Westports Holdings BHD 158,994 0.02556,766 YTL Corp BHD 155,748 0.02311,100 MyEG Services BHD 74,319 0.01
19,005,970 2.63
Pakistan (0.08%)
94,840 Habib Bank Ltd 130,020 0.0223,794 Lucky Cement 99,525 0.0163,484 MCB Bank Ltd 103,059 0.01
105,219 Oil & Gas Development Co Ltd 134,294 0.0279,980 United Bank Ltd 110,938 0.02
577,836 0.08
Philippines (1.06%)
312,159 Aboitiz Equity Ventures Inc 318,783 0.04273,548 Aboitiz Power Corp 178,119 0.02379,388 Alliance Global Group Inc 82,606 0.01
40,003 Ayala Corporation 689,610 0.101,150,728 Ayala Land Inc 817,213 0.11
104,371 Bank of The Philippine Islan 173,080 0.02305,306 BDO Unibank Inc 717,963 0.10740,903 DMCI Holdings Inc 145,772 0.02
6,302 Globe Telecom Inc 181,854 0.0214,553 GT Capital Holdings Inc 248,152 0.0394,246 Intl Container Term Svcs Inc 136,510 0.02
465,696 JG Summit Holdings Inc 436,310 0.0671,598 Jollibee Foods Corp 352,842 0.0538,624 Manila Electric Company 257,361 0.04
2,116,933 Megaworld Corp 169,775 0.022,469,715 Metro Pacific Investments Co 212,876 0.03
132,952 Metropolitan Bank & Trust 182,858 0.0310,814 PLDT Inc 261,396 0.04
344,117 Robinsons Land Co 119,934 0.0235,744 Security Bank Corp 133,954 0.0238,137 SM Investments Corp 625,285 0.09
1,356,412 SM Prime Holdings Inc 913,721 0.13142,765 Universal Robina Corp 323,691 0.04
7,679,665 1.06
Singapore (3.78%)
402,827 Ascendas Real Estate Inv Trt 779,951 0.1124,166 BOC Aviation Ltd 150,162 0.02
390,893 Capitaland Commercial Trust 475,895 0.07397,788 Capitaland Ltd 921,900 0.13394,404 Capitaland Mall Trust 598,765 0.08

Semi-annual Report 95
iShares Core MSCI AC Asia ex Japan Index ETF (continued)
Investment Portfolio (unaudited) as at 30th June 2018
HoldingsFair value
US$
% ofNet
Assets
Singapore (3.78%) Continued66,505 City Developments Ltd 533,113 0.07
352,016 Comfortdelgro Corp Ltd 606,702 0.08277,103 DBS Group Holdings Ltd 5,407,929 0.75932,736 Genting Singapore Ltd 834,571 0.12
1,071,574 Golden Agri-Resources Ltd 239,699 0.03224,974 Keppel Corp Ltd 1,179,732 0.16487,976 Oversea-Chinese Banking Corp 4,165,780 0.58111,652 Sats Ltd 409,432 0.06156,568 Sembcorp Industries Ltd 315,777 0.04
82,645 Singapore Airlines Ltd 647,946 0.09129,903 Singapore Exchange Ltd 683,098 0.10
97,200 Singapore Press Holdings Ltd 185,346 0.03243,647 Singapore Tech Engineering 587,898 0.08
1,254,929 Singapore Telecommunications 2,834,750 0.39334,309 Suntec Reit 424,169 0.06217,982 United Overseas Bank Ltd 4,278,107 0.59
82,867 UOL Group Ltd 463,107 0.0641,784 Venture Corp Ltd 546,701 0.08
27,270,530 3.78
South Korea (16.45%)
4,817 Amorepacific Corp 1,393,883 0.191,634 Amorepacific Corp – Pref 227,250 0.034,605 Amorepacific Group 510,289 0.071,029 BGF Retail Co Ltd 180,040 0.02
42,892 BNK Financial Group Inc 359,839 0.055,349 Celltrion Healthcare Co Ltd 532,260 0.07
12,634 Celltrion Inc 3,440,484 0.482,246 Celltrion Pharm Inc 182,784 0.02
11,426 Cheil Worldwide Inc 211,707 0.031,303 CJ Cheiljedang Corp 412,120 0.062,240 CJ Corp 285,402 0.042,749 CJ E&M Corp 243,945 0.031,322 CJ Logistics 199,279 0.037,563 Coway Co Ltd 587,668 0.083,488 Daelim Industrial Co Ltd 239,419 0.03
19,636 Daewoo Engineering & Constr 103,422 0.017,599 DB Insurance Co Ltd 402,280 0.06
27,321 DGB Financial Group Inc 251,270 0.036,511 Dongsuh Companies Inc 152,770 0.026,420 Doosan Bobcat Inc 184,334 0.029,052 Doosan Heavy Industries 127,110 0.023,289 E-Mart Inc 751,055 0.107,279 GS Engineering & Construct 300,434 0.048,369 GS Holdings 408,500 0.063,866 GS Retail Co Ltd 152,455 0.02
48,173 Hana Financial Group 1,852,143 0.2612,339 Hankook Tire Co Ltd 466,103 0.06
907 Hanmi Pharm Co Ltd 342,617 0.051,952 Hanmi Science Co Ltd 113,144 0.02
29,700 Hanon Systems 282,476 0.041,636 Hanssem Co Ltd 154,132 0.02
14,278 Hanwha Chemical Corp 279,923 0.046,531 Hanwha Corporation 184,884 0.03
40,498 Hanwha Life Insurance Co Ltd 192,588 0.035,567 HDC Hyundai Development Co – E 269,234 0.044,632 HLB Inc 405,222 0.064,908 Hotel Shilla Co Ltd 543,865 0.084,335 Hyosung Corporation 521,211 0.072,197 Hyundai Dept Store Co 227,684 0.03
12,102 Hyundai Engineering & Const 624,374 0.093,043 Hyundai Glovis Co Ltd 315,358 0.045,752 Hyundai Heavy Industries 526,428 0.071,667 Hyundai Heavy Industries Hol
(formerly known as Hyundai Robotics Co Ltd) 528,743 0.07
HoldingsFair value
US$
% ofNet
Assets
South Korea (16.45%) Continued10,089 Hyundai Marine & Fire Ins Co 305,069 0.0410,497 Hyundai Mobis Co Ltd 1,996,738 0.2823,760 Hyundai Motor Co 2,675,532 0.37
5,813 Hyundai Motor Co Ltd – 2nd Prf 473,594 0.073,748 Hyundai Motor Co Ltd – Prf 276,770 0.04
12,605 Hyundai Steel Co 594,906 0.0840,583 Industrial Bank of Korea 560,770 0.08
5,672 ING Life Insurance Korea Ltd 212,986 0.037,264 Kakao Corp 746,279 0.10
18,627 Kangwon Land Inc 437,053 0.0661,402 KB Financial Group Inc 2,908,951 0.40
885 KCC Corp 260,458 0.044,110 Kepco Plant Service & Engine 131,468 0.02
40,639 KIA Motors Corp 1,124,911 0.1612,175 Korea Aerospace Industries 450,076 0.0639,231 Korea Electric Power Corp 1,126,417 0.16
4,337 Korea Gas Corporation 249,830 0.036,245 Korea Investment Holdings Co 471,247 0.071,406 Korea Zinc Co Ltd 486,959 0.078,126 Korean Air Lines Co Ltd 205,975 0.031,648 KT Corp 40,516 0.01
18,992 KT&G Corp 1,823,368 0.252,863 Kumho Petrochemical Co Ltd 299,273 0.047,058 LG Chem Ltd 2,112,017 0.291,426 LG Chem Ltd – Preference 257,819 0.04
14,629 LG Corp 946,389 0.1335,998 LG Display Co Ltd 591,084 0.0816,509 LG Electronics Inc 1,229,472 0.17
296 LG Household & Health – Pref 193,881 0.031,531 LG Household & Health Care 1,917,699 0.272,173 LG Innotek Co Ltd 281,739 0.042,544 Lotte Chemical Corp 794,358 0.114,614 Lotte Corp 237,221 0.031,602 Lotte Shopping Co 301,857 0.04
696 Medy-Tox Inc 479,175 0.0761,452 Mirae Asset Daewoo Co Ltd 469,781 0.06
4,407 Naver Corp 3,017,085 0.422,853 Ncsoft Corp 949,720 0.134,002 Netmarble Corp (formerly known as
Netmarble Games Corp) 547,604 0.0822,968 NH Investment & Securities C 308,095 0.04
2,959 OCI Co Ltd 273,465 0.043,382 Orion Corp/Republic of Korea 452,147 0.06
105 Ottogi Corporation 80,929 0.0134,982 Pan Ocean Co Ltd 153,331 0.02
739 Pearl Abyss Corp 149,193 0.0212,084 POSCO 3,567,192 0.49
7,905 Posco Daewoo Corp 151,787 0.022,755 S-1 Corporation 239,286 0.032,550 Samsung Biologics Co Ltd 954,105 0.13
11,704 Samsung C&T Corp 1,223,433 0.173,550 Samsung Card Co 121,996 0.028,628 Samsung Electro-Mechanics Co 1,149,626 0.16
132,985 Samsung Electronics – Pref 4,492,495 0.62747,653 Samsung Electronics Co Ltd 31,294,762 4.33
26,116 Samsung Engineering Co Ltd 366,725 0.054,632 Samsung Fire & Marine Ins 1,097,217 0.15
64,044 Samsung Heavy Industries 410,295 0.0610,878 Samsung Life Insurance Co Lt 960,426 0.13
8,592 Samsung Sdi Co Ltd 1,649,787 0.235,407 Samsung Sds Co Ltd 972,726 0.139,923 Samsung Securities Co Ltd 309,398 0.04
69,456 Shinhan Financial Group Ltd 2,698,470 0.371,126 Shinsegae Inc 405,643 0.067,949 Sillajen Inc 522,801 0.074,853 SK Holdings Co Ltd 1,127,795 0.16
89,950 SK Hynix Inc 6,916,747 0.96

96 iShares Asia Trust
iShares Core MSCI AC Asia ex Japan Index ETF (continued)
Investment Portfolio (unaudited) as at 30th June 2018
HoldingsFair value
US$
% ofNet
Assets
South Korea (16.45%) Continued9,920 SK Innovation Co Ltd 1,797,972 0.253,061 SK Telecom 639,940 0.097,025 S-Oil Corp 690,209 0.101,970 Viromed Co Ltd 416,449 0.06
72,995 Woori Bank 1,067,581 0.151,358 Yuhan Corp 265,020 0.04
118,783,218 16.45
Taiwan (13.05%)
455,727 Acer Inc 372,193 0.0548,323 Advantech Co Ltd 318,577 0.0417,844 Airtac International Group 253,714 0.03
524,574 ASE Technology Holding Co Ltd 1,231,923 0.17344,111 Asia Cement Corp 378,101 0.05109,261 Asustek Computer Inc 998,055 0.14
1,371,966 Au Optronics Corp 580,493 0.08101,629 Catcher Technology Co Ltd 1,136,674 0.16
1,261,488 Cathay Financial Holding Co 2,226,021 0.31183,584 Chailease Holding Co Ltd 602,142 0.08852,903 Chang Hwa Commercial Bank 495,150 0.07308,572 Cheng Shin Rubber Ind Co Ltd 464,045 0.06
89,263 Chicony Electronics Co Ltd 201,137 0.03485,251 China Airlines Ltd 151,519 0.02
1,984,610 China Development Financial 725,795 0.10395,542 China Life Insurance Co Ltd 416,449 0.06
2,000,964 China Steel Corp 1,555,434 0.22586,756 Chunghwa Telecom Co Ltd 2,116,967 0.29654,824 Compal Electronics 412,373 0.06
2,699,622 CTBC Financial Holding Co Lt 1,943,576 0.27313,238 Delta Electronics Inc 1,125,000 0.16
1,480,868 E.Sun Financial Holding Co 1,032,141 0.1427,718 Eclat Textile Company Ltd 329,559 0.05
381,684 Eva Airways Corp 184,654 0.03355,172 Evergreen Marine Corp Ltd 151,442 0.02413,123 Far Eastern New Century Corp 391,599 0.05255,652 Far Eastone Telecomm Co Ltd 660,753 0.09
50,698 Feng Tay Enterprise Co Ltd 254,417 0.031,508,882 First Financial Holding Co 1,019,498 0.14
517,556 Formosa Chemicals & Fibre 2,062,517 0.29192,877 Formosa Petrochemical Corp 774,962 0.11680,909 Formosa Plastics Corp 2,512,497 0.35132,300 Formosa Taffeta Co. 144,717 0.02149,921 Foxconn Technology Co Ltd 366,830 0.05
1,032,137 Fubon Financial Holding Co 1,729,905 0.2427,973 General Interface Solution 181,664 0.0243,972 Giant Manufacturing 186,050 0.0334,418 Globalwafers Co Ltd 572,345 0.08
114,788 Highwealth Construction Corp 170,364 0.0234,901 Hiwin Technologies Corp 412,102 0.06
2,508,302 Hon Hai Precision Industry 6,844,900 0.9543,972 Hotai Motor Company Ltd 387,244 0.05
110,305 HTC Corp 205,860 0.031,164,868 Hua Nan Financial Holdings C 678,171 0.091,233,495 Innolux Corp 443,012 0.06
440,872 Inventec Corp 346,324 0.0515,354 Largan Precision Co Ltd 2,261,163 0.31
343,893 Lite-On Technology Corp 416,211 0.06280,009 Macronix International 398,589 0.05233,036 Mediatek Inc 2,293,022 0.32
1,694,657 Mega Financial Holding Co Lt 1,495,196 0.21112,615 Micro-Star International Co 347,945 0.05780,652 Nan Ya Plastics Corp 2,232,739 0.31162,741 Nanya Technology Corp 444,104 0.06
25,126 Nien Made Enterprise Co Ltd 214,682 0.0388,328 Novatek Microelectronics Cor 398,350 0.06
308,572 Pegatron Corp 634,582 0.0923,653 Phison Electronics Corp 186,968 0.03
HoldingsFair value
US$
% ofNet
Assets
Taiwan (13.05%) Continued343,420 Pou Chen 398,743 0.06
98,825 Powertech Technology Inc 286,863 0.0488,328 President Chain Store Corp 1,000,945 0.14
417,524 Quanta Computer Inc 732,654 0.1062,870 Realtek Semiconductor Corp 228,892 0.03
150,402 Ruentex Development Co Ltd 173,644 0.0288,328 Ruentex Industries Ltd 180,199 0.02
1,183,802 Shin Kong Financial Holding 456,227 0.061,647,574 Sinopac Financial Holdings 594,431 0.08
67,217 Standard Foods Corp 136,028 0.02233,065 Synnex Technology Intl Corp 351,640 0.05
25,689 Taimed Biologics Inc 262,885 0.041,455,332 Taishin Financial Holding 687,367 0.10
657,932 Taiwan Business Bank 203,065 0.03575,171 Taiwan Cement 798,940 0.11
1,327,305 Taiwan Cooperative Financial 777,093 0.11274,864 Taiwan High Speed Rail Corp 215,466 0.03264,600 Taiwan Mobile Co Ltd 958,994 0.13
3,804,307 Taiwan Semiconductor Manufac 27,014,529 3.74352,928 Teco Electric & Machinery 265,085 0.04743,347 Uni-President Enterprises Co 1,887,107 0.26
1,852,274 United Microelectronics Corp 1,029,767 0.14158,760 Vanguard International Semi 363,463 0.05
48,275 Walsin Technology Corp 660,271 0.0958,704 Win Semiconductors Corp 422,636 0.06
500,548 Winbond Electronics Corp 320,143 0.04415,410 Wistron Corp 308,609 0.04264,600 WPG Holdings Ltd 374,919 0.05
32,415 Yageo Corporation 1,196,086 0.171,629,150 Yuanta Financial Holding Co 742,745 0.10
52,920 Zhen Ding Technology Holding 116,989 0.02
94,218,841 13.05
Thailand (2.44%)163,042 Advanced Info Service PCL (FR) 910,437 0.13604,617 Airports of Thailand PCL (FR) 1,149,739 0.16
43,668 Bangkok Bank PCL – Foreign Reg 257,685 0.04494,604 Bangkok Dusit Medical Services PCL
(FR) 373,230 0.051,139,045 Bangkok Expressway and Metro 256,139 0.04
199,987 Banpu Public Co Ltd – Foreign 117,710 0.02198,350 Berli Jucker Public Co – NVDR 302,344 0.04
1,084,828 BTS Group Holdings PCL – Forgn 288,152 0.0466,150 Bumrungrad Hospital Pub Co –
Foreign 332,447 0.05778,600 C.P. All PCL (FR) 1,727,350 0.24181,457 Central Pattana PCL (FR) 382,029 0.05436,134 Charoen Pokphand Foods Co Ltd
(FR) 318,577 0.0492,550 Delta Electronics Thai PCL – Foreign 163,422 0.0221,596 Electricity Genera PCL – NVDR 146,016 0.02
209,034 Energy Absolute PCL – Foreign 206,636 0.0396,808 Glow Energy PCL (FR) 276,866 0.04
740,903 Home Product Center PCL (FR) 299,671 0.04268,858 Indorama Ventures PCL (FR) 444,310 0.06
1,861,139 IRPC PCL – Foreign 325,826 0.049,652 Kasikornbank PCL 56,519 0.01
278,060 Kasikornbank PCL – Foreign 1,628,241 0.23648,270 Krung Thai Bank PCL (FR) 326,777 0.05500,000 Land & Houses Pub – NVDR 170,540 0.02317,520 Minor International PCL – Foreign 311,482 0.04226,736 PTT Exploration & Production PCL
(FR) 961,558 0.13339,356 PTT Global Chemical PCL (FR) 747,751 0.10
1,638,030 PTT PCL (FR) 2,373,240 0.3382,941 Robinson PCL – NVDR 140,196 0.0218,094 Siam Cement PCL – NVDR 226,107 0.03

Semi-annual Report 97
iShares Core MSCI AC Asia ex Japan Index ETF (continued)
Investment Portfolio (unaudited) as at 30th June 2018
HoldingsFair value
US$
% ofNet
Assets
Thailand (2.44%) Continued33,614 Siam Cement Pub Co (FR) 420,048 0.06
292,773 Siam Commercial Bank PCL (FR) 1,047,196 0.14149,812 Thai Oil PCL – Foreign 351,581 0.05352,928 Thai Union Group PCL – Foreign 168,315 0.02
2,458,248 TMB Bank PCL – Foreign 170,660 0.021,624,812 True Corp PCL (FR) 259,931 0.04
17,638,728 2.44
Total listed equity 654,264,384 90.62
Exchange traded funds (8.76%)
India (8.76%)1,704,213 iShares MSCI India ETF 56,733,251 7.86
751,172 iShares MSCI India Index ETF 6,482,614 0.90
Total exchange traded funds 63,215,865 8.76
Unlisted equities (0.00%)
Malaysia (0.00%)41,075 RHB Capital BHD 0 0.00
Total unlisted equity 0 0.00
Unlisted rights (0.00%)
Taiwan (0.00%)55,202 Cathay Financial Holding Co – Rights 0 0.00
Total unlisted rights 0 0.00
Total investments 717,480,249 99.38Other net assets 4,447,347 0.62
Net assets attributable to
unitholders at 30th June 2018 721,927,596 100.00
Total investments, at cost 627,944,871

98 iShares Asia Trust
iShares Core MSCI AC Asia ex Japan Index ETF (continued)
Statement of Movements in Investment Portfolio (unaudited) For the period ended 30th June 2018
% of net asset value 30th June
2018
% of net asset value
31st December 2017
Financial assets at fair value through profit or lossListed equitiesChina 41.59 38.94Hong Kong 6.40 6.67India 0.95 0.00Indonesia 2.19 2.67Malaysia 2.63 2.73Pakistan 0.08 0.09Philippines 1.06 1.33Singapore 3.78 4.05South Korea 16.45 17.70Taiwan 13.05 12.97Thailand 2.44 2.61
90.62 89.76 Exchange traded fundsIndia 8.76 9.96
8.76 9.96 Unlisted equitiesMalaysia 0.00 –
0.00 – Unlisted rightsTaiwan 0.00 –
0.00 – Total investments 99.38 99.72Other net assets 0.62 0.28 Net assets attributable to unitholders 100.00 100.00

Semi-annual Report 99
iShares Core MSCI AC Asia ex Japan Index ETF Performance Record (unaudited)
Net Asset Value
DealingNet asset value
per unit
DealingNet asset value
of the Sub-Fund
At end of financial period dated31st December 2016 HK$40.04 HK$4,212,113,89631st December 2017 HK$56.08 HK$7,420,738,94430th June 2018* US$6.82 US$721,927,598
Highest and lowest net asset value per unit
Highest net assetvalue per unit
Lowest net assetvalue per unit
Financial period ended31st December 2009 (since inception) HK$35.66 HK$20.0031st December 2010 HK$40.74 HK$31.3931st December 2011 HK$42.76 HK$30.7831st December 2012 HK$41.51 HK$33.4831st December 2013 HK$43.78 HK$35.6131st December 2014 HK$46.45 HK$38.3331st December 2015 HK$49.56 HK$36.6031st December 2016 HK$43.99 HK$33.7331st December 2017 HK$57.39 HK$40.3030th June 2018* US$7.81 US$6.70
* For iShares Core MSCI AC Asia ex Japan Index ETF, the base currency was changed from Hong Kong dollar (“HK$”) to United States dollar (“US$”), effective from 1st January 2018.

100 iShares Asia Trust
iShares MSCI Emerging Asia Index ETF Investment Portfolio (unaudited) as at 30th June 2018
HoldingsFair value
HK$
% ofNet
Assets
Investments (99.27%)
Listed equities (87.79%)
China (43.40%)6,000 3SBio Inc 106,920 0.06
133 51Job Inc – ADR 101,882 0.06468 58.Com Inc – ADR 254,594 0.15
4,768 AAC Technologies Holdings In 526,864 0.318,000 Agile Group Holdings Ltd 106,880 0.06
161,871 Agricultural Bank of China – H 594,067 0.3410,000 Air China Ltd – H 75,800 0.04
6,461 Alibaba Group Holding – SP ADR 9,404,414 5.4714,400 Alibaba Health Information T 109,008 0.0662,222 Alibaba Pictures Group Ltd 53,511 0.0318,167 Aluminum Corp of China Ltd – H 62,858 0.04
400 Anhui Conch Cement Co Ltd – A 15,852 0.018,994 Anhui Conch Cement Co Ltd – H 404,730 0.235,600 Anta Sports Products Ltd 232,680 0.13
328 Autohome Inc – ADR 259,904 0.1512,800 Avichina Industry & Tech – H 59,776 0.03
9,500 Baic Motor Corp Ltd – H 71,250 0.041,540 Baidu Inc – Spon ADR 2,935,924 1.711,800 Bank of Beijing Co Ltd – A 12,848 0.013,200 Bank of China Ltd – A 13,674 0.01
435,133 Bank of China Ltd – H 1,692,667 0.982,000 Bank of Communications Co – A 13,589 0.01
60,327 Bank of Communications Co – H 362,565 0.21800 Bank of Shanghai Co Ltd – A 14,924 0.01
1,500 Baoshan Iron & Steel Co – A 13,832 0.0115,549 Beijing Capital Intl Airpo – H 128,590 0.07
4,436 Beijing Enterprises Hldgs 169,455 0.1029,911 Beijing Enterprises Water Gr 128,019 0.07
3,000 BOE Technology Group Co Lt – A 12,571 0.0122,400 Brilliance China Automotive 317,184 0.18
4,407 BYD Co Ltd – H 209,553 0.1261,334 CGN Power Co Ltd – H 124,508 0.0745,334 China Cinda Asset Manageme – H 114,242 0.0749,200 China Citic Bank Corp Ltd – H 241,572 0.1429,222 China Communications Const – H 221,503 0.1314,000 China Communications Servi – H 69,580 0.04
9,133 China Conch Venture Holdings 262,117 0.15530,476 China Construction Bank – H 3,845,951 2.23
19,191 China Everbright Intl Ltd 194,597 0.119,905 China Everbright Ltd 142,632 0.08
13,999 China Evergrande Group 279,980 0.1618,000 China First Capital Group Lt 90,000 0.0522,500 China Galaxy Securities Co – H 90,675 0.05
9,600 China Gas Holdings Ltd 302,880 0.1855,867 China Huarong Asset Manage – H 126,818 0.07
7,579 China Huishan Dairy Holdings 1,137 0.005,600 China International Capita – H 78,288 0.05
200 China International Travel – A 15,249 0.0128,000 China Jinmao Holdings Group 110,320 0.0645,183 China Life Insurance Co – H 914,956 0.53
1,000 China Literature Ltd 73,700 0.0422,492 China Longyuan Power Group – H 142,149 0.0811,200 China Medical System Holding 175,616 0.1018,564 China Mengniu Dairy Co 493,802 0.29
900 China Merchants Bank – A 28,168 0.0221,609 China Merchants Bank – H 625,581 0.36
8,471 China Merchants Port Holding 135,028 0.08600 China Merchants Shekou Ind – A 13,530 0.01
1,600 China Minsheng Banking – A 13,258 0.0134,368 China Minsheng Banking Cor – H 192,804 0.1133,627 China Mobile Ltd 2,343,802 1.3621,000 China Molybdenum Co Ltd – H 79,800 0.0524,000 China National Building Ma – H 186,480 0.1110,935 China Oilfield Services – H 81,028 0.05
HoldingsFair value
HK$
% ofNet
Assets
China (43.40%) Continued24,999 China Overseas Land & Invest 646,224 0.38
400 China Pacific Insurance Gr – A 15,081 0.0116,800 China Pacific Insurance Gr – H 509,880 0.30
1,800 China Petroleum & Chemical – A 13,828 0.01153,641 China Petroleum & Chemical – H 1,077,023 0.63
1,300 China Railway Construction – A 13,265 0.0114,359 China Railway Construction – H 114,154 0.0728,102 China Railway Group Ltd – H 166,364 0.10
7,242 China Resources Beer Holding 275,920 0.1610,000 China Resources Cement 79,500 0.05
5,564 China Resources Gas Group Lt 189,176 0.1115,556 China Resources Land Ltd 411,456 0.24
8,500 China Resources Pharmaceutic 92,310 0.0512,087 China Resources Power Holdin 167,042 0.1022,473 China Shenhua Energy Co – H 418,447 0.2410,000 China Southern Airlines Co – H 61,700 0.04
2,100 China State Construction – A 13,573 0.017,957 China State Construction Int 64,054 0.04
11,902 China Taiping Insurance Hold 292,194 0.1798,666 China Telecom Corp Ltd – H 362,104 0.2112,000 China Traditional Chinese Me 81,480 0.0542,320 China Unicom Hong Kong Ltd 414,736 0.24
424 China Vanke Co Ltd – A 12,347 0.018,000 China Vanke Co Ltd – H 219,600 0.13
800 China Yangtze Power Co Ltd – A 15,284 0.0192,000 Chong Sing Holdings Fintech 83,720 0.0519,994 Chongqing Rural Commercial – H 93,372 0.0518,000 CIFI Holdings Group Co Ltd 89,820 0.0529,778 Citic Ltd 329,345 0.19
700 Citic Securities Co – A 13,730 0.0112,299 Citic Securities Co Ltd – H 192,848 0.1198,090 CNOOC Ltd 1,328,139 0.7715,261 Cosco Shipping Ports Ltd 99,807 0.0641,827 Country Garden Holdings Co 577,213 0.34
1,300 CRRC Corp Ltd – A 11,849 0.0124,599 CRRC Corp Ltd – H 149,808 0.0926,356 CSPC Pharmaceutical Group Lt 624,637 0.36
2,058 Ctrip.Com International – ADR 769,031 0.4511,500 Dali Foods Group Co Ltd 69,575 0.04
1,500 Daqin Railway Co Ltd – A 14,577 0.0121,918 Dongfeng Motor Grp Co Ltd – H 181,919 0.11
4,468 ENN Energy Holdings Ltd 344,706 0.2012,444 Far East Horizon Ltd 94,699 0.05
1,320 Focus Media Information Te – A 14,953 0.01200 Foshan Haitian Flavouring – A 17,434 0.01
18,879 Fosun International Ltd 278,654 0.1640,000 Fullshare Holdings Ltd 155,200 0.09
2,987 Fuyao Glass Industry Group – H 79,156 0.0561,671 GCL-Poly Energy Holdings Ltd 45,637 0.03
317 GDS Holdings Ltd – ADR 99,704 0.0627,222 Geely Automobile Holdings Lt 553,968 0.32
4,000 Genscript Biotech Corp 86,800 0.058,000 GF Securities Co Ltd – H 91,520 0.05
100,000 Gome Retail Holdings Ltd 80,000 0.0514,470 Great Wall Motor Company – H 86,820 0.05
300 Gree Electric Appliances I – A 16,744 0.0122,078 Guangdong Investment Ltd 275,092 0.1617,360 Guangzhou Automobile Group – H 133,151 0.08
5,200 Guangzhou R&F Properties – H 82,368 0.057,327 Haier Electronics Group Co 196,730 0.114,000 Haitian International Hldgs 74,080 0.04
14,222 Haitong Securities Co Ltd – H 112,780 0.0757,143 Hanergy Thin Film Power Grou 1 0.00
400 Hangzhou Hikvision Digital – A 17,581 0.014,068 Hengan Intl Group Co Ltd 307,134 0.18
23,927 Huaneng Power Intl Inc – H 124,420 0.0726,000 Huaneng Renewables Corp – H 67,860 0.04
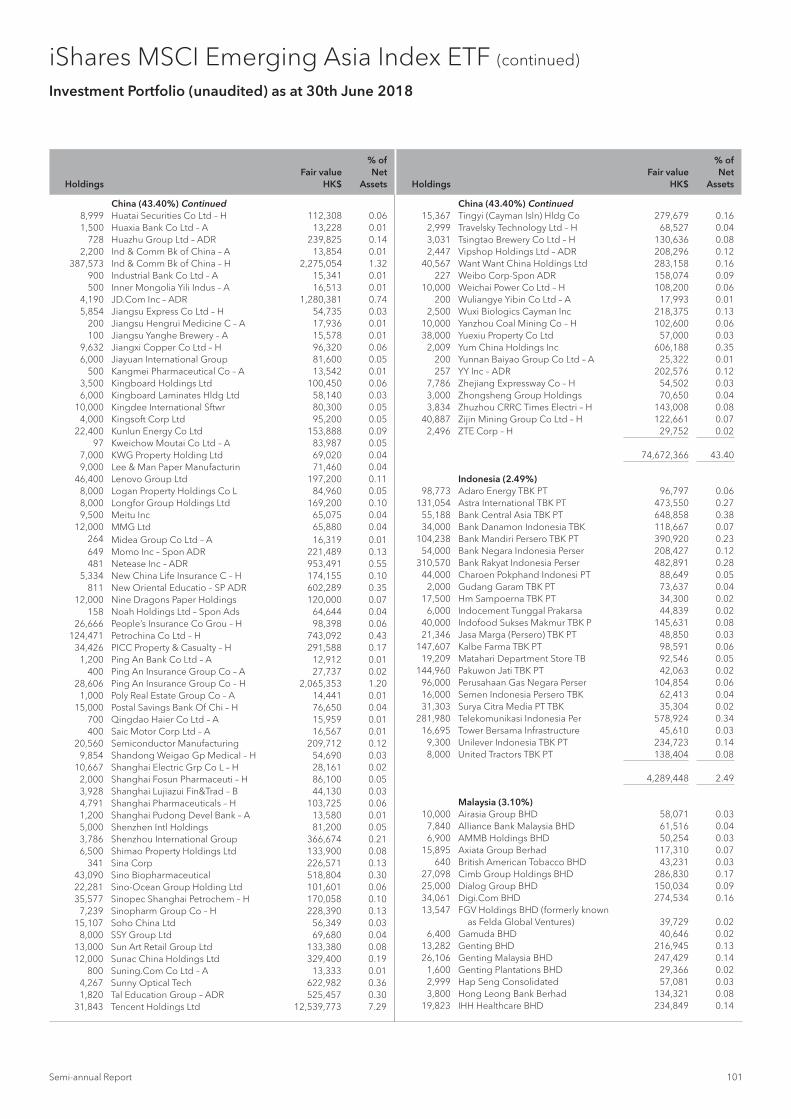
Semi-annual Report 101
iShares MSCI Emerging Asia Index ETF (continued)
Investment Portfolio (unaudited) as at 30th June 2018
HoldingsFair value
HK$
% ofNet
Assets
China (43.40%) Continued8,999 Huatai Securities Co Ltd – H 112,308 0.061,500 Huaxia Bank Co Ltd – A 13,228 0.01
728 Huazhu Group Ltd – ADR 239,825 0.142,200 Ind & Comm Bk of China – A 13,854 0.01
387,573 Ind & Comm Bk of China – H 2,275,054 1.32900 Industrial Bank Co Ltd – A 15,341 0.01500 Inner Mongolia Yili Indus – A 16,513 0.01
4,190 JD.Com Inc – ADR 1,280,381 0.745,854 Jiangsu Express Co Ltd – H 54,735 0.03
200 Jiangsu Hengrui Medicine C – A 17,936 0.01100 Jiangsu Yanghe Brewery – A 15,578 0.01
9,632 Jiangxi Copper Co Ltd – H 96,320 0.066,000 Jiayuan International Group 81,600 0.05
500 Kangmei Pharmaceutical Co – A 13,542 0.013,500 Kingboard Holdings Ltd 100,450 0.066,000 Kingboard Laminates Hldg Ltd 58,140 0.03
10,000 Kingdee International Sftwr 80,300 0.054,000 Kingsoft Corp Ltd 95,200 0.05
22,400 Kunlun Energy Co Ltd 153,888 0.0997 Kweichow Moutai Co Ltd – A 83,987 0.05
7,000 KWG Property Holding Ltd 69,020 0.049,000 Lee & Man Paper Manufacturin 71,460 0.04
46,400 Lenovo Group Ltd 197,200 0.118,000 Logan Property Holdings Co L 84,960 0.058,000 Longfor Group Holdings Ltd 169,200 0.109,500 Meitu Inc 65,075 0.04
12,000 MMG Ltd 65,880 0.04264 Midea Group Co Ltd – A 16,319 0.01649 Momo Inc – Spon ADR 221,489 0.13481 Netease Inc – ADR 953,491 0.55
5,334 New China Life Insurance C – H 174,155 0.10811 New Oriental Educatio – SP ADR 602,289 0.35
12,000 Nine Dragons Paper Holdings 120,000 0.07158 Noah Holdings Ltd – Spon Ads 64,644 0.04
26,666 People’s Insurance Co Grou – H 98,398 0.06124,471 Petrochina Co Ltd – H 743,092 0.43
34,426 PICC Property & Casualty – H 291,588 0.171,200 Ping An Bank Co Ltd – A 12,912 0.01
400 Ping An Insurance Group Co – A 27,737 0.0228,606 Ping An Insurance Group Co – H 2,065,353 1.20
1,000 Poly Real Estate Group Co – A 14,441 0.0115,000 Postal Savings Bank Of Chi – H 76,650 0.04
700 Qingdao Haier Co Ltd – A 15,959 0.01400 Saic Motor Corp Ltd – A 16,567 0.01
20,560 Semiconductor Manufacturing 209,712 0.129,854 Shandong Weigao Gp Medical – H 54,690 0.03
10,667 Shanghai Electric Grp Co L – H 28,161 0.022,000 Shanghai Fosun Pharmaceuti – H 86,100 0.053,928 Shanghai Lujiazui Fin&Trad – B 44,130 0.034,791 Shanghai Pharmaceuticals – H 103,725 0.061,200 Shanghai Pudong Devel Bank – A 13,580 0.015,000 Shenzhen Intl Holdings 81,200 0.053,786 Shenzhou International Group 366,674 0.216,500 Shimao Property Holdings Ltd 133,900 0.08
341 Sina Corp 226,571 0.1343,090 Sino Biopharmaceutical 518,804 0.3022,281 Sino-Ocean Group Holding Ltd 101,601 0.0635,577 Sinopec Shanghai Petrochem – H 170,058 0.10
7,239 Sinopharm Group Co – H 228,390 0.1315,107 Soho China Ltd 56,349 0.03
8,000 SSY Group Ltd 69,680 0.0413,000 Sun Art Retail Group Ltd 133,380 0.0812,000 Sunac China Holdings Ltd 329,400 0.19
800 Suning.Com Co Ltd – A 13,333 0.014,267 Sunny Optical Tech 622,982 0.361,820 Tal Education Group – ADR 525,457 0.30
31,843 Tencent Holdings Ltd 12,539,773 7.29
HoldingsFair value
HK$
% ofNet
Assets
China (43.40%) Continued15,367 Tingyi (Cayman Isln) Hldg Co 279,679 0.16
2,999 Travelsky Technology Ltd – H 68,527 0.043,031 Tsingtao Brewery Co Ltd – H 130,636 0.082,447 Vipshop Holdings Ltd – ADR 208,296 0.12
40,567 Want Want China Holdings Ltd 283,158 0.16227 Weibo Corp-Spon ADR 158,074 0.09
10,000 Weichai Power Co Ltd – H 108,200 0.06200 Wuliangye Yibin Co Ltd – A 17,993 0.01
2,500 Wuxi Biologics Cayman Inc 218,375 0.1310,000 Yanzhou Coal Mining Co – H 102,600 0.0638,000 Yuexiu Property Co Ltd 57,000 0.03
2,009 Yum China Holdings Inc 606,188 0.35200 Yunnan Baiyao Group Co Ltd – A 25,322 0.01257 YY Inc – ADR 202,576 0.12
7,786 Zhejiang Expressway Co – H 54,502 0.033,000 Zhongsheng Group Holdings 70,650 0.043,834 Zhuzhou CRRC Times Electri – H 143,008 0.08
40,887 Zijin Mining Group Co Ltd – H 122,661 0.072,496 ZTE Corp – H 29,752 0.02
74,672,366 43.40
Indonesia (2.49%)
98,773 Adaro Energy TBK PT 96,797 0.06131,054 Astra International TBK PT 473,550 0.27
55,188 Bank Central Asia TBK PT 648,858 0.3834,000 Bank Danamon Indonesia TBK 118,667 0.07
104,238 Bank Mandiri Persero TBK PT 390,920 0.2354,000 Bank Negara Indonesia Perser 208,427 0.12
310,570 Bank Rakyat Indonesia Perser 482,891 0.2844,000 Charoen Pokphand Indonesi PT 88,649 0.05
2,000 Gudang Garam TBK PT 73,637 0.0417,500 Hm Sampoerna TBK PT 34,300 0.02
6,000 Indocement Tunggal Prakarsa 44,839 0.0240,000 Indofood Sukses Makmur TBK P 145,631 0.0821,346 Jasa Marga (Persero) TBK PT 48,850 0.03
147,607 Kalbe Farma TBK PT 98,591 0.0619,209 Matahari Department Store TB 92,546 0.05
144,960 Pakuwon Jati TBK PT 42,063 0.0296,000 Perusahaan Gas Negara Perser 104,854 0.0616,000 Semen Indonesia Persero TBK 62,413 0.0431,303 Surya Citra Media PT TBK 35,304 0.02
281,980 Telekomunikasi Indonesia Per 578,924 0.3416,695 Tower Bersama Infrastructure 45,610 0.03
9,300 Unilever Indonesia TBK PT 234,723 0.148,000 United Tractors TBK PT 138,404 0.08
4,289,448 2.49
Malaysia (3.10%)
10,000 Airasia Group BHD 58,071 0.037,840 Alliance Bank Malaysia BHD 61,516 0.046,900 AMMB Holdings BHD 50,254 0.03
15,895 Axiata Group Berhad 117,310 0.07640 British American Tobacco BHD 43,231 0.03
27,098 Cimb Group Holdings BHD 286,830 0.1725,000 Dialog Group BHD 150,034 0.0934,061 Digi.Com BHD 274,534 0.1613,547 FGV Holdings BHD (formerly known
as Felda Global Ventures) 39,729 0.026,400 Gamuda BHD 40,646 0.02
13,282 Genting BHD 216,945 0.1326,106 Genting Malaysia BHD 247,429 0.14
1,600 Genting Plantations BHD 29,366 0.022,999 Hap Seng Consolidated 57,081 0.033,800 Hong Leong Bank Berhad 134,321 0.08
19,823 IHH Healthcare BHD 234,849 0.14

102 iShares Asia Trust
iShares MSCI Emerging Asia Index ETF (continued)
Investment Portfolio (unaudited) as at 30th June 2018
HoldingsFair value
HK$
% ofNet
Assets
Malaysia (3.10%) Continued11,062 IJM Corp BHD 38,457 0.0230,144 IOI Corp BHD 265,795 0.1547,932 IOI Properties Group BHD 148,948 0.09
2,934 Kuala Lumpur Kepong BHD 137,673 0.0823,616 Malayan Banking BHD 412,799 0.24
7,100 Maxis BHD 75,291 0.047,847 MISC BHD 90,223 0.05
12,044 Petronas Chemicals Group BHD 196,724 0.114,099 Petronas Gas BHD 137,725 0.08
17,169 Public Bank Berhad 778,947 0.4519,136 Sime Darby Berhad 91,056 0.0519,136 Sime Darby Plantation BHD 198,093 0.1219,136 Sime Darby Property BHD 44,599 0.0320,679 Tenaga Nasional BHD 587,978 0.34
4,480 Umw Holdings BHD 51,945 0.0316,114 YTL Corp BHD 35,365 0.02
5,333,764 3.10
Philippines (1.26%)
12,800 Aboitiz Equity Ventures Inc 102,553 0.0640,240 Alliance Global Group Inc 68,739 0.04
1,735 Ayala Corporation 234,654 0.1432,400 Ayala Land Inc 180,520 0.11
5,323 Bank of The Philippine Islan 69,253 0.0416,748 BDO Unibank Inc 308,992 0.18
205 GT Capital Holdings Inc 27,424 0.029,500 Intl Container Term Svcs Inc 107,955 0.06
16,971 JG Summit Holdings Inc 124,744 0.075,680 Jollibee Foods Corp 219,607 0.13
26,027 Metro Pacific Investments Co 17,601 0.017,858 Metropolitan Bank & Trust 84,791 0.05
569 PLDT Inc 107,905 0.06997 SM Investments Corp 128,246 0.07
44,800 SM Prime Holdings Inc 236,765 0.148,000 Universal Robina Corp 142,304 0.08
2,162,053 1.26
South Korea (19.17%)
204 Amorepacific Corp 463,124 0.2722 Amorepacific Corp – Pref 24,004 0.01
131 Amorepacific Group 113,887 0.0732 BGF Retail Co Ltd 43,926 0.02
1,703 BNK Financial Group Inc 112,089 0.06473 Celltrion Inc 1,010,550 0.59356 Cheil Worldwide Inc 51,750 0.03
39 CJ Cheiljedang Corp 96,775 0.06118 CJ Corp 117,953 0.07
63 CJ E&M Corp 43,861 0.0222 CJ Logistics 26,018 0.01
343 Coway Co Ltd 209,098 0.12183 Daelim Industrial Co Ltd 98,549 0.06181 DB Insurance Co Ltd 75,174 0.04171 E-Mart Inc 306,353 0.18289 GS Engineering & Construct 93,582 0.05153 GS Holdings 58,591 0.03
87 GS Retail Co Ltd 26,916 0.021,786 Hana Financial Group 538,729 0.31
375 Hankook Tire Co Ltd 111,135 0.0633 Hanmi Pharm Co Ltd 97,799 0.0668 Hanmi Science Co Ltd 30,923 0.02
419 Hanon Systems 31,265 0.0237 Hanssem Co Ltd 27,348 0.02
935 Hanwha Chemical Corp 143,814 0.08439 Hanwha Corporation 97,499 0.06203 HDC Hyundai Development Co – E 77,023 0.04229 Hotel Shilla Co Ltd 199,086 0.12
HoldingsFair value
HK$
% ofNet
Assets
South Korea (19.17%) Continued103 Hyosung Corporation 97,158 0.06128 Hyundai Dept Store Co 104,071 0.06503 Hyundai Engineering & Const 203,598 0.12
79 Hyundai Glovis Co Ltd 64,231 0.04275 Hyundai Heavy Industries 197,456 0.11
49 Hyundai Heavy Industries Hol (formerly known as Hyundai Robotics Co Ltd) 121,934 0.07
393 Hyundai Marine & Fire Ins Co 93,231 0.05447 Hyundai Mobis Co Ltd 667,085 0.39924 Hyundai Motor Co 816,307 0.47
45 Hyundai Motor Co Ltd – 2nd Prf 28,763 0.02542 Hyundai Steel Co 200,689 0.12930 Industrial Bank of Korea 100,819 0.06183 Kakao Corp 147,501 0.09695 Kangwon Land Inc 127,936 0.07
2,355 KB Financial Group Inc 875,311 0.5150 KCC Corp 115,447 0.07
100 Kepco Plant Service & Engine 25,096 0.011,771 KIA Motors Corp 384,602 0.22
333 Korea Aerospace Industries 96,578 0.061,524 Korea Electric Power Corp 343,299 0.20
417 Korea Investment Holdings Co 246,871 0.1462 Korea Zinc Co Ltd 168,468 0.10
567 Korean Air Lines Co Ltd 112,756 0.06639 KT&G Corp 481,307 0.28109 Kumho Petrochemical Co Ltd 89,390 0.05308 LG Chem Ltd 723,077 0.42
50 LG Chem Ltd – Preference 70,922 0.04779 LG Corp 395,376 0.23
1,651 LG Display Co Ltd 212,685 0.12619 LG Electronics Inc 361,665 0.21
59 LG Household & Health Care 579,796 0.34128 Lotte Chemical Corp 313,565 0.18248 Lotte Corp 100,033 0.06
71 Lotte Shopping Co 104,958 0.063,903 Mirae Asset Daewoo Co Ltd 234,086 0.14
175 Naver Corp 939,940 0.5590 Ncsoft Corp 235,047 0.14
1,680 NH Investment & Securities C 176,802 0.10119 OCI Co Ltd 86,282 0.05154 Orion Corp/Republic of Korea 161,527 0.09425 POSCO 984,289 0.57
70 S-1 Corporation 47,699 0.0399 Samsung Biologics Co Ltd 290,609 0.17
497 Samsung C&T Corp 407,587 0.24172 Samsung Card Co 46,373 0.03335 Samsung Electro-Mechanics Co 350,194 0.20
4,785 Samsung Electronics – Pref 1,268,191 0.7426,488 Samsung Electronics Co Ltd 8,698,384 5.06
172 Samsung Fire & Marine Ins 319,647 0.191,230 Samsung Heavy Industries 61,822 0.04
439 Samsung Life Insurance Co Lt 304,087 0.18334 Samsung Sdi Co Ltd 503,151 0.29205 Samsung Sds Co Ltd 289,338 0.17446 Samsung Securities Co Ltd 109,101 0.06
2,468 Shinhan Financial Group Ltd 752,265 0.4481 Shinsegae Inc 228,933 0.13
184 SK Holdings Co Ltd 335,471 0.193,253 SK Hynix Inc 1,962,468 1.14
361 SK Innovation Co Ltd 513,330 0.3083 SK Telecom 136,136 0.08
199 S-Oil Corp 153,393 0.091,986 Woori Bank 227,879 0.13
40 Yuhan Corp 61,243 0.04
32,984,076 19.17

Semi-annual Report 103
iShares MSCI Emerging Asia Index ETF (continued)
Investment Portfolio (unaudited) as at 30th June 2018
HoldingsFair value
HK$
% ofNet
Assets
Taiwan (15.51%)16,501 Acer Inc 105,728 0.06
1,099 Advantech Co Ltd 56,843 0.0325,647 ASE Technology Holding Co Lt 472,532 0.27
4,267 Asia Cement Corp 36,783 0.025,754 Asustek Computer Inc 412,360 0.24
80,951 Au Optronics Corp 268,716 0.164,000 Catcher Technology Co Ltd 350,991 0.20
48,671 Cathay Financial Holding Co 673,805 0.398,221 Chailease Holding Co Ltd 211,547 0.12
15,733 Cheng Shin Rubber Ind Co Ltd 185,623 0.1120,000 China Airlines Ltd 48,995 0.0382,999 China Development Financial 238,138 0.14
6,911 China Life Insurance Co Ltd 57,086 0.0378,110 China Steel Corp 476,362 0.2822,733 Chunghwa Telecom Co Ltd 643,474 0.3745,386 Compal Electronics 224,236 0.13
109,732 CTBC Financial Holding Co Lt 619,797 0.3613,920 Delta Electronics Inc 392,225 0.2343,714 E.Sun Financial Holding Co 239,035 0.14
1,681 Eclat Textile Company Ltd 156,804 0.0915,099 Eva Airways Corp 57,309 0.0310,666 Far Eastone Telecomm Co Ltd 216,277 0.13
2,133 Feng Tay Enterprise Co Ltd 83,978 0.0557,798 First Financial Holding Co 306,381 0.1816,480 Formosa Chemicals & Fibre 515,247 0.30
8,200 Formosa Petrochemical Corp 258,483 0.1525,137 Formosa Plastics Corp 727,692 0.42
5,155 Foxconn Technology Co Ltd 98,958 0.0634,983 Fubon Financial Holding Co 460,002 0.27
887 Giant Manufacturing 29,444 0.021,000 Globalwafers Co Ltd 130,464 0.081,088 Hiwin Technologies Corp 100,789 0.06
92,794 Hon Hai Precision Industry 1,986,667 1.151,873 Hotai Motor Company Ltd 129,409 0.073,811 HTC Corp 55,800 0.03
45,494 Hua Nan Financial Holdings C 207,795 0.1254,993 Innolux Corp 154,954 0.0910,667 Inventec Corp 65,740 0.04
604 Largan Precision Co Ltd 697,855 0.4118,675 Lite-On Technology Corp 177,324 0.1011,000 Macronix International 122,847 0.07
9,499 Mediatek Inc 733,299 0.4363,791 Mega Financial Holding Co Lt 441,564 0.26
4,267 Micro-Star International Co 103,432 0.0629,010 Nan Ya Plastics Corp 650,948 0.38
1,067 Nien Made Enterprise Co Ltd 71,524 0.041,778 Novatek Microelectronics Cor 62,909 0.04
11,588 Pegatron Corp 186,964 0.1122,000 Pou Chen 200,405 0.12
2,133 Powertech Technology Inc 48,575 0.033,556 President Chain Store Corp 316,149 0.18
16,000 Quanta Computer Inc 220,270 0.132,133 Realtek Semiconductor Corp 60,925 0.033,200 Ruentex Industries Ltd 51,218 0.03
43,257 Sinopac Financial Holdings 122,442 0.0712,599 Synnex Technology Intl Corp 149,134 0.09
999 Taimed Biologics Inc 80,205 0.0551,162 Taishin Financial Holding 189,580 0.1172,218 Taiwan Business Bank 174,871 0.1030,413 Taiwan Cement 331,432 0.1948,980 Taiwan Cooperative Financial 224,977 0.1310,267 Taiwan Mobile Co Ltd 291,936 0.17
135,581 Taiwan Semiconductor Manufac 7,553,331 4.394,267 Teco Electric & Machinery 25,144 0.01
29,297 Uni-President Enterprises Co 583,507 0.3494,733 United Microelectronics Corp 413,193 0.24
1,778 Vanguard International Semi 31,935 0.022,000 Win Semiconductors Corp 112,966 0.07
HoldingsFair value
HK$
% ofNet
Assets
Taiwan (15.51%) Continued17,000 Winbond Electronics Corp 85,303 0.05
7,422 Wistron Corp 43,258 0.023,200 WPG Holdings Ltd 35,573 0.021,000 Yageo Corporation 289,490 0.17
94,914 Yuanta Financial Holding Co 339,490 0.20
26,680,444 15.51
Thailand (2.86%)5,578 Advanced Info Service PCL (FR) 244,370 0.14
32,180 Airports of Thailand PCL (FR) 480,090 0.281,407 Bangkok Bank PCL – Foreign Reg 65,138 0.04
26,250 Bangkok Dusit Medical Services PCL (FR) 155,405 0.09
30,400 Bangkok Expressway and Metro (FR) 53,632 0.039,300 Banpu Public Co Ltd – Foreign 42,945 0.026,700 Berli Jucker Pub Co (FR) 80,124 0.05
37,432 BTS Group Holdings PCL (FR) 78,005 0.051,125 Bumrungrad Hospital (FR) 44,357 0.03
24,750 C.P. All PCL (FR) 430,783 0.255,250 Central Pattana PCL (FR) 86,716 0.05
19,500 Charoen Pokphand Foods Co Ltd (FR) 111,750 0.06
4,725 Glow Energy PCL (FR) 106,018 0.0634,721 Home Product Center PCL (FR) 110,178 0.0614,250 Indorama Ventures PCL (FR) 184,755 0.11
100,000 IRPC PCL (FR) 137,349 0.086,929 Kasikornbank PCL – Foreign 318,324 0.184,000 Kasikornbank PCL – NVDR 183,763 0.11
17,212 Krung Thai Bank PCL (FR) 68,068 0.049,375 Minor International PCL (FR) 72,152 0.047,197 PTT Exploration & Production PCL
(FR) 239,455 0.1412,712 PTT Global Chemical PCL (FR) 219,752 0.1365,620 PTT PCL (FR) 745,888 0.43
2,054 Siam Cement Pub Co (FR) 201,371 0.129,891 Siam Commercial Bank PCL (FR) 277,559 0.166,262 Thai Oil PCL (FR) 115,295 0.07
50,245 True Corp PCL (FR) 63,062 0.04
4,916,304 2.86
Total listed equity 151,038,455 87.79
Exchange traded fund (11.48%)
India (11.48%)834,767 iShares Asia Trust – iShares S&P BSE
Sensex India Index ETF 19,742,239 11.48
19,742,239 11.48
Unlisted Rights (0.00%)
Taiwan (0.00%)2,034 Cathay Financial Holding Co Ltd –
Rights 0.00 0.00
0.00 0.00
Total investments 170,780,694 99.27Other net assets 1,260,637 0.73
Net assets attributable to
unitholders at 30th June 2018 172,041,331 100.00
Total investments, at cost 130,681,486
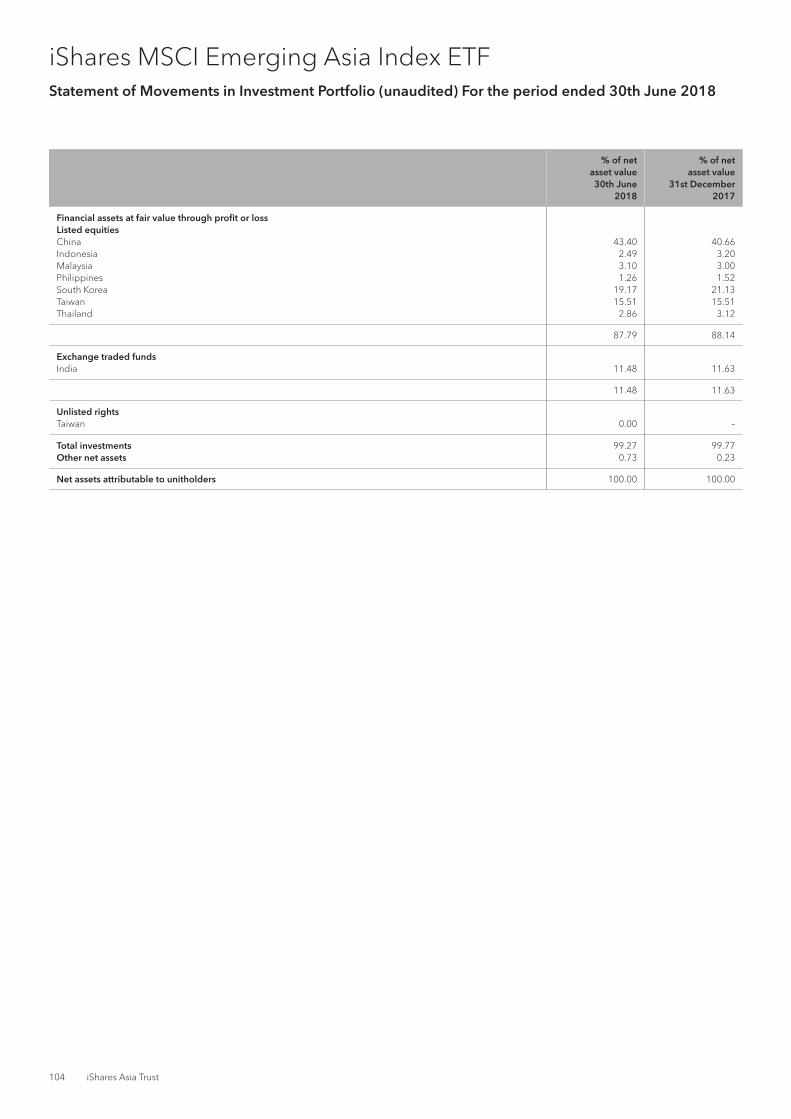
104 iShares Asia Trust
iShares MSCI Emerging Asia Index ETF Statement of Movements in Investment Portfolio (unaudited) For the period ended 30th June 2018
% of net asset value 30th June
2018
% of net asset value
31st December 2017
Financial assets at fair value through profit or lossListed equitiesChina 43.40 40.66Indonesia 2.49 3.20Malaysia 3.10 3.00Philippines 1.26 1.52South Korea 19.17 21.13Taiwan 15.51 15.51Thailand 2.86 3.12
87.79 88.14 Exchange traded fundsIndia 11.48 11.63
11.48 11.63 Unlisted rightsTaiwan 0.00 – Total investments 99.27 99.77Other net assets 0.73 0.23 Net assets attributable to unitholders 100.00 100.00

Semi-annual Report 105
iShares MSCI Emerging Asia Index ETF Performance Record (unaudited)
Net Asset Value
DealingNet asset value
per unitHK$
DealingNet asset value
of the Sub-FundHK$
At end of financial period dated31st December 2016 39.75 119,250,29331st December 2017 56.36 180,343,85030th June 2018 53.76 172,041,331
Highest and lowest net asset value per unit
Highest net assetvalue per unit
HK$
Lowest net assetvalue per unit
HK$
Financial period ended31st December 2009 (since inception) 38.30 20.0031st December 2010 45.33 33.6331st December 2011 47.81 34.5631st December 2012 43.99 36.3031st December 2013 44.41 37.5631st December 2014 48.00 39.3331st December 2015 50.31 36.6031st December 2016 44.18 33.7031st December 2017 57.77 40.0230th June 2018 61.74 52.83

106 iShares Asia Trust
iShares Core CSI 300 Index ETF Investment Portfolio (unaudited) as at 30th June 2018
HoldingsFair value
RMB
% ofNet
Assets
Investments (99.42%)
Listed equities (99.42%)
China (99.42%)4,300 360 Security Technology In – A 124,270 0.119,600 AECC Aviation Power Co – A 214,272 0.19
406,100 Agricultural Bank of China – A 1,396,984 1.2210,100 Aier Eye Hospital Group Co – A 326,129 0.2931,700 Air China Ltd – A 281,813 0.2511,900 Aisino Corp – A 300,713 0.2669,800 Aluminum Corp of China Ltd – A 268,032 0.2319,600 Angang Steel Co Ltd – A 109,172 0.1021,200 Anhui Conch Cement Co Ltd – A 709,776 0.6223,472 Anxin Trust Co Ltd – A 169,937 0.1515,800 Avic Aircraft Co Ltd – A 247,112 0.2250,800 Avic Capital Co Ltd – A 237,236 0.21
2,800 Avic Helicopter Co Ltd – A 111,972 0.10157,240 Bank of Beijing Co Ltd – A 948,157 0.83223,900 Bank of China Ltd – A 808,279 0.71291,800 Bank of Communications Co – A 1,674,932 1.46
14,600 Bank of Guiyang Co Ltd – A 180,456 0.1615,600 Bank of Hangzhou Co Ltd – A 173,004 0.1573,100 Bank of Jiangsu Co Ltd – A 468,571 0.4158,460 Bank of Nanjing Co Ltd – A 451,896 0.4026,900 Bank of Ningbo Co Ltd – A 438,201 0.3841,490 Bank of Shanghai Co Ltd – A 653,882 0.5794,616 Baoshan Iron & Steel Co – A 737,059 0.6435,400 BBMG Corporation – A 116,112 0.1025,500 Beijing Capital Co Ltd – A 107,610 0.0911,800 Beijing Capital Developmen – A 82,954 0.0725,200 Beijing Dabeinong Technolo – A 104,076 0.0910,700 Beijing Enlight Media Co L – A 108,926 0.10
9,500 Beijing New Building Mater – A 176,035 0.1512,400 Beijing Orient Landscape – A 166,284 0.1520,000 Beijing Originwater Techno – A 278,600 0.2410,550 Beijing Sanju Environmenta – A 245,604 0.21
3,400 Beijing Shiji Information – A 98,600 0.0918,000 Beijing Shougang Co Ltd – A 73,980 0.06
5,800 Beijing Tongrentang Co – A 204,624 0.1827,300 Beijing Xinwei Technology – A 303,849 0.27
251,800 BOE Technology Group Co Lt – A 891,372 0.7824,000 Bohai Capital Holding Co – A 114,960 0.10
9,500 BYD Co Ltd – A 452,960 0.404,200 Caitong Securities Co Ltd – A 47,376 0.04
37,200 Changjiang Securities Co L – A 201,996 0.1811,100 Chaozhou Three-Circle Grou – A 260,850 0.23
6,900 China Avionics Systems Co – A 90,114 0.0835,500 China Citic Bank Corp Ltd – A 220,455 0.1920,600 China Coal Energy Co – A 99,498 0.0917,800 China Communications Const – A 202,742 0.1878,600 China Construction Bank – A 514,830 0.4541,700 China Eastern Airlines Co – A 276,054 0.24
169,100 China Everbright Bank Co – A 618,906 0.546,400 China Film Co Ltd – A 102,656 0.09
13,400 China Fortune Land Develop – A 345,050 0.3013,800 China Galaxy Securities Co – A 112,194 0.1028,900 China Gezhouba Group Co Lt – A 208,369 0.1826,260 China Grand Automotive Ser – A 153,884 0.1314,600 China Hainan Rubber Indust – A 96,652 0.0810,100 China High-Speed Railway – A 50,096 0.0410,400 China International Travel – A 669,864 0.5922,300 China Jushi Co Ltd – A 228,129 0.2018,200 China Life Insurance Co – A 409,864 0.36
109,600 China Merchants Bank – A 2,897,824 2.5324,200 China Merchants Securities – A 331,056 0.2925,200 China Merchants Shekou Ind – A 480,060 0.42
251,100 China Minsheng Banking – A 1,757,700 1.5424,400 China Molybdenum Co Ltd – A 153,476 0.1322,500 China National Chemical – A 151,425 0.13
HoldingsFair value
RMB
% ofNet
Assets
China (99.42%) Continued49,600 China National Nuclear Pow – A 280,240 0.2524,400 China Northern Rare Earth – A 277,672 0.24
6,800 China Nuclear Engineering – A 53,720 0.056,300 China Oilfield Services – A 60,102 0.05
33,400 China Pacific Insurance Gr – A 1,063,790 0.93111,700 China Petroleum & Chemical – A 724,933 0.63
17,800 China Petroleum Engineering 79,922 0.0748,900 China Railway Construction – A 421,518 0.3759,600 China Railway Group Ltd – A 445,212 0.39
7,600 China Reform Health Manage – A (formerly known as Searainbow Hldg Corp Co – A) 241,528 0.21
21,000 China Shenhua Energy Co – A 418,740 0.37100,100 China Shipbuilding Industry Co
Ltd – A 404,404 0.359,200 China Shipbuilding Industry Group
Power Co Ltd – A 160,540 0.1437,300 China Southern Airlines Co – A 315,185 0.27
7,200 China Spacesat Co Ltd – A 137,520 0.12223,020 China State Construction – A 1,217,689 1.06
93,400 China United Network – A 459,528 0.4051,600 China Vanke Co Ltd – A 1,269,360 1.1170,100 China Yangtze Power Co Ltd – A 1,131,414 0.99
7,100 Chinese Universe Publishin – A 91,235 0.0820,600 Chongqing Changan Automob – A 185,400 0.16
5,400 Chongqing Zhifei Biologica – A 246,996 0.2230,500 Citic Guoan Information – A 144,265 0.1383,600 Citic Securities Co – A 1,385,252 1.2137,900 Cosco Shipping Developme – A 94,371 0.0844,400 Cosco Shipping Holdings Co – A 218,448 0.1977,500 CRRC Corp Ltd – A 596,750 0.5263,200 Daqin Railway Co Ltd – A 518,872 0.4526,300 Datang Intl Power Gen Co – A 79,689 0.0720,000 DHC Software Co Ltd – A 172,000 0.15
4,900 Dong-E-E-Jiaoco Ltd – A 263,669 0.2312,800 Dongxing Securities Co Lt – A 166,912 0.1540,700 Dongxu Optoelectronic Tech – A 246,642 0.2213,900 Dr Peng Telcom & Media Gr – A 166,800 0.1535,712 East Money Information Co – A 470,684 0.4120,300 Everbright Securitie Co – A 222,894 0.2011,400 Fangda Carbon New Material – A 277,932 0.24
6,500 Fiberhome Telecom Tech Co – A 161,525 0.1413,800 Financial Street Holdings – A 111,090 0.1022,340 First Capital Securities C – A 151,242 0.1377,976 Focus Media Information Te – A 746,230 0.65
8,600 Foshan Haitian Flavouring – A 633,304 0.5543,700 Founder Securities Co Ltd – A 292,353 0.2610,000 Future Land Holdings Co – A 309,700 0.2714,900 Fuyao Glass Industry Group – A 383,079 0.33
125,200 GD Power Development Co – A 328,024 0.2926,000 Gemdale Corp – A 264,940 0.2331,200 GF Securities Co Ltd – A 414,024 0.36
6,500 Giant Network Group Co Ltd – A 154,570 0.1422,800 Goertek Inc – A 232,332 0.2014,800 Great Wall Motor Co Ltd – A 145,336 0.1351,100 Gree Electric Appliances I – A 2,409,365 2.1141,500 Greenland Holdings Corp Lt – A 271,410 0.2440,000 Guangshen Railway Co Ltd – A 170,000 0.15
6,860 Guangzhou Automobile Group – A 76,420 0.076,000 Guangzhou Baiyunshan Phar – A 228,300 0.20
19,700 Guangzhou Port Co Ltd – A 114,457 0.1025,600 Guosen Securities Co Ltd – A 232,960 0.2039,900 Guotai Junan Securities Co – A 588,126 0.51
6,890 Guoxuan High-Tech Co Ltd – A 96,873 0.0819,450 Guoyuan Securities Co Ltd – A 143,930 0.1387,400 Hainan Airlines Holding Co – A 225,492 0.2086,000 Haitong Securities Co Ltd – A 814,420 0.71
9,100 Han’s Laser Technology In – A 484,029 0.4239,200 Hangzhou Hikvision Digital – A 1,455,496 1.27

Semi-annual Report 107
iShares Core CSI 300 Index ETF (continued)
Investment Portfolio (unaudited) as at 30th June 2018
HoldingsFair value
RMB
% ofNet
Assets
China (99.42%) Continued5,300 Hangzhou Robam Appliances – A 162,286 0.14
19,100 Heilan Home Co Ltd – A 243,334 0.2110,500 Henan Shuanghui Investment – A 277,305 0.24
8,100 Hengli Petrochemical Co L – A 118,746 0.1014,140 Hengtong Optic-Electric Co – A 311,787 0.2748,800 Hesteel Co Ltd – A 143,960 0.13
2,700 Hithink Royalflush Informa – A 104,949 0.0916,100 Huaan Securities Co Ltd – A 92,092 0.08
7,800 Huadong Medicine Co Ltd – A 376,350 0.336,500 Hualan Biological Engineer – A 209,040 0.18
19,100 Huaneng Lancang River Hydr – A 58,064 0.0546,800 Huaneng Power Intl Inc – A 297,648 0.2634,500 Huatai Securities Co Ltd – A 516,465 0.4567,720 Huaxia Bank Co Ltd – A 504,514 0.4419,400 Huayi Brothers Media Corp – A 119,504 0.1017,500 Huayu Automotive Systems – A 415,100 0.3611,700 Hubei Biocause Pharmaceuti – A 82,134 0.07
5,200 Hundsun Technologies Inc – A 275,340 0.2415,450 Iflytek Co Ltd – A 495,482 0.43
229,100 Ind & Comm Bk of China – A 1,218,812 1.07132,400 Industrial Bank Co Ltd – A 1,906,560 1.67
51,300 Industrial Securities Co – A 270,351 0.24153,580 Inner Mongolia Baotou Ste – A 238,049 0.21
35,500 Inner Mongolia Junzheng En – A 119,635 0.1064,600 Inner Mongolia Yili Indus – A 1,802,340 1.58
3,400 Jiangsu Bicon Pharmaceutic – A 96,356 0.0820,000 Jiangsu Broadcasting Cable – A 102,000 0.0923,444 Jiangsu Hengrui Medicine C – A 1,776,118 1.55
6,400 Jiangsu Yanghe Brewery – A 842,240 0.7414,600 Jiangsu Zhongnan Construct – A 92,126 0.0822,800 Jiangsu Zhongtian Technolo – A 200,868 0.1810,400 Jiangxi Copper Co Ltd – A 164,840 0.14
8,500 Jiangxi Ganfeng Lithium Co – A 327,930 0.2916,000 Jihua Group Corp Ltd – A 64,320 0.06
9,810 Jilin Aodong Pharmaceutica – A 176,384 0.159,200 Jinduicheng Molybdenum Co – A 57,684 0.05
27,100 Kangde Xin Composite Mater – A 462,868 0.4031,700 Kangmei Pharmaceutical Co – A 725,296 0.6316,700 Kingenta Ecological Engine – A 114,896 0.10
4,600 Kuang-Chi Technologies Co – A 53,866 0.055,400 Kweichow Moutai Co Ltd – A 3,949,884 3.455,600 Lens Technology Co Ltd – A 117,488 0.10
12,000 Lepu Medical Technology – A 440,160 0.3812,800 Liaoning Cheng Da Co Ltd – A 194,304 0.17
6,500 Lomon Billions Group Co – A 84,045 0.0721,820 Longi Green Energy Technol – A 364,176 0.3220,250 Luxshare Precision Industr – A 456,435 0.40
8,100 Luzhou Laojiao Co Ltd – A 492,966 0.4313,320 Meinian Onehealth Healthca – A 301,032 0.2661,100 Metallurgical Corp of Chin – A 203,463 0.1849,000 Midea Group Co Ltd – A 2,558,780 2.24
3,900 Muyuan Foodstuff Co Ltd – A 173,394 0.155,500 Nanjing Xinjiekou Dept – A 90,420 0.08
16,600 Nari Technology Co Ltd – A 262,280 0.238,900 New China Life Insurance C – A 381,632 0.33
24,300 New Hope Liuhe Co Ltd – A 154,062 0.1342,000 Ningbo Zhoushan Port Co Lt – A 176,820 0.1523,500 Offshore Oil Engineering – A 123,610 0.1120,200 O-film Tech Co Ltd – A 325,826 0.28
1,300 Oppein Home Group Inc – A 165,789 0.1533,200 Orient Securities Co Ltd – A 303,116 0.2672,400 Pacific Securities Co/The – A 169,416 0.15
4,300 Perfect World Co Ltd – A 133,343 0.1264,900 Petrochina Co Ltd – A 500,379 0.4491,200 Ping An Bank Co Ltd – A 829,008 0.72
115,100 Ping An Insurance Group Co – A 6,742,558 5.8975,600 Poly Real Estate Group Co – A 922,320 0.81
HoldingsFair value
RMB
% ofNet
Assets
China (99.42%) Continued51,700 Power Construction Corp of – A 277,112 0.2438,900 Qingdao Haier Co Ltd – A 749,214 0.6512,900 Qinghai Salt Lake Industry – A 139,578 0.12
3,400 Red Star Macalline Group C – A 51,952 0.0514,700 Risesun Real Estate Devel – A 128,331 0.1118,200 Rongsheng Petro Chemical – A 187,824 0.16
2,400 S F Holding Co Ltd – A 108,000 0.0937,200 Saic Motor Corp Ltd – A 1,301,628 1.1425,800 Sanan Optoelectronics Co L – A 495,876 0.4349,400 Sany Heavy Industry Co Ltd – A 443,118 0.39
9,500 Sdic Capital Co Ltd – A (formerly known as Sdic Essence Holdings Co L – A) 88,160 0.08
43,100 Sdic Power Holdings Co Ltd – A 313,337 0.2742,700 Shaanxi Coal Industry Co L – A 350,994 0.31
3,600 Shandong Buchang Pharmaceu – A 154,044 0.137,600 Shandong Gold Mining Co Lt – A 181,792 0.16
62,200 Shandong Nanshan Aluminum – A 168,562 0.1552,515 Shanghai Construction Grou – A 159,646 0.1434,500 Shanghai Electric Grp Co L – A 218,730 0.1910,693 Shanghai Fosun Pharmaceuti – A 442,583 0.3910,200 Shanghai International Air – A 565,896 0.4934,800 Shanghai International Por – A 207,408 0.18
7,800 Shanghai Lujiazui Fin&Trad – A 123,162 0.1114,700 Shanghai Oriental Pearl Gr – A 221,382 0.1912,300 Shanghai Pharmaceuticals – A 293,970 0.26
124,682 Shanghai Pudong Devel Bank – A 1,191,960 1.0410,800 Shanghai RAAS Blood Produc – A 248,940 0.2221,800 Shanghai Tunnel Engineerin – A 128,838 0.1113,100 Shanxi Meijin Energy Co Lt – A 71,133 0.0617,600 Shanxi Securities Co Ltd – A 118,624 0.10
2,800 Shanxi Xinghuacun Fen Wine – A 176,092 0.1519,200 Shanxi Xishan Coal & Elec – A 144,192 0.1371,800 Shenwan Hongyuan Group Co – A 313,766 0.27
1,000 Shenzhen Goodix Technology – A 64,890 0.0610,600 Shenzhen Inovance Technolo – A 347,892 0.3034,900 Shenzhen Overseas Chinese – A 252,327 0.22
4,800 Shenzhen Salubris Pharm – A 178,416 0.168,900 Shenzhen Sunway Communicat – A 273,497 0.24
25,300 Shenzhen Zhongjin Lingnan – A 122,958 0.1112,900 Siasun Robot & Automation – A 224,460 0.2025,100 Sichuan Chuantou Energy Co – A 218,872 0.1923,700 Sinolink Securities Co Ltd – A 168,507 0.1516,300 Sinopec Shanghai Petroche – A 92,747 0.08
7,100 Songcheng Performance Deve – A 166,850 0.1524,900 Soochow Securities Co Ltd – A 170,067 0.1532,900 Southwest Securities Co Lt – A 126,665 0.11
2,900 Spring Airlines Co Ltd – A 101,587 0.093,300 STO Express Co Ltd – A 56,595 0.05
39,600 Suning.Com Co Ltd – A (formerly known as Suning Commerce Group Co – A) 557,568 0.49
6,200 Suofeiya Home Collection C – A 199,516 0.1718,500 Suzhou Gold Mantis Constr – A 186,850 0.1610,020 Tasly Pharmaceutical Group – A 258,716 0.2342,166 TBEA Co Ltd – A 292,210 0.26
115,100 TCL Corp – A 333,790 0.297,260 Tianqi Lithium Corp – A 360,023 0.31
15,300 Tonghua Dongbao Pharmaceut – A 366,741 0.3270,100 Tongling Nonferrous Metals – A 154,921 0.1420,600 Tongwei Co Ltd – A 142,140 0.1220,700 Tsinghua Tongfang Co Ltd – A 181,746 0.16
8,100 Tus-Sound Environmen-Res A 141,588 0.121,800 Unisplendour Corp Ltd – A
(formerly known as Tsinghua Unisplendour Co – A) 112,680 0.10
6,300 Wanda Film Holding Co Ltd – A 327,348 0.29

108 iShares Asia Trust
iShares Core CSI 300 Index ETF (continued)
Investment Portfolio (unaudited) as at 30th June 2018
HoldingsFair value
RMB
% ofNet
Assets
China (99.42%) Continued17,671 Wangsu Science & Technolog – A 189,256 0.1717,380 Wanhua Chemical Group Co – A 789,400 0.6914,680 Wanxiang Qianchao Co Ltd – A 99,824 0.0951,400 Weichai Power Co Ltd – A 449,750 0.3920,680 Western Securities Co Ltd – A 156,134 0.1470,000 Wintime Energy Co Ltd – A 124,600 0.1119,900 Wuchan Zhongda Group Co L – A 104,077 0.09
4,800 Wuhu Shunrong Sanqi Intera – A 58,320 0.0520,600 Wuliangye Yibin Co Ltd – A 1,565,600 1.3744,700 XCMG Construction Machin – A 189,528 0.1716,100 Xiamen C & D Inc – A 144,739 0.13
6,630 Xiamen Tungsten Co Ltd – A 100,643 0.0946,300 Xinhu Zhongbao Co Ltd – A 176,866 0.1521,560 Xinjiang Goldwind Sci&Tech – A 272,518 0.2417,500 Yango Group Co Ltd – A 104,475 0.09
9,400 Yanzhou Coal Mining Co – A 122,576 0.1140,700 Yonghui Superstores Co Ltd – A 310,948 0.2710,050 Yonyou Network Technology – A 246,326 0.2224,060 Youngor Group Co – A 185,262 0.16
3,600 YTO Express Group Co Ltd – A 47,520 0.045,500 Yunnan Baiyao Group Co Ltd – A 588,280 0.513,100 Zhangzhou Pientzehuang Pha – A 346,983 0.303,500 Zhejiang Century Huatong – A 113,750 0.10
33,700 Zhejiang China Commodities – A 145,247 0.139,100 Zhejiang Chint Electrics – A 203,112 0.18
16,852 Zhejiang Dahua Technology – A 380,013 0.333,800 Zhejiang Huayou Cobalt Co – A 370,386 0.32
28,400 Zhejiang Longsheng Group C – A 339,380 0.309,000 Zhejiang Sanhua Intelligen – A 169,650 0.15
13,900 Zhejiang Wanfeng Auto – A 130,660 0.1146,900 Zhejiang Zheneng Electric – A 218,554 0.1913,900 Zhengzhou Yutong Bus Co – A 266,741 0.2317,700 Zhongjin Gold Corp – A 120,714 0.1154,150 Zhongtian Financial Group – A 234,470 0.21
115,300 Zijin Mining Group Co Ltd – A 416,233 0.3653,200 Zoomlion Heavy Industry S – A 218,652 0.1923,800 ZTE Corp – A 310,114 0.27
Total investments 113,784,033 99.42Other net assets 665,216 0.58
Net assets attributable to
unitholders at 30th June 2018 114,449,249 100.00
Total investments, at cost 110,447,873

Semi-annual Report 109
iShares Core CSI 300 Index ETF Statement of Movements in Investment Portfolio (unaudited) For the period ended 30th June 2018
% of net asset value 30th June
2018
% of net asset value
31st December 2017
Financial assets at fair value through profit or lossListed equitiesConsumer Discretionary 12.08 11.18Consumer Staples 9.27 8.09Energy 2.48 2.35Financials 31.17 33.78Health Care 7.33 5.56Industrials 13.20 13.70Information Technology 8.75 9.59Materials 7.38 7.29Real Estate 4.56 5.10Telecommunications Services 0.55 0.63Utilities 2.65 2.60
99.42 99.87 Total investments 99.42 99.87Other net assets 0.58 0.13 Net assets attributable to unitholders 100.00 100.00

110 iShares Asia Trust
iShares Core CSI 300 Index ETF Performance Record (unaudited)
Net Asset Value
DealingNet asset value
per unit
DealingNet asset value
of the Sub-Fund
At end of financial period dated31st December 2016 HK$24.21 HK$193,698,42631st December 2017 HK$31.29 HK$179,916,14730th June 2018* RMB22.89 RMB114,449,249
Highest and lowest net asset value per unit
Highest net assetvalue per unit
Lowest net assetvalue per unit
Financial period ended31st December 2010 (since inception) HK$33.18 HK$23.0731st December 2011 HK$31.34 HK$21.5131st December 2012 HK$25.01 HK$18.6631st December 2013 HK$23.86 HK$18.8731st December 2014 HK$29.59 HK$17.7131st December 2015 HK$44.41 HK$23.9631st December 2016 HK$27.54 HK$21.9731st December 2017 HK$32.69 HK$24.2230th June 2018* RMB28.50 RMB22.32
* For iShares Core CSI 300 Index ETF, the base currency was changed from Hong Kong dollar (“HK$”) to Renminbi (“RMB”), effective from 1st January 2018.

Semi-annual Report 111
iShares Core KOSPI 200 Index ETF Investment Portfolio (unaudited) as at 30th June 2018
HoldingsFair value
US$
% ofNet
Assets
Investments (99.87%)
Listed equities (99.87%)
South Korea (99.87%)55 AK Holdings Inc 3,721 0.04
363 Amorepacific Corp 105,040 1.17295 Amorepacific Group 32,690 0.36534 BGF Co Ltd 5,175 0.06100 BGF Retail Co Ltd 17,497 0.20
66 Binggrae Co Ltd 3,559 0.043,014 BNK Financial Group Inc 25,286 0.28
240 Boryung Pharmaceutical Co 1,988 0.02404 Bukwang Pharmaceutical Co 8,537 0.10
1,124 Celltrion Inc 306,087 3.42803 Cheil Worldwide Inc 14,878 0.17
81 Chong Kun Dang Pharmaceutica 7,304 0.08157 CJ CGV Co Ltd 9,466 0.11
91 CJ Cheiljedang Corp 28,782 0.32154 CJ Corp 19,621 0.22110 CJ Logistics 16,581 0.18
83 Cosmax Inc 12,102 0.13619 Coway Co Ltd 48,098 0.54
18 Cuckoo Holdings Co Ltd 2,867 0.03396 Daeduck Electronics Co 2,967 0.03297 Daekyo Co Ltd 2,065 0.02314 Daelim Industrial Co Ltd 21,553 0.24242 Daesang Corporation 5,765 0.06
2,420 Daewoo Engineering & Constr 12,746 0.14537 Daewoo Shipbuilding & Marine 13,009 0.14
66 Daewoong Pharmaceutical Co 11,607 0.13418 DB Hitek Co Ltd 7,351 0.08555 DB Insurance Co Ltd 29,381 0.33
35 Dong-A Socio Holdings Co Ltd 3,219 0.0477 Dong-A St Co Ltd 6,052 0.07
836 Dongkuk Steel Mill Co Ltd 6,331 0.07379 Dongsuh Companies Inc 8,893 0.10
11 Dongwon F&B Co Ltd 2,917 0.0344 Dongwon Systems Corp 1,332 0.01
362 Doosan Bobcat Inc 10,394 0.1256 Doosan Corp 5,226 0.06
682 Doosan Heavy Industries 9,577 0.111,452 Doosan Infracore Co Ltd 12,559 0.14
227 E-Mart Inc 51,836 0.58176 Farmsco 1,990 0.02539 Foosung Co Ltd 4,981 0.06363 Grand Korea Leisure Co Ltd 8,485 0.09
66 Green Cross Corp 12,229 0.14303 Green Cross Holdings Corp 9,040 0.10572 GS Engineering & Construct 23,609 0.26572 GS Holdings 27,920 0.31319 GS Retail Co Ltd 12,580 0.14
88 Halla Holdings Corp 3,478 0.043,109 Hana Financial Group 119,534 1.33
396 Hanall Biopharma Co Ltd 8,865 0.10154 Handsome Co Ltd 5,755 0.06
44 Hanil Cement Co Ltd 5,665 0.06770 Hanjin Heavy Indus & Const 2,059 0.02
5 Hankook Shell Oil Co Ltd 1,586 0.02819 Hankook Tire Co Ltd 30,938 0.35275 Hankook Tire Worldwide Co Lt 4,318 0.05
76 Hanmi Pharm Co Ltd 28,709 0.32228 Hanmi Science Co Ltd 13,216 0.15
3,113 Hanon Systems 29,608 0.33187 Hansae Co Ltd 2,743 0.03
99 Hansol Chemical Co Ltd 6,955 0.08110 Hanssem Co Ltd 10,363 0.12429 Hanwha Aerospace Co Ltd (formerly
known as Hanwha Techwin Co Ltd) 9,027 0.10
HoldingsFair value
US$
% ofNet
Assets
South Korea (99.87%) Continued1,155 Hanwha Chemical Corp 22,644 0.25
436 Hanwha Corporation 12,343 0.144,048 Hanwha Life Insurance Co Ltd 19,250 0.21
275 HDC Holdings Co Ltd (formerly known as Hyundai Development Co-Engin) 7,057 0.08
385 HDC Hyundai Development Co – E 18,620 0.21363 Hite Jinro Co Ltd 6,400 0.07347 Hotel Shilla Co Ltd 38,452 0.43286 Huchems Fine Chemical Corp 7,506 0.08247 Hyosung Corporation 29,698 0.33176 Hyundai Dept Store Co 18,240 0.20198 Hyundai Elevator Co 15,918 0.18827 Hyundai Engineering & Const 42,667 0.48220 Hyundai Glovis Co Ltd 22,799 0.25627 Hyundai Greenfood Co Ltd 8,017 0.09516 Hyundai Heavy Industries 47,225 0.53108 Hyundai Heavy Industries Hol
(formerly known as Hyundai Robotics Co Ltd) 34,256 0.38
88 Hyundai Home Shopping Networ 8,883 0.10143 Hyundai Livart Co Ltd 2,925 0.03735 Hyundai Marine & Fire Ins Co 22,225 0.25143 Hyundai Mipo Dockyard 11,009 0.12766 Hyundai Mobis Co Ltd 145,708 1.63
1,698 Hyundai Motor Co 191,206 2.13550 Hyundai Rotem Company 13,843 0.15958 Hyundai Steel Co 45,214 0.50176 Hyundai Wia Corp 6,435 0.07214 Iljin Materials Co Ltd 8,132 0.09143 Ilyang Pharmaceutical Co Ltd 4,144 0.05
2,872 Industrial Bank of Korea 39,685 0.44138 Innocean Worldwide Inc 7,355 0.08148 IS Dongseo Co Ltd 3,685 0.04365 JW Holdings Corp 2,591 0.03138 JW Pharmaceutical 4,290 0.05566 Kakao Corp 58,149 0.65
1,436 Kangwon Land Inc 33,693 0.384,103 KB Financial Group Inc 194,382 2.17
69 KCC Corp 20,307 0.23154 Kepco Engineering & Construc 3,662 0.04264 Kepco Plant Service & Engine 8,445 0.09
2,966 KIA Motors Corp 82,101 0.9272 Kiswire Ltd 1,883 0.02
187 Kolon Industries Inc 11,342 0.13841 Korea Aerospace Industries 31,089 0.35
3,585 Korea Electric Power Corp 102,934 1.1588 Korea Electric Terminal Co 3,466 0.04
429 Korea Gas Corporation 24,712 0.28453 Korea Investment Holdings Co 34,183 0.38198 Korea Kolmar Co Ltd 15,012 0.17
38 Korea Petro Chemical Ind 8,541 0.1095 Korea Zinc Co Ltd 32,903 0.37
743 Korean Air Lines Co Ltd 18,833 0.212,470 KT Corp 60,725 0.681,283 KT&G Corp 123,177 1.37
211 Kumho Petrochemical Co Ltd 22,056 0.251,661 Kumho Tire Co Inc 9,404 0.10
220 LF Corp 5,547 0.06533 LG Chem Ltd 159,493 1.78
1,023 LG Corp 66,181 0.742,569 LG Display Co Ltd 42,183 0.471,231 LG Electronics Inc 91,676 1.02
77 LG Hausys Ltd 4,795 0.05110 LG Household & Health Care 137,784 1.54165 LG Innotek Co Ltd 21,393 0.24319 LG International Corp 6,912 0.08
3,175 LG Uplus Corp 39,883 0.44

112 iShares Asia Trust
iShares Core KOSPI 200 Index ETF (continued)
Investment Portfolio (unaudited) as at 30th June 2018
HoldingsFair value
US$
% ofNet
Assets
South Korea (99.87%) Continued131 LIG Nex1 Co Ltd 4,708 0.05187 Lock&Lock Co Ltd 3,725 0.04184 Lotte Chemical Corp 57,454 0.64
4 Lotte Chilsung Beverage Co 5,516 0.06304 Lotte Corp 15,630 0.17198 Lotte Fine Chemical Co Ltd 11,548 0.13
6 Lotte Food Co Ltd 4,587 0.0596 Lotte Himart Co Ltd 6,788 0.08
122 Lotte Shopping Co 22,988 0.26209 LS Corp 14,065 0.16187 LS Industrial Systems 11,829 0.13350 Mando Corp 12,059 0.13
3,338 Meritz Securities Co Ltd 10,632 0.125,118 Mirae Asset Daewoo Co Ltd 39,125 0.44
165 Muhak Co Ltd 2,243 0.02264 Namhae Chemical Corp 3,648 0.04
6 Namyang Dairy Products Co 3,467 0.04294 Naver Corp 201,276 2.25213 Ncsoft Corp 70,904 0.79739 Netmarble Corp (formerly known as
Netmarble Games Corp) 101,119 1.13451 Nexen Tire Corp 4,148 0.05
1,590 NH Investment & Securities C 21,328 0.2438 Nongshim Co Ltd 11,081 0.12
196 OCI Co Ltd 18,114 0.20288 Orion Corp/Republic of Korea 38,503 0.43181 Orion Holdings 4,466 0.05
12 Ottogi Corporation 9,249 0.102,415 Pan Ocean Co Ltd 10,585 0.12
231 Poongsan Corp 7,057 0.08795 POSCO 234,684 2.62537 POSCO DAEWOO Corp 10,311 0.11110 S&T Motiv Co Ltd 3,257 0.04277 S-1 Corporation 24,059 0.27171 Samsung Biologics Co Ltd 63,981 0.71
1,018 Samsung C&T Corp 106,413 1.19324 Samsung Card Co 11,134 0.12656 Samsung Electro-Mechanics Co 87,408 0.98
55,291 Samsung Electronics Co Ltd 2,314,334 25.831,755 Samsung Engineering Co Ltd 24,644 0.27
368 Samsung Fire & Marine Ins 87,171 0.975,059 Samsung Heavy Industries 32,410 0.36
985 Samsung Life Insurance Co Lt 86,966 0.97605 Samsung Sdi Co Ltd 116,169 1.30394 Samsung Sds Co Ltd 70,881 0.79735 Samsung Securities Co Ltd 22,917 0.26
33 Samyang Corp 2,428 0.0355 Samyang Holdings Corp 5,873 0.07
143 Seah Besteel Corp 2,752 0.0333 Seah Steel Corporation 2,253 0.0299 Sebang Global Battery Co Ltd 2,811 0.03
4,740 Shinhan Financial Group Ltd 184,156 2.0679 Shinsegae Inc 28,460 0.32
109 SK Chemicals Co Ltd/New 9,086 0.10102 SK Discovery Co Ltd (formerly known
as SK Chemicals Co Ltd) 3,373 0.04393 SK Holdings Co Ltd 91,330 1.02
6,516 SK Hynix Inc 501,051 5.59721 SK Innovation Co Ltd 130,679 1.46
1,738 SK Networks Co Ltd 7,018 0.08594 SK Telecom 124,183 1.39242 SKC Co Ltd 9,369 0.10143 SL Corp 2,329 0.03475 S-Oil Corp 46,669 0.52
22 SPC Samlip 2,596 0.03259 Ssangyong Cement Ind 6,600 0.07484 Ssangyong Motor Co 1,985 0.02
5 Taekwang Industrial Co Ltd 6,231 0.07
HoldingsFair value
US$
% ofNet
Assets
South Korea (99.87%) Continued2,508 Tongyang Inc 4,399 0.05
55 Unid Co Ltd 2,566 0.035,701 Woori Bank 83,379 0.93
6 Young Poong Corporation 4,318 0.05253 Youngone Corp 7,605 0.08108 Yuhan Corp 21,077 0.24
1,034 Yungjin Pharmaceutical Co 6,893 0.08
Total investments 8,949,030 99.87Other net assets 11,297 0.13
Net assets attributable to
unitholders at 30th June 2018 8,960,327 100.00
Total investments, at cost 7,476,044

Semi-annual Report 113
iShares Core KOSPI 200 Index ETF Statement of Movements in Investment Portfolio (unaudited) as at 30th June 2018
% of net asset value 30th June
2018
% of net asset value
31st December 2017
Financial assets at fair value through profit or lossListed equitiesConsumer Discretionary 10.08 11.19Consumer Staples 7.39 6.89Energy 2.31 2.37Financials 11.55 12.54Health Care 5.83 2.54Industrials 10.11 9.63Information Technology 40.22 40.88Materials 8.44 8.92Telecommunication Services 2.51 2.71Utilities 1.43 1.54 Total investments 99.87 99.21Other net assets 0.13 0.79 Net assets attributable to unitholders 100.00 100.00

114 iShares Asia Trust
iShares Core KOSPI 200 Index ETF Performance Record (unaudited)
Net Asset Value
DealingNet asset value
per unitUS$
DealingNet asset value
of the Sub-FundUS$
At end of financial period dated31st December 2016 1.07 13,482,53031st December 2017 1.52 13,719,28330th June 2018 1.36 8,960,327
Highest and lowest net asset value per unit
Highest net assetvalue per unit
US$
Lowest net assetvalue per unit
US$
Financial period ended31st December 2016 (since inception) 1.17 1.0031st December 2017 1.54 1.0830th June 2018 1.59 1.34

Semi-annual Report 115
iShares Core MSCI Taiwan Index ETF Investment Portfolio (unaudited) as at 30th June 2018
HoldingsFair value
US$
% ofNet
Assets
Investments (98.94%)
Listed equities (98.93%)
Taiwan (98.93%)737,060 Acer Inc 601,958.00 0.39
89,322 Advantech Co Ltd 588,869 0.3929,598 Airtac International Group 420,838 0.28
858,154 Ase Technology Holding Co Lt 2,015,311 1.32530,513 Asia Cement Corp 582,914 0.38178,653 Asustek Computer Inc 1,631,922 1.07
2,085,086 Au Optronics Corp 882,221 0.58157,793 Catcher Technology Co Ltd 1,764,843 1.16
2,025,450 Cathay Financial Holding Co 3,574,109 2.34281,149 Chailease Holding Co Ltd 922,148 0.60
1,187,549 Chang Hwa Commercial Bank 689,428 0.45486,654 Cheng Shin Rubber Ind Co Ltd 731,852 0.48133,747 Chicony Electronics Co Ltd 301,373 0.20660,340 China Airlines Ltd 206,190 0.14
3,421,164 China Development Financial 1,251,160 0.82628,047 China Life Insurance Co Ltd 661,243 0.43
3,136,772 China Steel Corp 2,438,345 1.60944,178 Chunghwa Telecom Co Ltd 3,406,517 2.23
1,068,052 Compal Electronics 672,601 0.444,340,672 CTBC Financial Holding Co Lt 3,125,039 2.05
516,723 Delta Electronics Inc 1,855,820 1.212,273,675 E.Sun Financial Holding Co 1,584,715 1.04
42,764 Eclat Textile Company Ltd 508,452 0.33524,446 Eva Airways Corp 253,721 0.17494,816 Evergreen Marine Corp Ltd 210,985 0.14779,788 Far Eastern New Century Corp 739,160 0.48401,109 Far Eastone Telecomm Co Ltd 1,036,699 0.68
83,878 Feng Tay Enterprise Co Ltd 420,924 0.282,331,219 First Financial Holding Co 1,575,122 1.03
871,315 Formosa Chemicals & Fibre 3,472,285 2.27306,829 Formosa Petrochemical Corp 1,232,811 0.81
1,105,300 Formosa Plastics Corp 4,078,464 2.67190,704 Formosa Taffeta Co. 208,602 0.14216,407 Foxconn Technology Co Ltd 529,510 0.35
1,669,784 Fubon Financial Holding Co 2,798,628 1.8343,800 General Interface Solution 284,448 0.1975,108 Giant Manufacturing 317,790 0.2155,920 GlobalWafers Co Ltd 929,906 0.61
205,500 Highwealth Construction Corp 304,996 0.2053,133 Hiwin Technologies Corp 627,380 0.41
4,087,519 Hon Hai Precision Industry 11,154,421 7.3064,614 Hotai Motor Company Ltd 569,030 0.37
167,140 HTC Corp 311,930 0.201,828,658 Hua Nan Financial Holdings C 1,064,620 0.702,237,993 Innolux Corp 803,779 0.53
631,296 Inventec Corp 495,910 0.3225,208 Largan Precision Co Ltd 3,712,348 2.43
507,935 Lite-On Technology Corp 614,750 0.40454,273 Macronix International 646,652 0.42372,104 Mediatek Inc 3,661,420 2.40
2,723,513 Mega Financial Holding Co Lt 2,402,955 1.57174,280 Micro-Star International Co 538,471 0.35
1,280,663 Nan Ya Plastics Corp 3,662,818 2.40261,414 Nanya Technology Corp 713,372 0.47
37,788 Nien Made Enterprise Co Ltd 322,868 0.21144,699 Novatek Microelectronics Cor 652,578 0.43472,890 Pegatron Corp 972,504 0.64
37,264 Phison Electronics Corp 294,558 0.19541,434 Pou Chen 628,655 0.41191,848 Powertech Technology Inc 556,884 0.36144,684 President Chain Store Corp 1,639,580 1.07687,777 Quanta Computer Inc 1,206,884 0.79114,532 Realtek Semiconductor Corp 416,979 0.27252,610 Ruentex Development Co Ltd 291,647 0.19
HoldingsFair value
US$
% ofNet
Assets
Taiwan (98.93%) Continued141,932 Ruentex Industries Ltd 289,557 0.19
2,067,026 Shin Kong Financial Holding 796,614 0.522,718,617 Sinopac Financial Holdings 980,855 0.64
100,323 Standard Foods Corp 203,025 0.13356,748 Synnex Technology Intl Corp 538,249 0.35
40,552 Taimed Biologics Inc 414,983 0.272,339,387 Taishin Financial Holding 1,104,914 0.721,004,487 Taiwan Business Bank 310,026 0.20
931,625 Taiwan Cement 1,294,072 0.851,999,105 Taiwan Cooperative Financial 1,170,409 0.77
429,640 Taiwan High Speed Rail Corp 336,796 0.22406,653 Taiwan Mobile Co Ltd 1,473,839 0.96
6,115,671 Taiwan Semiconductor Manufac 43,427,613 28.42477,350 Teco Electric & Machinery 358,539 0.23
1,191,841 Uni-President Enterprises Co 3,025,682 1.983,007,450 United Microelectronics Corp 1,671,984 1.09
226,872 Vanguard International Semi 519,398 0.3479,480 Walsin Technology Corp 1,087,071 0.7188,794 Win Semiconductors Corp 639,267 0.42
740,387 Winbond Electronics Corp 473,541 0.31647,212 Wistron Corp 480,816 0.31406,628 WPG Holdings Ltd 576,162 0.38
49,871 Yageo Corporation 1,840,198 1.202,502,698 Yuanta Financial Holding Co 1,141,004 0.75
101,380 Zhen Ding Technology Holding 224,118 0.15
Total listed equity 151,153,644 98.93
Futures (0.01%)
Taiwan (0.01%)30 MSCI Taiwan Index Futures Jul 2018 7,690 0.01
Total futures 7,690 0.01
Unlisted Rights (0.00%)
Taiwan (0.00%)84,667 Cathay Financial Holding Co – Rights 0 0.00
Total unlisted rights (0.00%) 0 0.00
Total investments 151,161,334 98.94Other net assets 1,621,695 1.06
Net assets attributable to
unitholders at 30th June 2018 152,783,029 100.00
Total investments, at cost 155,498,034

116 iShares Asia Trust
% of net asset value 30th June
2018
% of net asset value
31st December 2017
Financial assets at fair value through profit or lossListed equitiesConsumer Discretionary 2.62 2.88Consumer Staples 3.18 2.88Energy 0.81 0.85Financials 16.46 15.81Health Care 0.27 0.16Industrials 2.07 2.25Information Technology 59.09 62.11Materials 10.17 8.71Real Estate 0.39 0.36Telecommunication Services 3.87 3.91
98.93 99.92 FuturesMSCI Taiwan Index Futures Jul 2018 0.01 –
0.01 – Unlisted RightsCathay Financial Holding Co – Rights 0.00 –
0.00 – Total investments 98.94 99.92Other net assets 1.06 0.08 Net assets attributable to unitholders 100.00 100.00
iShares Core MSCI Taiwan Index ETF Statement of Movements in Investment Portfolio (unaudited) For the period ended 30th June 2018

Semi-annual Report 117
iShares Core MSCI Taiwan Index ETF Performance Record (unaudited)
Net Asset Value
DealingNet asset value
per unitUS$
DealingNet asset value
of the Sub-FundUS$
At end of financial period dated31st December 2016 1.13 19,839,60831st December 2017 1.41 31,334,46530th June 2018 1.39 152,783,029
Highest and lowest net asset value per unit
Highest net assetvalue per unit
US$
Lowest net assetvalue per unit
US$
Financial period ended31st December 2016 (since inception) 1.20 1.0131st December 2017 1.45 1.1330th June 2018 1.54 1.36

118 iShares Asia Trust
iShares DAX Index ETF Investment Portfolio (unaudited) as at 30th June 2018
HoldingsFair value
EUR
% ofNet
Assets
Investments (99.82%)
Listed equities (99.82%)
Germany (99.82%)501 Adidas AG 93,662 3.53
1,189 Allianz Se – Reg 210,477 7.932,554 BASF SE 209,198 7.882,372 Bayer AG – Reg 223,798 8.43
894 Bayerische Motoren Werke AG 69,401 2.61264 Beiersdorf AG 25,671 0.97
2,694 Commerzbank AG 22,120 0.83297 Continental AG 58,078 2.19505 Covestro AG 38,592 1.45
2,470 Daimler AG – Registered Shares 136,171 5.135,259 Deutsche Bank AG – Registered 48,498 1.83
508 Deutsche Boerse AG 57,988 2.181,277 Deutsche Lufthansa – Reg 26,306 0.992,602 Deutsche Post AG – Reg 72,778 2.748,997 Deutsche Telekom AG – Reg 119,390 4.505,956 E.On SE 54,521 2.05
587 Fresenius Medical Care AG 50,705 1.911,132 Fresenius SE & Co KGaA 77,882 2.93
412 Heidelbergcement AG 29,697 1.12473 Henkel AG & Co KGaA Vorzug 51,794 1.95
3,126 Infineon Technologies AG 68,241 2.57474 Linde AG – Tender 96,886 3.65348 Merck KGaA 29,100 1.09420 Muenchener Rueckver AG – Reg 76,041 2.86
1,460 RWE AG 28,507 1.072,703 Sap SE 267,462 10.072,249 Siemens AG – Reg 254,632 9.591,325 Thyssenkrupp AG 27,587 1.04
501 Volkswagen AG – Pref 71,252 2.681,334 Vonovia SE 54,374 2.05
Total investments 2,650,809 99.82Other net assets 4,703 0.18
Net assets attributable to
unitholders at 30th June 2018 2,655,512 100.00
Total investments, at cost 2,374,288

Semi-annual Report 119
iShares DAX Index ETF Statement of Movements in Investment Portfolio (unaudited) For the period ended 30th June 2018
% of net asset value 30th June
2018
% of net asset value
31st December 2017
Financial assets at fair value through profit or lossListed equitiesConsumer Discretionary 16.14 18.37Consumer Staples 2.92 2.78Financials 15.63 16.53Health Care 14.36 13.59Industrials 13.32 14.06Information Technology 12.64 11.91Materials 15.14 13.74Real Estate 2.05 1.79Telecommunication Services 4.50 4.59Utilities 3.12 2.72 Total investments 99.82 100.08Other net assets/(liabilities) 0.18 (0.08) Net assets attributable to unitholders 100.00 100.00

120 iShares Asia Trust
iShares DAX Index ETF Performance Record (unaudited)
Net Asset Value
DealingNet asset value
per unitEUR
DealingNet asset value
of the Sub-FundEUR
At end of financial period dated31st December 2016 1.05 6,072,55231st December 2017 1.17 2,802,99630th June 2018 1.11 2,655,512
Highest and lowest net asset value per unit
Highest net assetvalue per unit
EUR
Lowest net assetvalue per unit
EUR
Financial period ended31st December 2016 (since inception) 1.05 0.8531st December 2017 1.22 1.0530th June 2018 1.23 1.06

Semi-annual Report 121
iShares EURO STOXX 50 Index ETF Investment Portfolio (unaudited) as at 30th June 2018
HoldingsFair value
EUR
% ofNet
Assets
Investments (99.88%)
Listed equities (99.88%)
Belgium (2.81%)1,070 Anheuser-Busch Inbev SA/NV 92,555 2.81
92,555 2.81
Finland (1.19%)
7,988 Nokia OYJ 39,381 1.19
39,381 1.19
France (38.12%)594 Air Liquide SA 63,974 1.94809 Airbus SE 81,110 2.46
2,930 AXA SA 61,574 1.871,625 BNP Paribas 86,434 2.62
778 Compagnie De Saint Gobain 29,774 0.90882 Danone 55,451 1.68
2,565 Engie 33,679 1.02300 Essilor International 36,270 1.10347 L’Oreal 73,391 2.22382 LVMH Moet Hennessy Louis Vui 108,946 3.30
2,843 Orange 40,783 1.24509 Safran SA 52,961 1.60
1,597 Sanofi 109,634 3.32774 Schneider Electric SE 55,279 1.68
1,128 Societe Generale SA 40,738 1.233,746 Total SA 195,579 5.93
195 Unibail – Rodamco – Westfield 36,767 1.11787 Vinci SA 64,817 1.96
1,476 Vivendi 30,996 0.94
1,258,157 38.12
Germany (31.63%)254 Adidas AG 47,485 1.44620 Allianz SE – Reg 109,752 3.32
1,302 BASF SE 106,647 3.231,311 Bayer AG – Reg 123,693 3.75
459 Bayerische Motoren Werke AG 35,632 1.081,245 Daimler AG – Registered Shares 68,637 2.082,602 Deutsche Bank AG – Registered 23,996 0.731,356 Deutsche Post AG – Reg 37,927 1.154,606 Deutsche Telekom AG – Reg 61,122 1.853,077 E.On SE 28,167 0.85
589 Fresenius SE & Co KGaA 40,523 1.23216 Muenchener Rueckver AG – Reg 39,107 1.18
1,519 Sap SE 150,305 4.551,191 Siemens AG – Reg 134,845 4.09
255 Volkswagen AG – Pref 36,266 1.10
1,044,104 31.63
Ireland (1.10%)1,200 CRH Plc 36,420 1.10
36,420 1.10
Italy (4.85%)
11,023 Enel Spa 52,436 1.593,591 Eni Spa 57,119 1.73
20,377 Intesa Sanpaolo 50,667 1.53
160,222 4.85
HoldingsFair value
EUR
% ofNet
Assets
Netherlands (10.80%)609 ASML Holding NV 103,347 3.13
5,429 ING Groep NV 66,929 2.031,768 Koninklijke Ahold Delhaize N 36,253 1.101,313 Koninklijke Philips NV 47,826 1.452,136 Unilever NV – CVA 102,069 3.09
356,424 10.80
Spain (9.38%)
9,373 Banco Bilbao Vizcaya Argenta 56,931 1.7222,838 Banco Santander SA 104,872 3.18
8,218 Iberdrola SA 54,436 1.651,560 Industria De Diseno Textil 45,646 1.386,565 Telefonica SA 47,787 1.45
309,672 9.38
Total listed equity 3,296,935 99.88
Unlisted Rights (0.00%)
Italy (0.00%)20,377 Intesa Sanpaolo – Wtdrw Right 0 0.00
0 0.00
Total investments 3,296,935 99.88Other net assets 3,983 0.12
Net assets attributable to
unitholders at 30th June 2018 3,300,918 100.00
Total investments, at cost 2,950,214

122 iShares Asia Trust
iShares EURO STOXX 50 Index ETF Statement of Movements in Investment Portfolio (unaudited) For the period ended 30th June 2018
% of net asset value 30th June
2018
% of net asset value
31st December 2017
Financial assets at fair value through profit or lossListed equitiesConsumer Discretionary 11.32 11.74Consumer Staples 10.90 10.64Energy 7.66 6.29Financials 19.41 22.41Health Care 10.85 10.39Industrials 13.84 13.67Information Technology 8.87 7.18Materials 6.27 6.43Real Estate 1.11 0.89Telecommunication Services 4.54 4.76Utilities 5.11 5.14
99.88 99.54 Unlisted rightsFinancials 0.00 –
0.00 – Total investments 99.88 99.54Other net assets 0.12 0.46 Net assets attributable to unitholders 100.00 100.00

Semi-annual Report 123
iShares EURO STOXX 50 Index ETF Performance Record (unaudited)
Net Asset Value
DealingNet asset value
per unitEUR
DealingNet asset value
of the Sub-FundEUR
At end of financial period dated31st December 2016 1.02 5,100,86831st December 2017 1.11 3,334,91730th June 2018 1.10 3,300,918
Highest and lowest net asset value per unit
Highest net assetvalue per unit
EUR
Lowest net assetvalue per unit
EUR
Financial period ended31st December 2016 (since inception) 1.02 0.8331st December 2017 1.17 1.0130th June 2018 1.17 1.04

124 iShares Asia Trust
iShares FTSE 100 Index ETF Investment Portfolio (unaudited) as at 30th June 2018
HoldingsFair value
GBP
% ofNet
Assets
Investments (99.12%)
Listed equities (99.11%)
Australia (2.43%)1,415 Rio Tinto Plc 59,444 2.43
59,444 2.43
Chile (0.16%)
403 Antofagasta Plc 3,990 0.16
3,990 0.16
Germany (0.36%)533 Tui Ag – Di 8,861 0.36
8,861 0.36
Ireland (2.97%)
1,020 CRH Plc 27,285 1.12104 DCC Plc 7,171 0.29
1,151 Experian Plc 21,575 0.8897 Paddy Power Betfair Plc 8,051 0.33
280 Smurfit Kappa Group Plc 8,585 0.35
72,667 2.97
Isle of Man (0.29%)672 GVC Holdings Plc 7,063 0.29
7,063 0.29
Mali (0.29%)
120 Randgold Resources Ltd 6,984 0.29
6,984 0.29
Mexico (0.09%)195 Fresnillo Plc 2,230 0.09
2,230 0.09
Netherlands (11.19%)
5,636 Royal Dutch Shell Plc – A Shs 148,170 6.064,622 Royal Dutch Shell Plc – B Shs 125,418 5.13
273,588 11.19
Russian Federation (0.12%)
589 Evraz Plc 2,994 0.12
2,994 0.12
South Africa (0.83%)1,190 Anglo American Plc 20,168 0.83
20,168 0.83
Switzerland (3.09%)
248 Coca-Cola HBC AG – Di 6,277 0.25289 Ferguson Plc 17,774 0.73
14,226 Glencore Plc 51,498 2.11
75,549 3.09
United Arab Emirates (0.14%)98 NMC Health Plc 3,510 0.14
3,510 0.14
HoldingsFair value
GBP
% ofNet
Assets
United Kingdom (77.15%)1,125 3I Group Plc 10,132 0.41
234 Admiral Group Plc 4,464 0.18591 Ashtead Group Plc 13,433 0.55452 Associated British Foods Plc 12,376 0.51
1,556 Astrazeneca Plc 81,737 3.344,843 Aviva Plc 24,409 1.003,864 BAE Systems Plc 24,992 1.02
21,018 Barclays Plc 39,724 1.621,164 Barratt Developments Plc 5,999 0.25
150 Berkeley Group Holdings/The 5,677 0.232,529 BHP Billiton Plc 43,145 1.76
24,077 BP Plc 139,237 5.702,792 British American Tobacco Plc 106,934 4.371,211 British Land Co Plc 8,140 0.33
10,486 BT Group Plc 22,838 0.93397 Bunzl Plc 9,111 0.37531 Burberry Group Plc 11,470 0.47214 Carnival Plc 9,303 0.38
6,752 Centrica Plc 10,645 0.441,918 Compass Group Plc 31,043 1.27
155 Croda International Plc 7,443 0.302,990 Diageo Plc 81,388 3.331,858 Direct Line Insurance Group 6,371 0.261,197 DS Smith Plc 6,239 0.25
286 Easyjet Plc 4,785 0.206,009 Glaxosmithkline Plc 91,926 3.76
457 Halma Plc 6,261 0.26332 Hargreaves Lansdown Plc 6,545 0.27
24,662 HSBC Holdings Plc 175,273 7.171,176 Imperial Brands Plc 33,187 1.361,521 Informa Plc 12,700 0.52
227 Intercontinental Hotels Grou 10,714 0.44201 Intertek Group Plc 11,489 0.47
1,989 Intl Consolidated Airline – Di 13,207 0.544,824 ITV Plc 8,394 0.34
254 Johnson Matthey Plc 9,192 0.38695 Just Eat Plc 5,414 0.22
2,613 Kingfisher Plc 7,761 0.32835 Land Securities Group Plc 7,990 0.33
7,105 Legal & General Group Plc 18,899 0.7788,316 Lloyds Banking Group Plc 55,683 2.28
387 London Stock Exchange Group 17,303 0.711,859 Marks & Spencer Group Plc 5,486 0.225,335 Melrose Industries Plc 11,348 0.46
516 Micro Focus International 6,829 0.28436 Mondi Plc 8,942 0.37
4,139 National Grid Plc 34,701 1.42169 Next Plc 10,225 0.42671 Ocado Group Plc 6,895 0.28949 Pearson Plc 8,399 0.34397 Persimmon Plc 10,056 0.41
3,152 Prudential Plc 54,671 2.24767 Reckitt Benckiser Group Plc 47,853 1.96
1,267 Relx Plc 20,557 0.842,177 Rentokil Initial Plc 7,637 0.31
100 Rightmove Plc 5,310 0.221,994 Rolls-Royce Holdings Plc 19,705 0.815,519 Royal Bank of Scotland Group 14,134 0.581,113 Royal Mail Plc 5,625 0.231,277 RSA Insurance Group Plc 8,676 0.351,385 Sage Group Plc/The 8,706 0.362,191 Sainsbury (J) Plc 7,037 0.29
130 Schroders Plc 4,105 0.171,748 Scottish Mortgage Inv Tr Plc 9,264 0.381,202 Segro Plc 8,046 0.33
273 Severn Trent Plc 5,404 0.221,104 Shire Plc 47,086 1.931,251 Sky Plc 18,283 0.75

Semi-annual Report 125
iShares FTSE 100 Index ETF (continued)
Investment Portfolio (unaudited) as at 30th June 2018
HoldingsFair value
GBP
% ofNet
Assets
United Kingdom (77.15%) Continued
1,055 Smith & Nephew Plc 14,749 0.60515 Smiths Group Plc 8,745 0.36
1,239 SSE Plc 16,788 0.69633 St James’s Place Plc 7,264 0.30
3,272 Standard Chartered Plc 22,662 0.933,245 Standard Life Aberdeen Plc 10,569 0.433,744 Taylor Wimpey Plc 6,698 0.27
12,104 Tesco Plc 31,071 1.271,425 Unilever Plc 59,736 2.44
892 United Utilities Group Plc 6,808 0.2832,874 Vodafone Group Plc 60,429 2.47
214 Whitbread Plc 8,472 0.352,483 WM Morrison Supermarkets 6,257 0.261,476 WPP Plc 17,609 0.72
1,885,810 77.15
Total listed equity 2,422,858 99.11
Unlisted equities (0.01%)
United Kingdom (0.01%)141,574 Rolls-Royce Holdings – Entitl 142 0.01
Total unlisted equity 142 0.01
Total investments 2,423,000 99.12Other net assets 21,425 0.88
Net assets attributable to
unitholders at 30th June 2018 2,444,425 100.00
Total investments, at cost 2,054,305

126 iShares Asia Trust
iShares FTSE 100 Index ETF Statement of Movements in Investment Portfolio (unaudited) For the period ended 30th June 2018
% of net asset value 30th June
2018
% of net asset value
31st December 2017
Financial assets at fair value through profit or lossListed equitiesConsumer Discretionary 8.96 8.38Consumer Staples 16.04 17.14Energy 16.89 15.41Financials 20.05 21.60Health Care 9.77 9.01Industrials 8.06 7.06Information Technology 1.34 1.88Materials 10.56 10.25Real Estate 0.99 1.19Telecommunication Services 3.40 4.28Utilities 3.05 3.09
99.11 99.29 Unlisted equitiesIndustrials 0.01 0.01
0.01 0.01 Total investments 99.12 99.30Other net assets 0.88 0.70 Net assets attributable to unitholders 100.00 100.00

Semi-annual Report 127
iShares FTSE 100 Index ETF Performance Record (unaudited)
Net Asset Value
DealingNet asset value
per unitGBP
DealingNet asset value
of the Sub-FundGBP
At end of financial period dated31st December 2016 0.83 3,988,72431st December 2017 0.93 3,522,98930th June 2018 0.94 2,444,425
Highest and lowest net asset value per unit
Highest net assetvalue per unit
GBP
Lowest net assetvalue per unit
GBP
Financial period ended31st December 2016 (since inception) 0.83 0.6931st December 2017 0.93 0.8330th June 2018 0.96 0.84

128 iShares Asia Trust
iShares NASDAQ 100 Index ETF Investment Portfolio (unaudited) as at 30th June 2018
HoldingsFair value
US$
% ofNet
Assets
Investments (99.91%)
Listed equities (99.91%)
Argentina (0.17%)65 Mercadolibre Inc 19,431 0.17
19,431 0.17
China (1.78%)
408 Baidu Inc – Spon ADR 99,144 0.84652 Ctrip.com International – ADR 31,055 0.26
1,355 JD.com Inc – ADR 52,777 0.45105 Netease Inc – ADR 26,530 0.23
209,506 1.78
Ireland (0.20%)
420 Seagate Technology 23,717 0.20
23,717 0.20
Israel (0.20%)245 Check Point Software Tech 23,932 0.20
23,932 0.20
Netherlands (0.17%)
104 ASML Holding NV – NY Reg Shs 20,589 0.17
20,589 0.17
United Kingdom (0.63%)420 Liberty Global Plc – A 11,567 0.10945 Liberty Global Plc – C 25,146 0.21119 Shire Plc – ADR 20,087 0.17700 Vodafone Group Plc – SP ADR 17,017 0.15
73,817 0.63
United States (96.76%)
1,098 Activision Blizzard Inc 83,799 0.71723 Adobe Systems Inc 176,275 1.50315 Alexion Pharmaceuticals Inc 39,107 0.33115 Align Technology Inc 39,346 0.33444 Alphabet Inc – Cl A 501,360 4.26517 Alphabet Inc – Cl C 576,791 4.90713 Amazon.com Inc 1,211,957 10.31748 American Airlines Group Inc 28,394 0.24986 Amgen Inc 182,006 1.55531 Analog Devices Inc 50,934 0.43
7,254 Apple Inc 1,342,788 11.421,540 Applied Materials Inc 71,133 0.61
315 Autodesk Inc 41,293 0.35665 Automatic Data Processing 89,203 0.76315 Biogen Inc 91,426 0.78245 Biomarin Pharmaceutical Inc 23,079 0.20
70 Booking Holdings Inc 141,896 1.21604 Broadcom Inc 146,555 1.25595 CA Inc 21,212 0.18411 Cadence Design Sys Inc 17,800 0.15
1,071 Celgene Corp 85,059 0.72490 Cerner Corp 29,297 0.25359 Charter Communications Inc – A 105,262 0.90151 Cintas Corp 27,946 0.24
6,931 Cisco Systems Inc 298,241 2.54210 Citrix Systems Inc 22,016 0.19875 Cognizant Tech Solutions – A 69,116 0.59
6,867 Comcast Corp – Class A 225,306 1.92644 Costco Wholesale Corp 134,583 1.14
1,291 CSX Corp 82,340 0.70350 Dentsply Sirona Inc 15,319 0.13315 Dish Network Corp – A 10,587 0.09
HoldingsFair value
US$
% ofNet
Assets
United States (96.76%) Continued350 Dollar Tree Inc 29,750 0.25
1,478 Ebay Inc 53,592 0.46458 Electronic Arts Inc 64,587 0.55210 Expedia Inc 25,240 0.21825 Express Scripts Holding Co 63,698 0.54
3,546 Facebook Inc – A 689,059 5.86420 Fastenal Co 20,215 0.17630 Fiserv Inc 46,677 0.40
1,890 Gilead Sciences Inc 133,888 1.14178 Hasbro Inc 16,431 0.14241 Henry Schein Inc 17,506 0.15398 Hologic Inc 15,820 0.13163 Hunt (JB) Transport Svcs Inc 19,813 0.17129 IDEXX Laboratories Inc 28,114 0.24210 Illumina Inc 58,651 0.50315 Incyte Corp 21,105 0.18
6,870 Intel Corp 341,508 2.90379 Intuit Inc 77,432 0.66168 Intuitive Surgical Inc 80,385 0.68230 KLA – Tencor Corp 23,582 0.20
1,795 Kraft Heinz Co/The 112,762 0.96239 Lam Research Corp 41,311 0.35503 Marriott International – Cl A 63,680 0.54420 Maxim Integrated Products 24,637 0.21335 Microchip Technology Inc 30,468 0.26
1,688 Micron Technology Inc 88,519 0.7511,345 Microsoft Corp 1,118,730 9.51
2,205 Mondelez International Inc – A 90,405 0.77840 Monster Beverage Corp 48,132 0.41735 Mylan NV 26,563 0.23637 Netflix Inc 249,341 2.12897 Nvidia Corp 212,499 1.81126 O’Reilly Automotive Inc 34,470 0.29490 Paccar Inc 30,360 0.26525 Paychex Inc 35,884 0.31
1,757 Paypal Holdings Inc 146,305 1.242,148 Qualcomm Inc 120,546 1.03
630 Qurate Retail Inc 13,369 0.11154 Regeneron Pharmaceuticals 53,128 0.45560 Ross Stores Inc 47,460 0.40
6,535 Sirius XM Holdings Inc 44,242 0.38280 Skyworks Solutions Inc 27,062 0.23
1,997 Starbucks Corp 97,553 0.83875 Symantec Corp 18,069 0.15217 Synopsys Inc 18,569 0.16167 Take-Two Interactive Software 19,766 0.17245 Tesla Inc 84,023 0.71
1,435 Texas Instruments Inc 158,209 1.351,254 T-Mobile US Inc 74,926 0.641,575 Twenty-First Century Fox – A 78,262 0.671,155 Twenty-First Century Fox – B 56,907 0.48
84 Ulta Beauty Inc 19,611 0.17245 Verisk Analytics Inc 26,372 0.22377 Vertex Pharmaceuticals Inc 64,075 0.54
1,437 Walgreens Boots Alliance Inc 86,242 0.73430 Western Digital Corp 33,286 0.28200 Workday Inc – A 24,224 0.21163 Wynn Resorts Ltd 27,276 0.23350 Xilinx Inc 22,841 0.19
11,378,563 96.76
Total investments 11,749,555 99.91Other net assets 10,190 0.09
Net assets attributable to
unitholders at 30th June 2018 11,759,745 100.00
Total investments, at cost 8,078,185

Semi-annual Report 129
iShares NASDAQ 100 Index ETF Statement of Movements in Investment Portfolio (unaudited) For the period ended 30th June 2018
% of net asset value 30th June
2018
% of net asset value
31st December 2017
Financial assets at fair value through profit or lossListed equitiesConsumer Discretionary 22.98 20.79Consumer Staples 4.01 4.75Health Care 9.24 10.20Industrials 2.00 2.23Information Technology 60.89 60.87Telecommunication Services 0.79 0.89 Total investments 99.91 99.73Other net assets 0.09 0.27 Net assets attributable to unitholders 100.00 100.00

130 iShares Asia Trust
iShares NASDAQ 100 Index ETF Performance Record (unaudited)
Net Asset Value
DealingNet asset value
per unitUS$
DealingNet asset value
of the Sub-FundUS$
At end of financial period dated31st December 2016 1.15 7,845,92931st December 2017 1.52 9,141,41230th June 2018 1.68 10,079,745
Highest and lowest net asset value per unit
Highest net assetvalue per unit
US$
Lowest net assetvalue per unit
US$
Financial period ended31st December 2016 (since inception) 1.18 0.9931st December 2017 1.55 1.1730th June 2018 1.74 1.50

Semi-annual Report 131
iShares Core Hang Seng Index ETF Investment Portfolio (unaudited) as at 30th June 2018
HoldingsFair value
HK$
% ofNet
Assets
Investments (99.07%)
Listed equities (99.07%)
China (71.80%)23,104 AAC Technologies Holdings In 2,552,992 0.87
382,720 AIA Group Ltd 26,254,592 8.932,517,615 Bank of China Ltd – H 9,793,522 3.33
278,680 Bank of Communications Co – H 1,674,867 0.5743,937 Bank of East Asia Ltd 1,377,425 0.47
117,159 BOC Hong Kong Holdings Ltd 4,329,025 1.473,047,330 China Construction Bank – H 22,093,142 7.52
236,780 China Life Insurance Co – H 4,794,795 1.6387,138 China Mengniu Dairy Co 2,317,871 0.7942,320 China Merchants Port Holding 674,581 0.23
194,631 China Mobile Ltd 13,565,781 4.61121,103 China Overseas Land & Invest 3,130,513 1.07807,737 China Petroleum & Chemical – H 5,662,236 1.93
84,476 China Resources Land Ltd 2,234,390 0.7559,778 China Resources Power Holdin 826,132 0.28
108,226 China Shenhua Energy Co – H 2,015,168 0.69232,718 China Unicom Hong Kong Ltd 2,280,636 0.78184,793 Citic Ltd 2,043,811 0.70
60,005 CLP Holdings Ltd 5,070,422 1.72566,018 CNOOC Ltd 7,663,884 2.61237,364 Country Garden Holdings Co 3,275,623 1.11148,000 Cspc Pharmaceutical Group Lt 3,507,600 1.19169,959 Geely Automobile Holdings Lt 3,458,666 1.18
24,329 Hang Seng Bank Ltd 4,773,350 1.6222,779 Hengan Intl Group Co Ltd 1,719,814 0.59
292,273 Hong Kong & China Gas 4,389,940 1.492,338,518 Ind & Comm Bk of China – H 13,727,101 4.67
47,505 MTR Corp 2,061,717 0.70670,647 Petrochina Co Ltd – H 4,003,763 1.36163,921 Ping An Insurance Group Co – H 11,835,096 4.03
77,123 Sands China Ltd 3,235,310 1.1022,538 Sunny Optical Tech 3,290,548 1.1276,270 Tencent Holdings Ltd 30,035,126 10.22
199,566 Want Want China Holdings Ltd 1,392,971 0.47
211,062,410 71.80
Hong Kong (27.27%)82,142 CK Asset Holdings Ltd 5,117,447 1.7485,274 CK Hutchison Holdings Ltd 7,094,797 2.4120,583 CK Infrastructure Holdings L 1,196,901 0.4175,550 Galaxy Entertainment Group L 4,589,662 1.5662,589 Hang Lung Properties Ltd 1,012,690 0.3541,981 Henderson Land Development 1,742,212 0.5937,865 Hong Kong Exchanges & Clear 8,936,140 3.04
403,992 HSBC Holdings Plc 29,733,811 10.1268,166 Link Reit 4,884,094 1.66
184,818 New World Development 2,040,391 0.6943,963 Power Assets Holdings Ltd 2,411,371 0.8293,567 Sino Land Co 1,193,915 0.4141,506 Sun Hung Kai Properties 4,914,310 1.6716,051 Swire Pacific Ltd – Cl A 1,333,838 0.45
282,000 WH Group Ltd 1,801,980 0.6138,945 Wharf Real Estate Investment 2,175,078 0.74
80,178,637 27.27
Total listed equity 291,241,047 99.07
HoldingsFair value
HK$
% ofNet
Assets
Futures (-0.00%)Hong Kong (-0.00%)
6 Mini Hang Seng Index Futures Jul 2018 (8,750) (0.00)
Total futures (8,750) (0.00)
Total investments 291,232,297 99.07Other net assets 2,725,007 0.93
Net assets attributable to
unitholders at 30th June 2018 293,957,304 100.00
Total investments, at cost 243,117,566

132 iShares Asia Trust
iShares Core Hang Seng Index ETF Statement of Movements in Investment Portfolio (unaudited) For the period ended 30th June 2018
% of net asset value 30th June
2018
% of net asset value
31st December 2017
Financial assets at fair value through profit or lossListed equitiesConsumer Discretionary 3.84 4.14Consumer Staples 2.46 2.66Energy 6.59 5.61Financials 47.40 48.66Health Care 1.19 –Industrials 4.04 4.64Information Technology 12.21 11.68Real Estate 11.23 11.87Telecommunication Services 5.39 5.94Utilities 4.72 4.67
99.07 99.87 FuturesMini Hang Seng Index Futures Jul 2018 (0.00) (0.00)
(0.00) (0.00) Total investments 99.07 99.87Other net assets 0.93 0.13 Net assets attributable to unitholders 100.00 100.00

Semi-annual Report 133
iShares Core Hang Seng Index ETF Performance Record (unaudited)
Net Asset Value
DealingNet asset value
per unitHK$
DealingNet asset value
of the Sub-FundHK$
At end of financial period dated31st December 2017 107.43 343,767,15330th June 2018 104.98 293,957,304
Highest and lowest net asset value per unit
Highest net assetvalue per unit
HK$
Lowest net assetvalue per unit
HK$
Financial period ended31st December 2017 (since inception) 110.79 77.5830th June 2018 119.02 102.75

134 iShares Asia Trust
iShares Asia Trust Management and Administration
Directors of the ManagerAndrew Raymond Landman (appointed on 23rd May 2018)Andrew ReynoldsBelinda BoaGraham Douglas TurlRyan David StorkSam Y. Kim (resigned on 4th April 2018)Susan Wai-Lan Chan
Manager BlackRock Asset Management North Asia Limited16/F, Champion Tower3 Garden RoadCentralHong Kong
TrusteeHSBC Institutional Trust Services (Asia) Limited1 Queen’s Road CentralHong Kong
Registrar for all Sub-Funds (excluding MSCI China ETF)HSBC Institutional Trust Services (Asia) Limited1 Queen’s Road CentralHong Kong
Custodian (excluding MSCI China A ETF, A50 China ETF and CSI 300 ETF)
HSBC Institutional Trust Services (Asia) Limited1 Queen’s Road CentralHong Kong
Custodian for MSCI China A ETF, A50 China ETF .and CSI 300 ETF only
The Hongkong and Shanghai Banking Corporation Limited1 Queen’s Road CentralHong Kong
QFII CustodianCitibank (China) Co., LimitedCitigroup TowerNo.33, Hua Yuan Shi Qiao RoadLu Jia Zui Finance and Trade AreaShanghai 200120 PRC
QFII Licence Holder for A50 China ETFBlackRock Asset Management North Asia Limited16/F, Champion Tower3 Garden RoadCentralHong Kong
RQFII CustodianHSBC Bank (China) Company Limited33th Floor, HSBC Building, Shanghai IFC8 Century Avenue, Pudong DistrictShanghai 200120 PRC
RQFII Licence Holder for MSCI China A ETFBlackRock Advisors (UK) Limited12 Throgmorton AvenueLondon EC2N 2DL United Kingdom
Registrar for MSCI China ETFHong Kong Registrars Limited17th Floor Hopewell Centre183 Queen’s Road East, Wan ChaiHong Kong
RQFII Licence Holder for A50 China ETFBlackRock Asset Management North Asia Limited16/F, Champion Tower3 Garden RoadCentralHong Kong
Conversion Agent for MSCI China ETFHK Conversion Agency Services Limited12th FloorOne International Finance Centre1 Harbour View StreetCentralHong Kong
RQFII Licence Holder for A50 China ETF and CSI 300 ETFBlackRock (Singapore) Limited#18-01, Twenty Anson20 Anson Road,Singapore 079912
AuditorPricewaterhouseCoopers22nd FloorPrince’s BuildingCentralHong Kong
Service Agent for all Sub-Funds (excluding MSCI China ETF)HK Conversion Agency Services Limited12th FloorOne International Finance Centre1 Harbour View StreetCentralHong Kong

This page is intentionally blank