Sem group earnings-presentation-1q-2017-final
32
First Quarter 2017 Results Earnings Conference Call May 5, 2017
-
Upload
semgroupcorporation -
Category
Investor Relations
-
view
226 -
download
2
Transcript of Sem group earnings-presentation-1q-2017-final

First Quarter2017 ResultsEarnings Conference Call
May 5, 2017

First Quarter 2017 Results
Non-GAAP Financial MeasuresSemGroup’s non-GAAP measure, Adjusted EBITDA, is not a GAAP measure and is not intended to be used in lieu of GAAP presentation of net income (loss),which is the most closely associated GAAP measure. Adjusted EBITDA represents earnings before interest, taxes, depreciation and amortization, adjusted forselected items that SemGroup believes impact the comparability of financial results between reporting periods. In addition to non-cash items, we have selecteditems for adjustment to EBITDA which management feels decrease the comparability of our results among periods. These items are identified as those whichare generally outside of the results of day to day operations of the business. These items are not considered non-recurring, infrequent or unusual, but do erodecomparability among periods in which they occur with periods in which they do not occur or occur to a greater or lesser degree. Historically, we have selecteditems such as gains on the sale of NGL Energy Partners LP common units, costs related to our predecessor’s bankruptcy, significant business developmentrelated costs, significant legal settlements, severance and other similar costs. Management believes these types of items can make comparability of the resultsof day to day operations among periods difficult and have chosen to remove these items from our Adjusted EBITDA. We expect to adjust for similar types ofitems in the future. Although we present selected items that we consider in evaluating our performance, you should be aware that the items presented do notrepresent all items that affect comparability between the periods presented. Variations in our operating results are also caused by changes in volumes, prices,mechanical interruptions and numerous other factors. We do not adjust for these types of variances.
This measure may be used periodically by management when discussing our financial results with investors and analysts and is presented as managementbelieves it provides additional information and metrics relative to the performance of our businesses. This non-GAAP financial measure has important limitationsas an analytical tool because it excludes some, but not all, items that affect the most directly comparable GAAP financial measures. You should not considernon-GAAP measures in isolation or as substitutes for analysis of our results as reported under GAAP. Management compensates for the limitations of our non-GAAP measures as analytical tools by reviewing the comparable GAAP measures, understanding the differences between the non-GAAP measure and themost comparable GAAP measure and incorporating this knowledge into its decision-making processes. We believe that investors benefit from having access tothe same financial measures that our management uses in evaluating our operating results. Because all companies do not use identical calculations, ourpresentations of non-GAAP measures may be different from similarly titled measures of other companies, thereby diminishing their utility.
SemGroup does not provide guidance for net income, the GAAP financial measure most directly comparable to the non-GAAP financial measure AdjustedEBITDA, because Net Income includes items such as unrealized gains or losses on derivative activities or similar items which, because of their nature, cannotbe accurately forecasted. We do not expect that such amounts would be significant to Adjusted EBITDA as they are largely non-cash items.
2

First Quarter 2017 Results
Certain matters contained in this presentation include "forward-looking statements" within the meaning of Section 27A of the Securities Act of 1933, as amended,and Section 21E of the Securities Exchange Act of 1934, as amended. We make these forward-looking statements in reliance on the safe harbor protectionsprovided under the Private Securities Litigation Reform Act of 1995.
All statements, other than statements of historical fact, included in this presentation including the prospects of our industry, our anticipated financial performance,our anticipated annual dividend growth rate, management's plans and objectives for future operations, planned capital expenditures, business prospects, outcomeof regulatory proceedings, market conditions and other matters, may constitute forward-looking statements. Although we believe that the expectations reflected inthese forward-looking statements are reasonable, we cannot assure you that these expectations will prove to be correct. These forward-looking statements aresubject to certain known and unknown risks and uncertainties, as well as assumptions that could cause actual results to differ materially from those reflected inthese forward-looking statements. Factors that might cause actual results to differ include, but are not limited to, the failure to realize the anticipated benefits of thetransaction, consummated on September 30, 2016, pursuant to which we acquired all of the outstanding common units of our subsidiary, Rose Rock Midstream,L.P., not already owned by us; our ability to generate sufficient cash flow from operations to enable us to pay our debt obligations and our current and expecteddividends or to fund our other liquidity needs; any sustained reduction in demand for, or supply of, the petroleum products we gather, transport, process, market andstore; the effect of our debt level on our future financial and operating flexibility, including our ability to obtain additional capital on terms that are favorable to us; ourability to access the debt and equity markets, which will depend on general market conditions and the credit ratings for our debt obligations and equity; the loss of,or a material nonpayment or nonperformance by, any of our key customers; the amount of cash distributions, capital requirements and performance of ourinvestments and joint ventures; the amount of collateral required to be posted from time to time in our commodity purchase, sale or derivative transactions; theimpact of operational and developmental hazards and unforeseen interruptions; our ability to obtain new sources of supply of petroleum products; competition fromother midstream energy companies; our ability to comply with the covenants contained in our credit agreement and the indentures governing our senior notes,including requirements under our credit agreement to maintain certain financial ratios; our ability to renew or replace expiring storage, transportation and relatedcontracts; the overall forward markets for crude oil, natural gas and natural gas liquids; the possibility that the construction or acquisition of new assets may notresult in the corresponding anticipated revenue increases; changes in currency exchange rates; weather and other natural phenomena, including climate conditions;a cyber attack involving our information systems and related infrastructure, or that of our business associates; the risks and uncertainties of doing business outsideof the U.S., including political and economic instability and changes in local governmental laws, regulations and policies; costs of, or changes in, laws andregulations and our failure to comply with new or existing laws or regulations, particularly with regard to taxes, safety and protection of the environment; thepossibility that our hedging activities may result in losses or may have a negative impact on our financial results; general economic, market and business conditions;as well as other risk factors discussed from time to time in our each of our documents and reports filed with the SEC.
Readers are cautioned not to place undue reliance on any forward-looking statements contained in this presentation which reflect management's opinions only as ofthe date hereof. Except as required by law, we undertake no obligation to revise or publicly release the results of any revision to any forward-looking statements.
We use our Investor Relations website and social media outlets as channels of distribution of material company information. Such information is routinely postedand accessible on our Investor Relations website at ir.semgroupcorp.com.
We are present on Twitter and LinkedIn, follow us at the links below:SemGroup Twitter and LinkedIn
Forward-Looking Information
3

First Quarter 2017 Results
SemGroup Corporation
(in millions, unaudited) 1Q 2017 4Q 2016 2017 Guidance
Adjusted EBITDA(1) $60.7 $66.2 $270 - $310 million
First Quarter 2017 Results
4 1) Non-GAAP Financial Data Reconciliations are included in the Appendix to this presentation
First Quarter Adjusted EBITDA ResultsÑ SemCAMS - up over 70% due to absence of 4Q 2016 producer concession fee & higher volumesÑ Crude Facilities - down nearly $5 million due to absence of 4Q 2016 take or pay adjustmentÑ Crude Supply & Logistics - down due to timing of inventory costing, expected to turn around during 2Q 2017
Full Year HighlightsÑ Reaffirm 2017 Adjusted EBITDA guidance of $270 to $310 million Ñ Based on current outlook, expected annualized 4Q 2017 Adj EBITDA run rate of $325 to $340 million Ñ Targeting 8% dividend CAGR through 2020 and expect to recommend a 6% to 10% annualized dividend increase in December 2017Ñ Maurepas Pipeline construction completion expected late 2Q 2017Ñ Announced SemGas Canton Pipeline project to capture STACK play volumes

First Quarter 2017 Results
Key Committed Projects
Crude Projects• Maurepas Pipeline ~ completion late 2Q 2017: $180 million• Cushing 20" Pipeline ~ completion 4Q 2017: $35 million• STACK Crude Pipeline ~ completion 4Q 2017: $30 million(1)
Natural Gas Projects• Wapiti Sour Gas Plant ~ completion mid-2019: $80 million• KA Plant projects: $25 million • N. Oklahoma gathering projects: $20 million• SemGas STACK Canton Pipeline ~ completion 4Q 2017: $60 million
Maurepas Pipeline
Crude
Natural Gas
Other Growth Projects
Maintenance
$18036%
$6513%
$18537%
$102%
$6012%
2017 Capital Expenditure Guidance
5 1) Reflects SemGroup's 50% of capital contributions to the joint venture
$500 million to Strategic Crude and Natural Gas Projects

First Quarter 2017 Results
SemGas STACK Pipeline Project
Canton Pipeline Ñ 24-inch diameter natural gas pipeline, ~50 miles long
Ñ Originates from SemGroup’s Rose Valley gasprocessing facility in Woods County and extends tonorth central Blaine County
Ñ Expected to be in service by year-end 2017
Ñ Backed by a long-term, firm commitment from aninvestment-grade counterparty
Ñ Initial capacity of 200 mmcf/d, and could be expandedup to 400 mmcf/d by adding compression, to serveother producers in the area
6
Provides significant operational synergies with our existing assets

First Quarter 2017 Results
Key Projects Update
Ñ Maurepas Pipeline• All field welds expected to be complete in May • On budget and expected construction completion late 2Q 2017
Ñ STACK Crude Pipeline• Acquired over 90% of right of way • Begun tank construction at Omega and Ruby stations • Pipe to be delivered in June• Expected completion 4Q 2017
Ñ Wapiti Gas Plant• Long-lead time equipment ordered• Site work progressing• Expected completion mid-2019
7

First Quarter 2017 Results
1Q 2017 Results
Segment Adjusted EBITDA(in millions, unaudited) 1Q 2017 4Q 2016Crude - Transportation $ 25.7 $ 26.1Crude - Facilities 9.0 13.9Crude - Supply and Logistics (3.5) (1.9)SemGas 16.1 16.9SemCAMS 12.5 7.3SemLogistics 3.9 3.3SemMaterials Mexico 2.0 3.7Corporate and Other (5.0) (3.1)
SemGroup $ 60.7 $ 66.2
SemGroup CorporationAs Reported (in millions, excluding EPS, unaudited) 1Q 2017 4Q 2016
Net income (loss) attributable to SemGroup $ (10.3) $ 12.0
Net income (loss) per share - diluted $ (0.16) $ 0.18
EBITDA(1) $ 28.3 $ 61.4
Selected Non-Cash Items and Other Items Impacting Comparability(1) $ 32.4 $ 4.8
Adjusted EBITDA(1) $ 60.7 $ 66.2
Dividend per Share $ 0.45 $ 0.45
81) Non-GAAP Financial Data Reconciliations are included in the Appendix to this presentation

First Quarter 2017 Results
SemGroup Corporation
(in millions, unaudited) March 31, 2017$1 billion revolver - 2021 $90.0
5.625% Senior unsecured notes - 2022 400.05.625% Senior unsecured notes - 2023 350.06.375% Senior unsecured notes - 2025 325.0
Total debt $1,165.0
Compliance leverage ratio(1) 3.6x
Target leverage <4.5x
Liquidity:Cash and cash equivalents(2) $56.6Revolver availability(3) 874.6
Total liquidity $931.2
Leverage and Liquidity
91) Calculated per revolving credit agreement definitions, which includes material project adjustments; maximum total leverage covenant of 5.5x2) Cash excludes SemMaterials Mexico3) Revolver availability is reduced for outstanding letters of credit
Ñ Refinanced 2021 Notes to achievelower borrowing costs and extendedmaturity
Ñ Successfully amended the revolvingcredit facility to lower the pricing grid25 bps
Ñ Targeting compliance leverage ratio of4.5x, based on current outlook expect4Q 2017 compliance leverage to be4.5x to 4.75x, assuming no ATMissuance

First Quarter 2017 Results
Delivering Long-Term Value
10
FinancialDiscipline & Strong
Balance Sheet
High ReturnGrowth Projects &
StrategicAcquisitions
Focus on PortfolioBalance & Secure
Cash Flows
Targeting 8%Dividend CAGR
through 2020
Appendix
11

First Quarter 2017 Results
Guidance Assumptions
Average Commodity Price Assumptions(2)
• Crude Oil: $54/barrel• Natural Gas: $3.40/mmbtu• Natural Gas Liquids: $0.80/gallon
Foreign Exchange Rate Assumptions• Canadian Dollar (CAD/USD): $0.74• British Pound (GBP/USD): $1.25• Mexican Peso (MXN/USD): $0.05
Cash Taxes• Approximately $5 million, related to foreign subs
Operational AssumptionsCrude
• Average Cushing storage rate: $0.33/barrel/month• Maurepas Pipeline: expected completion late 2Q 2017• Transportation volumes(3): 5-10% increase• White Cliffs Pipeline volumes: 100-110k bpd• Glass Mountain Pipeline volumes: 75-80k bpd
SemGas • N. Oklahoma processing volumes: 280-300 mmcf/d
SemCAMS • Processing volumes: 375-400 mmcf/d• K3 plant turnaround scheduled 2Q 2017
Adjusted EBITDA $270 million - $310 million(1)
(in millions)
$400
$300
$200
$1002014 2015 2016 2017E
$287 $305$283
$270 - $310
SemGroup 2017 Guidance
121) Non-GAAP Reconciliations for historical periods are included in the Appendix to this presentation2) Average commodity prices as of January 11, 20173) Transportation volumes excludes Maurepas Pipeline and JV assets (White Cliffs Pipeline and Glass Mountain Pipeline)

First Quarter 2017 Results
Over 70% of SemGroup's revenue is derived frominvestment grade counterparties
Over 90% of total LTM gross margin from fixed fee based cash flows
(1) LTM December 31, 2016(2) Counterparty ratings LTM December 31, 2016; excludes SemLogistics and SemMaterials Mexico
Take or Pay Fixed Fee POP/Marketing
600
500
400
300
200
100
0
($in
mill
ions
)
2014 2015 2016 2017 Investment Grade
Non-Investment Grade
72%
28%51%
38%
11%11%
59%
30%
64%
13%
23%
SemGroup derives a significant portion of its margin from fixed fee contracted arrangements withstrong counterparties; SemGroup is well-positioned to drive future growth
Company Strengths
13 1) LTM March 31, 20172) Counterparty ratings LTM March 31, 2017; excludes SemLogistics and SemMaterials Mexico13
Counterparty Strength(2)Stable Cash Flows(1)
51%
40%
9%

First Quarter 2017 Results
8
6
4
2
0
2016 2017 2018 2019
6.3 6.3 5.8
1.6
1.3 1.3 1.3
1.3
0.5
4.7
n Third-party contracted(1) n Operational / Marketing n Uncontracted
1) Weighted average term of storage contracts2) Volumes on 100% owned pipelines3) Reflects 100% throughput on Joint Venture pipelines
Crude Key Performance MetricsSupply and Logistics Volumes
250200150100
500
(Tho
usan
dB
arre
lspe
rDay
)
1Q 2Q 3Q 4Q 1Q
209.8 198.5 206.7 197.7241.1
Pipelines Field Services
Transportation Volumes
250200150100
500
(Tho
usan
dB
arre
lspe
rDay
)
1Q 2Q 3Q 4Q 1Q
102.4 111.3 104.6 96.4 88.0
93.8
196.2
86.3
197.6
97.1
201.7
99.6
196.0
91.2
179.2
White Cliffs Pipeline Glass Mountain Pipeline
Joint Venture Transportation Volumes
250200150100
500
(Tho
usan
dB
arre
lspe
rDay
)
1Q 2Q 3Q 4Q 1Q
142.3 124.9 114.9 115.0 111.1
58.9201.2
52.5177.4
52.5167.4
58.3173.3
72.5
183.6
Facilities - Cushing Storage 7.6 million Barrels Capacity
14
2016 2017 2016 2017
2016 2017
(2)
(3)

First Quarter 2017 Results
SemCAMS Average Throughput Volume
Natural Gas Key Performance Metrics
K3 Plant KA Plant Capacity
600500400300200100
0
(mm
cf/d
)
1Q 2Q 3Q 4Q 1Q
270.4157.0 253.5 253.7 260.7
114.3384.7
147.1304.1 135.0
388.5143.1396.8
146.9407.6
Capacity Processing Volumes
600500400300200100
0
(mm
cf/d
)
1Q 2Q 3Q 4Q 1Q
325.9 290.6 284.4 284.2 273.6
(1)
15 1) Lower volumes related to an unplanned shutdown at our K3 plant during June 2016
SemGas Northern OK Avg Processed Volume
2016 2017
2016 2017

First Quarter 2017 Results
Consolidated Balance Sheets
(in thousands, unaudited, condensed) March 31, 2017
December 31, 2016
ASSETSCurrent assets $ 672,770 $ 635,874Property, plant and equipment, net 1,834,400 1,762,072Goodwill and other intangible assets 182,994 185,208Equity method investments 432,389 434,289Other noncurrent assets, net 54,173 57,529Total assets $ 3,176,726 $ 3,074,972
LIABILITIES AND OWNERS' EQUITYCurrent liabilities:
Current portion of long-term debt $ 27 $ 26Other current liabilities 535,795 488,329
Total current liabilities 535,822 488,355
Long-term debt, excluding current portion 1,140,637 1,050,918Other noncurrent liabilities 85,922 89,734Total liabilities 1,762,381 1,629,007
Total owners' equity 1,414,345 1,445,965Total liabilities and owners' equity $ 3,176,726 $ 3,074,972
16

First Quarter 2017 Results
Consolidated Statements of Operations and Comprehensive Income (Loss)(in thousands, except per share amounts, unaudited, condensed) Three Months Ended
March 31, December 31,2017 2016 2016
Revenues $ 456,100 $ 314,851 $ 402,172Expenses:
Costs of products sold, exclusive of depreciation and amortization shown below 348,998 196,947 281,139Operating 52,083 50,192 54,564General and administrative 21,644 21,060 21,490Depreciation and amortization 24,599 24,051 24,776Loss on disposal or impairment, net 2,410 13,307 38Total expenses 449,734 305,557 382,007
Earnings from equity method investments 17,091 23,071 17,763Loss on issuance of common units by equity method investee — (41) —Operating income 23,457 32,324 37,928Other expenses, net 33,639 58,622 9,809Income (loss) from continuing operations before income taxes (10,182) (26,298) 28,119Income tax expense (benefit) 95 (21,407) 16,119Income (loss) from continuing operations (10,277) (4,891) 12,000Loss from discontinued operations, net of income taxes — (2) —Net income (loss) (10,277) (4,893) 12,000
Less: net income attributable to noncontrolling interests — 9,020 —Net income (loss) attributable to SemGroup Corporation (10,277) (13,913) 12,000Net income (loss) attributable to SemGroup Corporation (10,277) (13,913) 12,000Other comprehensive income (loss), net of income taxes 6,033 (4,109) (10,783)Comprehensive income (loss) attributable to SemGroup Corporation $ (4,244) $ (18,022) $ 1,217Net income (loss) per common share:
Basic $ (0.16) $ (0.32) $ 0.18Diluted $ (0.16) $ (0.32) $ 0.18
Weighted average shares (thousands):Basic 65,692 43,870 65,754Diluted 65,692 43,870 66,326
17
First Quarter 2017 Results
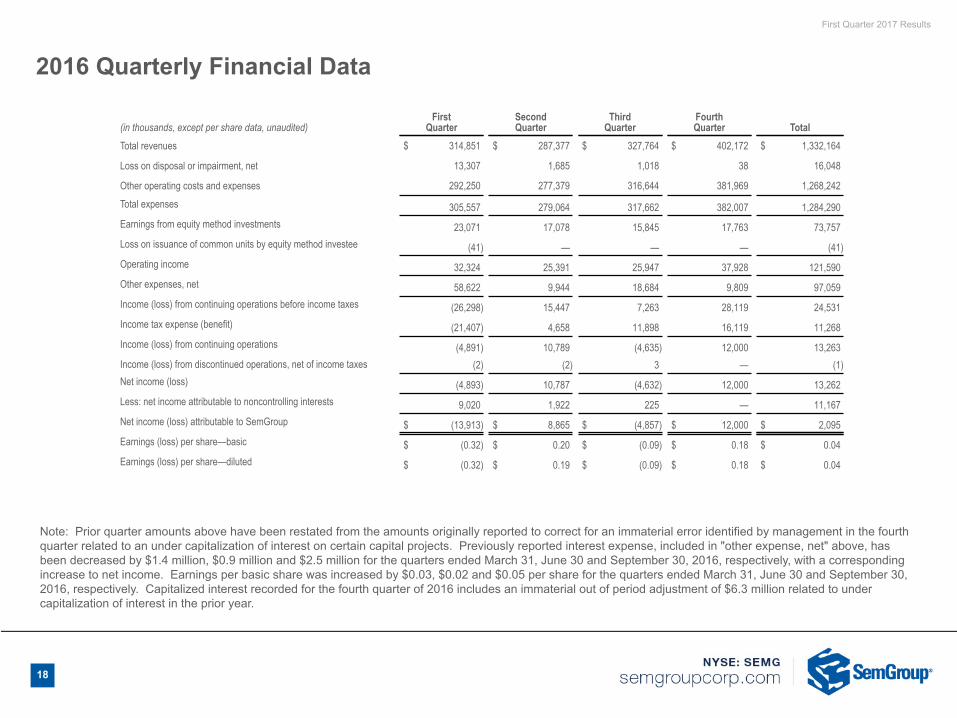
2016 Quarterly Financial Data
Note: Prior quarter amounts above have been restated from the amounts originally reported to correct for an immaterial error identified by management in the fourthquarter related to an under capitalization of interest on certain capital projects. Previously reported interest expense, included in "other expense, net" above, hasbeen decreased by $1.4 million, $0.9 million and $2.5 million for the quarters ended March 31, June 30 and September 30, 2016, respectively, with a correspondingincrease to net income. Earnings per basic share was increased by $0.03, $0.02 and $0.05 per share for the quarters ended March 31, June 30 and September 30,2016, respectively. Capitalized interest recorded for the fourth quarter of 2016 includes an immaterial out of period adjustment of $6.3 million related to undercapitalization of interest in the prior year.
(in thousands, except per share data, unaudited)First
QuarterSecondQuarter
ThirdQuarter
FourthQuarter Total
Total revenues $ 314,851 $ 287,377 $ 327,764 $ 402,172 $ 1,332,164
Loss on disposal or impairment, net 13,307 1,685 1,018 38 16,048
Other operating costs and expenses 292,250 277,379 316,644 381,969 1,268,242Total expenses 305,557 279,064 317,662 382,007 1,284,290Earnings from equity method investments 23,071 17,078 15,845 17,763 73,757Loss on issuance of common units by equity method investee (41) — — — (41)Operating income 32,324 25,391 25,947 37,928 121,590Other expenses, net 58,622 9,944 18,684 9,809 97,059Income (loss) from continuing operations before income taxes (26,298) 15,447 7,263 28,119 24,531Income tax expense (benefit) (21,407) 4,658 11,898 16,119 11,268Income (loss) from continuing operations (4,891) 10,789 (4,635) 12,000 13,263Income (loss) from discontinued operations, net of income taxes (2) (2) 3 — (1)Net income (loss) (4,893) 10,787 (4,632) 12,000 13,262Less: net income attributable to noncontrolling interests 9,020 1,922 225 — 11,167Net income (loss) attributable to SemGroup $ (13,913) $ 8,865 $ (4,857) $ 12,000 $ 2,095Earnings (loss) per share—basic $ (0.32) $ 0.20 $ (0.09) $ 0.18 $ 0.04Earnings (loss) per share—diluted $ (0.32) $ 0.19 $ (0.09) $ 0.18 $ 0.04
18

First Quarter 2017 Results
Non-GAAP Adjusted EBITDA Calculation
(in thousands, unaudited) Three Months EndedMarch 31, December 31,
Reconciliation of net income to Adjusted EBITDA: 2017 2016 2016Net income (loss) $ (10,277) $ (4,893) $ 12,000
Add: Interest expense(1) 13,867 17,577 8,545Add: Income tax expense (benefit) 95 (21,407) 16,119Add: Depreciation and amortization expense 24,599 24,051 24,776
EBITDA 28,284 15,328 61,440Selected Non-Cash Items and
Other Items Impacting Comparability 32,383 62,348 4,765Adjusted EBITDA $ 60,667 $ 77,676 $ 66,205
Selected Non-Cash Items andOther Items Impacting ComparabilityLoss on disposal or impairment, net $ 2,410 $ 13,307 $ 38Loss from discontinued operations, net of income taxes — 2 —Foreign currency transaction loss — 1,469 1,088Remove NGL equity losses (earnings) including loss (gain) on issuanceof common units (3) (2,191) 6Remove loss on sale or impairment of NGL units — 39,764 —NGL cash distribution — 4,873 —Employee severance and relocation expense 558 259 499Unrealized loss (gain) on derivative activities 27 (4,548) (5,107)Depreciation and amortization included within equity earnings 6,712 6,539 5,071Non-cash equity compensation 2,757 2,874 3,170Loss on early extinguishment of debt $ 19,922 $ — $ —Selected Non-Cash items and
Other Items Impacting Comparability $ 32,383 $ 62,348 $ 4,765
19 1) Capitalized interest recorded for 4Q 2016 includes an immaterial out of period adjustment of $6.3 million related to the prior yearNote: 1Q 2017 cash expense: ~ $18 million interest, ~ $8 million maintenance capex, ~ $1 million income tax

First Quarter 2017 Results
Non-GAAP Financial Data Reconciliations
(in thousands, unaudited) Three Months EndedMarch 31, December 31,
2017 2016 2016Net income $ 12,242 $ 19,295 $ 15,810
Add: Interest expense (income) (1,305) 264 (1,098)Add: Depreciation and amortization expense 5,927 5,860 6,140
EBITDA 16,864 25,419 20,852Selected Non-Cash Items and
Other Items Impacting Comparability 8,788 6,606 5,206Adjusted EBITDA $ 25,652 $ 32,025 $ 26,058
Selected Non-Cash Items and Other Items Impacting Comparability
Loss on disposal or impairment, net $ 1,961 $ 67 $ 38Employee severance and relocation expense 115 — 97Depreciation and amortization included within
equity earnings 6,712 6,539 5,071Selected Non-Cash items and
Other Items Impacting Comparability $ 8,788 $ 6,606 $ 5,206
Crude - Transportation Segment
20

First Quarter 2017 Results
Non-GAAP Financial Data Reconciliations
(in thousands, unaudited) Three Months EndedMarch 31, December 31,
2017 2016 2016Net income $ 6,884 $ 7,705 $ 11,756
Add: Interest expense 134 — 128Add: Depreciation and amortization expense 1,944 1,882 1,996
EBITDA 8,962 9,587 13,880Selected Non-Cash Items and
Other Items Impacting Comparability 54 — —Adjusted EBITDA $ 9,016 $ 9,587 $ 13,880
Selected Non-Cash Items and Other Items Impacting Comparability
Employee severance expense $ 54 $ — $ —Selected Non-Cash items and
Other Items Impacting Comparability $ 54 $ — $ —
Crude - Facilities Segment
21

First Quarter 2017 Results
Non-GAAP Financial Data Reconciliations
(in thousands, unaudited) Three Months EndedMarch 31, December 31,
2017 2016 2016Net income (loss) $ (3,961) $ 13,461 $ 2,853
Add: Interest expense 257 140 302Add: Depreciation and amortization expense 62 40 59
EBITDA (3,642) 13,641 3,214Selected Non-Cash Items and
Other Items Impacting Comparability 170 (4,321) (5,107)Adjusted EBITDA $ (3,472) $ 9,320 $ (1,893)
Selected Non-Cash Items and Other Items Impacting Comparability
Loss on disposal or impairment, net $ — $ 227 $ —Employee severance expense 143 — —Unrealized loss (gain) on derivative activities 27 (4,548) (5,107)Selected Non-Cash items and
Other Items Impacting Comparability $ 170 $ (4,321) $ (5,107)
Crude - Supply and Logistics Segment
22

First Quarter 2017 Results
Non-GAAP Financial Data Reconciliations
(in thousands, unaudited) Three Months EndedMarch 31, December 31,
2017 2016 2016Net income (loss) $ 3,673 $ (13,474) $ 4,385
Add: Interest expense 3,149 3,555 3,283Add: Depreciation and amortization expense 8,927 8,927 8,966
EBITDA 15,749 (992) 16,634Selected Non-Cash Items and
Other Items Impacting Comparability 318 13,391 266Adjusted EBITDA $ 16,067 $ 12,399 $ 16,900
Selected Non-Cash Items and Other Items Impacting Comparability
Loss on disposal or impairment, net $ 21 $ 13,052 $ —Non-cash equity compensation 297 339 266Selected Non-Cash items and
Other Items Impacting Comparability $ 318 $ 13,391 $ 266
SemGas Segment
23

First Quarter 2017 Results
Non-GAAP Financial Data Reconciliations
(in thousands, unaudited) Three Months EndedMarch 31, December 31,
2017 2016 2016Net income $ 3,506 $ 3,276 $ 931
Add: Interest expense 2,162 1,706 937Add: Income tax expense 1,424 965 678Add: Depreciation and amortization expense 4,496 3,951 4,383
EBITDA 11,588 9,898 6,929Selected Non-Cash Items and
Other Items Impacting Comparability 932 383 369Adjusted EBITDA $ 12,520 $ 10,281 $ 7,298
Selected Non-Cash Items and Other Items Impacting Comparability
Loss on disposal or impairment, net $ 445 $ — $ —Foreign currency transaction loss 8 6 —Non-cash equity compensation 479 377 369Selected Non-Cash items and
Other Items Impacting Comparability $ 932 $ 383 $ 369
SemCAMS Segment
24

First Quarter 2017 Results
Non-GAAP Financial Data Reconciliations
(in thousands, unaudited) Three Months EndedMarch 31, December 31,
2017 2016 2016Net income (loss) $ 1,285 $ (246) $ (155)
Add: Interest expense 522 376 407Add: Income tax expense 381 59 91Add: Depreciation and amortization expense 1,815 1,960 1,853
EBITDA 4,003 2,149 2,196Selected Non-Cash Items and
Other Items Impacting Comparability (64) 687 1,148Adjusted EBITDA $ 3,939 $ 2,836 $ 3,344
Selected Non-Cash Items and Other Items Impacting Comparability
Foreign currency transaction (gain) loss $ (259) $ 510 $ 1,006Non-cash equity compensation 195 177 142Selected Non-Cash items and
Other Items Impacting Comparability $ (64) $ 687 $ 1,148
SemLogistics Segment
25

First Quarter 2017 Results
Non-GAAP Financial Data Reconciliations
(in thousands, unaudited) Three Months EndedMarch 31, December 31,
2017 2016 2016Net income $ 406 $ 696 $ 2,068
Add: Income tax expense 217 607 534Add: Depreciation and amortization expense 937 941 930
EBITDA 1,560 2,244 3,532Selected Non-Cash Items and
Other Items Impacting Comparability 391 370 199Adjusted EBITDA $ 1,951 $ 2,614 $ 3,731
Selected Non-Cash Items and Other Items Impacting Comparability
Gain on disposal of long-lived assets, net $ (17) $ (39) $ —Foreign currency transaction loss 252 256 59Non-cash equity compensation 156 153 140Selected Non-Cash items and
Other Items Impacting Comparability $ 391 $ 370 $ 199
SemMaterials México Segment
26

First Quarter 2017 Results
Non-GAAP Financial Data Reconciliations
(in thousands, unaudited) Three Months EndedMarch 31, December 31,
2017 2016 2016Net loss $ (34,312) $ (35,606) $ (25,648)
Add: Interest expense 8,948 11,536 4,586Add: Income tax expense (benefit) (1,927) (23,038) 14,816Add: Depreciation and amortization expense 491 490 449
EBITDA (26,800) (46,618) (5,797)Selected Non-Cash Items and
Other Items Impacting Comparability 21,794 45,232 2,684Adjusted EBITDA $ (5,006) $ (1,386) $ (3,113)
Selected Non-Cash Items and Other Items Impacting Comparability
Loss from discontinued operations, net of income taxes $ — $ 2 $ —Foreign currency transaction (gain) loss (1) 697 23Remove NGL equity losses (earnings) including gain (loss) on issuanceof common units (3) (2,191) 6Remove loss on impairment or sale of NGL units — 39,764 —NGL cash distribution — 4,873 —Employee severance and relocation expense 246 259 402Non-cash equity compensation 1,630 1,828 2,253Loss on early extinguishment of debt 19,922 — —Selected Non-Cash items and
Other Items Impacting Comparability $ 21,794 $ 45,232 $ 2,684
Corporate & Other Segment
27

First Quarter 2017 Results
(in thousands, unaudited) Three Months EndedJune 30, 2016
Crude -Transportation
Crude -Facilities
Crude -Supply andLogistics SemCAMS SemLogistics SemMexico SemGas
Corporateand Other Consolidated
Net income (loss) $ 11,794 $ 7,450 $ 5,370 $ 2,325 $ (1,447) $ 1,187 $ (325) $ (15,567) $ 10,787
Add: Interest expense 193 — 182 1,931 353 — 3,431 11,921 18,011
Add: Income tax expense (benefit) — — — 451 (273) 194 — 4,286 4,658
Add: Depreciation and amortization expense 6,174 1,921 40 4,294 1,983 949 9,198 496 25,055
EBITDA 18,161 9,371 5,592 9,001 616 2,330 12,304 1,136 58,511Selected Non-Cash Items and Other Items Impacting Comparability 8,954 4 4,477 381 1,562 244 256 (6,757) 9,121
Adjusted EBITDA $ 27,115 $ 9,375 $ 10,069 $ 9,382 $ 2,178 $ 2,574 $ 12,560 $ (5,621) $ 67,632
Selected Non-Cash Items and Other Items Impacting Comparability
Loss (gain) on disposal of long-lived assets, net $ 1,714 $ — $ — $ — $ — $ (28) $ (1) $ — $ 1,685Loss from discontinued operations, net of income taxes — — — — — — — 2 2Foreign currency transaction (gain) loss — — — (1) 1,391 153 — — 1,543
Remove NGL equity earnings including gain on issuance of common units — — — — — — — (9,120) (9,120)
Employee severance expense 102 4 — — — — 13 717 836
Unrealized loss on derivative activities — — 4,477 — — — — — 4,477Depreciation and amortization included within equity earnings 7,138 — — — — — — — 7,138
Non-cash equity compensation — — — 382 171 119 244 1,644 2,560Selected Non-Cash Items and Other Items Impacting Comparability $ 8,954 $ 4 $ 4,477 $ 381 $ 1,562 $ 244 $ 256 $ (6,757) $ 9,121
Reconciliation of Net Income to Adjusted EBITDA
28

First Quarter 2017 Results
(in thousands, unaudited) Three Months EndedSeptember 30, 2016
Crude -Transportation
Crude -Facilities
Crude -Supply andLogistics SemCAMS SemLogistics SemMexico SemGas
Corporateand Other Consolidated
Net income (loss) $ 13,052 $ 7,697 $ (3,248) $ 5,080 $ 948 $ 1,491 $ 3,750 $ (33,402) $ (4,632)
Add: Interest expense 154 — 186 2,175 456 43 3,367 12,136 18,517
Add: Income tax expense (benefit) — — — 1,573 (601) 349 — 10,577 11,898
Add: Depreciation and amortization expense 6,309 1,982 46 4,239 1,880 932 9,079 455 24,922
EBITDA 19,515 9,679 (3,016) 13,067 2,683 2,815 16,196 (10,234) 50,705Selected Non-Cash Items and Other Items Impacting Comparability 8,334 2 6,167 124 686 72 125 5,078 20,588
Adjusted EBITDA $ 27,849 $ 9,681 $ 3,151 $ 13,191 $ 3,369 $ 2,887 $ 16,321 $ (5,156) $ 71,293
Selected Non-Cash Items and Other Items Impacting Comparability
Loss (gain) on disposal of long-lived assets, net $ 1,018 $ — $ — $ — $ — $ — $ — $ — $ 1,018Foreign currency transaction (gain) loss — — — — 647 30 — (18) 659Remove NGL equity losses including gain on issuance of common units — — — — — — — 38 38Employee severance expense 33 2 — 1 — — — 498 534Unrealized loss on derivative activities — — 6,167 — — — — — 6,167M&A transaction related costs 3,269 3,269Depreciation and amortization included within equity earnings 7,283 — — — — — — — 7,283Non-cash equity compensation — — — 123 39 42 125 1,291 1,620Selected Non-Cash Items and Other Items Impacting Comparability $ 8,334 $ 2 $ 6,167 $ 124 $ 686 $ 72 $ 125 $ 5,078 $ 20,588
Reconciliation of Net Income to Adjusted EBITDA
29

First Quarter 2017 Results
(in thousands, unaudited) Year EndedDecember 31, 2016
Crude -Transportation
Crude -Facilities
Crude -Supply andLogistics SemCAMS SemLogistics SemMexico SemGas
Corporateand Other Consolidated
Net income (loss) $ (59,951) $ 34,608 $ 18,436 $ 11,612 $ (900) $ 5,442 $ (5,564) $ 9,579 $ 13,262Add: Interest expense (487) 128 810 6,749 1,592 43 13,636 40,179 62,650Add: Income tax expense (benefit) — — — 3,667 (724) 1,684 — 6,641 11,268Add: Depreciation and amortization expense 24,483 7,781 185 16,867 7,676 3,752 36,170 1,890 98,804EBITDA (35,955) 42,517 19,431 38,895 7,644 10,921 44,242 58,289 185,984Selected Non-Cash Items and Other Items Impacting Comparability 29,100 6 1,216 1,257 4,083 885 14,038 46,226 96,811
Adjusted EBITDA $ (6,855) $ 42,523 $ 20,647 $ 40,152 $ 11,727 $ 11,806 $ 58,280 $ 104,515 $ 282,795
Selected Non-Cash Items and Other Items Impacting Comparability
Loss (gain) on disposal of long-lived assets, net $ 2,837 $ — $ 227 $ — $ — $ (67) $ 13,051 $ — $ 16,048
Loss from discontinued operations, net of income taxes — — — — — — — 1 1
Foreign currency transaction loss — — — 5 3,554 498 — 702 4,759
Remove NGL equity earnings including gain on issuance of common units — — — — — — — (2,147) (2,147)Remove loss on sale of NGL units — — — — — — — 30,644 30,644NGL cash distribution — — — — — — — 4,873 4,873
Employee severance expense 232 6 — 1 — — 13 1,876 2,128
Unrealized loss on derivative activities — — 989 — — — — — 989M&A transaction related costs — — — — — — — 3,269 3,269Depreciation and amortization included within equity earnings 26,031 — — — — — — — 26,031
Non-cash equity compensation — — — 1,251 529 454 974 7,008 10,216Selected Non-Cash Items and Other Items Impacting Comparability $ 29,100 $ 6 $ 1,216 $ 1,257 $ 4,083 $ 885 $ 14,038 $ 46,226 $ 96,811
Reconciliation of Net Income to Adjusted EBITDA
30
First Quarter 2017 Results
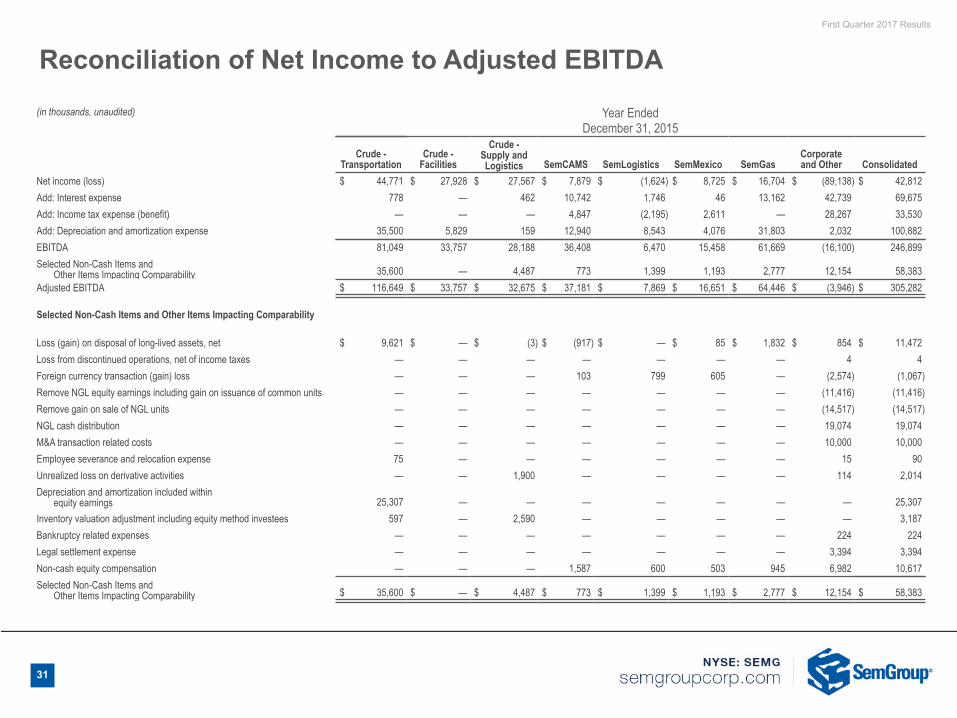
Reconciliation of Net Income to Adjusted EBITDA
(in thousands, unaudited) Year EndedDecember 31, 2015
Crude -Transportation
Crude -Facilities
Crude -Supply andLogistics SemCAMS SemLogistics SemMexico SemGas
Corporateand Other Consolidated
Net income (loss) $ 44,771 $ 27,928 $ 27,567 $ 7,879 $ (1,624) $ 8,725 $ 16,704 $ (89,138) $ 42,812Add: Interest expense 778 — 462 10,742 1,746 46 13,162 42,739 69,675Add: Income tax expense (benefit) — — — 4,847 (2,195) 2,611 — 28,267 33,530Add: Depreciation and amortization expense 35,500 5,829 159 12,940 8,543 4,076 31,803 2,032 100,882EBITDA 81,049 33,757 28,188 36,408 6,470 15,458 61,669 (16,100) 246,899Selected Non-Cash Items and Other Items Impacting Comparability 35,600 — 4,487 773 1,399 1,193 2,777 12,154 58,383Adjusted EBITDA $ 116,649 $ 33,757 $ 32,675 $ 37,181 $ 7,869 $ 16,651 $ 64,446 $ (3,946) $ 305,282
Selected Non-Cash Items and Other Items Impacting Comparability
Loss (gain) on disposal of long-lived assets, net $ 9,621 $ — $ (3) $ (917) $ — $ 85 $ 1,832 $ 854 $ 11,472Loss from discontinued operations, net of income taxes — — — — — — — 4 4Foreign currency transaction (gain) loss — — — 103 799 605 — (2,574) (1,067)Remove NGL equity earnings including gain on issuance of common units — — — — — — — (11,416) (11,416)Remove gain on sale of NGL units — — — — — — — (14,517) (14,517)NGL cash distribution — — — — — — — 19,074 19,074M&A transaction related costs — — — — — — — 10,000 10,000Employee severance and relocation expense 75 — — — — — — 15 90Unrealized loss on derivative activities — — 1,900 — — — — 114 2,014Depreciation and amortization included within equity earnings 25,307 — — — — — — — 25,307Inventory valuation adjustment including equity method investees 597 — 2,590 — — — — — 3,187Bankruptcy related expenses — — — — — — — 224 224Legal settlement expense — — — — — — — 3,394 3,394Non-cash equity compensation — — — 1,587 600 503 945 6,982 10,617Selected Non-Cash Items and Other Items Impacting Comparability $ 35,600 $ — $ 4,487 $ 773 $ 1,399 $ 1,193 $ 2,777 $ 12,154 $ 58,383
31

First Quarter 2017 Results
(in thousands, unaudited) Year EndedDecember 31, 2014
Crude -Transportation
Crude -Facilities
Crude -Supply andLogistics SemCAMS SemLogistics SemMexico SemGas
Corporateand Other Consolidated
Net income (loss) $ 31,301 $ 26,921 $ 24,610 $ 14,318 $ (10,072) $ 5,900 $ 6,792 $ (47,713) $ 52,057Add: Interest expense (income) 11,727 — 502 13,558 1,528 166 8,570 12,993 49,044Add: Income tax expense (benefit) — — — 3,135 (2,231) 4,053 — 41,556 46,513Add: Depreciation and amortization expense 33,679 5,365 549 14,295 10,005 6,031 26,353 2,120 98,397EBITDA 76,707 32,286 25,661 45,306 (770) 16,150 41,715 8,956 246,011Selected Non-Cash Items and Other Items Impacting Comparability 21,582 (34) 4,004 590 (1,083) 621 21,053 (5,303) 41,430Adjusted EBITDA $ 98,289 $ 32,252 $ 29,665 $ 45,896 $ (1,853) $ 16,771 $ 62,768 $ 3,653 $ 287,441
Selected Non-Cash Items and Other Items Impacting Comparability
Loss (gain) on disposal of long-lived assets, net $ 467 $ (34) $ (42) $ (950) $ (2,490) $ (53) $ 20,092 $ 15,602 $ 32,592Loss (income) from discontinued operations, net of income taxes — — — — (1) — — 2 1Foreign currency transaction (gain) loss — — — 42 821 279 — (1,228) (86)Remove NGL equity earnings including gain on issuance of common units — — — — — — — (31,363) (31,363)Remove gain on sale of NGL units — — — — — — — (34,211) (34,211)NGL cash distribution — — — — — — — 23,404 23,404Employee severance expense 9 — — 150 — — 41 20 220Unrealized loss (gain) on derivative activities — — (1,621) — — — — (113) (1,734)Change in fair value of warrants — — — — — — — 13,423 13,423Depreciation and amortization included within equity earnings 18,992 — — — — — — — 18,992Inventory valuation adjustment including equity method investees 2,114 — 5,667 — — — — — 7,781Recovery of receivables written off at emergence — — — (664) — — — — (664)Bankruptcy related expenses — — — — — — 150 1,160 1,310Charitable contributions — — — — — — — 3,379 3,379Non-cash equity compensation — — — 2,012 587 395 770 4,622 8,386Selected Non-Cash Items and Other Items Impacting Comparability $ 21,582 $ (34) $ 4,004 $ 590 $ (1,083) $ 621 $ 21,053 $ (5,303) $ 41,430
Reconciliation of Net Income to Adjusted EBITDA
32