Self Powered Instrumentation Equipment and Machinery using Solar ...
23
14 Self Powered Instrumentation Equipment and Machinery using Solar Panels Federico Hahn Universidad Autónoma Chapingo México 1. Introduction Energy and water are required by any human being in order to live decently. Most of the rural population of the developing world lives without access to formal electrification. Electricity is one of the prerequisites for significant sustainable economic growth, being a reliable and reasonably priced energy essential for value-added agricultural and post- harvest processes. Modern energy supply also enables more intensive agriculture by providing irrigation (pumps) and immediate post-harvest treatment (cooling) and storage. Solar radiation can be converted into electricity using photovoltaic panels. Industrialized countries present a trend towards grid-connected photovoltaic systems, as battery energy storage is not required and the electricity is supplied to the network. Therefore, it is more economically interesting to supply the electricity produced by a photovoltaic system to the electricity network than to use it to drive a chiller. Providing a reliable water supply for both human water pumping systems and agricultural needs in rural areas is one of the main applications of PV energy. The least expensive method of pumping water using PV energy is by connecting a DC motor without batteries (Abidin & Yesilata, 2004). Battery-less systems that directly couple PV modules to variable speed DC pump motors seems to have high potential for energy efficient and cost effective reverse osmosis desalinization (Ghermandi & Messalem, 2009). A simple irrigation fuzzy logic model analyzed the pumping system together with the crop to obtain the time of year to irrigate for compensating the lack of water (Damak et al., 2009). The use of pumped water for energy storage is an innovative alternative to battery storage due to its unlimited storage duration (Manolakos et al., 2004). Many machines have been constructed thinking in photovoltaic powering. As photovoltaic panels can provide excellent energy on places with daily radiation of 4-6 kWh/m² prototypes are being constructed so that life becomes easier. For example, in African countries milling the average daily consumption (2.5 kg of grain) takes three hours (Chinsman, 1985). A PV-driven stone mill was constructed using two 50 W PV-panels and a battery of 85 Ah. Feed costs on dairy farms accounts for approximately half the cost of producing milk (Gardner et al., 1995). The feed dispensed to animals was measured to be within 6% of the programmed ratio and the cows adapted to eat from the feeder with training. The solar panels worked efficiently charging the batteries to provide 2.5 days of www.intechopen.com
Transcript of Self Powered Instrumentation Equipment and Machinery using Solar ...

14
Self Powered Instrumentation Equipment and Machinery using Solar Panels
Federico Hahn Universidad Autónoma Chapingo
México
1. Introduction
Energy and water are required by any human being in order to live decently. Most of the
rural population of the developing world lives without access to formal electrification.
Electricity is one of the prerequisites for significant sustainable economic growth, being a
reliable and reasonably priced energy essential for value-added agricultural and post-
harvest processes. Modern energy supply also enables more intensive agriculture by
providing irrigation (pumps) and immediate post-harvest treatment (cooling) and storage.
Solar radiation can be converted into electricity using photovoltaic panels. Industrialized
countries present a trend towards grid-connected photovoltaic systems, as battery energy
storage is not required and the electricity is supplied to the network. Therefore, it is more
economically interesting to supply the electricity produced by a photovoltaic system to the
electricity network than to use it to drive a chiller.
Providing a reliable water supply for both human water pumping systems and agricultural
needs in rural areas is one of the main applications of PV energy. The least expensive
method of pumping water using PV energy is by connecting a DC motor without batteries
(Abidin & Yesilata, 2004). Battery-less systems that directly couple PV modules to variable
speed DC pump motors seems to have high potential for energy efficient and cost effective
reverse osmosis desalinization (Ghermandi & Messalem, 2009). A simple irrigation fuzzy
logic model analyzed the pumping system together with the crop to obtain the time of year
to irrigate for compensating the lack of water (Damak et al., 2009). The use of pumped water
for energy storage is an innovative alternative to battery storage due to its unlimited storage
duration (Manolakos et al., 2004).
Many machines have been constructed thinking in photovoltaic powering. As photovoltaic
panels can provide excellent energy on places with daily radiation of 4-6 kWh/m²
prototypes are being constructed so that life becomes easier. For example, in African
countries milling the average daily consumption (2.5 kg of grain) takes three hours
(Chinsman, 1985). A PV-driven stone mill was constructed using two 50 W PV-panels and a
battery of 85 Ah. Feed costs on dairy farms accounts for approximately half the cost of
producing milk (Gardner et al., 1995). The feed dispensed to animals was measured to be
within 6% of the programmed ratio and the cows adapted to eat from the feeder with
training. The solar panels worked efficiently charging the batteries to provide 2.5 days of
www.intechopen.com
Solar Collectors and Panels, Theory and Applications
294
reserve capacity to 50% depth of discharge (DOD). VaxiCool mobile freezers have been
constructed in order to store and transport vaccines and drugs in remote areas.
Wireless instrumentation sensors have reduced its size and power demand. All these low-cost and lightweight devices need a compact energy source or if possible eliminate battery use. Actually worldwide research is carried out on alternatives solutions to batteries in what is called power harvesting (Vullers et al. 2009). Harvesting energy from the ambient can be done using vibration energy, thermal energy and light. Solar panels can be used for supplying energy to measuring instruments and for small
machines used during food harvesting. Instruments for taking measurements on sites were
no electricity is available are generally supplied from a solar panel. Batteries are used in
order to provide the energy required by the instruments during the night and under cloudy
days. In this chapter a simple monitoring system that samples chloride in rivers is
presented. Food production equipments require electric motors to operate; so soft start
motor controllers are required to avoid current peaks in squirrel cage motors reducing solar
panel sizing. Its application for a greenhouse automatic moving shelter is illustrated. A final
application which uses solar panels is for prickle pear fruit cauterization to increase its shelf-
life.
2. Important
If PV systems are constructed with rudimentary electronics, it is possible that most of the
power generated by the solar panels can be wasted and dissipated as heat by the system
components. It is worthwhile to investigate modern and sophisticated means of managing
electrical power in PV systems using power electronics. Furthermore, since solar energy
systems are relatively expensive in comparison to other energy sources, it would be
advisable to maximize energy efficiency.
Only 30% of PV applications apply energy to motors being 15% of them alternating current
motors. Its main application is for pumping water in rural areas with direct current motors,
which although are bigger than AC motors, are easily started. In applications where the
motor is hanging like in the greenhouses or in other equipments, weight becomes an
important feature to be considered. Actually at homes, DC motors are rarely used and AC
motors move most of the appliances. Squirrel cage induction motors have increased its
efficiency decreasing its weight while DC motors are used as variable speed drives; actually
inverters control AC motor speed without reducing its torque. AC motors driven by PV
systems which are properly managed by PWM (pulse width modulated) soft starters reduce
starting current peaks, increase batteries life, reduce its recharge rate and solar panel size. A
PWM (pulse width modulated) soft starter was developed and later in this chapter it is
applied to control a greenhouse shade curtain.
Rapid population growth, land development along river basin, urbanization and
industrialization increase rivers pollution and environmental deterioration. All developed
countries have the decision to maintain the water quality of their rivers. River water quality
has to be characterized to identify changes or trends in quality over time or emerging
problems. Pollutants discharge into the rivers can be spotted, as well as their possible
sources in order to make recommendations for improving water quality in rivers.
Ecosystems depend upon high water quality for provision of drinking water, cycling of
nutrients, and biodiversity maintenance. Nitrogen and phosphorus are essential plant
www.intechopen.com
Self Powered Instrumentation Equipment and Machinery using Solar Panels
295
nutrients, but when streams become enriched with these nutrients changes to species
composition can result.
Real-time monitoring platforms can collect valuable data with extremely high temporal
resolution without missing data in risky events like storms. Water monitoring sensor
technology has been evolving, and most monitoring systems can work for weeks and even
months without maintenance or calibration. In-situ automatic calibration can be performed
without personal and a chloride sensor photovoltaic driven will be analyzed latter on this
chapter considering autonomy and in-situ calibration. As monitoring platforms operate
unattended and require relatively little maintenance, continuous monitoring programs
quickly become more cost-effective than programs that rely on data-gathering personal.
Data transmission via radio, cellular and phone telemetry provides a real-time picture of the
water quality and automatic reports via internet provide water information to everybody.
For all fresh produce, climatic conditions and growing practices affect the quality at harvest. Successful marketing of still alive fresh fruits and vegetables depends on maintaining the quality harvested. Worldwide postharvest fruit and vegetables losses are as high as 30 to 40% and even much higher in some developing countries. Reducing postharvest losses is very important ensuring that sufficient high quality food is available to every inhabitant in our planet. World production of vegetables amounted to 487 million ton, while that of fruits reached 393 million ton. Freshness is a very important quality attribute and can be achieved by storing fruits and vegetables for short periods (days) under the proper conditions. The last example in this chapter, analyzes a cauterization technique to avoid water loss in prickle pears. Simple equipment creates a diaphragm coating in the cauterized zone. Farms require of many equipments operating in parallel so a PV grid system should be used in the future.
3. Equipments working with PV panels
There are a many equipments working with PV panels. In this section three different applications were selected from hundreds of application as they will represent clear examples. The first one will talk about monitoring systems for water quality, the second one a controller for increasing PV system efficiency and the third a machine which cuts and cauterizes prickle pears increasing its shelf life.
3.1 Automatic chloride detection in rivers Water quality monitoring can control and detect possible pollution sites on streams, rivers and effluents (Gray, 1999). Bakker et al. (1997) developed ion selective sensors by introducing a polymeric membrane sensible to ions or cations within the circuit. Dissolved oxygen, electrical conductivity and nitrates were monitored on the Wissahickon River (Kozul & Haas, 1999). Ion-sensitive sensors are cheap to construct and although their accuracy is in the order of parts per million, they can be used in environmental sensing of wastewater. Chloride can destroy river habitats (Detwiler et al., 1991) and free chlorine concentrations
from 0.03 to 0.05 mg/l killed fish depending on the exposure time (Augspurger et al., 2003).
Chlorinated wastewaters have the potential to affect fish and mussel habitats (USEPA,
1985). Mussel exposure to concentrated chloride is harmful and should be less than 20 parts
per billion. In the total residual chloride criterion, the 4-day average concentrations should
not exceed 11 mg/l more than once every 3 yr on average (Tikkanen et al., 2004).
www.intechopen.com

Solar Collectors and Panels, Theory and Applications
296
3.1.1 Block diagram of the monitoring system An autonomous water quality monitoring system has to consider the variables to be evaluated, their calibration and sensor cleaning. If the sensors are positioned in a river where water flow is intense a special sensor should be used. Timing between researchers visits are important as calibration liquids can expire or rain effects on framing can become dangerous. Positioning of the sensor and acknowledgement of available radiation hours per day and per season is necessary for proper energy harvesting management. Energy was stored in batteries or capacitors where it is ready to use by the sensors, datalogging and transmitting equipment. A chloride measuring valve was designed for automatic sampling, calibration and cleaning of an ion-sensitive chloride sensor for environmental detection on rivers and effluents. Valve optimization decreased contamination of the calibration (buffer) liquids to a minimum value. The system presents photovoltaic panels for energy harvesting and stores the remaining energy in batteries. The system avoids the use of electrical cables becoming a wireless sensor although its power consumption is relatively high when compared with wireless sensors. Sampling measurements were taken continuously for 7 days with the valve at the wastewater effluent at Nativitas on the river Texcoco near Mexico City (Hahn et al., 2006).
3.1.2 Valve development A 10 cm diameter by 30 cm long stainless-steel valve was coupled with a pair of stepper motors (model Step-Syn 103G770, Sanyo Denki Co., Ltd, Japan) for its automatic operation. The stepper motors presented a resolution of 2°/step and consumed a power of 10w and required a battery of 12 v at 70 A/h, auto-charged by a solar cell. Valve operation presented three options: sensor cleaning, sensor calibration and effluent or river sampling and an ATM 89C51 microcontroller provided the control of both stepper motors. The right stepper motor (Fig. 2) drives two bottles (calibration liquids) weighing 60 g each. The right lateral wall presented four holes connected to the plastic tubes; when the bottle necks and the wall holes coincided liquid began to flow into the cavity. Each hole served a function during calibration: filling the sensor cavity or refilling the bottle where the solution is stored, Fig. 3. A 70 mm long shaft with a hollow section centered by a bearing was fixed to the valve bottom by a structure and had the sensor inserted at its centre. Three holes made on the rotating tube control the liquid flow towards bottle 1, bottle 2 and for distilled and sampled water disposal. Four of the plastic tubes introduced liquids to the sensor cavity (reference liquid 1, reference liquid 2,distilled water and sampling water) and three plastic tubes removed liquids from the sensor cavity (reference liquid 1, reference liquid 2 and disposal water). The left stepper motor (Fig. 2) drives the worm used by the brush cleaner, and works together with right stepper motor for introducing distilled water, reference 1, reference 2 or sample liquid to the sensing cavity. The left stepper motor is the responsible of keeping whichever of the four liquids in the sensing cavity as well as its disposal. Basically the three operations are briefly described, but more detailed information is presented by Hahn, 2004.
Sample measurement: The valve samples the liquid after introducing it to the sensor cavity through a spoon mechanism. The spoon delivers the liquid to the drain channel and then to the sensor cavity. At the end of the measurement the liquid remaining on the sensor cavity returns to the stream. Washing operation: A control signal stops the right stepper motor movement, and distilled water flows towards the sensor cavity. Once the cavity is full the left stepper
www.intechopen.com

Self Powered Instrumentation Equipment and Machinery using Solar Panels
297
motor drives the brush washer (worm-operated) through the sensor cavity, and advances for 40 mm. The brush is moved in both directions three times to obtain a better cleaning operation. Once the brush cleaning action is finished, it returns to its initial position and the water gets out from the cavity. Calibration operation: Two bottles carried by the main gear contain the calibration solutions. The bottles have to be synchronized with the right lateral wall holes. The bottle in front of the plastic tube starts filling the sensor cavity with the high concentrated sodium chloride liquid. One minute later, after the measurement is taken the first bottle is refilled. Later the second bottle is aligned to the plastic flexible tube repeating the same procedure done with bottle 1.
3.1.3 Energy management of the sensor Table 1 shows the time required for each operation so that the energy required can be
obtained in a watt-hour basis. It is assumed that after every measurement washing takes
place and that a measurement is taken every ten minutes. Sampling the river chloride will
take 3 W per hour. Washing uses a brush to clean the cavity and takes 3.25 W-hr for cleaning
six times per hour. Calibration is only done once and could be done every week if liquid is
always maintained on the cavity. Therefore it was noted that the washing liquid (distilled
water) should stay on the cavity until the next sample is taken.
Although the most important part of the sampling is the sensor it requires of a data logger
for storing data and a WI-FI transmission equipment in order to transmit the information to
a place nearby the sensor. Currently, there are two dominant short range wireless standards
frequently incorporated into mobile devices: WiFi and Bluetooth. WiFi: IEEE 802.11 offers
high-bandwidth local-area coverage up to 100 meters (Pering et al., 2006; Crk & Gniady,
2009). However WiFi transmission consumes higher power in the order of 890 mW,
compared to only 120 mW for Bluetooth due to simpler radio architecture (Agarwal et al,
2005).
The energy used for monitoring, data-logging and transmitting the information is shown in
Table 2. A limit of the number of operations per hour is ten after considering that the sensor
will be operating continuously as the measuring operation will take half an hour. The
washing routine can be adjusted to work in the other half an hour. It can be noted that the
energy consumed by the sensor increases with the number of samples and seems higher
than the data logger and transmission energy consumption.
A low power consumption data logger was developed for storing the measurement with a
resolution of 0.2% at any voltage ranging between 0-5V. The logger can record up to 8
channels of 10-bit data and stores data in a 512Kbyte memory. The logger uses ‘D’ sized
batteries and its consumption was of 523µA, indicating that they have to be replaced every
year. Its power consumption is in the order of 2.5 mW and when the data logger is not
working it stays in sleep mode reducing the power supply voltage to a minimum. Campbell
Scientific data logger CR800 acquires 6 analog inputs with a 13 bit AD converter with an
accuracy of 0.06% of the voltage signal. During sleeping mode it consumes 0.6 mA and up to
28 mA using the RS232 communication port. The applied voltage can be from 9.6 up to 16
volts avoiding the use of a solar cell regulator. The worst case power will be 28mA x 16V=
0.448 W. These results are much higher than the ones obtained by the embedded system
which never exceed 0.1W, but for a case in which another datalogger is used it was
considered as 0.5 W-hr.
www.intechopen.com
Solar Collectors and Panels, Theory and Applications
298
3.1.4 Selection of solar cells and storing elements The selection of the batteries and solar panels was done for the highest energy consumption
(ten operations per hour). A ship vessel was constructed so that the system floated in the
river. The total weight of the monitoring system, batteries and solar cells accounted for 25
kg, considering aluminum surrounding the solar panels and thin coating glass to protect
them. The vessel structure was elaborated with fiber glass and could hold up the weight,
Fig. 4. Three solar cells were installed; one superior in flat position and the other two in the
sides with the proper slope for optimum energy harvesting.
Tilting of the solar panel has been always a concern as it has been recognized that tilting helps in: 1. More power production results from better sun angle; 2. Rain water promotes module cleaning and; 3. Improved airflow cooling allows more energy output. Horizontal modules increase energy production in the summer and decrease its production
in the winter, spring and autumn; therefore a reduction in energy production over a one-
year period is noted. Figure 5 shows a simulation throughout the year for three different
angles and the horizontal position. The red line is the production energy; the violet
represents the incident energy and the green the power on the horizontal plane. As tilting
increases the red and green lines tend to separate further apart being the highest at the
summer. The red and green lines were exactly equal without tilting, Fig. 5.a., but at a tilting
angle of 19° the red line was higher than the horizontal installed panel from the beginning of
the year to day 90 and from day 243 to the end of the year (Fig. 5.c.). In the rest of the year
the flat panel produced more energy. At a tilting angle of 80° energy production decreased
notably, Fig 5.d.
In this particular application the monitoring system floating in the river is continuously
moving avoiding that dust is collected in the flat panel. A capacitor sensor providing a
variable signal between 0-5 V, detected the floating vessel movement. As the movement
frequency is in the order of one second and the air movement was of 1 ms-1 the dust did not
accumulate in the panel surface.
The energy/day required for sampling ten times during the 24 hours is 279.84 W. Adding
the energy required for calibration to this value gives the final 280.86 W/day. If two days of
autonomy are needed due to cloudy days, the 12 V battery should manage 93.62 Ah for a
battery discharge of 50%. Two batteries of 50 Ah can be used to provide the system
requirement. The determination of the photovoltaic cells (PV) depends on the energy used
per day which is 23.41 Ah; the effective amperes required from the batteries will be 27.54 Ah
considering a lead battery efficiency of 0.85. Table 3 shows the panels required to provide
the energy.
Lead acid batteries were selected as they present a low self-discharge rate, and low maintenance requirements. Its recharging is slow after deep discharges and at higher operating temperatures a shorter battery life is expected. The battery charger used a semiconductor switching element between the array and battery which switched on/off at a variable duty cycle to maintain the battery at or very close to the voltage regulation set point reducing power dissipation to a minimum. At noon the battery voltage reached the regulation voltage set point and the controller began to regulate the PV array current; the current followed the same profile as the solar irradiance. Towards the end of the sunlight hours the PV array current output decreased to a low value wherein regulation was not
www.intechopen.com

Self Powered Instrumentation Equipment and Machinery using Solar Panels
299
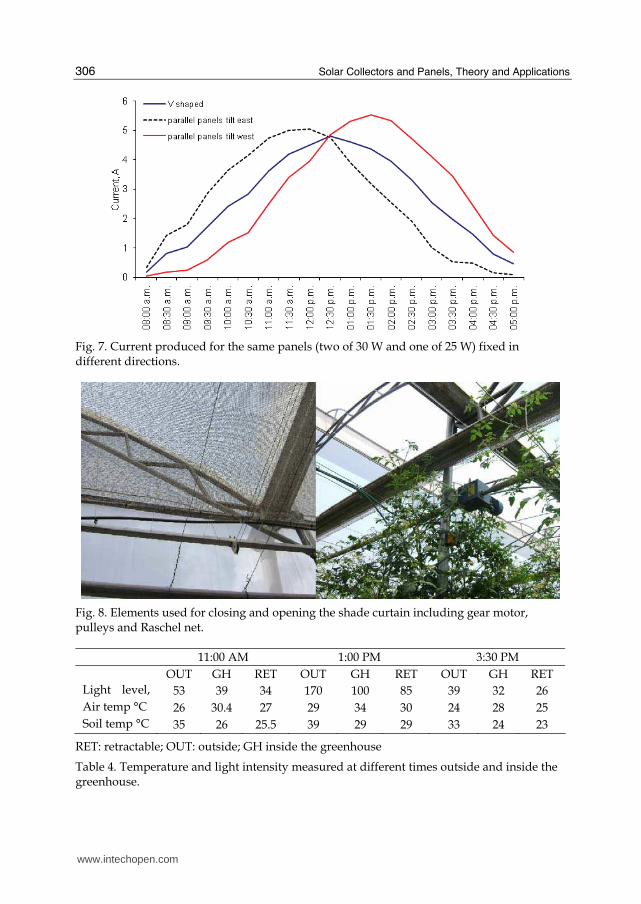
required to limit the battery voltage below the regulation set point of the controller. Once the sun sets the battery voltage begins a gradual decrease to its open-circuit voltage. Two different installation panel setups were tested and the current measured with an Elnet GR current datalogger. The first setup was the inverted V (Fig. 4) and the second one presented two parallel panels of 30 W each with a slope of 19º and a 25 W flat panel of 25 W. The latter presented a higher current after noon up to 6 AM as the slope angle with respect to the water level was directed towards east (tilted west). The total current obtained per day in the parallel red curve was of 51.66 A which can be used for all the day required only of 23.41 A. The black line with the inverted V shape produced 49.6 A during the day, while the parallel panels tilted east produced a minimum value of 47.56 A. The generated energy difference was not considerable different, but as sunny days appear in the mornings and rain in the afternoon, the inverse V was selected due to its stable and compact design.
3.2 Movable shade curtains controller in greenhouses Movab1e curtain insulation systems (heat blankets, thermal screens) reduce heat radiation
losses at night inside greenhouses, and decrease the energy load on your greenhouse crop
during warm and sunny conditions. These structures covered with polypropylene,
polyethylene, or composite fabrics (Bartok 2005) are known as retractable roof shade houses;
screens should reflect as much near infrared radiation and transmit high photosynthetic
radiation. Energy savings of up to 30% have been reported, ensuring a quick payback period
based on today’s fuel prices (Plaisier & Svensson, 2005).
Plants grow and pass from its initial transplanting state to its harvest state in 25 days
requiring of a constant daily light integral, which can be achieved only through shading or
supplemental lighting (Albright et al., 2000). Seginer et al., (2006) revealed that light control
signals may use 3-day light integrals rather than a single-day integral. An embedded
greenhouse shade curtain controller reduced solar radiation and temperature within the
greenhouse (Droga et al., 2006).
Temperature inside the greenhouse is affected by the shade curtains. Soil temperatures were
measured at three different times 11:00 a.m., 1:00 pm and 3:30 pm, Table 4. At 13:00 the soil
temperature was 10°C warmer at the soil than the air temperature, and beneath the
retractable roof the temperature difference was of 1°C.
3.2.1 Soft starter controller Retractable shade structures with motorized roll-up systems (Fig. 8) were controlled by light
sensors to regulate the amount of sunlight that reaches the plants (Pass & Mahrer, 1997). The
retractable shade used a black Raschel woven shade with 60% transmission. The mechanism
implemented used wires split 60 cm as guides for curtain sustain. A long tube drived by a
single gear motor rolled the wire over it and moved the curtain in any direction. The
retractable roof was opened seven times between 9:45 AM and 14:14 PM, and a 1/2 HP
motor started fourteen times, Fig. 9. The energy used to move the shade curtain during the
day was 3.95 Ah at full voltage application.
The soft start motor controller uses an inverter drived by an ATM89C51 microcontroller,
Fig. 10. The inverter is composed by a 12-120 V transformer switched on and off by a pair of
MOSFETS. The microcontroller reads the battery voltage in order to predict maximum
voltage that can be applied to the motor; for example a battery voltage of 10 VDC can
www.intechopen.com

Solar Collectors and Panels, Theory and Applications
300
provide 100V RMS (root mean square) to the motor. The PWM voltage presents many time
delays (Fig. 10) stored as t1-t0, t2-t1, etc. in a look up table (LUT). At moment t0 the first
MOSFET will be turned on for the period given by the first data in the Table. After counting
this time it will arrive to t1 where it is turned off; the second data of the LUT will indicate the
period that the MOSFET has to stay off, arriving to t2. At this moment the next value of the
table is acquired and the same MOSFET is turned on until t3. The opposite MOSFET that
operates as a switch will turn on and off during the negative part of the cycle.
The microprocessor program applies a starting voltage of 85 V RMS to the motor for a time
period of 5 seconds, expecting it to turn. If it didn’t rotate the voltage is increased by 5 volts
for another 5 seconds and so on until it turns on, Fig. 11. Once rotating the increments take
place every 30 seconds until full voltage is supplied. With an uncharged battery the
maximum voltage that can be supplied decreases changing the PWM timing constants. The
rest of the waveform can be reconstructed from the first quarter and its RMS value can be
obtained from Equation 1.
The method of charging lead-acid batteries is with a constant voltage, current-limited
source. That method allows a high initial charge current until the battery reaches full charge.
The battery charger is also managed by the microcontroller. The PV system presented one
battery of 50Ah with a maximum discharge capacity of 50% and 3 storage days in case
cloudy days were present. When the system was drived by the soft start controller the
energy usage per day decreased from 28.4 Ah to 23.02 Ah, Table 5. The motor load is
disconnected when the battery voltage drops below 11V and reconnected when it gets back
to 12.5V. The number of panels of 30W each decreased from seven to six, depending on the
voltage applied. If the curtains are opened 12 times instead of 7 the 50W solar panels
installed decreased to 6 when started with 84 V, Table 6.
3.3 Prickle pear cauterizer Mexico is the first world producer with 79.4% of all the prickle pears, which are cultivated in
49,165 ha (Añorve et al., 2006). The prickle pear is rich in vitamin C and proteins, low in fat
with high potentials of calcium, phosphorus and iron. The soluble solid content is high
presenting fructose and glucose, meanwhile the pH is high and the acidity low (Pimienta,
1990). Fruits stored over nine days at ambient temperature presented a high incidence of
spots and rots, and after 20 days almost 70% of the fruit gets damaged (Cervantes, 1998).
Domínguez (1992) reported that freezing the pear at 10°C increased its shelf life to 16 days.
Moisture control inside storage rooms can increase the shelf life up to 75 days (Barrios &
Hernández, 2004). It is common to harvest prickle pears with a glove, rotating the fruit until
it separates from the nopal leaf. Pear rots is a problem when deficient cuts are done under
high moisture conditions. Pathogens as Erwina caratovora, Agrobacterium tumefaciens,
Fusarium oxisporum, Botrytis cinerea Pers., and Colectotricum. Sp., attack the orifice left open in
the fruit during harvest (Dominguez, 2006).
3.3.1 Energy consumption of the cutter Electric pulses are applied to the heating resistance and its number determines the energy
required for the cutting operation (Eqn. 2). The pulse number having a period of 100 ms is
given by k; V represents the supplied voltage in volts and I the current in amperes. The
www.intechopen.com

Self Powered Instrumentation Equipment and Machinery using Solar Panels
301
temperature increased during the Ton period (Fig. 12) and decreased during the Toff period,
Hahn (2009). By increasing the duty cycle (Ton /T) the voltage is applied for a longer time to
the resistance and the set point temperature is obtained quicker. The heating resistance is of
125 Ω and the energy required is given by Eqn. 3. The voltage supplied by a 12 volts battery
is given by Eqn. 4. Table 7 shows the effect of cauterization on rot production on prickle
pears. Forty five days after harvest all non-cauterized prickle pears presented rots. After one
month of storage, 79% of the cauterized fruits at 50ºC were healthy meanwhile no pear was
rot at 150ºC. After two months of storage 78% of the pears were healthy.
If the prickle pear is cut in one second (10 periods) with a 50% duty cycle it will consume
2.88 W. A field worker takes 5 seconds to cut the next pear, when it is very close to him;
otherwise it will take from 15 to 20 seconds. An average of 150 pears are cut per hour
requiring a power of 432 W. The 5 W and 0.8 kg solar panel PV fixed on the worker cap was
connected directly to the motor (without battery), Fig.13. Whenever, the sun hides or is
cloudy it is important to have a 100 Ah lead acid battery which can be charged every 2
hours. Although a 100 Ah battery is the ideal it is too heavy to carry (38 Kg) so a 70 Ah deep
cycle battery was selected as it is lighter (16.5 kg).
The cutting blade reached 150ºC after 83 seconds, and the resistance was disconnected
automatically when it arrived to this temperature. Heat loss after 90 seconds decreased the
cutter temperature to 140ºC. Cauterizing of fruits was the main work (Hahn, 2009), but it
can be applied during nopal farm management just before the season starts, Fig. 14. The
cauterized prickle pears are placed vertically in boxes with the cutting edge looking
upwards. The boxes are closed to avoid any contamination and contact with the fruits before
being transported from the field to the storage room. To reduce energy requirements, the
resistance is now being substituted by a light focusing and converging system which can
heat up to 130ºC without using energy.
3.3.2 Farm mode analysis Theoretically an interesting system has been developed but not very useful to the producers
who own a farm, Fig. 15. The producer hires ten workers so the system has to be changed in
order to be economically feasible. A grid system is required as stored energy can be used by
any worker. If 1500 pears are cut per hour and the working day lasts eight hours 34.56 kW
are required per day. The current demand per day is 1440 A using 24 VDC motors. As there
are 6 hours with radiation of 1000W/m2, and considering a battery efficiency of 0.84, the
panels should manage 282 A. This current without considering any class of autonomy is
provided by 23 panels of 300 Watts. Cutting pears on cloudy days with high humidity is
undesirable and cauterization is not as effective, so only harvesting is done during sunny
days. Also the working day is divided so that during the middle of the day when radiation
peaks the solar panels charge the batteries. The 29 battery bank handles 100 Ah each and the
DOD were limited to 0.5. Operationally, the farm had two options for transferring the
electricity which are shown on Fig 15 and 16. The latter one used cooper tubes over the soil
making a DC grid, with low resistance and automatic disconnection when no worker was
there. The system only works well when the freeway presents no nopal leaves which avoids
the connecting box (motor to power line) movement. The second system presents the grid
over the nopal tree and it’s easier to work with, Fig. 16.
www.intechopen.com

Solar Collectors and Panels, Theory and Applications
302
4. Figures and tables
SENSING
DATALOGGING
AND
TRANSMITTING
ENERGY HARVESTING AND
STORING
Fig. 1. Water quality autonomous sensing
LEFT STEPPER
MOTOR
RIGHT STEPPER
MOTOR
FUNCTIONS:Liquid quantity and
type of liquid that will
arrive to the cavity
FUNCTIONS:
Liquid disposal and
brush operation
Fig. 2. Sensor simplest diagram design and motor functions
www.intechopen.com

Self Powered Instrumentation Equipment and Machinery using Solar Panels
303
Filling
sensor
cavity
B1
Refill B1 Refill B2
Filling
sensor
cavity
B2
Fig. 3. Lateral view of the right wall and function realized per hole.
Basic operation Operation number
Time per operation, sec
Energy W-hr
Measurement Hollow shaft filling by gravity, sensing time and sucking liquid
6/hr 180 3
Washing Brush moving, positioning and distilled water management
6/hr 195 3.25
Calibration Bottle positioning, refilling and water disposal
1/day 370 1.02
Table 1. Energy in watts-hour, time per operation for each of the sensor measuring, washing and calibration
Four operation/hr Six operation/hr Ten operation/hr
Sensor 5.18 7.27 10.16 Data logger 0.5 0.5 0.5 Transmission 1 1 1
Table 2. Energy in watts-hour, time per operation for each of the sensor measuring, washing and calibration
www.intechopen.com

Solar Collectors and Panels, Theory and Applications
304
(a) (b) (c)
Fig. 4. Solar panels generate energy for chloride monitoring (a) facing east (b) facing west and (c) with flat panel in the top.
Fig. 5. Tilting in power production at (a) 0°, (b) 2.1°, (c) 19.1° and (d) 80° throughout all the year (http://energyworksus.com/solar_power_incident_angle.html).
(a) (b)
(c) (d)
www.intechopen.com

Self Powered Instrumentation Equipment and Machinery using Solar Panels
305
0
2
4
6
8
10
12
14
16
1 4 7 10 13 16 19 22 25 28 31 34
Time, sec
Dis
pla
cem
ent,cm
displacement
Fig. 6. Vessel vertical movement measured above the water surface.
Hours with high radiation
Current, A Panel size Number of panels Weight, kg
5 5.51 90 W 3 of 30 W 11.7
6 4.59 85 W 2 of 30 W and 1 of
25W 10.6
7 3.93 70 W 2 of 20 W and 1 of
30W 8.5
8 3.44 60 W 3 of 20 W 6.0
Table 3. PV size required, amperes required to charge the battery and hours/day with a radiation over 1000 W/m2.
www.intechopen.com
Solar Collectors and Panels, Theory and Applications
306
Fig. 7. Current produced for the same panels (two of 30 W and one of 25 W) fixed in different directions.
Fig. 8. Elements used for closing and opening the shade curtain including gear motor, pulleys and Raschel net.
11:00 AM 1:00 PM 3:30 PM
OUT GH RET OUT GH RET OUT GH RET
Light level, 53 39 34 170 100 85 39 32 26
Air temp °C 26 30.4 27 29 34 30 24 28 25
Soil temp °C 35 26 25.5 39 29 29 33 24 23
RET: retractable; OUT: outside; GH inside the greenhouse
Table 4. Temperature and light intensity measured at different times outside and inside the greenhouse.
www.intechopen.com

Self Powered Instrumentation Equipment and Machinery using Solar Panels
307
Fig. 9. Closing of the retractable roof and voltage obtained from the circuit.
Fig. 10. Embedded closed loop PWM controller and PWM timing sequence.
www.intechopen.com

Solar Collectors and Panels, Theory and Applications
308
Motor
rotated?
Bring from LUT
data for starting
Generate PWM
waveform for 5 sec
Increment by 5 V
RMS PWM for 5 sec
Read DC voltage
of battery
No
Generate PWM
waveform for 30 sIncrement by 5 V
RMS PWM
Fig. 11. Block diagram of the motor starter
100% 90% 80% 70%
Daily current, Ah 3.95 3.73 3.5 3.2
Calculated current, Ah 28.4 26.88 25.2 23.02
Batteries 1 1 1 1
Panel @ 30W 7 7 6 6
Table 5. Current required daily for 7 openings under different starting voltages.
100% 90% 80% 70%
Daily current, Ah 6.7 6.4 6 5.48
Calculated current, Ah 48.7 46.08 43.2 39.4
Batteries 1 1 1 1
Panel @ 50W 7 7 7 6
Table 6. Current required daily for 12 openings under different starting voltages.
www.intechopen.com

Self Powered Instrumentation Equipment and Machinery using Solar Panels
309
Storage time (days) Treatment efficiency, %
Without
cauterization 50ºC 100ºC 150ºC
15 71 98 100 100 30 25 78 88 100 45 0 54 61 95 60 0 22 49 78
Table 7. Decrease in pricke pear rot during cauterization
Fig. 12. Duty cycle and its effect on temperature increase.
Fig. 13. Lady cutting a pear wearing a PV cell in the cap
www.intechopen.com

Solar Collectors and Panels, Theory and Applications
310
Fig. 14. Prickle pear (a) well cauterized, (b) beginning with rot; nopal (c) just cut and after (d) cauterization
www.intechopen.com

Self Powered Instrumentation Equipment and Machinery using Solar Panels
311
Fig. 15. Prickle pear farm with aerial grid cables
Fig. 16. Conductor in the soil and box connection
www.intechopen.com

Solar Collectors and Panels, Theory and Applications
312
5. Equations
2 2 2 2
1 0 2 1 3 2 1
1 0 2 1 3 2 1
( ) ( ) ( ) ... ( )
( ) ( ) ( ) ... ( )n n
n n
V t t V t t V t t V t tRMS
t t t t t t t t−
−− + − + − + + −= − + − + − + + − (1)
E = 0.5kVI (2)
E = 0.004kV2 (3)
E = 0.576k (4)
6. Conclusions
Photovoltaic systems provide electricity to everyone where sun shines and even satellites use these panels to provide the energy they require for their operation and its crew. Agriculture PV grids can provide energy to remote locations for different applications like pumping water for irrigation and human consumption, small equipments for agro industry and home appliance management. It is our responsibility to save energy and to use clean energy to share a better life quality. Monitoring sensors are becoming wireless and batteries more efficient and smaller. Actual batteries show an increased efficiency and higher storage capacity than ten years ago. Since solar energy systems are relatively expensive in comparison to other energy sources, it is advisable to maximize energy efficiency. PV electronics systems dissipate minimum energy as heat by the system components optimizing harvested energy. A monitoring self calibrated PV driven chloride sensor was presented in this chapter; another sensor could be used being the information available even without being in the river bank. The third project presented in the chapter shows how PV cells were used for a simple fruit cauterizer and how PV grids can be managed to operate on a farm contour. Cauterizing can even be simplified and its energy consumption reduced. Another machine PV driven projects can be implemented by our team to solve special needs and contribute to make of the Earth a wonderful planet.
7. Acknowledgments
I would like to acknowledge CONACYT and ICAMEX for funding the projects and to Armando Reyes Amador for helping me in drawing the pictures and Miss Nancy Rodriguez Perales for her help with the computer.
8. References
Abidin, Z. & Yesilata, B. (2004). New approaches on the optimization of directly coupled PV pumping systems. Solar Energy, 77(1), 81- 93
Agarwal, Y.; Schurgers C. & Gupta R. (2005). Dynamic Power Management using On Demand Paging for Networked Embedded Systems, In Proc. of Asia-South Pacific Design Automation Conference (ASPDAC), January 18-21, 2005, Shanghai, China, ISBN: 0-7803-8737-6
www.intechopen.com

Self Powered Instrumentation Equipment and Machinery using Solar Panels
313
Albright, L.; Both, A. & Chiu, A. (2000). Controlling greenhouse light to a consistent daily integral. Trans. of the ASAE, 43(2), 421-431
Añorve, J.; Aquino, E. & Mercado, E. (2006). Effect of controlled atmosphere on the preservation of minimally processed cactus pears. Acta Horticulturae, 728, 211-216
Augspurger, T.; Keller, A.; Black, M.; Cope, W. & Dwyer, F. (2003). Water quality guidance for protection of freshwater mussels (Unionidae) from ammonia exposure. Environmental Toxicology and Chemistry, 22, 2569–2575
Bakker, E.; Buhlmann, P. & Pretsch, E. (1997). Carrier-based ionselective electrodes and optodes. Chemical Review, 97, 3083–3132
Barrios, R. & Hernández, G. (2004). Cambios físicos y fisiológicos de tuna (Opuntia spp.) variedad burrona durante el almacenamiento en bodegas de reciente construcción. [Physical and physiological changes of prickle pear (Opuntia spp.) variety burrona during storage on new buildings] Tesis de Licenciatura. Departamento de Ingeniería Agroindustrial, Universidad Autónoma Chapingo, México.
Bartok, J. (2005). Retractable Roof Greenhouses and Shadehouses. USDA Forest Service Proceedings RMRS-P-35, 73-75, July 26–29 2004, Medford, Oregon, USA
Beshada, E.; Bux, M. & Waldenmaier, T. (2006). Construction and Optimization of a PV-Powered Grain Mill. Agricultural CIGR Ejournal. Manuscript FP 06 002, Vol. VIII, 1-11
Cervantes, A. (1998). Evaluación y caracterización poscosecha de tres variedades de tuna (Opuntia spp.). [Evaluation and post harvest characterization of three prickle pear varieties (Opuntia spp.)]. Tesis de Licenciatura. Instituto de Ciencias Agrícolas. Universidad de Guanajuato, México.
Crk, I. & Gniady, C. (2009). Understanding energy consumption of sensor enabled applications on mobile phones. Engineering in Medicine and Biology Society, 2009. EMBC 2009. Annual International Conference of the IEEE. 6885-6888
Damak, A.; Guesmi, A. & Mami, A. (2009). Modeling and fuzzy control of a photovoltaic-assisted watering system. Journal of Engineering and Technology Research, Vol.1(1), 7-13
Detwiler, R.; Kjellsen, K. & Gjorv, O. (1991). Resistance to chloride intrusion to concrete cured at different temperatures. Journal American Concrete Institute Materials, 88(1), 19–24
Dogra, A.; Parsad, K.; Kumar, N. & Suri, K. (2006). An Embedded Controller for Greenhouse Shade Curtain. Acta Horticulturae, 710: 121- 126
Domínguez, C. (2006). Evaluación financiera de una desespinadora y un empaque de tuna en el Cardonal, Hidalgo. [Financial evaluation of a spine-removing machine and a packinghouse at the Cardonal, Hidalgo] Tesis de Licenciatura. División de Ciencias Económicas Administrativas. Universidad Autónoma Chapingo, México.
Domínguez, J. (1992) Efectos de la incidencia de daños por frío sobre la fisiología y la calidad de frutos de tuna (Opuntia amyclaea T). [Effects on the incidence of freezing damage on the physiology and quality of prickle pear fruits (Opuntia amyclaea T).] Master Degree Theses. Colegio de Posgraduados, México.
Gardner, M.; Buckmaster, D. & Muller, L. (1995). Development of a mobile solar-powered dairy concentrate feeder. Applied Engineering in Agriculture, Vol 11(6), 785-790
Ghermandi, A. & Messalem, R. (2009). Solar-driven desalination with reverse osmosis: the state of art. Desalination and Water Treatment, 7, 285-296
www.intechopen.com

Solar Collectors and Panels, Theory and Applications
314
Gray, F. (1999). Water Technology: An Introduction for Environmental Students. Elsevier Science & Technology Books, New York.
Hahn, F.; Manqueros, E. & García B. (2010). Controller for optimizing PV usage during motor starting in greenhouse applications. IX Congreso Latinoamericano y del Caribe de Ingeniería Agrícola CLIA 2010, 25-29 July 2010, Victoria, Brasil, To be published.
Hahn, F. (2009). Cactus pear cauterizer increases shelf life without cooling processes. Computers and electronics in agriculture, 65(1), 1-6
Hahn, F.; Miranda, G.; Perez, F.; Mayo, O.; Rojas, F. & Coras, P. (2006). Monitoreo de la calidad del agua del Rio Texcoco mediante sensores selectivos de iones. Agrociencia, 40, 277-287
Hahn, F. (2005) Novel valve for automatic calibration of a chloride sensor for river monitoring. Biosystems Engineering, 92(3), 275-284.
Kozul, J. & Haas, L. (1999). Uses and development of water quality monitoring technology. Appalachian Rivers II conference, West Virginia, USA.
www.nett.doe.gov/publications. 18 Dic. 2005 Manolakos, D.; Papadakis, G.; Papantonis, D. & Kyritsis, S. (2004). A stand-alone
photovoltaic power system for remote villages using pumped water energy storage. Energy, 29, 57–69
Pass, N. & Mahrer, Y. (1997). The effect of an external moveable screen on the greenhouse microclimate: an application of a one dimensional numerical model. Acta Horticulturae, 443, 111-118.
Pering, T.; Agarwal, Y.; Gupta, R. & Want, R. (2006). CoolSpots: Reducing the Power consumption of Wireless Mobile Devices with Multiple Radio Interfaces. MobiSys'06, June 19–22, Uppsala, Sweden.
Pimienta, B. (1990). El nopal tunero. [Prickle pear nopal]. First edition. Universidad de Guadalajara. Jalisco, México.
Plaisier, H. & Svensson, L. (2005). Use of Adapted Energy Screens in Tomato Production with Higher Water Vapour Transmission. Acta Horticulturae, 691, 583-588.
Seginer, I.; Albright, L. & Ioslovich, I. (2006). Improved strategy for a constant daily light integral in greenhouses. Biosystems Engineering, 93 (1), 69–80.
Tikkanen, M.; Schroeter, J.; Leong, L. & Ganesh, R. (2004). Guidance manual for the disposal of chlorinated water. Integra Chemical Company, Renton, WA, USA
USEPA (1985). Ambient water quality criteria for chlorine. EPA 440/5-84-030. United States Environmental Protection Agency, Office of Water, Criteria and Standards Division, Washington, DC
Vullers, R.; van Schaijk, R.; Doms, I.; Van Hoof, C. & Mertens, R. (2009). Micropower energy harvesting. Solid State Electronics, 53, 684–693
www.intechopen.com

Solar Collectors and Panels, Theory and ApplicationsEdited by Dr. Reccab Manyala
ISBN 978-953-307-142-8Hard cover, 444 pagesPublisher SciyoPublished online 05, October, 2010Published in print edition October, 2010
InTech EuropeUniversity Campus STeP Ri Slavka Krautzeka 83/A 51000 Rijeka, Croatia Phone: +385 (51) 770 447 Fax: +385 (51) 686 166www.intechopen.com
InTech ChinaUnit 405, Office Block, Hotel Equatorial Shanghai No.65, Yan An Road (West), Shanghai, 200040, China
Phone: +86-21-62489820 Fax: +86-21-62489821
This book provides a quick read for experts, researchers as well as novices in the field of solar collectors andpanels research, technology, applications, theory and trends in research. It covers the use of solar panelsapplications in detail, ranging from lighting to use in solar vehicles.
How to referenceIn order to correctly reference this scholarly work, feel free to copy and paste the following:
Federico Hahn (2010). Self Powered Instrumentation Equipment and Machinery Using Solar Panels, SolarCollectors and Panels, Theory and Applications, Dr. Reccab Manyala (Ed.), ISBN: 978-953-307-142-8, InTech,Available from: http://www.intechopen.com/books/solar-collectors-and-panels--theory-and-applications/self-powered-instrumentation-equipment-and-machinery-using-solar-panels-


![Guidelines on the Safety of Powered Gates - hsa.ie · Machinery Directive [2006/42/EC] (The Machinery Directive). The implications of these Regulations are The implications of these](https://static.fdocuments.us/doc/165x107/5e08264c3bb4c45a633f0e97/guidelines-on-the-safety-of-powered-gates-hsaie-machinery-directive-200642ec.jpg)