Self-organization approach for THz polaritonic...
20
Self-organization approach for THz polaritonic metamaterials A. Reyes-Coronado, 1,2,∗ M. F. Acosta, 3 R. I. Merino, 3 V. M. Orera, 3 G. Kenanakis, 1,4 N. Katsarakis, 1,4 M. Kafesaki, 1,5 Ch. Mavidis, 1,5 J. Garc´ ıa de Abajo, 6 E. N. Economou, 1 and C. M. Soukoulis 1,7 1 Institute of Electronic Structure and Laser (IESL), Foundation for Research and Technology-Hellas (FORTH), P.O. Box 1385, 71110 Heraklion, Crete, Greece 2 Instituto de F´ ısica, Benem´ erita Universidad Aut´ onoma de Puebla, Apartado Postal J-48, Puebla, Pue. 72570, Mexico 3 Instituto de Ciencia de Materiales de Arag´ on, CSIC-Universidad de Zaragoza, E-50009 Zaragoza, Spain 4 Science Department, Technological Educational Institute of Crete, 71004 Heraklion, Crete, Greece 5 Department of Material Science and Technology, University of Crete, 71003 Heraklion, Crete, Greece 6 Instituto de Qu´ ımica F´ ısica, Rocasolano, Serrano 119, 28006 Madrid, Spain 7 Ames Laboratory-USDOE, and Department of Physics and Astronomy, Iowa State University, Ames, Iowa 50011, USA *[email protected] Abstract: In this paper we discuss the fabrication and the electromagnetic (EM) characterization of anisotropic eutectic metamaterials, consisting of cylindrical polaritonic LiF rods embedded in either KCl or NaCl polaritonic host. The fabrication was performed using the eutectics directional solidifi- cation self-organization approach. For the EM characterization the specular reflectance at far infrared, between 3 THz and 11 THz, was measured and also calculated by numerically solving Maxwell equations, obtaining good agreement between experimental and calculated spectra. Applying an effective medium approach to describe the response of our samples, we predicted a range of frequencies in which most of our systems behave as homogeneous anisotropic media with a hyperbolic dispersion relation, opening thus possibilities for using them in negative refractive index and imaging applications at THz range. © 2012 Optical Society of America OCIS codes: (160.3918) Metamaterials; (160.1190) Anisotropic optical materials; (220.4000) Microstructure fabrication; (160.1245) Artificially engineered materials; (160.4760) Optical properties; (160.4670) Optical materials. References and links 1. R. K¨ ohler, A. Tredicucci, F. Beltram, H. E. Beere, E. H. Linfield, A. G. Davies, D. A. Ritchie, R. C. Iotti, and F. Rossi, “Terahertz semiconductor-heterostructure laser,” Nature 417, 156–159 (2002). 2. S. W. Smye, J. M. Chamberlain, A. J. Fitzgerald, and E. Berry, “The interaction between Terahertz radiation and biological tissue,” Phys. Med. Biol. 46, R101–R112 (2001). 3. D. L. Woolard, J. O. Jensen, R. J. Hwu, and M. S. Shur, Terahertz Science and Technology for Military and Security Applications (World Scientific Publishing Co. Pte. Ltd., 2007). 4. T. Edwards, Gigahertz and Terahertz Technologies for Broadband Communications (Artech House Inc., 2000). #161382 - $15.00 USD Received 12 Jan 2012; revised 19 Apr 2012; accepted 23 Apr 2012; published 15 Jun 2012 (C) 2012 OSA 18 June 2012 / Vol. 20, No. 13 / OPTICS EXPRESS 14663
Transcript of Self-organization approach for THz polaritonic...
Self-organization approach for THzpolaritonic metamaterials
A. Reyes-Coronado,1,2,∗ M. F. Acosta,3 R. I. Merino, 3 V. M. Orera, 3
G. Kenanakis,1,4 N. Katsarakis,1,4 M. Kafesaki,1,5 Ch. Mavidis,1,5
J. Garcıa de Abajo,6 E. N. Economou,1 and C. M. Soukoulis1,7
1Institute of Electronic Structure and Laser (IESL),Foundation for Research and Technology-Hellas (FORTH),
P.O. Box 1385, 71110 Heraklion, Crete, Greece2Instituto de Fısica, Benemerita Universidad Autonoma de Puebla,
Apartado Postal J-48, Puebla, Pue. 72570, Mexico3Instituto de Ciencia de Materiales de Aragon, CSIC-Universidad de Zaragoza,
E-50009 Zaragoza, Spain4Science Department, Technological Educational Institute of Crete,
71004 Heraklion, Crete, Greece5Department of Material Science and Technology, University of Crete,
71003 Heraklion, Crete, Greece6Instituto de Quımica Fısica,
Rocasolano, Serrano 119, 28006 Madrid, Spain7Ames Laboratory-USDOE, and Department of Physics and Astronomy,
Iowa State University, Ames, Iowa 50011, USA
Abstract: In this paper we discuss the fabrication and the electromagnetic(EM) characterization of anisotropic eutectic metamaterials, consisting ofcylindrical polaritonic LiF rods embedded in either KCl or NaCl polaritonichost. The fabrication was performed using the eutectics directional solidifi-cation self-organization approach. For the EM characterization the specularreflectance at far infrared, between 3 THz and 11 THz, was measuredand also calculated by numerically solving Maxwell equations, obtaininggood agreement between experimental and calculated spectra. Applyingan effective medium approach to describe the response of our samples,we predicted a range of frequencies in which most of our systems behaveas homogeneous anisotropic media with a hyperbolic dispersion relation,opening thus possibilities for using them in negative refractive index andimaging applications at THz range.
© 2012 Optical Society of America
OCIS codes:(160.3918) Metamaterials; (160.1190) Anisotropic optical materials; (220.4000)Microstructure fabrication; (160.1245) Artificially engineered materials; (160.4760) Opticalproperties; (160.4670) Optical materials.
References and links1. R. Kohler, A. Tredicucci, F. Beltram, H. E. Beere, E. H. Linfield, A. G. Davies, D. A. Ritchie, R. C. Iotti, and F.
Rossi, “Terahertz semiconductor-heterostructure laser,” Nature417, 156–159 (2002).2. S. W. Smye, J. M. Chamberlain, A. J. Fitzgerald, and E. Berry, “The interaction between Terahertz radiation and
biological tissue,” Phys. Med. Biol.46, R101–R112 (2001).3. D. L. Woolard, J. O. Jensen, R. J. Hwu, and M. S. Shur,Terahertz Science and Technology for Military and
Security Applications(World Scientific Publishing Co. Pte. Ltd., 2007).4. T. Edwards,Gigahertz and Terahertz Technologies for Broadband Communications(Artech House Inc., 2000).
#161382 - $15.00 USD Received 12 Jan 2012; revised 19 Apr 2012; accepted 23 Apr 2012; published 15 Jun 2012(C) 2012 OSA 18 June 2012 / Vol. 20, No. 13 / OPTICS EXPRESS 14663

5. V. Minier, G. Durand, P.-O. Lagage, M. Talvard, T. Travouillon, M. Busso, and G. Tosti, “Submillimetre/terahertzastronomy at dome C with CEA filled bolometer array,” EAS Publications Series25, 321–326 (2007).
6. V. G. Veselago, “The electrodynamics of substances with simultaneously negative values ofε andµ,” Sov. Phys.Usp.10, 509–514 (1968).
7. J. B. Pendry, “Negative refraction makes perfect lens,” Phys. Rev. Lett.85, 3966–3969 (2000).8. J. B. Pendry, A. J. Holden, D. J. Robbins, and W. J. Stewart, “Magnetism from conductors and enhanced nonlinear
phenomena,” IEEE Trans. Microw.47, 2075–2084 (1999).9. J. B. Pendry, A. J. Holden, D. J. Robbins, and W. J. Stewart, “Low frequency plasmons in thin-wire structures,”
J. Phys.: Condens. Matter10, 4785–4809 (1998).10. D. R. Smith, W. J. Padilla, D. C. Vier, S. C. Nemat-Nasser, and S. Schultz, “Composite medium with simultane-
ously negative permeability and permittivity,” Phys. Rev. Lett.84, 4184–4187 (2000).11. S. O’Brien and J. B. Pendry, “Photonic band-gap effects and magnetic activity in dielectric composites,” J. Phys.:
Condens. Matter14, 4035–4044 (2002).12. J. A. Schuller, R. Zia, T. Taubner, and M. L. Brongersma, “Dielectric metamaterials based on electric and mag-
netic resonances of silicon carbide particles,” Phys. Rev. Lett.99, 107401 (2007).13. L. Jylha, I. Kolmakov, S. Maslovski, and S. Tretyakov, “Modeling of isotropic backward-wave materials com-
posed of resonant spheres,” J. Appl. Phys.99, 043102 (2006).14. N. W. Ashcroft and N. D. Mermin,Solid State Physics(Sanders College Publishing/Harcourt Brace, 1976).15. V. Yannopapas and A. Moroz, “Negative refractive index metamaterials from inherently non-magnetic materials
for deep infrared to terahertz frequency ranges,” J. Phys.: Condens. Matter17, 3717–3734 (2005).16. D. R. Smith and D. Schurig, “Electromagnetic wave propagation in media with indefinite permittivity and per-
meability tensors,” Phys. Rev. Lett.90, 077405 (2003).17. M. A. Noginov, Yu. A. Barnakov, G. Zhu, T. Tumkur, H. Li, and E. E. Narimanov, “Bulk photonic metamaterial
with hyperbolic dispersion,” App. Phys. Lett.94, 151105 (2009).18. M. A. Noginov, Y. A. Barnakov, G. Zhu, T. Tumkur, L. Heng, and E. E. Narimanov, “Bulk metamaterial with
hyperbolic dispersion,” Conference on lasers and electro-optics/International quantum electronics conference,OSA technical digest (CD) (Optical Society of America, 2009), paper JWC2.
19. T. Tumkur, G. Zhu, P. Black, Yu. A. Barnakov, C. E. Bonner, and M. A. Noginov, “Control of spontaneousemission in a volume of functionalized hyperbolic metamaterial,” App. Phys. Lett.99, 151115 (2011).
20. A. Reyes-Coronado, M. F. Acosta, R. I. Merino, V. M. Orera, G. Kenanakis, N. Katsarakis, M. Kafesaki, and C.M. Soukoulis, “Electromagnetic response of anisotropic eutectic metamaterials in THz range,” AIP Conf. Proc.1291, 148–150 (2010).
21. H. Lee, Z. Liu, Y. Xiong, C. Sun, and X. Zhang, “Development of optical hyperlens for imaging below thediffraction limit,” Opt. Express15, 15886–15891 (2007).
22. Z. Liu, H. Lee, Y. Xiong, C. Sun, and X. Zhang, “Far-field optical hyperlens magnifying sub-diffraction-limitedobjects,” Science315, 1686–1686 (2007).
23. Z. Jacob, L. V. Alekseyev, and E. Narimanov, “Optical hyperlens: far-field imaging beyond the diffraction limit,”Opt. Express14, 8247–8256 (2006).
24. A. Salandrino and N. Engheta, “Far-field subdiffraction optical microscopy using metamaterial crystals: theoryand simulations,” Phys. Rev. B74, 075103 (2006).
25. A. Fang, T. Koschny, and C. M. Soukoulis, “Optical anisotropic metamaterials: negative refraction and focusing,”Phys. Rev. B79, 245127 (2009).
26. G. A. Wurtz, W. Dickson, D. O’Connor, R. Atkinson, W. Hendren, P. Evans, R. Pollard, and A. V. Zayats,“Guided plasmonic modes in nanorod assemblies: strong electromagnetic coupling regime,” Opt. Express16,7460–7470 (2008).
27. N. Liu, H. Guo, L. Fu, S. Kaiser, H. Schweizer, and H. Giessen, “Three-dimensional photonic metamaterials atoptical frequencies,” Nat. Mater.7, 31–37 (2008).
28. J. Valentine, S. Zhang, T. Zentgraf, E. Ulin-Avila, D. A. Genov, G. Bartal, and X. Zhang, “Three-dimensionaloptical metamaterial with a negative refractive index,” Nature455, 376–379 (2008).
29. J. K. Gansel, M. Thiel, M. S. Rill, M. Decker, K. Bade, V. Saile, G. von Freymann, S. Linden, and M. Wegener,“Gold helix photonic metamaterial as broadband circular polarizer,” Science325, 1513–1515 (2009).
30. D. B. Burckel, J. R. Wendt, G. A. Ten Eyck, A. R. Ellis, I. Brener, and M. B. Sinclair, “Fabrication of 3D meta-material resonators using self-aligned membrane projection lithography,” Adv. Mater.22, 3171–3175 (2010).
31. C. Rockstuhl, F. Lederer, C. Etrich, T. Pertsch, and T. Scharf, “Design of an artificial three-dimensional compositemetamaterial with magnetic resonances in the visible range of the electromagnetic spectrum,” Phys. Rev. Lett.99, 017401 (2007).
32. V. M. Orera, J. I. Pena, A. Larrea, R. I. Merino, and P. B. Oliete, “Engineered self-organized microstructuresusing directional solidification of eutectics,” Ceramics Trans.225, 185–196 (2011).
33. V. M. Orera and A. Larrea, “NaCl-assisted growth of micrometer-wide long single crystalline fluoride fibres,”Opt. Mater.27, 1726–1729 (2005).
34. D. A. Pawlak, S. Turczynski, M. Gajc, K. Kolodziejak, R. Diduszko, K. Rozniatowski, J. Smalc, and I. Vendik,“How far are we from making metamaterials by self-organization,” Adv. Funct. Mater.20, 1116–1124 (2010).
#161382 - $15.00 USD Received 12 Jan 2012; revised 19 Apr 2012; accepted 23 Apr 2012; published 15 Jun 2012(C) 2012 OSA 18 June 2012 / Vol. 20, No. 13 / OPTICS EXPRESS 14664
35. J. Llorca and V. M. Orera, “Directionally solidified eutectic ceramic oxides,” Prog. Mater. Sci.51, 711–809(2006).
36. V. M. Orera, J. I. Pena, P. B. Oliete, R. I. Merino, and A. Larrea, “Growth of eutectic ceramic structures bydirectional solidification methods,” J. Cryst. Growth (2011), doi:10.1016/j.jcrysgro.2011.11.056.
37. E. D. Palik,Handbook of Optical Constants of Solids(Academic Press Inc., 1985).38. V. M. Orera, A. Larrea, R. I. Merino, M. A. Rebolledo, J. A. Valles, R. Gotor, and J. I. Pena, “Novel photonic
materials made from ionic eutectic compounds,” Acta Phys. Slovaca55, 261–269 (2005).39. A. Larrea and V. M. Orera, “Porous crystal structures obtained from directionally solidified eutectic precursors,”
J. Cryst. Growth300, 387–393 (2007).40. A. Larrea, L. Contreras, R. I. Merino, J. Llorca, and V. M. Orera, “Microstructure and physical properties of
CaF2-MgO eutectics produced by the Bridgman method,” J. Mat. Res.15, 1314–1319 (2000).41. S. Foteinopoulou, M. Kafesaki, E. N. Economou, and C. M. Soukoulis, “Two-dimensional polaritonic photonic
crystals as terahertz uniaxial metamaterials,” Phys. Rev. B84, 035128 (2011).42. J. C. Maxwell Garnett, “Colours in metal glasses and metal films,” Phil. Trans. R. Soc. London Ser. A203,
385–420 (1904).43. A. Sihvola,Metamaterials Handbook. Theory and Phenomena of Metamaterials, F. Capolino, ed. (CRC Press,
2009), Chap. 9.44. A. Kirchner, K. Busch, and C. M. Soukoulis, “Transport properties of random arrays of dielectric cylinders,”
Phys. Rev. B57, 277–288 (1998).45. J. A. Straton,Electromagnetic Theory(Wiley, 2007).46. W. T. Doyle, “Optical properties of a suspension of metal spheres,” Phys. Rev. B39, 9852–9858 (1989).47. R. Ruppin, “Evaluation of extended Maxwell-Garnett theories,” Opt. Commun.182, 273–279 (2000).48. P. A. Belov, R. Marques, S. I. Maslovski, I. S. Nefedov, M. Silveirinha, C. R. Simovski, and S. A. Tretyakov,
“Strong spatial dispersion in wire media in the very large wavelength limit,” Phys. Rev. B67, 113103 (2003).49. K. C. Huang, P. Bienstman, J. D. Joannopoulos, K. A. Nelson, and S. Fan, “Phonon-polariton excitations in
photonic crystals,” Phys. Rev. B68, 075209 (2003).50. K. C. Huang, P. Bienstman, J. D. Joannopoulos, K. A. Nelson, and S. Fan, “Field expulsion and reconfiguration
in polaritonic photonic crystals,” Phys. Rev. Lett.90, 196402 (2003).
1. Introduction
With the recent emerging technology of THz sources, such as Quantum Cascade Lasers (QCL)[1], the possibility of exploring and exploiting the THz regime of the electromagnetic spectrumbecomes more and more appealing. This exploitation is of extreme technological interest as itcan lead to a large variety of potential applications, ranging from tissue imaging [2], securityand sensing [3], communications [4], and even astronomy [5].
The availability of THz radiation sources together with its immense technological potentialapplications highlight the need for THz manipulation components, as polarizers, filters, beamsplitters, collimators, lenses, etc., which can not be achieved using the approaches employed inthe optical regime, due to the non-strong-response of optical materials in the THz domain.
One possibility to overcome this situation is to employ metamaterials operating in the THzregime. Due to the variety of extraordinary electromagnetic properties that metamaterials canpossess (like negative refractive index, backwards propagation, [6] etc.), and the associatedpossibilities that they offer (like, e.g. perfect in principle lensing [7]), along with the possibilityto engineer their electromagnetic properties, can constitute a great tool for the manipulation ofTHz waves.
As it is well known, the main functional component of most of todays metamaterials is metal,and most of the fascinating metamaterial properties and possibilities are based on the negativepermittivity response of the metal, resulting from the resonant free electron currents [8–10].Besides that, it has been proposed that specific metamaterial properties, like artificial mag-netism (leading to negative permeability) and negative refractive index, can be achieved alsousing high-index dielectrics instead of metals [11–13], where the role of the required current isundertaken by the strong displacement current.
A category of materials that can combine both the advantages of the metals and the high indexdielectrics, and moreover, operate in the THz regime, are the so-called polaritonic materials
#161382 - $15.00 USD Received 12 Jan 2012; revised 19 Apr 2012; accepted 23 Apr 2012; published 15 Jun 2012(C) 2012 OSA 18 June 2012 / Vol. 20, No. 13 / OPTICS EXPRESS 14665
[14]. Polaritonic materials are polar crystals where an incident electromagnetic wave can excitelatticevibrations (optical phonons) in the crystal. The coupling of the electromagnetic radiationwith the transverse optical phonons, which occurs in the THz regime, can be described by aresonant electrical permittivity response of Lorenz type, characterized by both strong positiveand negative permittivity regimes. This can make polaritonic materials a perfect replacementof either metals or high index dielectrics in the THz regime. Structuring thus properly suchmaterials, one can achieve metamaterial properties like negative effective permeability [13,15]or negative refractive index [12], and/or manipulate the dispersion of THz waves in uniqueways, exploiting the interplay between material and structure (geometry) resonances.
Among the peculiar metamaterial properties that can be obtained with polaritonic materials,as we show in this work, is a hyperbolic dispersion relation [16–22]. A great possibility of-fered by hyperbolic dispersion relation structures is the possibility to achieve subwavelengthresolution imaging [21–24], and even imaging with magnification [22]. This is based on thefact that hyperbolic dispersion relation does not have an upper limit in the value of the prop-agating wave-numbers that it can support; thus waves that are evanescent in free space (suchwaves carry the finest details of a source object) can couple to propagating waves in the hyper-bolic dispersion structures and transfered without loss to the image plane. Moreover, shapingproperly the dispersion relation in such structures one can lead to negative refraction for thepropagating modes, achieving thus both evanescent and propagating modes convergence at theimage plane.
The typical example of hyperbolic dispersion relation systems is uniaxial anisotropic sys-tems where one of the permittivity (or one of the permeability) components is negative and theothers positive. Such a uniaxial system (known as indefinite medium) can be realized, undercertain conditions, using a two-dimensional periodic system of metallic nanowires or a lay-ered (lamellar) metal-dielectric system (see, e.g. Ref. [25] and refs. there in). Indeed, up tonow, metamaterials with hyperbolic dispersion relation [16–22] have been demonstrated in theoptical regime using metallic nanorod arrays [26] or properly shaped metal-dielectric layers,leading also to imaging with magnification [21,22]. Here we will demonstrate such dispersionin the THz regime using systems of polaritonic rods in a host.
A large obstacle in the current research and applications of metamaterials in THz, is thedifficulty in the fabrication of the required structures, which should be of length scale from mi-crometers to nanometers. The most common todays fabrication approaches are lithographicapproaches, which are time consuming, expensive, and are mainly restricted to planar ge-ometries [27–30]. One promising way to go beyond the restrictions of the lithographic ap-proaches for the creation of THz and optical metamaterials, is to employ self-organization ap-proaches [31–34]. Self-organization approaches are usually simple, inexpensive and can beused for an easy and large scale production. Such a self-organization approach which can beproved extremely suitable for achieving polaritonic metamaterial structures is, as shown inthis work, the directional solidification of eutectic mixtures [32–34]. Using this approach onecan easily obtain self-organized systems of 1D, 2D or 3D symmetry, and of a large variety ofgeometrical patterns of the basic building blocks. Directionally solidified eutectics are compos-ites with fine and homogeneous microstructures fabricated from melt. The microstructure andhence some of the material properties can be controlled by the solidification parameters and itis usually of fibrillar or lamellar morphology [35, 36]. The dimension of the single crystallinephases ranges from hundreds of micrometers to tens of nanometers depending on the growthrate. The volume filing fraction is fixed at the eutectic composition so phase size and interphasespacing are bound magnitudes in eutectics. Alignment along the solidification direction of theconstituent crystalline phases induces anisotropic properties in otherwise isotropic composites.Depending of the materials composing the eutectic mixture (which can include any type of
#161382 - $15.00 USD Received 12 Jan 2012; revised 19 Apr 2012; accepted 23 Apr 2012; published 15 Jun 2012(C) 2012 OSA 18 June 2012 / Vol. 20, No. 13 / OPTICS EXPRESS 14666
material, e.g. metals, magnetic materials, semiconductors etc.), the eutectics directional solid-ification approach can be used for creation of metamaterial microstructures of a rich varietyof shapes and configurations [34], giving many possibilities in the metamaterials fabricationresearch.
In this paper we demonstrate the potential of the eutectics self-organization approach togive two-dimensional (2D) periodic systems of polaritonic rods embedded in a polaritonic hostmaterial, of varying system length scale (rod diameter from tens of microns to sub-micron).Moreover, determining the electromagnetic properties of the systems obtained, both with simu-lations and measurements, we show that part of those systems are characterized by a hyperbolicdispersion relation, which makes them suitable for THz superlensing and sensing applications.The particular polaritonic systems that we demonstrate here are alkali-halide systems made ofLiF rods in KCl host and LiF rods in NaCl host [33].
The paper is organized as follows: In Section 2, we discuss the preparation (fabrication) ofthe eutectic samples along with the main properties of the component materials. In Section 3we present the experimental, computational and theoretical characterization approaches that weuse to analyze the electromagnetic wave propagation in those samples. In Section 4 we presentand discuss the experimental and computational reflection studies of the samples that have beenobtained, and we compare them with results obtained from an effective medium description ofthe samples. Finally, in Section 5 we discuss the hyperbolic dispersion response of the samplesand in Section 6 we present our conclusions.
2. Eutectic metamaterial samples obtained
As was mentioned in the introduction, two different sets of eutectic metamaterial samples werefabricated and studied: Samples of LiF rods in KCl host, where the LiF volume filling fractionis 6.95%, and samples of LiF rods in NaCl, with LiF filling fraction of 25%.
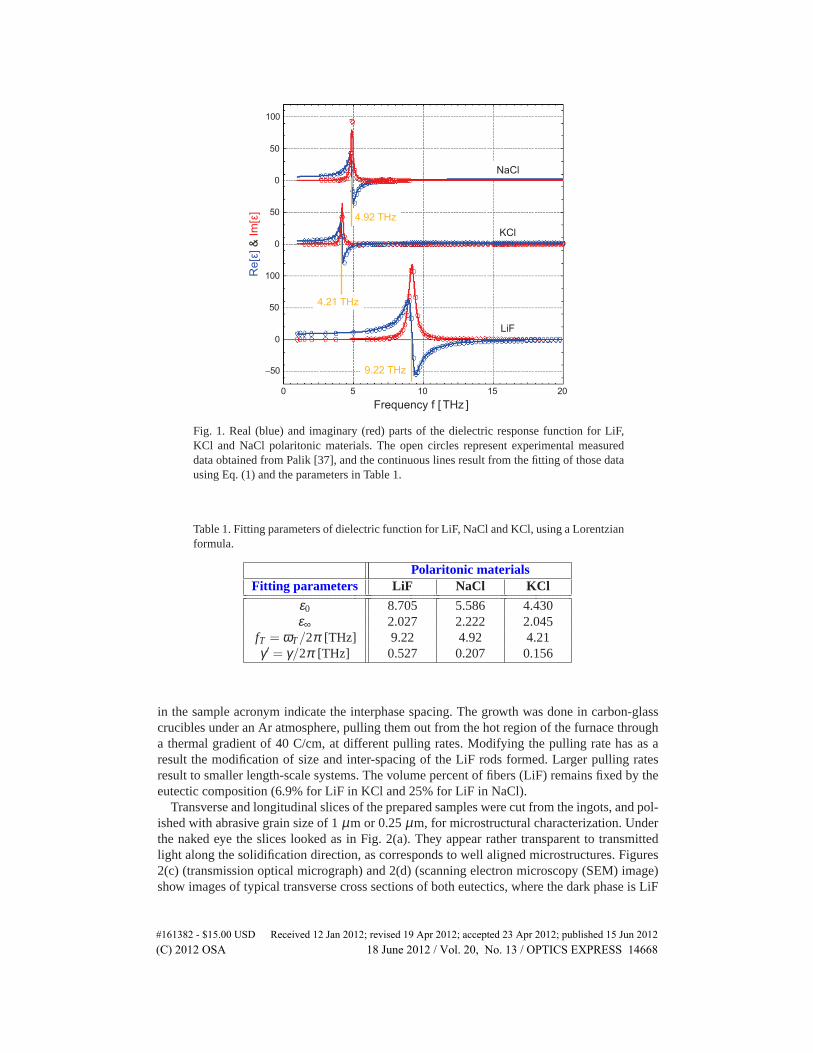
All three polaritonic materials involved in these samples, i.e. LiF, NaCl and KCl, possessphonon-polariton resonances (photon induced excitations of transverse phononic modes withinthe crystal) in the THz region of the electromagnetic spectrum. In Fig. 1 we have plotted boththe real and imaginary parts of the dielectric response function for these three materials at thefrequency regime of the phonon-polariton resonance. The open circles in Fig. 1 represent theexperimental data taken from Palik [37], while the continuous lines represent a fit (using leastsquares method) of the data, using a Lorentzian formula given by
ε(ω) = ε∞ − (ε0− ε∞)ω 2T
ω 2−ω 2T + i ωγ
. (1)
In Eq. (1), ωT is the phonon-polariton resonance frequency, andε∞ and ε0 are the limitingvalues of the dielectric function at frequencies much larger than(ε0 − ε∞)1/2ωT , and at zerofrequency, respectively. The fitting parameters obtained from the fitting procedure for the threematerials are shown in Table 1.
In Fig. 1 we see that LiF possesses a phonon-polariton resonance close to 9 THz (bottomgraph), while for KCl (middle graph) and NaCl (top graph) the phonon-polariton resonancesare at neighboring frequencies: 4.2 THz for KCl and 4.9 THz for NaCl.
2.1. Sample preparation
The eutectic samples were prepared by the directional solidification technique, using the Bridg-man method [33]: 99.98% pure LiF (Alfa Aesar), 99.5% pure KCl (Merk) and 99.99% pureNaCl (Alfa Aesar) were used as starting powders. They were mixed in their eutectic composi-tion: 91 wt% of KCl and 9 wt% of LiF for the LiF rods in KCl (samples named below as LK#),and 71 wt% NaCl and 29 wt% LiF for the LiF in NaCl (samples named LN#). The numbers
#161382 - $15.00 USD Received 12 Jan 2012; revised 19 Apr 2012; accepted 23 Apr 2012; published 15 Jun 2012(C) 2012 OSA 18 June 2012 / Vol. 20, No. 13 / OPTICS EXPRESS 14667
0 5 10 15 20
0
0
0
50
100
−50
50
50
100
9.22 THz
4.21 THz
4.92 THz
LiF
KCl
NaCl
Frequency f [ THz ]
Re
[ε]
& I
m[ε
]
Fig. 1. Real (blue) and imaginary (red) parts of the dielectric response function for LiF,KCl and NaCl polaritonic materials. The open circles represent experimental measureddata obtained from Palik [37], and the continuous lines result from the fitting of those datausing Eq. (1) and the parameters in Table 1.
Table 1. Fitting parameters of dielectric function for LiF, NaCl and KCl, using a Lorentzianformula.
Polaritonic materialsFitting parameters LiF NaCl KCl
ε0 8.705 5.586 4.430ε∞ 2.027 2.222 2.045
fT = ωT/2π [THz] 9.22 4.92 4.21γ ′ = γ/2π [THz] 0.527 0.207 0.156
in the sample acronym indicate the interphase spacing. The growth was done in carbon-glasscruciblesunder an Ar atmosphere, pulling them out from the hot region of the furnace througha thermal gradient of 40 C/cm, at different pulling rates. Modifying the pulling rate has as aresult the modification of size and inter-spacing of the LiF rods formed. Larger pulling ratesresult to smaller length-scale systems. The volume percent of fibers (LiF) remains fixed by theeutectic composition (6.9% for LiF in KCl and 25% for LiF in NaCl).
Transverse and longitudinal slices of the prepared samples were cut from the ingots, and pol-ished with abrasive grain size of 1µm or 0.25µm, for microstructural characterization. Underthe naked eye the slices looked as in Fig. 2(a). They appear rather transparent to transmittedlight along the solidification direction, as corresponds to well aligned microstructures. Figures2(c) (transmission optical micrograph) and 2(d) (scanning electron microscopy (SEM) image)show images of typical transverse cross sections of both eutectics, where the dark phase is LiF
#161382 - $15.00 USD Received 12 Jan 2012; revised 19 Apr 2012; accepted 23 Apr 2012; published 15 Jun 2012(C) 2012 OSA 18 June 2012 / Vol. 20, No. 13 / OPTICS EXPRESS 14668
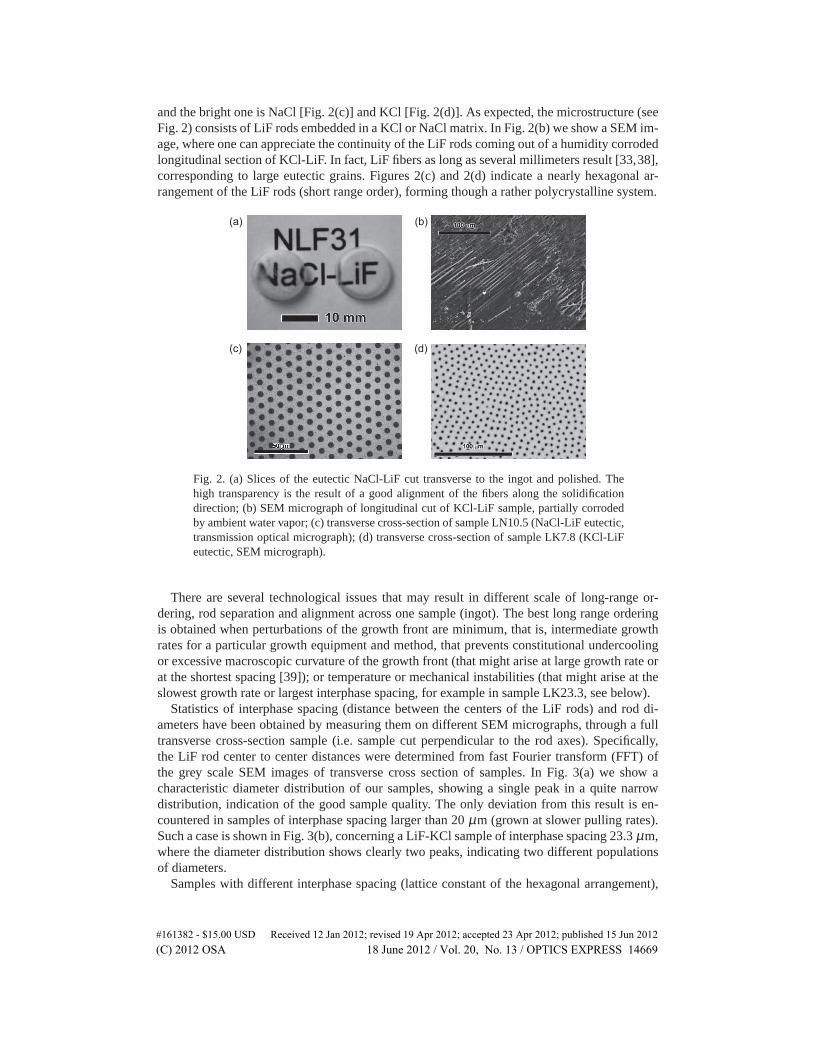
and the bright one is NaCl [Fig. 2(c)] and KCl [Fig. 2(d)]. As expected, the microstructure (seeFig.2) consists of LiF rods embedded in a KCl or NaCl matrix. In Fig. 2(b) we show a SEM im-age, where one can appreciate the continuity of the LiF rods coming out of a humidity corrodedlongitudinal section of KCl-LiF. In fact, LiF fibers as long as several millimeters result [33,38],corresponding to large eutectic grains. Figures 2(c) and 2(d) indicate a nearly hexagonal ar-rangement of the LiF rods (short range order), forming though a rather polycrystalline system.
(a)
(c)
(b)
(d)
Fig. 2. (a) Slices of the eutectic NaCl-LiF cut transverse to the ingot and polished. Thehigh transparency is the result of a good alignment of the fibers along the solidificationdirection; (b) SEM micrograph of longitudinal cut of KCl-LiF sample, partially corrodedby ambient water vapor; (c) transverse cross-section of sample LN10.5 (NaCl-LiF eutectic,transmission optical micrograph); (d) transverse cross-section of sample LK7.8 (KCl-LiFeutectic, SEM micrograph).
There are several technological issues that may result in different scale of long-range or-dering, rod separation and alignment across one sample (ingot). The best long range orderingis obtained when perturbations of the growth front are minimum, that is, intermediate growthrates for a particular growth equipment and method, that prevents constitutional undercoolingor excessive macroscopic curvature of the growth front (that might arise at large growth rate orat the shortest spacing [39]); or temperature or mechanical instabilities (that might arise at theslowest growth rate or largest interphase spacing, for example in sample LK23.3, see below).
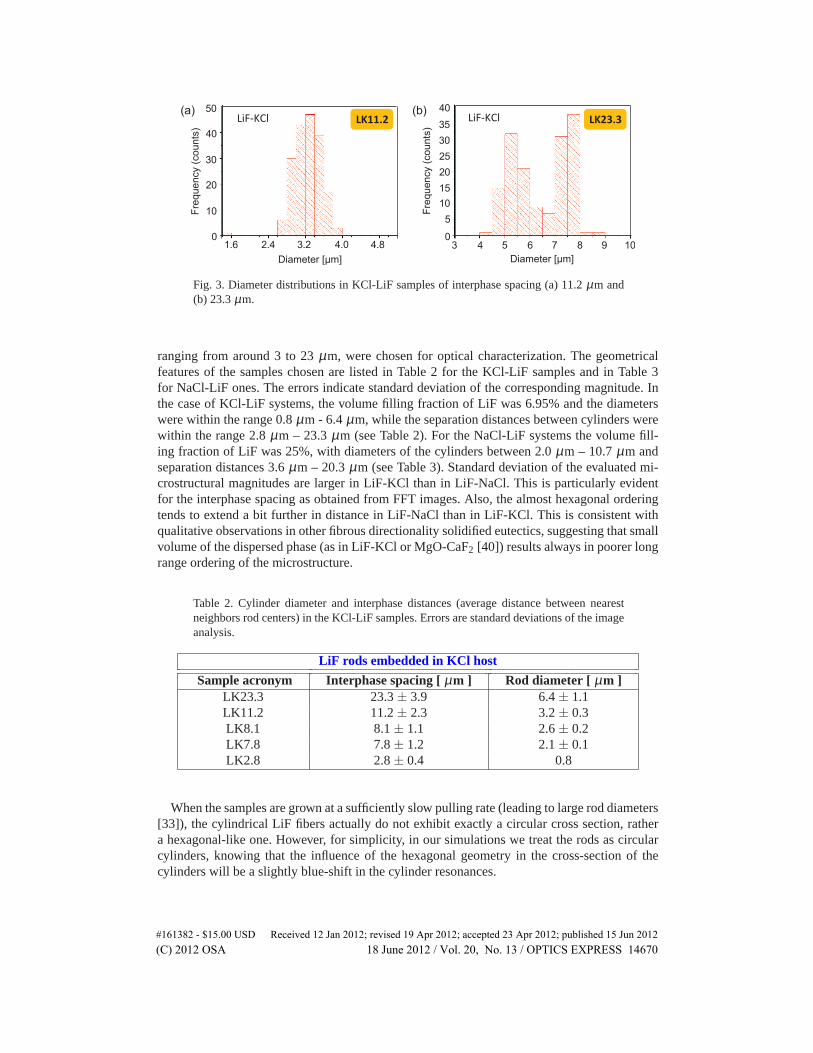
Statistics of interphase spacing (distance between the centers of the LiF rods) and rod di-ameters have been obtained by measuring them on different SEM micrographs, through a fulltransverse cross-section sample (i.e. sample cut perpendicular to the rod axes). Specifically,the LiF rod center to center distances were determined from fast Fourier transform (FFT) ofthe grey scale SEM images of transverse cross section of samples. In Fig. 3(a) we show acharacteristic diameter distribution of our samples, showing a single peak in a quite narrowdistribution, indication of the good sample quality. The only deviation from this result is en-countered in samples of interphase spacing larger than 20µm (grown at slower pulling rates).Such a case is shown in Fig. 3(b), concerning a LiF-KCl sample of interphase spacing 23.3µm,where the diameter distribution shows clearly two peaks, indicating two different populationsof diameters.
Samples with different interphase spacing (lattice constant of the hexagonal arrangement),
#161382 - $15.00 USD Received 12 Jan 2012; revised 19 Apr 2012; accepted 23 Apr 2012; published 15 Jun 2012(C) 2012 OSA 18 June 2012 / Vol. 20, No. 13 / OPTICS EXPRESS 14669
!"#$%&'(
Fre
qu
en
cy (
co
un
ts)
1.6 4.0 2.4 4.8 3.2 0
10
20
30
40
50
!"##$%&(a)
Diameter [µm]
!"#$%&'(
Fre
qu
en
cy (
co
un
ts)
Diameter [µm]
0
5
10
15
20
25
30
35
40
3 4 5 6 7 8 9 10
(b) !"%'$'&
Fig. 3. Diameter distributions in KCl-LiF samples of interphase spacing (a) 11.2µm and(b) 23.3µm.
ranging from around 3 to 23µm, were chosen for optical characterization. The geometricalfeatures of the samples chosen are listed in Table 2 for the KCl-LiF samples and in Table 3for NaCl-LiF ones. The errors indicate standard deviation of the corresponding magnitude. Inthe case of KCl-LiF systems, the volume filling fraction of LiF was 6.95% and the diameterswere within the range 0.8µm - 6.4µm, while the separation distances between cylinders werewithin the range 2.8µm – 23.3µm (see Table 2). For the NaCl-LiF systems the volume fill-ing fraction of LiF was 25%, with diameters of the cylinders between 2.0µm – 10.7µm andseparation distances 3.6µm – 20.3µm (see Table 3). Standard deviation of the evaluated mi-crostructural magnitudes are larger in LiF-KCl than in LiF-NaCl. This is particularly evidentfor the interphase spacing as obtained from FFT images. Also, the almost hexagonal orderingtends to extend a bit further in distance in LiF-NaCl than in LiF-KCl. This is consistent withqualitative observations in other fibrous directionality solidified eutectics, suggesting that smallvolume of the dispersed phase (as in LiF-KCl or MgO-CaF2 [40]) results always in poorer longrange ordering of the microstructure.
Table 2. Cylinder diameter and interphase distances (average distance between nearestneighbors rod centers) in the KCl-LiF samples. Errors are standard deviations of the imageanalysis.
LiF rods embedded in KCl host
Sample acronym Interphase spacing [µm ] Rod diameter [ µm ]LK23.3 23.3± 3.9 6.4± 1.1LK11.2 11.2± 2.3 3.2± 0.3LK8.1 8.1± 1.1 2.6± 0.2LK7.8 7.8± 1.2 2.1± 0.1LK2.8 2.8± 0.4 0.8
When the samples are grown at a sufficiently slow pulling rate (leading to large rod diameters[33]), the cylindrical LiF fibers actually do not exhibit exactly a circular cross section, rathera hexagonal-like one. However, for simplicity, in our simulations we treat the rods as circularcylinders, knowing that the influence of the hexagonal geometry in the cross-section of thecylinders will be a slightly blue-shift in the cylinder resonances.
#161382 - $15.00 USD Received 12 Jan 2012; revised 19 Apr 2012; accepted 23 Apr 2012; published 15 Jun 2012(C) 2012 OSA 18 June 2012 / Vol. 20, No. 13 / OPTICS EXPRESS 14670
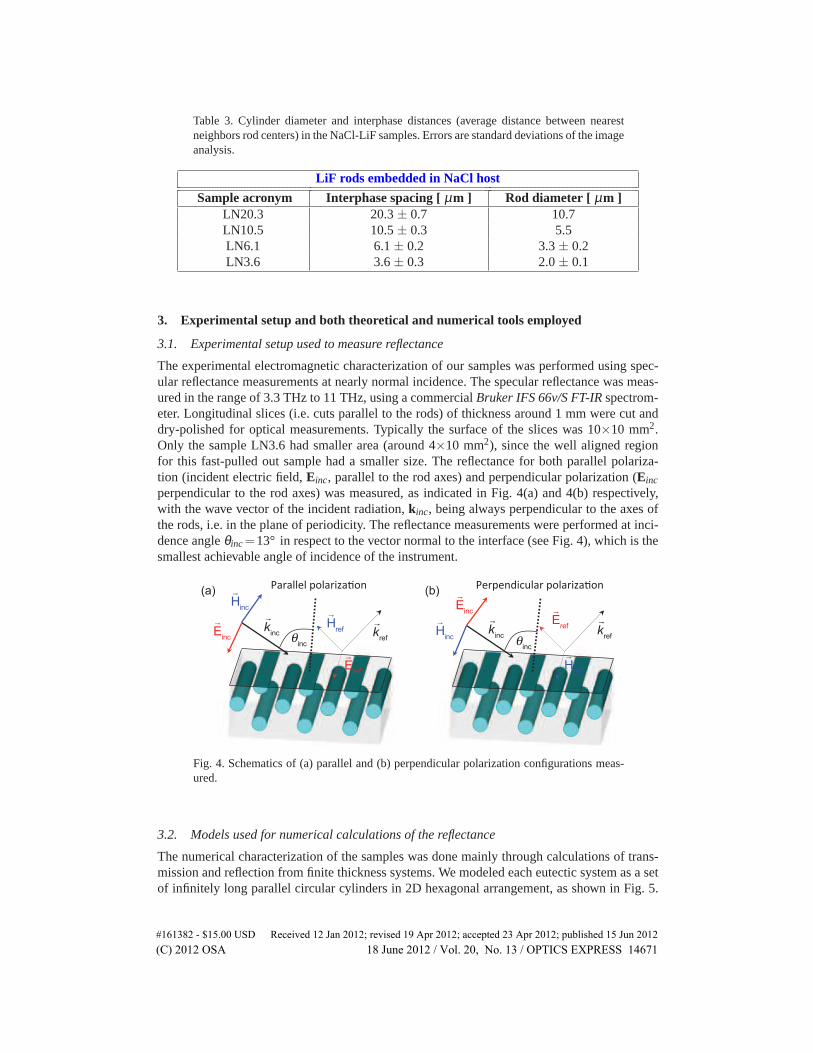
Table 3. Cylinder diameter and interphase distances (average distance between nearestneighborsrod centers) in the NaCl-LiF samples. Errors are standard deviations of the imageanalysis.
LiF rods embedded in NaCl host
Sample acronym Interphase spacing [µm ] Rod diameter [ µm ]LN20.3 20.3± 0.7 10.7LN10.5 10.5± 0.3 5.5LN6.1 6.1± 0.2 3.3± 0.2LN3.6 3.6± 0.3 2.0± 0.1
3. Experimental setup and both theoretical and numerical tools employed
3.1. Experimental setup used to measure reflectance
The experimental electromagnetic characterization of our samples was performed using spec-ular reflectance measurements at nearly normal incidence. The specular reflectance was meas-ured in the range of 3.3 THz to 11 THz, using a commercialBruker IFS 66v/S FT-IRspectrom-eter. Longitudinal slices (i.e. cuts parallel to the rods) of thickness around 1 mm were cut anddry-polished for optical measurements. Typically the surface of the slices was 10×10 mm2.Only the sample LN3.6 had smaller area (around 4×10 mm2), since the well aligned regionfor this fast-pulled out sample had a smaller size. The reflectance for both parallel polariza-tion (incident electric field,Einc, parallel to the rod axes) and perpendicular polarization (Einc
perpendicular to the rod axes) was measured, as indicated in Fig. 4(a) and 4(b) respectively,with the wave vector of the incident radiation,k inc, being always perpendicular to the axes ofthe rods, i.e. in the plane of periodicity. The reflectance measurements were performed at inci-dence angleθinc=13° in respect to the vector normal to the interface (see Fig. 4), which is thesmallest achievable angle of incidence of the instrument.
(a) (b)
rH
ref
rE
ref
rk
ref
rk
inc
rH
inc
rE
inc
θ
inc θ
inc
rH
ref
rE
ref
rk
ref
rk
inc
rE
inc
rH
inc
!"#"$$%$&'($"#)*"+(, !%#'%,-)./$"#&'($"#)*"+(,
Fig. 4. Schematics of (a) parallel and (b) perpendicular polarization configurations meas-ured.
3.2. Models used for numerical calculations of the reflectance
The numerical characterization of the samples was done mainly through calculations of trans-mission and reflection from finite thickness systems. We modeled each eutectic system as a setof infinitely long parallel circular cylinders in 2D hexagonal arrangement, as shown in Fig. 5.
#161382 - $15.00 USD Received 12 Jan 2012; revised 19 Apr 2012; accepted 23 Apr 2012; published 15 Jun 2012(C) 2012 OSA 18 June 2012 / Vol. 20, No. 13 / OPTICS EXPRESS 14671

We considered propagation in the plane of periodicity (i.e. in the plane perpendicular to thecylinder axes) and we calculated the transmission and reflection under normal incidence, forboth parallel and perpendicular polarization [see Fig. 5(a)]. The calculations were performedusing the commercial softwareCST Microwave Studio, which solves numerically Maxwellequations in both time- and frequency-domain, employing the Finite Integration Techniquebased on the space and time discretization of Maxwell’s equations in their integral form.
(b)
rE
inc
rH
inc
rk
inc
rE
inc
rH
inc
rk
inc
!"#"$$%$&
&'($"#)*"+(,
!%#'%,-)./$"#&
&'($"#)*"+(,
(a) 0%1)2),3,)4%&5654%1&(7&.6$),-%#5
!"
!"
!"
!!" "
rk
inc
0)1/$"4%-&5654%1
Fig. 5. (a) Sketch of the model for the eutectic metamaterial system used in numerical cal-culations.The cylinders were considered as LiF circular rods with hexagonal arrangement,embedded either in KCl or NaCl host. (b) A transverse cut of the computational cell em-ployed in most of the calculations presented here. The cell consists of 7 unit cells alongpropagation direction, while periodic boundary conditions along the other directions havebeen considered.a is the unit cell size (lattice constant) andd is the rod diameter.
The dielectric functions used to characterize rods and hosts during the calculations were thefitted Lorentzian expressions given by Eq. (1), with fitting parameters those of Table 1.
For each polarization and sample studied, we performed simulations modifying the lengthof the computational cell along propagation direction, to guarantee convergence of the resultsassuring that they represent correctly the behavior of an optically thick system. The results pre-sented here have been obtained for a system of seven unit cells along propagation direction (ΓKdirection of the hexagonal lattice), as shown in Fig. 5(b), while periodic boundary conditionsalong the other directions have been employed.
3.3. Analytical model: effective medium approach
The idea beneath an effective medium approach is to remove the highly oscillating electro-magnetic fields inside a system by a suitable averaging procedure, and thus replacing the inho-mogeneous system by a homogeneous one characterized by effective response functions. Suchan approach is extremely useful in the electromagnetic characterization of metamaterials, as itcan give a simple way to characterize and understand the behavior and the possibilities of eachparticular system.
The validity though of such approach is guaranteed only in the limit of low filling fractionof the scattering units comprising the system or in the long wavelength limit compared to theinter-spacing of these scattering units, where strong multiple scattering and diffraction of thewaves is quite restricted. The precise frequency regime where these conditions are fulfilled forany particular system is not easy to be identified and it is highly dependent on the system itself(component materials, filling fractions, etc.).
#161382 - $15.00 USD Received 12 Jan 2012; revised 19 Apr 2012; accepted 23 Apr 2012; published 15 Jun 2012(C) 2012 OSA 18 June 2012 / Vol. 20, No. 13 / OPTICS EXPRESS 14672
A useful approach to identify the applicability of effective medium descriptions for uniaxialanisotropicsystems, as the ones discussed here, has been proposed recently in Ref. [41], wherea couple of conditions, related with the insensitivity of the effective material parameters fromthe system thickness and propagation direction, have been provided. An important result of Ref.[41] for uniaxial anisotropic systems is that once these conditions are fullfilled for polarizationpurely perpendicular and for polarization purely parallel, then the validity of homogeneouseffective medium description for arbitrary polarization and propagation direction is ensured.
In this work, we test the validity of homogeneous effective medium description for our sam-ples when the propagation is in the plane of periodicity, for both perpendicular and parallelpolarization. The effective medium description that we employ when the electric field (E) isperpendicular to the cylinders axes is the well known Maxwell Garnett model, suitable fordispersed particles inside a matrix [42, 43]. The Maxwell Garnett formula for the effective di-electric response function in two dimensions is given by
ε⊥eff(ω) = εhost(ω)(1+ϕ)εcyl(ω)+(1−ϕ)εhost(ω)
(1−ϕ)εcyl (ω)+(1+ϕ)εhost(ω), (2)
whereϕ is the volume filling fraction of the cylinders, andεhostandεcyl are the permittivities ofthe host and the cylinders, respectively. WhenE is parallel to the cylinder axes, the appropriateformula for the effective dielectric function is the average dielectric function [44], given by
ε ||eff(ω) = ϕ εcyl (ω)+(1−ϕ)εhost(ω). (3)
The way to test the validity of the above response functions in our systems is to examine if thesefunctions can reproduce the reflection characteristics obtained from the experiment and thesimulations. Once ensured the applicability of these particular effective medium models in oursystems, we can further use these models to predict propagation and dispersion characteristicswhich are of particular merit for metamaterial applications.
4. Electromagnetic characterization results and discussion
Using the approaches described in the previous section, we measured and calculated the re-flectance from the two different sets of eutectic metamaterials obtained: LiF rods embedded ina KCl matrix, with LiF filling fraction of 6.95% (five different samples), and LiF rods embeddedin a NaCl matrix (four different samples), with LiF filling fraction of 25%.
4.1. Reflectance from KCl-LiF eutectic metamaterial systems
In Fig. 6 we present the reflection results obtained for the LiF rods in KCl samples LK11.2,LK8.1, LK7.8 and LK2.8 (see details of each sample in Table 2). We report the analysis ofsample LK23.3 separately, since this sample differs from the others in the sense that its diameterdistribution show clearly two peaks [see Fig. 3(b)].
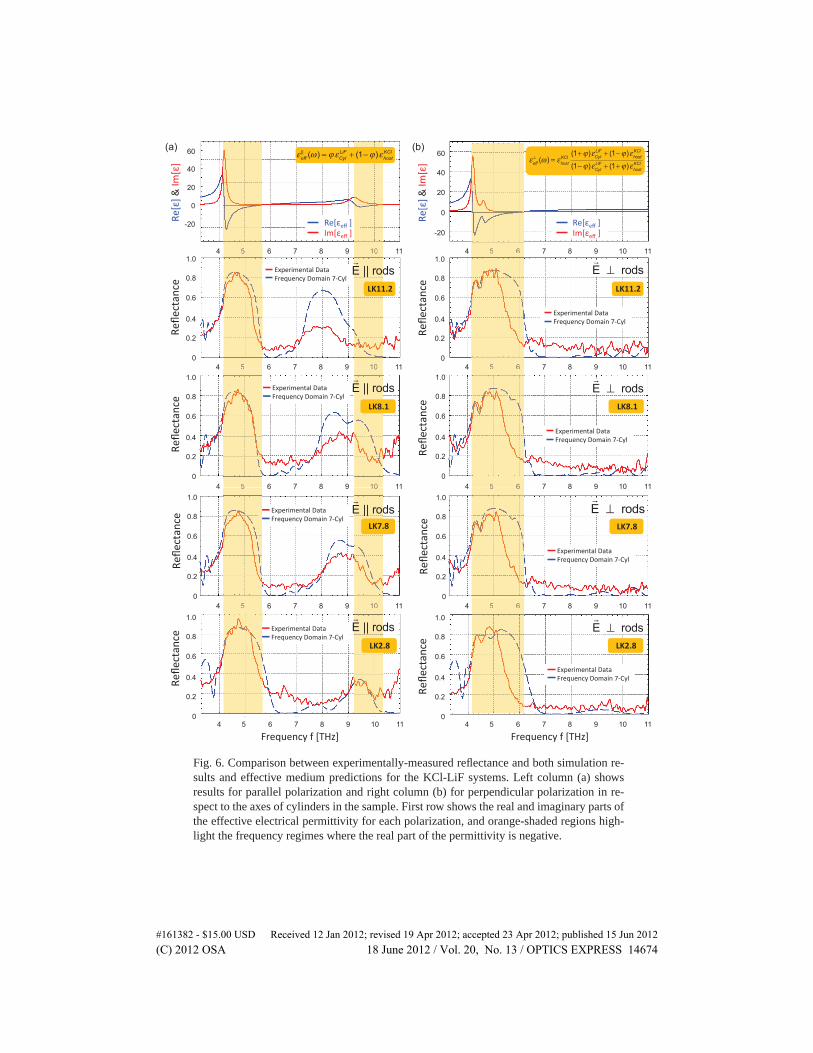
In Fig. 6 we have split the results into two columns. The left column corresponds to par-allel polarization in respect to the axes of cylinders, while the right column to perpendicularpolarization. On top of each column we show a plot of the effective electrical permittivity as afunction of frequency, both real (blue) and imaginary (red) parts, corresponding to each polar-ization case (obtained from Eq. (2) for the right column and Eq. (3) for the left column). Wehave indicated with an orange-shaded region the frequency region where the real part of theeffective dielectric permittivity is negative for each polarization, which is the frequency rangewhere one expects to have large reflectivity from the samples.
For parallel polarization (left column), we see two separate regions where Re[ε] < 0: around5 THz and around 10 THz. The lower-frequency region corresponds to the reflectance due to
#161382 - $15.00 USD Received 12 Jan 2012; revised 19 Apr 2012; accepted 23 Apr 2012; published 15 Jun 2012(C) 2012 OSA 18 June 2012 / Vol. 20, No. 13 / OPTICS EXPRESS 14673
!"#$%#&'()*)+,-./)!"#$%#&'()*)+,-./)
0#1#'23&'#)
0#1#'23&'#)
εeff
⊥ (ω ) = εhost
KCl(1+ϕ)ε
Cyl
LiF+ (1−ϕ)ε
host
KCl
(1−ϕ)εCyl
LiF+ (1+ϕ)ε
host
KCl
0#+4/)5)67+4/))
rE ⊥ rods
0
0.2
0.4
0.6
0.8
1.0
0
-20
60
40
20
0#1#'23&'#)
0#+4/)5)67+4/))
0#1#'23&'#)
0
0.2
0.4
0.6
0.8
1.0 4 6 8 10 5 7 9 11
0
-20
60
40
20
0
0.2
0.4
0.6
0.8
1.0
0
0.2
0.4
0.6
0.8
1.0
0#1#'23&'#)
0#1#'23&'#)
0
0.2
0.4
0.6
0.8
1.0
0
0.2
0.4
0.6
0.8
1.0
0#1#'23&'#)
0#1#'23&'#)
0
0.2
0.4
0.6
0.8
1.0
0
0.2
0.4
0.6
0.8
1.0
rE ⊥ rods
rE ⊥ rods
rE ⊥ rods
0#+4#8)/)
67+4#8)/)
!"##$%&
!"'$#&
9:;#"<7#&23=)>323)
!"#$%#&'()>?73<&)@AB(=)
!"($'&
!"%$'&
4 6 8 10 5 7 9 11
4 6 8 10 5 7 9 11 4 6 8 10 5 7 9 11
4 6 8 10 5 7 9 11 4 6 8 10 5 7 9 11
4 6 8 10 5 7 9 11 4 6 8 10 5 7 9 11
4 6 8 10 5 7 9 11 4 6 8 10 5 7 9 11
0#+4#8)/)
67+4#8)/)
9:;#"<7#&23=)>323)
!"#$%#&'()>?73<&)@AB(=)
9:;#"<7#&23=)>323)
!"#$%#&'()>?73<&)@AB(=)
9:;#"<7#&23=)>323)
!"#$%#&'()>?73<&)@AB(=)
9:;#"<7#&23=)>323)
!"#$%#&'()>?73<&)@AB(=)
9:;#"<7#&23=)>323)
!"#$%#&'()>?73<&)@AB(=)
9:;#"<7#&23=)>323)
!"#$%#&'()>?73<&)@AB(=)
9:;#"<7#&23=)>323)
!"#$%#&'()>?73<&)@AB(=)
65
6655
6655
6655
5
55
55
55
10
1010
1010
1010
!"'$#&
!"($'&
!"%$'&
!"##$%&
ε
eff
|| (ω ) = ϕ εCyl
LiF+ (1−ϕ)ε
host
KCl
rE || rods
rE || rods
rE || rods
rE || rods
(a) (b)
Fig. 6. Comparison between experimentally-measured reflectance and both simulation re-sultsand effective medium predictions for the KCl-LiF systems. Left column (a) showsresults for parallel polarization and right column (b) for perpendicular polarization in re-spect to the axes of cylinders in the sample. First row shows the real and imaginary parts ofthe effective electrical permittivity for each polarization, and orange-shaded regions high-light the frequency regimes where the real part of the permittivity is negative.
#161382 - $15.00 USD Received 12 Jan 2012; revised 19 Apr 2012; accepted 23 Apr 2012; published 15 Jun 2012(C) 2012 OSA 18 June 2012 / Vol. 20, No. 13 / OPTICS EXPRESS 14674
the KCl matrix, while the higher-frequency region is due to the contribution of the LiF rods.For the perpendicular polarization (right column), we observe that Maxwell Garnett formulapredicts Re[ε] < 0 in a single broader frequency region, from 4.2 THz up to 6.2 THz, with apeak at around 4.5 THz, where Re[ε] is less negative and the losses are smaller than those forsmaller frequencies.
In Fig. 6, below the effective permittivity plots, we show both the measured and simulatedreflectance for each sample, as a function of frequency. We have superimposed to the experi-mental reflectance plot (shown in red and measured at an incidence angle of 13°), in each caseand for both polarizations, the results from the simulations (shown in dash-blue and obtainedat normal incidence).
As a general trend, we see that for all samples in parallel-polarization configuration (leftcolumn) there is a very good agreement between the positions of the measured reflectancepeaks with the simulated ones. Moreover, there is a good agreement in the low-frequency high-reflectance regime (centered around 5 THz) between the prediction of the effective medium for-mula and both the experimental and simulation results. However, this simple effective mediummodel predicts accurately the position of the second reflectance peak, coming from the cylin-ders, only in the case of the smaller lattice constant sample, LK2.8. For samples with largerlattice constant, the prediction of the effective medium model becomes less and less accurate,as the second reflectance peak appears at lower frequencies. This inaccuracy does not signifythough failure of the samples to be described as homogeneous effective media but rather thefailure of the particular effective medium approach employed. The reason is that this particu-lar model (average permittivity and Maxwell Garnett approach) has been obtained in the limitwherekhostR,kcylRandkeffRare all much smaller than unity (kdenotes the wavenumber in eachmaterial andR the cylinder radius). In this limit the main contribution to the cylinder scatteringin the parallel polarization case is the isotropic scattering term (of zero angular momentum)and no cylinder resonance exists in frequencies below the LiF polaritonic-resonance frequency( fT = 9.22 THz).
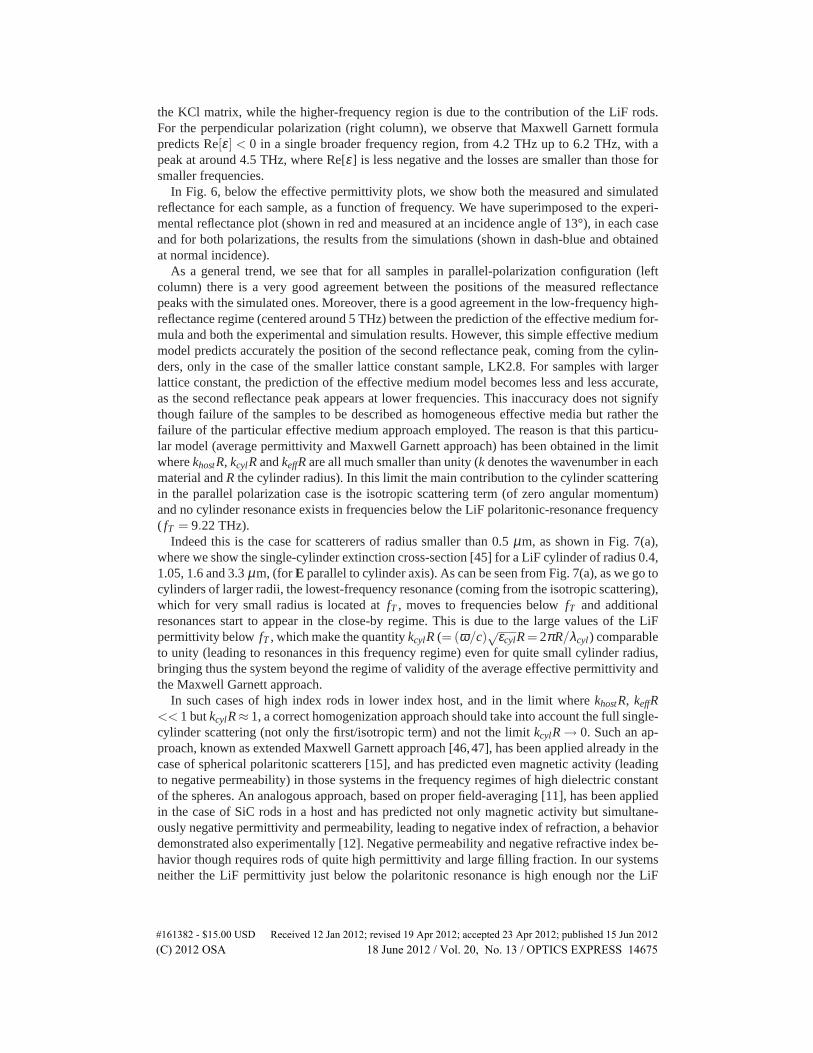
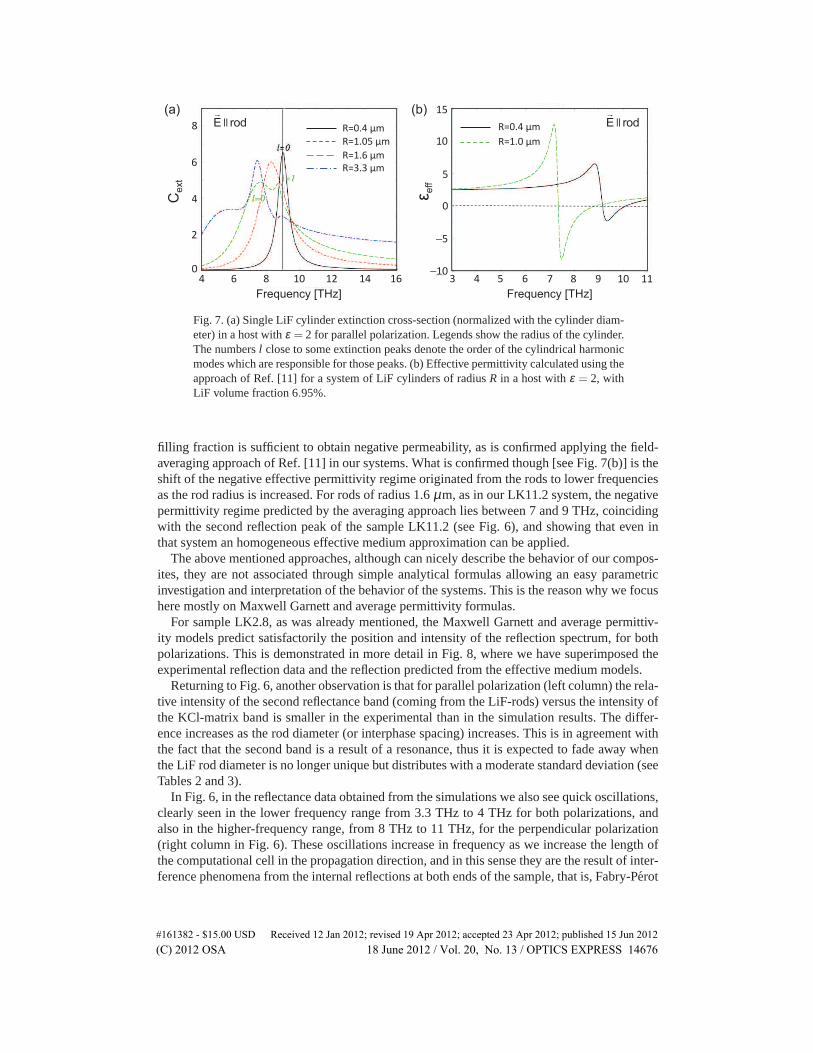
Indeed this is the case for scatterers of radius smaller than 0.5µm, as shown in Fig. 7(a),where we show the single-cylinder extinction cross-section [45] for a LiF cylinder of radius 0.4,1.05, 1.6 and 3.3µm, (forE parallel to cylinder axis). As can be seen from Fig. 7(a), as we go tocylinders of larger radii, the lowest-frequency resonance (coming from the isotropic scattering),which for very small radius is located atfT , moves to frequencies belowfT and additionalresonances start to appear in the close-by regime. This is due to the large values of the LiFpermittivity below fT , which make the quantitykcylR(= (ω/c)
√εcylR= 2πR/λcyl) comparableto unity (leading to resonances in this frequency regime) even for quite small cylinder radius,bringing thus the system beyond the regime of validity of the average effective permittivity andthe Maxwell Garnett approach.
In such cases of high index rods in lower index host, and in the limit wherekhostR, keffR<< 1 butkcylR≈ 1, a correct homogenization approach should take into account the full single-cylinder scattering (not only the first/isotropic term) and not the limitkcylR→ 0. Such an ap-proach, known as extended Maxwell Garnett approach [46,47], has been applied already in thecase of spherical polaritonic scatterers [15], and has predicted even magnetic activity (leadingto negative permeability) in those systems in the frequency regimes of high dielectric constantof the spheres. An analogous approach, based on proper field-averaging [11], has been appliedin the case of SiC rods in a host and has predicted not only magnetic activity but simultane-ously negative permittivity and permeability, leading to negative index of refraction, a behaviordemonstrated also experimentally [12]. Negative permeability and negative refractive index be-havior though requires rods of quite high permittivity and large filling fraction. In our systemsneither the LiF permittivity just below the polaritonic resonance is high enough nor the LiF
#161382 - $15.00 USD Received 12 Jan 2012; revised 19 Apr 2012; accepted 23 Apr 2012; published 15 Jun 2012(C) 2012 OSA 18 June 2012 / Vol. 20, No. 13 / OPTICS EXPRESS 14675
rE || rod
rE || rod
Frequency [THz] Frequency [THz]
εe
ff
!"
!"
!"
!"
!"
!" !" !" !"# !"# !"# !"# !" !" !" !" !" !" !""!" !"#
!"
!"#
!"#
!−"#
!−"
!"
!"#$%&'(&
!")$#*&'(&
!")$+&'(&
!",$,&'(&
!"#$%&'(&
!")$#&'(&
Ce
xt
(a) (b)
Fig. 7. (a) Single LiF cylinder extinction cross-section (normalized with the cylinder diam-eter)in a host withε = 2 for parallel polarization. Legends show the radius of the cylinder.The numbersl close to some extinction peaks denote the order of the cylindrical harmonicmodes which are responsible for those peaks. (b) Effective permittivity calculated using theapproach of Ref. [11] for a system of LiF cylinders of radiusR in a host withε = 2, withLiF volume fraction 6.95%.
filling fraction is sufficient to obtain negative permeability, as is confirmed applying the field-averaging approach of Ref. [11] in our systems. What is confirmed though [see Fig. 7(b)] is theshift of the negative effective permittivity regime originated from the rods to lower frequenciesas the rod radius is increased. For rods of radius 1.6µm, as in our LK11.2 system, the negativepermittivity regime predicted by the averaging approach lies between 7 and 9 THz, coincidingwith the second reflection peak of the sample LK11.2 (see Fig. 6), and showing that even inthat system an homogeneous effective medium approximation can be applied.
The above mentioned approaches, although can nicely describe the behavior of our compos-ites, they are not associated through simple analytical formulas allowing an easy parametricinvestigation and interpretation of the behavior of the systems. This is the reason why we focushere mostly on Maxwell Garnett and average permittivity formulas.
For sample LK2.8, as was already mentioned, the Maxwell Garnett and average permittiv-ity models predict satisfactorily the position and intensity of the reflection spectrum, for bothpolarizations. This is demonstrated in more detail in Fig. 8, where we have superimposed theexperimental reflection data and the reflection predicted from the effective medium models.
Returning to Fig. 6, another observation is that for parallel polarization (left column) the rela-tive intensity of the second reflectance band (coming from the LiF-rods) versus the intensity ofthe KCl-matrix band is smaller in the experimental than in the simulation results. The differ-ence increases as the rod diameter (or interphase spacing) increases. This is in agreement withthe fact that the second band is a result of a resonance, thus it is expected to fade away whenthe LiF rod diameter is no longer unique but distributes with a moderate standard deviation (seeTables 2 and 3).
In Fig. 6, in the reflectance data obtained from the simulations we also see quick oscillations,clearly seen in the lower frequency range from 3.3 THz to 4 THz for both polarizations, andalso in the higher-frequency range, from 8 THz to 11 THz, for the perpendicular polarization(right column in Fig. 6). These oscillations increase in frequency as we increase the length ofthe computational cell in the propagation direction, and in this sense they are the result of inter-ference phenomena from the internal reflections at both ends of the sample, that is, Fabry-Perot
#161382 - $15.00 USD Received 12 Jan 2012; revised 19 Apr 2012; accepted 23 Apr 2012; published 15 Jun 2012(C) 2012 OSA 18 June 2012 / Vol. 20, No. 13 / OPTICS EXPRESS 14676
resonances. This was confirmed by modifying slightly the total length of the computational cellandexamining the change in the spectral position of those oscillations.
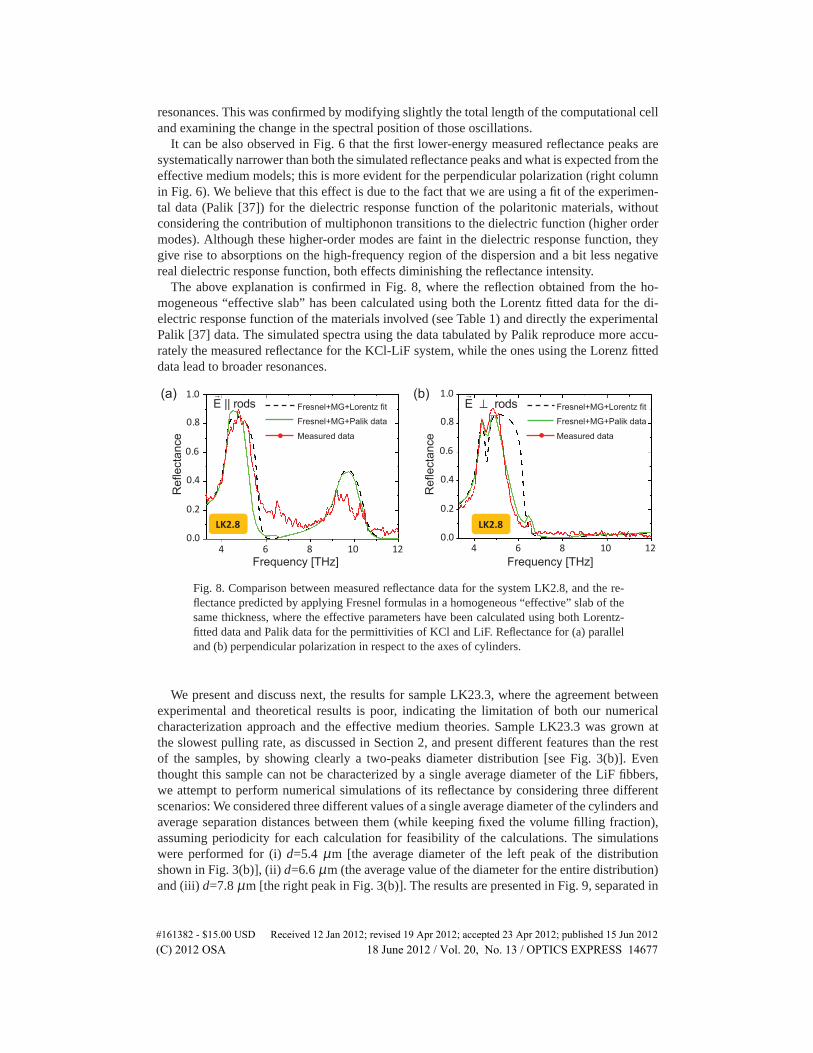
It can be also observed in Fig. 6 that the first lower-energy measured reflectance peaks aresystematically narrower than both the simulated reflectance peaks and what is expected from theeffective medium models; this is more evident for the perpendicular polarization (right columnin Fig. 6). We believe that this effect is due to the fact that we are using a fit of the experimen-tal data (Palik [37]) for the dielectric response function of the polaritonic materials, withoutconsidering the contribution of multiphonon transitions to the dielectric function (higher ordermodes). Although these higher-order modes are faint in the dielectric response function, theygive rise to absorptions on the high-frequency region of the dispersion and a bit less negativereal dielectric response function, both effects diminishing the reflectance intensity.
The above explanation is confirmed in Fig. 8, where the reflection obtained from the ho-mogeneous “effective slab” has been calculated using both the Lorentz fitted data for the di-electric response function of the materials involved (see Table 1) and directly the experimentalPalik [37] data. The simulated spectra using the data tabulated by Palik reproduce more accu-rately the measured reflectance for the KCl-LiF system, while the ones using the Lorenz fitteddata lead to broader resonances.
!"#$%&
rE || rods
rE ⊥ rods
!"#$%&
Fresnel+MG+Lorentz fit
Fresnel+MG+Palik data
Measured data •
Fresnel+MG+Lorentz fit
Fresnel+MG+Palik data
Measured data •
Re
fle
cta
nce
!"."
!".#
!".#
!".#
!".#
!".#
!"."
!".#
!".#
!".#
!".#
!".#
Re
fle
cta
nce
!" !" !" !"# !"#
Frequency [THz] !" !" !" !"# !"#
Frequency [THz]
(a) (b)
Fig. 8. Comparison between measured reflectance data for the system LK2.8, and the re-flectancepredicted by applying Fresnel formulas in a homogeneous “effective” slab of thesame thickness, where the effective parameters have been calculated using both Lorentz-fitted data and Palik data for the permittivities of KCl and LiF. Reflectance for (a) paralleland (b) perpendicular polarization in respect to the axes of cylinders.
We present and discuss next, the results for sample LK23.3, where the agreement betweenexperimental and theoretical results is poor, indicating the limitation of both our numericalcharacterization approach and the effective medium theories. Sample LK23.3 was grown atthe slowest pulling rate, as discussed in Section 2, and present different features than the restof the samples, by showing clearly a two-peaks diameter distribution [see Fig. 3(b)]. Eventhought this sample can not be characterized by a single average diameter of the LiF fibbers,we attempt to perform numerical simulations of its reflectance by considering three differentscenarios: We considered three different values of a single average diameter of the cylinders andaverage separation distances between them (while keeping fixed the volume filling fraction),assuming periodicity for each calculation for feasibility of the calculations. The simulationswere performed for (i)d=5.4 µm [the average diameter of the left peak of the distributionshown in Fig. 3(b)], (ii)d=6.6µm (the average value of the diameter for the entire distribution)and (iii) d=7.8µm [the right peak in Fig. 3(b)]. The results are presented in Fig. 9, separated in
#161382 - $15.00 USD Received 12 Jan 2012; revised 19 Apr 2012; accepted 23 Apr 2012; published 15 Jun 2012(C) 2012 OSA 18 June 2012 / Vol. 20, No. 13 / OPTICS EXPRESS 14677
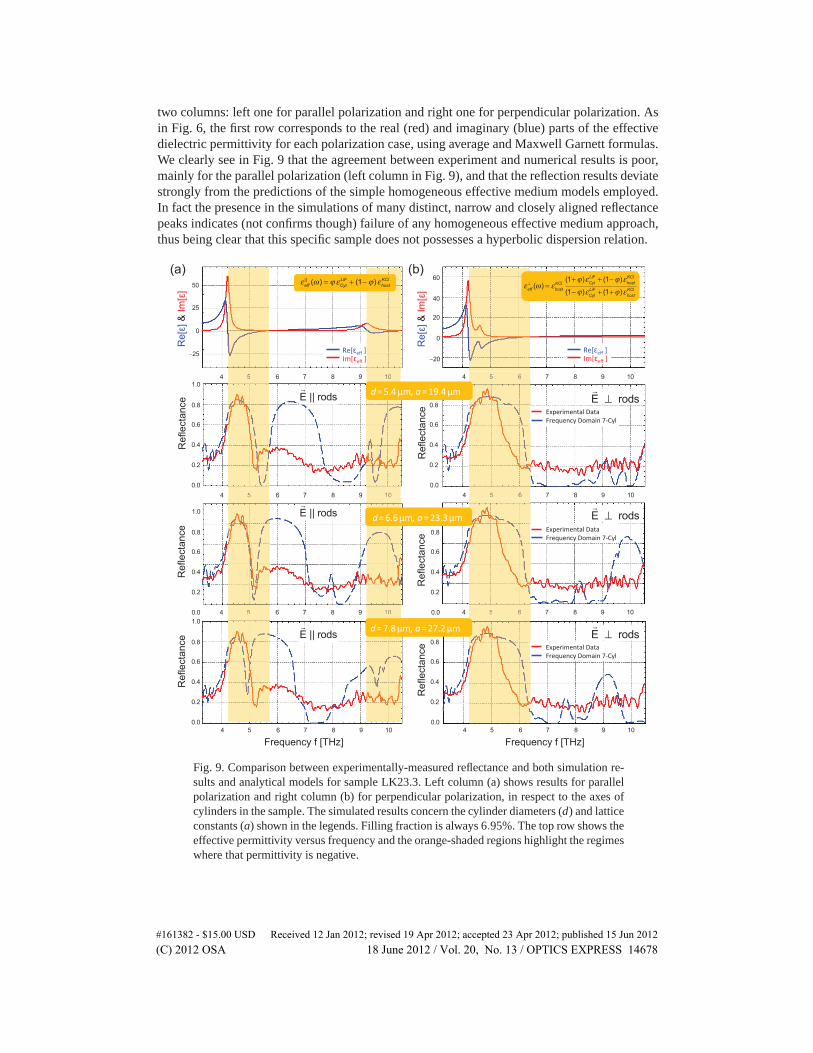
two columns: left one for parallel polarization and right one for perpendicular polarization. Asin Fig. 6, the first row corresponds to the real (red) and imaginary (blue) parts of the effectivedielectric permittivity for each polarization case, using average and Maxwell Garnett formulas.We clearly see in Fig. 9 that the agreement between experiment and numerical results is poor,mainly for the parallel polarization (left column in Fig. 9), and that the reflection results deviatestrongly from the predictions of the simple homogeneous effective medium models employed.In fact the presence in the simulations of many distinct, narrow and closely aligned reflectancepeaks indicates (not confirms though) failure of any homogeneous effective medium approach,thus being clear that this specific sample does not possesses a hyperbolic dispersion relation.
!"#ε"$%&
'(#ε"$%&%
Re
[ε] &
Im
[ε]
Re
[ε] &
Im
[ε]
0
−25
25
50
0
−20
20
60
40
Re
fle
cta
nce
rE || rods
Re
fle
cta
nce
0.0
0.2
0.4
0.6
0.8
1.0
0.0
0.2
0.4
0.6
0.8
1.0
4 5 7 10 6 8 9
Re
fle
cta
nce
rE || rods
0.0
0.2
0.4
0.6
0.8
1.0
Re
fle
cta
nce
0.0
0.2
0.4
0.6
0.8
1.0
rE ⊥ rods
rE ⊥ rods
Re
fle
cta
nce
rE || rods
Re
fle
cta
nce
0.0
0.2
0.4
0.6
0.8
1.0
0.0
0.2
0.4
0.6
0.8
1.0
rE ⊥ rods
Frequency f [THz] Frequency f [THz]
4 5 7 10 6 8 9
4 5 7 10 6 8 9 4 5 7 10 6 8 9
4 5 7 10 6 8 9 4 5 7 10 6 8 9
4 5 7 10 6 8 9 4 5 7 10 6 8 9
!"#ε"$%&
'(#ε"$%&%
)*+",-("./01%20/0%
3,"45".67%28(0-.%9:;71
)*+",-("./01%20/0%
3,"45".67%28(0-.%9:;71
)*+",-("./01%20/0%
3,"45".67%28(0-.%9:;71
5
5
5
10
10
10
&%
5 6
5 6
5 6
εeff
⊥ (ω ) = εhost
KCl(1+ϕ)ε
Cyl
LiF+ (1−ϕ)ε
host
KCl
(1−ϕ)εCyl
LiF+ (1+ϕ)ε
host
KCl
!"<"=>?"@(#"$"<"AB>?"@(""
!"<"C>C"@(#"$"<"DE>E"@(""
!"<"9>F"@(#"$"<"D9>D"@(""
ε
eff
|| (ω ) = ϕ εCyl
LiF+ (1−ϕ)ε
host
KCl
(a) (b)
Fig. 9. Comparison between experimentally-measured reflectance and both simulation re-sultsand analytical models for sample LK23.3. Left column (a) shows results for parallelpolarization and right column (b) for perpendicular polarization, in respect to the axes ofcylinders in the sample. The simulated results concern the cylinder diameters (d) and latticeconstants (a) shown in the legends. Filling fraction is always 6.95%. The top row shows theeffective permittivity versus frequency and the orange-shaded regions highlight the regimeswhere that permittivity is negative.
#161382 - $15.00 USD Received 12 Jan 2012; revised 19 Apr 2012; accepted 23 Apr 2012; published 15 Jun 2012(C) 2012 OSA 18 June 2012 / Vol. 20, No. 13 / OPTICS EXPRESS 14678

4.2. Reflectance from NaCl-LiF eutectic metamaterial systems
Themain difference between the NaCl-LiF systems and the KCl-LiF systems discussed here, isin the volume filling fraction of the LiF rods; while in the NaCl-LiF case the LiF filling fractionis 25%, for KCl-LiF case it is close to 7%. This implies that, since the separation distancesbetween neighboring cylinders are similar to the KCl-LiF case, the diameters of the cylindersare larger in the NaCl-LiF case (see Tables 2 and 3).
The study of the NaCl-LiF systems is summarized in Fig. 10, where we show together theexperimental and simulated (usingMicrowave Studio) reflection data for four representativesamples: LN20.3, LN10.5, LN6.1 and LN3.6.
In the first row of Fig. 10 we have also included the effective dielectric response functionof the system, obtained through Eqs. (3) and (2), indicating with an orange-shaded region thefrequency regimes where Re[ε] < 0 for both parallel and perpendicular polarizations, in respectto the axes of the cylinders. For a direct comparison of the reflection results with the effectivemedium predictions, we have added in the last row of Fig. 10 the reflection from a thick “ef-fective” homogeneous slab (green line), with the effective parameters obtained through Eqs.(3) and (2), using in this case the LiF and NaCl permittivities directly (without fit) from Palikdata [37].
As a general trend, we see that both experimental and simulated reflectance show a morecomplicated spectral dependence than in the KCl-LiF system. For parallel polarization and forsamples LN10.5, LN6.1 and LN3.6 (third, fourth and fifth rows in left column in Fig. 10), wehave reasonable agreement between the experimental reflection peak coming from the matrixmaterial (peak at around 5.2 THz) and the simulated data. For the smaller-scale samples we alsosee good agreement of the reflection with what is expected from the effective medium models.
For the larger-scale samples, the polydispersity in the rod diameters and in the orientation ofthe polycrystals in the samples, results in the elimination (smoothing out) of the narrow-bandreflection characteristics in the experimental data, observed in the simulations.
As in the KCl-LiF system case, we also see here the Fabry-Perot interference phenomenonsuperimposed in the simulated results for both polarizations. Another similarity between thetwo systems is that systematically the experimental peaks are narrower than the simulated ones.We believe that the explanation is what it was mentioned before for the KCl-LiF case, i.e. dueto the fact that we are using a fit of the dielectric response function for both NaCl and LiFpolaritonic materials, and this fit does not reproduce accurately the permittivity in the regimeswhere Re[ε] ≈ 0.
5. Polaritonic systems as indefinite media
In the previous section we have presented the reflectance spectra (experimental and simulated)from slabs of the eutectic systems KCl-LiF and NaCl-LiF. These alkali-halide eutectics presenta hexagonal arrangement of aligned LiF rods (of 6.95% volume filling fraction in the KCl ma-trix and 25% in the NaCl matrix), with varying lattice parameter. We also showed that the effec-tive medium model represented by Eqs. (2) and (3) (Maxwell Garnett and average permittivitymodel) predicts reasonably well, both in band position and relative intensity, the reflectancespectra for the samples with the smaller length-scale (like samples LK2.8 and LN3.6) for bothpolarizations in respect to the axes of the rods. Moreover, according to the theoretical resultspresented in Ref. [41], the effective parameters obtained through Eqs. (2) and (3) are indepen-dent of the angle of incidence and therefore they constitute a valid effective medium descriptionof those samples. Thus these eutectic samples will be fully described by an effective permittiv-
#161382 - $15.00 USD Received 12 Jan 2012; revised 19 Apr 2012; accepted 23 Apr 2012; published 15 Jun 2012(C) 2012 OSA 18 June 2012 / Vol. 20, No. 13 / OPTICS EXPRESS 14679

4 5 7 10 6 8 9 11
Re
[ε]
& I
m[ε
]
Re
[ε]
& I
m[ε
]
0
−20
40
80
20
60
Re
fle
cta
nce
rE || rods
rE ⊥ rods
Re
fle
cta
nce
Re
fle
cta
nce
rE || rods
Re
fle
cta
nce
rE ⊥ rods
0.0
0.2
0.4
0.6
0.8
1.0
0.0
0.2
0.4
0.6
0.8
1.0
Re
fle
cta
nce
rE || rods
Re
fle
cta
nce
rE ⊥ rods
0.0
0.2
0.4
0.6
0.8
1.0
0.0
0.2
0.4
0.6
0.8
1.0
Frequency f [THz]
Re
fle
cta
nce
Frequency f [THz]
0.0
0.2
0.4
0.6
0.8
1.0
0.0
0.2
0.4
0.6
0.8
1.0
rE || rods
Re
fle
cta
nce
rE ⊥ rods
0.0
0.2
0.4
0.6
0.8
1.0
0.0
0.2
0.4
0.6
0.8
1.0
!"#$%"&$'
()#$%"&$'$
0
−20
40
80
20
60
*+,"-.)"/012$3101$
4.)"$35)1./$6$782$
*+,"-.)"/012$3101$
9-":;"/<8$35)1./$6$782$
9-"=/"2>?@>A12.B$3101$
*+,"-.)"/012$3101$
9-":;"/<8$35)1./$6$782$
9-"=/"2>?@>A12.B$3101$
5 6
s
s
s
s
ds
ds
ds
10 1
*+,"-.)"/012$3101$
4.)"$35)1./$6$782
4 5 7 10 6 8 9 11
4 5 7 10 6 8 9 11 4 5 7 10 6 8 9 11
4 5 7 10 6 8 9 11 4 5 7 10 6 8 9 11
4 5 7 10 6 8 9 11 4 5 7 10 6 8 9 11
4 5 7 10 6 8 9 11 4 5 7 10 6 8 9 11
!"#$%&'
!"(%)'
!"&%('
!"#$%"&$'
()#%"&$'$
!")$%*'
!"(%)'
!"&%('
!"#$%&'
!")$%*'
*+,"-.)"/012$3101$
4.)"$35)1./$6$782$
*+,"-.)"/012$3101$
4.)"$35)1./$6$782$
*+,"-.)"/012$3101$
4.)"$35)1./$6$782$
*+,"-.)"/012$3101$
4.)"$35)1./$6$782$
*+,"-.)"/012$3101$
4.)"$35)1./$6$782$
76
76
76
76
*+,"
4.)"
εeff
⊥ (ω ) = εhost
KCl(1+ϕ)ε
Cyl
LiF+ (1−ϕ)ε
host
KCl
(1−ϕ)εCyl
LiF+ (1+ϕ)ε
host
KCl ε
eff
|| (ω ) = ϕ εCyl
LiF+ (1−ϕ)ε
host
KCl
(a) (b)
Fig. 10. Comparison between experimentally-measured reflectance and both simulation re-sultsand analytical models for the LiF rods in NaCl host systems. Left column (a) showsresults for parallel polarization and right column (b) for perpendicular polarization, in re-spect to the axes of the rods in the sample. In both cases the propagation is in the planeof periodicity. First row shows the real and imaginary parts of the effective dielectric per-mittivity for each polarization. The orange-shaded regions highlight the negative effectivepermittivity regimes.
#161382 - $15.00 USD Received 12 Jan 2012; revised 19 Apr 2012; accepted 23 Apr 2012; published 15 Jun 2012(C) 2012 OSA 18 June 2012 / Vol. 20, No. 13 / OPTICS EXPRESS 14680

ity tensor of the form
ε⊥eff 0 00 ε⊥eff 0
0 0 ε ||eff
(4)
and dispersion relations,ω(k),
ε⊥effω2
c2 = k2x +k2
y +k2z,
ω2
c2 =k2
x +k2y
ε ||eff
+k2
z
ε⊥eff
(5)
for the ordinary (left equation) and the extraordinary (right equation) wave, respectively (con-sidering the cylinder axes along ˆz-direction).
In Fig. 11 we replot the real part of the effective permittivity tensor componentsε⊥eff andε ||eff(obtained from Eqs. (2) and (3)) as a function of frequency, for both systems: Fig. 11(a) forKCl-LiF and Fig. 11(b) for NaCl-LiF.
Re[ε
eff ]
4 6 8 10 12
0
−10
−20
10
20
30
rE || Rods
rE ⊥ Rods
Frequency f [ THz ] 4 6 8 10 12
0
−20
20
40
Re[ε
eff ]
Frequency f [ THz ]
rE || Rods
rE ⊥ Rods
(b) (a)
Fig. 11. Effective dielectric response function for (a) KCl-LiF system and (b) NaCl-LiFsystem,as a function of frequency, for both polarizations: parallel and perpendicular to theaxes of the LiF cylinders.
For the KCl-LiF case [Fig. 11(a)], the orange-shaded region at around 10 THz denotes therange of frequencies where the dielectric function is negative forE parallel to the rods (metal-like behavior), while it is positive forE perpendicular to the rods (dielectric behavior). In thisregion thus, the sample will behave as an anisotropic uniaxial medium with a negative permittiv-ity component (indefinite medium), and thus it will be characterized by a hyperbolic dispersionrelation. Hyperbolic dispersion relation, as was discussed in the introduction, gives great possi-bilities for subwavelength imaging applications. Such a dispersion relation has been discussedand realized so far only in the case of metallodielectric systems, while it has been discussedonly recently [41] and not realized at all in the case of polaritonic systems.
Polaritonic systems offer a natural and easy way to achieve hyperbolic dispersion relationin the THz and far-infrared part of the electromagnetic spectrum, avoiding the strong spatial-dispersion effects [48], that one has to face in analogous systems made of metallic components(spatial dispersion effects act detrimentally to the hyperbolic dispersion relation). Moreover,in polaritonic composites one can achieve, in the same system, frequency regimes of negative(effective) permittivity, of very high permittivity values and/or of regular permittivity, and boththe permittivity values and the associated frequency regimes can be tuned by changing the rodsize, giving thus unique possibilities for dispersion engineering. For example, for the case ofFig. 6, when the diameter of the cylinder is increased the negative permittivity regime whichis at∼ 9.5 THz in sample LK2.8 is shifted downwards. The shift is as large as 1.5 THz goingfrom the sample LK2.8 to the sample LK11.2 (diameter from 0.8µm to 3.2µm – see Table 2).
#161382 - $15.00 USD Received 12 Jan 2012; revised 19 Apr 2012; accepted 23 Apr 2012; published 15 Jun 2012(C) 2012 OSA 18 June 2012 / Vol. 20, No. 13 / OPTICS EXPRESS 14681
In the NaCl-LiF system [Fig. 11(b)] the situation is even more rich: We see that there aretwo frequency regions satisfying the criteria Re[ε ||eff] < 0 and Re[ε⊥eff] > 0 (a narrow one from5.3 to 5.7 THz, and a broader one from 9.2 THz up to around 12 THz – both highlighted withorange-shaded region) and one region where Re[ε⊥eff] < 0 and Re[ε ||eff] > 0 (5.8 – 7.5 THz), of-fering thus great possibilities to tune the hyperbolic dispersion both in shape and frequency.This way, besides highly controlled superlensing, one can achieve other peculiar optical phe-nomena [41, 49, 50] like low-loss propagation, strong field confinement or expulsion, angledependent polarization, frequency dependent propagation direction allowing the realization ofbeam splitters, etc., combined with the possibility to study or achieve many different opticalresponses using the same system.
6. Conclusions
In this work, using eutectics directional solidification, we have fabricated polaritonic eutecticsystems made of LiF rods periodically placed in KCl and NaCl hosts, with varying systemlattice size. These eutectic systems have been characterized experimentally and investigatedtheoretically, and it was shown that most of them behave as indefinite media (anisotropic uni-axial media with a negative permittivity component) in the THz regime and that the spectralrange where this effect appears can be tailored by more than 1.5 THz, by selecting the appro-priate lattice parameter for the eutectic (growth conditions). This opens the field for the searchof other eutectic systems that provide different spectral windows and phenomenology.
Acknowledgments
Authors would like to acknowledge fruitful discussions with Dr. Thomas Koschny, as wellas the financial support by EU under the project NMP4-SL-2008-213669-ENSEMBLE. MFAalso acknowledges financial support of the Ministerio de Educacion (Spain) under the FPUscholarship program and ARC acknowledges financial support of Consejo Nacional de Cienciay Tecnologıa (Mexico).
#161382 - $15.00 USD Received 12 Jan 2012; revised 19 Apr 2012; accepted 23 Apr 2012; published 15 Jun 2012(C) 2012 OSA 18 June 2012 / Vol. 20, No. 13 / OPTICS EXPRESS 14682