
Self-organising agent communities for autonomic …seis.bris.ac.uk/~sb15704/papers/342217.pdf ·...
67
Self-organising agent communities for autonomic resource management Mariusz Jacyno* Institute of Control and Computational Engineering, University of Zielona G´ ora, 65-246 Zielona G´ ora, Poland Seth Bullock School of Electronics & Computer Science, University of Southampton, SO17 1BJ, UK Nicholas Geard Melbourne School of Population Health, University of Melbourne, Victoria 3010 Australia Terry R. Payne Department of Computer Science, University of Liverpool, L69 3BX, UK Michael Luck Department of Informatics, King’s College London, WC2R 2LS, UK August 20, 2012 *Corresponding author: Mariusz Jacyno, Tel: +48683282422, Fax: +446832484751, [email protected], University of Zielona G´ ora ul. Prof. Z. Szafrana 2 65-246 Zielona G´ ora. Running title: “Self-organising communities” 1
Transcript of Self-organising agent communities for autonomic …seis.bris.ac.uk/~sb15704/papers/342217.pdf ·...

Self-organising agent communities for autonomic
resource management
Mariusz Jacyno*Institute of Control and Computational Engineering,
University of Zielona Gora, 65-246 Zielona Gora, Poland
Seth BullockSchool of Electronics & Computer Science,University of Southampton, SO17 1BJ, UK
Nicholas GeardMelbourne School of Population Health,
University of Melbourne, Victoria 3010 Australia
Terry R. PayneDepartment of Computer Science,
University of Liverpool, L69 3BX, UK
Michael LuckDepartment of Informatics,
King’s College London, WC2R 2LS, UK
August 20, 2012
*Corresponding author: Mariusz Jacyno, Tel: +48683282422, Fax: +446832484751,[email protected], University of Zielona Gora ul. Prof. Z. Szafrana2 65-246 Zielona Gora.
Running title: “Self-organising communities”
1

Abstract
The autonomic computing paradigm addresses the operational chal-lenges presented by increasingly complex software systems by propos-ing that they be composed of many autonomous components, eachresponsible for the run-time reconfiguration of its own dedicated hard-ware and software components. Consequently, regulation of the wholesoftware system becomes an emergent property of local adaptation andlearning carried out by these autonomous system elements. Design-ing appropriate local adaptation policies for the components of suchsystems remains a major challenge. This is particularly true wherethe system’s scale and dynamism compromise the efficiency of a cen-tral executive and/or prevent components from pooling informationto achieve a shared, accurate evidence base for their negotiations anddecisions.
In this paper, we investigate how a self-regulatory system responsemay arise spontaneously from local interactions between autonomicsystem elements tasked with adaptively consuming/providing compu-tational resources or services when the demand for such resources iscontinually changing. We demonstrate that system performance is notmaximised when all system components are able to freely share in-formation with one another. Rather, maximum efficiency is achievedwhen individual components have only limited knowledge of their peers.Under these conditions, the system self-organises into appropriate com-munity structures. By maintaining information flow at the level ofcommunities, the system is able to remain stable enough to efficientlysatisfy service demand in resource-limited environments, and thus min-imise any unnecessary reconfiguration whilst remaining sufficiently adap-tive to be able to reconfigure when service demand changes.
Keywords: Autonomic computing, networks, self-organisation, commu-nity structure, decentralised control, emergence.
2
1 Introduction
Modern software systems are among the most complex human artefacts thathave been developed to date (Bullock and Cliff, 2004; Gershenson and Hey-lighen, 2005). Contemporary information systems depend on an increasingnumber of software modules, processing platforms, data sources, networkconnections, and input/output devices, to the extent that it is becomingimpossible to predict or control their interactions. Both the scale and inter-connectivity of IT systems are increasing as a consequence of their evolution,from stand-alone machines to systems of systems (comprising huge numbersof distributed and interacting components) working to provide resources ondemand to a large number of users (Tanenbaum and Renesse, 1985; For-rest et al., 2005). Although modular architectures offer opportunities totackle increasing system complexity by decomposing the overall system intospecialised components, they also present challenges in terms of the main-tenance of reliable and predictable operation when system objectives andstructure are subject to exogenous and unpredictable change.
Consequently, it is not surprising that, several years ago, IBM releaseda manifesto1 arguing that the main obstacle to further progress in the ITindustry was a looming complexity crisis that would prevent reliable andcost-effective human administration of large-scale IT systems. In response,an autonomic computing approach was proposed, where IT systems would becapable of automatically regulating their own function (Kephart and Chess,2003). Large-scale autonomic computing systems were expected to comprisemyriads of computational elements, each acting, learning or evolving au-tonomously in response to interactions with other components in their localenvironment (Zambonelli and Parunak, 2001). System-level self-regulationwould then arise as a product of these local adaptations and interactions be-tween system elements, thereby reducing the need for manual managementand control.
While the autonomic computing paradigm offered an alternative perspec-tive on large-scale computational systems, it also presented novel challengesin understanding and managing their performance. Large-scale IT systemscan easily become too complex to be managed through a ‘divide and rule’analysis (Bonabeau, 2002). When a system’s global behaviour results fromhighly non-linear interactions between many system components, the rela-tionship between the actions of individual autonomous agents and the sys-tem level consequences of those actions can become opaque and extremely
1http://www.research.ibm.com/autonomic/manifesto/autonomic computing.pdf
3

sensitive (Heylighen, 1991; Hogg and Huberman, 2002; Zambonelli et al.,2002). In addition to the issue of scale, autonomic systems are necessarilyopen, in that they are free to gain and lose components over time in an en-vironment that is dynamic and unpredictable in terms of user demand, andwhere few a priori assumptions can be made (De Roure, 2003; Estrin et al.,2002; Keil and Goldin, 2004). In general, managing such systems is perhapsmore akin to regulating financial markets or managing a firm, rather thansupervising a local area network or traditional computer cluster.
In this paper we address the central real-world problem confronted bythe autonomic computing paradigm: ensuring that large numbers of compu-tational resources are efficiently configured and allocated in order to satisfyuser demand that varies in both kind and quantity. We do so by buildingand exploring an agent-based model at a reasonably large scale (hundredsof interacting agents). We respect some key physical realities, e.g., inter-actions between components take real time and any information availableto system components must be gathered, stored, and processed explicitly.However, we choose not to model a specific real-world case or application.Rather we present a relatively simple, generic model encapsulating a rangeof properties shared across information-driven autonomic systems consistingof a large number of autonomous and locally communicating elements. Indoing so we focus on the role of information flows in maintaining efficientperformance. As such, the model is intended to have heuristic value forthe science and engineering of large-scale complex IT systems. In takingthis approach we are adopting a well-established and explicitly recognisedscientific modelling strategy in which realism is sacrificed to some extent inreturn for a combination of generality and precision (Levins, 1966).
More specifically, we investigate how an autonomic system’s regulatoryresponse can arise from local interactions between its elements. We presenta decentralised multi-agent system in which provider agents are tasked withadaptively configuring the services that they offer, and efficiently allocatingthese services to the consumer agents that require them. The co-adaptive in-teraction between these two groups of agents is governed by simple thresholdreinforcement mechanisms and localised exchange of information betweeneach agent and its local peers. An evaluation of this approach demonstratesthat when peer neighbourhoods are an appropriate size, they may exhibitself-organising behaviour resulting in the emergence of spontaneous com-munity structures that support the requirements of their members. Whatdistinguishes this regime is not just the extent to which information flowsamongst system components, but the underlying organisation of these com-ponents and their interactions. This organisation can be described in terms
4

of an emergent and dynamic topology of interaction that regulates and con-strains the flow of information but is simultaneously brought about by thisflow. Our main contribution is to show that it is only when the right topol-ogy is achieved and maintained (perhaps requiring continuous or periodicreorganisation) that system elements exert appropriate constraints on infor-mation flow such that efficient, ongoing system performance can be achieved.
The paper is organised as follows: a description of the related work onautonomic computing, multi-agent systems and self-organising systems ispresented in Section 2, which also provides the motivation and inspiration forthe design of the resultant model (Section 3). The model is then evaluatedin Section 4, and the strengths, limitations and implications of this modelare discussed. The paper concludes in Section 5.
2 Related Work
2.1 Autonomic Computing
Autonomic systems are dynamic and complex; not only may their work-flow characteristics undergo change, but the business processes that theysupport will be continually evolving. Such systems require administrationat multiple levels and on a continual basis in order to preserve their cor-rect operation. At a low level, dynamically changing user demand mustbe met through continual allocation and reallocation of computational re-sources. At a higher level, reconfiguration of workflows, business processes,and hardware facilities is also required. For this reason, the reconfigurationof system components and their functions is unavoidable and requires a flex-ible approach that maintains system efficiency despite dynamic conditions.As suggested by IBM in their manifesto, as these systems increase in scale,managing them through skilled human administration becomes impracticaland autonomic solutions are required.
Much of the current research in the area of autonomic computing has ad-dressed the problem of preserving the interoperation of existing IT systems’software modules, often encapsulating their functions in terms of autonomicmanagers. Techniques such as reinforcement learning (Kephart et al., 2007;Tesauro, 2007), optimal control theory (Wang et al., 2007), and maximisa-tion of expected utility (Kephart and Das, 2007) are then exploited in orderto balance power-performance trade-offs, i.e., to achieve efficient allocationsof requested jobs at the same time as optimising the power consumption ofunused servers.
Two kinds of control architecture tend to be employed: centralised and
5

distributed ; both of which are illustrated schematically in Figure 1. Cen-tralised schemes rely on a central executive to co-allocate services, scheduleand plan system behaviour, etc. In contrast, distributed control schemesemploy distributed protocols and focus on the design of intelligent paral-lel algorithms for coordinating the behaviour of agents. One example of acentralised system can be found in work by Tesauro (2007). Here, each appli-cation manager was responsible for the performance throttling of a managedserver, and they shared expected utility information with a central resourcearbiter. This central node then computed an optimal allocation of serversto the applications. A more distributed approach was adopted by Kephartet al. (2007) where both performance and power managers conducted theirdecisions based on full information about the state of parameters that definethe actual functioning of individual servers.
Whilst these mechanisms are somewhat decentralised, they generallyassume that up-to-date information is freely available. Thus, in order toconverge on an optimal solution, such schemes require each agent to possessor have immediate access to a substantial amount of accurate and up-to-date global system information, resulting in the need for a large number ofinteractions in order to maintain awareness of peer goals, actions, etc. Forexample, although in Kephart et al. (2007) all resource allocating agentscomputed the optimal allocation (thus avoiding a single arbiter), they allhad access to shared state information and the same environment variablesindicating current system demand.
Although acting on shared global information allows autonomous systemelements to make well-informed decisions in principle, it has been shown thatin some cases it may lead to inefficiency and loss of stability. The El FarolBar problem (Arthur, 1994) demonstrates that instability can emerge whenindependent, rational agents all have access to the same, global information.Arthur introduced the El Farol Bar problem as a game-theoretic exampleof the challenge facing rational agents that wish to organise themselves effi-ciently on the basis of shared information. In this game, every player wantsto visit a specific bar only if less than 60% of the population also wish tovisit the same bar — and they must make their decision without collabora-tion or negotiation. A rational agent that weighs up all of the evidence anddecides, on balance, to visit the bar would also reasonably conclude thatall other players will reach the same conclusion, since every other player isalso a rational agent with access to the same information. In this case, theplayer should reverse its decision, as it does not want to attend a bar that iscrowded with every other player. However, it should also reason that everyother rational player would rationalise the same reversal, and so on.
6
Note that this problem can be refined in many ways and many differ-ent “solutions” to it can be sought (Challet and Zhang, 1997; Savit et al.,1999). Here we are not interested in solving the El Farol Bar problem, butrather using it as a reminder that shared information does not necessarilyimprove the co-ordination of decentralised decision making. In fact, the ElFarol quandary rests on two symmetries: (i) every agent employs the samedecision-making mechanism; and (ii) every agent reasons on the basis ofthe same information. Both these symmetries are typically true of the col-laborative, decentralised agent systems used to explore coalition formation(Shehory and Kraus, 1998), group problem solving (Stone and Veloso, 2000)and teamwork (Pynadath and Tambe, 2002).
Collecting and processing the up-to-date information required by cen-tralised or distributed control can also become a significant problem inlarge-scale deployments due to the time-delays associated with obtaininglarge amounts of distributed information. As a consequence, systems rely-ing on either centralised or distributed control schemes (Figures 1a and 1b)are often vulnerable to increasing system scale and/or dynamism (Durfee,2001).
[Figure 1 about here.]
2.2 Biological Analogies
While it is commonplace within multi-agent systems research to take aneconomic perspective on agent interactions, deriving “optimal” behaviouralpolicies from game-theoretic considerations of strategic interaction betweenautonomous agents that suffer conflicts of interest, IBM’s autonomic com-puting manifesto instead made reference to examples of natural homeostaticcontrol that have evolved to maintain system equilibrium in biological organ-isations. Many impressive natural systems—for example, ecosystems (Kay,1984), insect societies (Seeley, 2002) and biological organisms (Mesarovicet al., 2004)—have developed internal control mechanisms that allow themto organise and adapt to environmental change by relying on local interac-tions between the decentralised elements, rather than a more familiar controlhierarchy culminating in some authoritative central executive.
For example, it is not the complex decision-making of individuals thatpreserves robust organisation of ant, wasp or bee colonies (Robinson, 1992;Gordon, 2002), but rather their ability to stimulate each individual’s be-haviour appropriately through local interactions (Ladley and Bullock, 2004,2005; Bullock et al., in press). These, if effectively organised, facilitate flexi-
7

ble task allocation between colony members that is robust to environmentalperturbations (Theraulaz et al., 1998). An example of such a process can beobserved in an ant colony, where a potentially homogeneous population ofants, each capable of handling the same range of tasks, is differentiated intoa number of distinct but organised collectives or castes (Bonabeau et al.,1997). Each such collective specialises in carrying out a specific task, such asfood foraging, nest building, brood feeding, nest defence, etc. The survivalof the colony thus depends on both the efficient handling of each systemtask and the adaptive division of resources (ants) into a number of suchcollectives responsible for these different tasks. One of the most strikingaspects of such a regulatory response is its plasticity, a property achievedthrough the workers’ behavioural flexibility: the ratios of workers perform-ing the different tasks that maintain the colony’s viability and reproductivesuccess can vary (i.e., workers switch tasks) in response to internal pertur-bations or external challenges (Bonabeau et al., 1997). Understanding howthis flexibility is implemented at the level of individual workers which cer-tainly do not possess any global representation of the colony’s needs hasbeen addressed to some extent (Theraulaz et al., 1998; Bonabeau et al.,1997; Merkle and Middendorf, 2004). Self-regulatory colony properties ap-pear to stem from simple threshold-based behaviours where specialisation ofsystem elements to handle particular tasks arises as a result of reinforcementprocesses (Theraulaz et al., 1998).
Taking inspiration from these biological studies is attractive for severalreasons. By contrast with the economic models that typically drive multi-agent systems, they foreground the ecological rationality of the agents withinreal-world systems (Bullock and Todd, 1999). Such agents are embedded inan environment that demands decisions be made locally, under pressure oflimited time, limited computational resource, and on the basis of subjectiveinformation. These constraints place significant emphasis on the system’sability to adapt and cope rather than to achieve and maintain optimal per-formance, i.e., to “satisfice” (Simon, 1956) rather than to optimise.
Biologically inspired approaches also recognise the potential for systemcomponents to experience coincident, as well as conflicting, interests. Forinstance, like components of a data centre, cells in an organism, neuronsin a brain, and termites in a colony share a common interest in achievingglobal system efficiency rather than conflicting interests in profit making ateach others’ expense. Moreover, they highlight the ability of a decentralisedsystem composed of agents with only local knowledge to organise itself intouseful structures, rather than idealising the same system in terms of a well-mixed, population of rational, fully informed agents that adapt to their
8

environment en masse.Despite the advances made in understanding such biologically inspired
control mechanisms, one of the key issues involved in engineering modelsthat exploit them remains the difficulty of encouraging the ‘right’ local in-teractions and discouraging those that may frustrate and destabilise thesystem (Seeley, 2002).
2.3 Decentralised Control
A small number of studies has explored how this can be achieved in trulydecentralised control schemes, without assuming that agents have access toglobal information (Sen et al., 1996; Hogg and Huberman, 1991; Bruecknerand Parunak, 2003a; Babaoglu et al., 2002; Saffre and Shackleton, 2008;Saffre et al., 2009). In these systems, agents use decision algorithms thatoperate on local information. The specific problem of resource allocation(as opposed to service provision2) in decentralised multi-agent systems hasbeen discussed by Sen et al. (1996), who consider a system of self-interestedagents allocating resources on the basis of limited knowledge about the globalsystem state. In this context, they investigated the effects of limiting theagents’ access to both knowledge about the state of system resources, andthe resulting outcome on system resource utilisation. Hogg and Huberman(1991, 2002) examined the effects of local decision making on resource util-isation within a computational ecosystem, represented by a population ofresource allocating agents. In their work, the authors demonstrated howimperfect information about resource state can lead to chaotic system be-haviour, and how this can be suppressed through the use of appropriatelocal decision-making mechanisms.
Brueckner and Parunak (2003a) present a further strategy relying on lo-cal learning mechanisms designed to establish and maintain energy-minimisingresource-allocation strategies within mobile ad-hoc networks. In achievinglocalised strategies that reconfigure the allocation of resources in a mannerthat minimises power consumption, Brueckner and Parunak drew their in-spiration from the self-organising properties of natural systems. One of thedistinguishing features of this approach is an explicit appeal to emergentsystem properties where simple and local decisions conducted by system el-ements gave rise to system level behaviours that were not pre-programmed.
2By service provision, we refer to the problem faced by consumer agents in selectingamongst provider agents that offer services (Stein et al., 2008). By contrast, resourceallocation also includes the complementary problem faced by provider agents in decidingwhich service(s) to offer.
9

Moreover, rather than consider these emergent properties to be problem-atic, here they are often expected to play key roles in achieving system-levelobjectives.
An analogous bottom-up approach underlies work presented by Babaogluet al. (2002) where a self-organising approach is proposed to P2P system con-sisting of multiple and locally interacting nodes that are tasked to effectivelyprovision requested resources (e.g., searched content in P2P system). A sim-ilar architecture is proposed by Saffre and colleagues (Saffre and Shackleton,2008; Saffre et al., 2009). Here, an overlay network with self-* propertiesis introduced within which the nodes organise themselves to establish sym-biotic relations that minimise the time and costs associated with serviceprovisioning.
2.4 Contribution
The current paper focuses on achieving fully decentralised regulation of re-source allocation in a model autonomic system by relying only on local inter-actions between components. More specifically, we present a decentralisedmulti-agent system in which provider agents are tasked with adaptively con-figuring the services that they offer, and consumer agents must choose fromamongst these provider agents in order to efficiently secure computationalresources necessary to carry out jobs.
Two aspects of this work are particularly novel. First, the problem to besolved is two-sided in that both provider and consumer agents must adap-tively reconfigure their behaviour in ways that are complementary. Second,this adaptation takes place in a dynamic environment where changes in thedemand for different system services may require continuous reconfigurationat the level of individual system components.
A further distinguishing feature of our work is the attempt to identify andexplain the mechanism of self-organisation that underpins the relationshipbetween the behaviour of individual agents and the effect they have in termsof system performance. We achieve this by relating the information capacityof the agents to the emergent topology of information flows between them,which self-organises in the form of functional communities.
This approach is exemplified by the work of Guerin and Kunkle (2004)in a different context: investigating the self-organising properties of an ar-tificial swarming system represented by a simulated colony of food foragingants. Here, the propagation of information (in this case, pathways betweenthe ants’ nest and various food sources) is achieved through the depositionof simulated pheromones within a simulated world. The studies found that
10

agents (representing individual ants) were locked into pathologically tightloops of behaviour when pheromone traces were too strong. As a conse-quence, organised but circular foraging routes emerged that were inefficientin transporting food back to the nest. In contrast, when pheromones weretoo weak, the system was incapable of forming any foraging structures, sinceinformation evaporated before it could be reinforced, leaving individual for-agers to randomly explore the area. Between these extremes lies a regime ofeffective self-organised behaviour; in this case, the establishment and main-tenance of efficient foraging trails. Understanding how to regulate this typeof information exchange so that an autonomic computing system is main-tained between both extremes, and achieving this regulation through localdecision-making strategies is the main motivation for our work.
3 A Decentralised Resource Allocation Model
In this section, we propose a framework for a bottom-up resource allocationmechanism, whereby the adaptation of agents (in response to changes in theenvironment) is based on stimulus-response reinforcement mechanisms in-spired by behaviours that encourage self-organisation within insect societies(Bonabeau et al., 1997; Theraulaz et al., 1998). In the absence of centralisedcontrollers, the system elements need to preserve a certain degree of auton-omy, allowing for local adaptation to occur given perceived changes in theenvironment. This architectural flexibility is provided through the use of adecentralised multi-agent system architecture. The challenge of resource al-location can be viewed as a market-based, service allocation problem, wherethere is a (continually changing) demand for services of a given type, andthus the market responds3 by changing its supply of such services to sat-isfy the demand. As stated earlier, a multi-agent system is analogous toan autonomic system, which can be thought of as a collection of computingresources tied together to perform a specific set of functions (Kephart andChess, 2003). These resources may be hosted in a distributed fashion by anumber of servers deployed over networked machines, which provide servicesto each other. The framework is therefore modelled as a multi-agent systemcomprising a number of provider agents (providers) who offer services ofa specific type, and consumer agents (consumers) who request and utilisethe available services to achieve some task. We assume that both service
3In this context, we refer to the market as a decentralised collection of service providers,that each respond individually, based on their perception of changing service demand,rather than a single, atomic, coordinating entity.
11
providers and service consumers are agents running on constrained hardwarecomponents. Depending on the characteristics of the system, interaction be-tween these agents may be limited by power consumption, bandwidth con-sumption, or time-delayed response, all of which may have associated costs ifservice execution is to take place “on-demand”, quickly or by some deadline.In the system presented below, one aspect of such hardware limitations isrepresented in the form of service capacity, such that each agent may onlysatisfy service requests for a restricted set of service types, provided to alimited number of consumers simultaneously.
We assume an agent is capable of reconfiguring the service type it pro-vides at run-time. This involves a significant cost in the form of down timeduring which various administrative tasks may be performed, such as: com-pleting existing service commitments; removing security-compromising datafrom the machine state; resetting the execution stack; or loading new soft-ware modules representing the new service types. We also consider thatproviders increase their utility by successfully allocating service requests,and that consumers increase their utility by successfully executing services.Thus, to maximise utility, provider agents try to avoid offering services forwhich there is little demand (thus minimising idle time), and consumeragents try to allocate service requests efficiently by locating providers thatare available and configured to offer the appropriate service. A decentralisedservice discovery model is assumed, whereby each agent maintains a limitedregistry of details regarding service providers in its environment. Consumerscan discover new providers through regular dialogue with known providersthat continually update and share their awareness of local service availability(see Figure 2).
[Figure 2 about here.]
The evolution of the system is therefore driven by a continually recon-figuring network of peers, as illustrated in Figure 3. Both consumer andprovider agents co-adapt to each other by exchanging information, and re-configuring their interactions; i.e., by changing what services are offered(in response to observed changes in service demand), or by changing whatproviders should be contacted (based on observations of the availability ofdifferent services). These local responses are driven by the decision-makingmechanisms (detailed in Sections 3.1, 3.2 and 3.3, and summarised below)and the information that is propagated throughout the topology of agentsas a result of their activities.
[Figure 3 about here.]
12

As providers have no global information regarding service demand, theyutilise their own experience (based on the frequency and type of queriesthey receive from consumers), as well as information on service availabilitygarnered from those consumers they interact with, to determine whetherto continue offering a given service type or to switch to providing anotherservice type. Consumers discover new providers through a process of sociallearning, where new information is acquired through “gossiping”. When aconsumer and provider interact, the consumer may provide details of otherproviders that it has interacted with. In return, the provider agent informsthe consumer of other providers it is aware of (obtained through interactionswith other consumers).
Thus, service management and provisioning strategies should emergefrom local co-adaptations of individual agents based on observations of pre-vious transactions. Whilst this naturally involves sharing some knowledge,the agents independently modify their individual models of the local en-vironment. Since service availability can fluctuate as a result of severalfactors—including current demand, contention for services, and demand forother service types (resulting in a reconfiguration of service offerings)—itis necessary that agents maintain an accurate model of the environment bymaintaining a continuous flow of pertinent information with their peers.
This notion of sharing information may initially appear counter intu-itive, raising the question “why would a provider supply information onpotential rival providers to its users, thus possibly reducing demand on itsown services?”. One answer is that all provider and consumer agents withinthe system might be operated by a single firm, F , that owns the compu-tational infrastructure upon which they run. Each provider agent mightrepresent a computational resource owned by F , or owned by clients of Fthat employ F ’s infrastructure to deliver their services to their customers.In either case F ’s provider agents have an interest in collaborating witheach other to achieve global efficiency and fairness rather than competingwith each other to maximise ‘market share’ for any one client. Similarly,F ’s consumer agents might act as brokers securing computational resourcefor real-world customers. Again, such consumer agents might be happy toshare (suitably anonymised) information with each other in order to max-imise system throughput or mean quality of service for F ’s customers, evenif these real-world customers are competitors. Such a scenario is analogousto that faced by a colony of social insects where the reproductive successof each insect is channelled through a single queen, guaranteeing that theyhave a shared interest in colony success and are motivated to honestly andfreely share information.
13

However, it may also be possible to demonstrate that honest exchangeof information makes sense even in competitive scenarios where differentprovider agents directly represent self-interested firms that are in compe-tition with one another. We will not explore such scenarios here, but theliterature on natural communication offers many illustrative suggestions asto the conditions that promote and support honest communication amongstagents with conflicting interests (Noble et al., 2001).
In general, honest information exchange provides a mutually beneficialmechanism whereby consumers can acquire a timely and accurate model ofservices in the local community, and providers can determine a realistic esti-mate of the service demand in the same community, and thus (if necessary)switch to improve their own utility. The neighbourhood that emerges isdependent on the size of the model that consumers retain of their peers.In addition, the stability of the neighbourhood is also dependent on thismodel size; the larger the model, the greater the chance of instability, asmore providers may switch the type of services they offer in response tothe perceived change in demand (as illustrated by the El Farol Bar problemdescribed earlier).
The framework presented here makes the assumption that the tendencyfor information to be passed between agents will be influenced by the degreeof stress that the consumers experience. This consumer stress (describedmore formally in Section 3.1) reflects the difficulty in locating availableproviders for a given service, and hence provides an indication as to whetherthe service supply can sufficiently meet current service demand. Whilst thereis, perhaps, the opportunity for deceit in such a system, since the supplyof (and demand for) services can fluctuate, maintaining an accurate modelof the environment in each agent involves maintaining a continuous flow ofinformation between agents. This issue is discussed further in Section 4.4.
By relaxing the constraints limiting the amount of knowledge held byeach agent, the same model can explore scenarios in which agents have com-plete awareness of the current service demand. This is also equivalent toassuming the presence of a single Matchmaker (Sycara et al., 1997) whichmaintains a registry of all available service providers within a multi-agentsystem, and could in theory support the task of load-balancing. By pro-viding global knowledge to both providers and consumers, the behaviourarising from using a centralised service registry would be simulated, as ev-ery consumer would rapidly acquire complete and identical models of theservice landscape. Likewise, every provider would be aware of all requestsfrom all consumers, and thus would have the same information as everyother (rational) provider. Thus, the framework can be used to explore lo-
14

calised community behaviour by varying the size of retained knowledge, andcompared to complete, global knowledge.
In summary, then, the design goals of our autonomic resource manage-ment system are threefold:
1. dynamically reconfigure service providers in order to meet the currentdemand for different service types;
2. dynamically maintain the awareness of each consumer such that thesystem maximises throughput by minimising the amount of time wastedby consumers during job allocation; and
3. dynamically reconfigure such that the system is robust to changes insupply and demand for each service type.
The remainder of this section describes service consumers (Section 3.1),service providers (Section 3.2), and knowledge exchange, i.e., “gossiping”(Section 3.3).
3.1 Service Consumers
In general, a single agent may be capable of both offering and consumingservices. However, for the purposes of this paper, we consider the model foreach behaviour as separate. Consumers are agents that request and consumeservices provided by provider agents. A consumer monitors the behaviourof known service providers locally, and uses this knowledge both to direct itsown service requests, and to share with other agents, thereby establishingcommunity knowledge. A consumer, c, maintains a local registry, Rc con-taining tuples corresponding to providers/services that the agent is awareof. Each tuple is defined as follows:
rp = 〈αp, type, bias〉,
where αp corresponds to the identity of a provider agent that has providedthe service type at some point in the past, and bias ∈ [0, 1] corresponds to ascore or preference for using provider αp to provide the same service in thefuture. As consumers will not possess complete knowledge about whether aprovider is currently available, or even if it is still configured to provide thesame service type, it employs a local learning mechanism to update its biasestimate. This estimate is updated based on information obtained from thedifferent providers that it interacts with (Section 3.3).
15

This registry is also consulted by the consumer when it attempts toallocate a service request to a provider; the consumer ranks all the tuples inits registry that are related to the desired service type in decreasing orderof bias, and then submits requests to providers in turn (starting with thetuple associated with the highest bias value), until a provider is found whichcan satisfy the request. Each request takes some finite time (Tq), and theprovider will respond either to confirm that it will satisfy the request (i.e.,that it is available to provide the desired service type), or to reject the query;either because it currently does not provide that service type, or because itis currently too busy (i.e., it does not have sufficient resource to honour thenew request without compromising current commitments).
[Figure 4 about here.]
Each provider can simultaneously satisfy up to capacity Ctype service re-quests; therefore provided that fewer than Ctype services are being provided,a new request (of the right type) can be honoured. If a provider is capableof honouring the request, the service is executed, taking some finite timeTe, consuming a single service allocation resource. This resource is releasedonce the service execution ceases. Figure 4 illustrates many of the differentstates that both consumer and provider agents may occupy.
Typically, once a service request has been satisfied (or if no requestercould be found), the agent exchanges local knowledge with known providers(described in Section 3.3) before becoming inactive for some randomly de-termined period. The knowledge exchange is assumed to take some finitetime, Ti (irrespective of the number of providers involved), and correspondsto the process of sharing information about local service demand (and avail-ability), and thus evolving a localised community structure. The inactiveperiod corresponds to those periods in other scenarios (or frameworks) whereagents may be performing other tasks, or interacting with a user; however,for the purposes of our framework, the agent simply becomes inactive. Thisperiod is drawn from a uniform distribution [0, ω] after which the allocationprocess begins again.
Consumer stress (cs) is a measure of local consumer dissatisfaction, andreflects the difficulty an agent may experience when trying to provision agiven service type. The agent maintains an upper limit, fmax of requestattempts for each task. The motivation is that by the time the agent hasqueried all relevant entries within its registry, previously unavailable pro-viders may have become available. As the consumer may therefore traversea registry several times whilst attempting to provision a service, an upperrequest limit is used to terminate the provision after fmax failed requests.
16

Algorithm 1 Consumer task allocation algorithmRequire: a consumer αc with a need for service type of capacity capacity,
and the set P, which contains all the known providers that appear in itsregistry, Rc
Ensure: αc identifies what it judges to be the best provider of service typetype, and Rc is updated through the exchange of information
1: sort (Rc) ordered by bias descending2: for (q := 0 to fmax) do3: fq := 04: rp := Rc[q modulo |Rc|]5: if typeOfTuple (rp) = type then6: αp := providerOfTuple (rp)7: response := sendRequest (αp, 〈αc, type, capacity, cs〉)8: if response = accept then9: Rc := (Rc/rp) ∪ 〈αp, type, bias + δbias〉 {Update bias of rp}
10: break11: else if response = reject then12: Rc := (Rc/rp) ∪ 〈αp, type, bias− δbias〉 {Update bias of rp}13: increment (fq)14: end if15: end if16: end for17:
18: ft−1 := ft ; ft := min(1,
2fq
fmax
)19: cs :=
(ft−1+ft
2
)2{Update consumer stress}
20:
21: for all rp ∈ Rc do22: Rc := (Rc/rp) ∪ 〈αp, type, bias× δdecay〉 {Update bias of rp}23: end for24:
25: for all αp ∈ Pc do26: R′
c := exchangeRegistryWithProvider (Rc, αp)27: Rc := mergeRegistry (Rc,R′
c)28: end for29: sleep ()
17

[Figure 5 about here.]
During each attempt, t, to provision a service, the agent maintains afailure quotient, ft, based on the number of requests to provider agents thathave failed so far, fq, where 0 ≤ fq ≤ fmax and
ft = min(
1,2fq
fmax
).
The intuition here is that the failure quotient should approach unity asthe number of failed queries reaches fmax
2 , despite the fact that it can stillcontinue to issue requests before reaching fmax. The stress parameter, cs ∈[0, 1], is generated by calculating the square of the average failure quotientfor the current and previous provision (illustrated in Figure 5), as follows:
cs =(
ft−1 + ft
2
)2
.
The consumer periodically updates the ordered set Rc to reflect its ex-perience in provisioning services, and to minimise the number of futurerejected queries. If the request was successfully satisfied, then the tuple rp
corresponding to the provider αp which provided the service type is modi-fied, such that bias is incremented by δbias; otherwise it is decremented bythis amount4. To ensure that this model of provider availability does notbecome stale, a decay function is used to adjust the bias parameter for alltuples in Rc, by applying a decay coefficient5. After each update, the setRc is then ordered with respect to bias, such that tuples with greater biasare placed nearer the top of the list.
The algorithm used by a consumer agent is represented in Algorithm 1.In line 1, the registry is ordered such that the highest ranked providers(according to their bias value) are at the top. The consumer then traversesthis list, searching for providers that can satisfy its service request, until oneis found (lines 2-16). If a provider is found that can offer the service, thatprovider’s rating is incremented (line 9), otherwise it is penalised (line 12),and the failure count is incremented. Once the service has been satisfied(or the service request failed after fmax attempts), the consumer stress isupdated (lines 18-19). The ratings of all the providers are decremented
4The value δbias = 0.1 was found empirically. The modified bias parameter is limitedsuch that it does not extend beyond its defined range: bias ∈ [0, 1]
5The decay coefficient used in this model has the value δdecay = 0.9; this value wasdetermined empirically.
18
using the decay coefficient (lines 21-23), before information is exchangedwith them (lines 25-28). Finally, the agent sleeps until the next serviceinvocation (line 29). Figure 6 (left) illustrates a schematic representationof the internal state of a consumer, indicating the current level of stress(given by the thermometer icon) whilst attempting to provision service oftype circle from an internal registry of service providers.
[Figure 6 about here.]
3.2 Service Providers
Providers “model” the local demand for services to determine what servicesthey should offer. Providers may only offer a single type of service at anytime, despite possessing the capability to offer several types of services; dueto limitations in physical resources (e.g., memory size, processor capacity,etc.), or based on security issues. Business sectors (such as the e-businesssector) also limit the number of software modules that servers can provideat any time to avoid information leak. The suspension of availability of oneservice type and introduction of another can have an implicit cost, as thisreconfiguration typically takes some time during which the agent cannotperform any further service execution, and thus will not obtain any utilityincrease. We therefore assume that each provider agent αp can only offerone service type at any time, but has the capability of offering several otherservice types (subject to reconfiguration). The set:
Capability =⋃
∀αp∈MAS
Capabilityαp
contains the union of all service types available from all service providersin the multi-agent system (MAS), whereas Capabilityαp corresponds to theset of services that αp is capable of offering.6 Thus, to determine whichservice type αp should offer, it maintains a model S of current, local servicedemand, and determines which services to offer from that model. To achievethis, the provider maintains a number of registries corresponding to providerratings for different service types, i.e., Stype for each registry of type type,as provided by consumers during information exchange.
Providers receive requests from consumers in the following form:
reqi = 〈αc, type, capacity, cs〉6In the results reported here ∀αp, Capabilityαp = Capability.
19

where αc corresponds to the consumer which submitted the request, type ∈Capability corresponds to the type of service the consumer requested, thesize (in terms of capacity) of the task required, and the consumer’s currentstress, cs (defined in Section 3.1). When a new request is received thatcan be satisfied, the provider’s registry is also updated. Each request isaugmented with a bias rating, and stored as the tuple rc, which is in a formthat can also be used when exchanging information with consumers; i.e.,
rc = 〈αc, type, capacity, cs, bias〉
If the registry already contains a tuple for the consumer and service type,then the tuple in Stype is updated with the new capacity, and the bias ismodified, based on the product of the consumer’s stress, cs and the updatecoefficient7, as follows:
bias = min(1, bias + δupdatecs)
This adjustment reflects an increase in perceived demand for the servicetype. If no previous request exists from the requesting consumer for thisservice, then a new tuple is added to Stype, with an initial bias = δupdatecs.The union of all the sets, S, is then ordered8 with respect to bias.
The provider periodically consults the ordered set S to determine whetheror not to reconfigure its offered service. As there is no global view of cur-rent service demand, the providers have to infer this based on local demandobserved from previously received requests, which can then be used as ev-idence for the decision to reconfigure its service offerings. If the type ofservice in the first tuple corresponds to the service that is currently beingoffered, then no action is taken. Otherwise, the provider performs a switchoperation, whereby the provider changes the type of service it can provide.Whilst this switching process has no explicit economic cost, it has an im-plicit cost as the process takes a finite time (Ts = 2s), during which no otherservice can be provided. To ensure that the model maintained for currentservice demand does not become stale, a decay function is used to adjustthe bias parameter for all tuples in the sets Stype for each type, using thedecay coefficient δdecay.
The algorithm used by a provider agent is represented in Algorithm 2.On receiving a service request (line 1), the provider verifies that it is cur-rently able to provide the service (in terms of both service type and capacity)
7The update coefficient used in this model has the value δupdate = 0.1; this value wasdetermined empirically.
8The order of equally biased tuples is arbitrary, and thus may vary whenever the setis inspected.
20

Algorithm 2 Provider service provisioning algorithmRequire: a provider αp currently offering service type typep with available
capacity capacityp, and a set of service types that it may offer, S.Ensure: αp offers what it perceives to be the most demanded service type
and S is updated through the exchange of information.
1: reqi := receiveRequest() {where reqi = 〈αc, type, capacity, cs〉}2: if (typep 6= type ∧ (capacityp < capacity) then3: sendResponse(αc, reqi,REJECT )4: else5: sendResponse(αc, reqi,ACCEPT )6: executeService(reqi)7:
8: rc := 〈αc, type, capacity, cs, 〉 {based on reqi; no bias value asserted}9: if Stype ⊆ S then
10: S ′type := Stype
11: if req′i ∈ S ′type then12: r′c := 〈αc, type, capacity, cs, min(1, bias + δupdatecs)〉13: S ′type := (S ′type/rc) ∪ r′c {Update bias of rc}14: else15: S ′type := S ′type ∪ 〈αc, type, capacity, cs, δupdatecs〉16: end if17: else18: S ′type := {〈αc, type, capacity, cs, δupdatecs〉}19: end if20: S := (S/Stype) ∪ S ′type {Update the Registry S}21:
22: sort (S) ordered by bias descending23: if head(S) 6= typep then24: PerformSwitch(head(S))25: end if26: end if
21

before going on to execute the service9. Once the service has been success-fully completed, the provider updates its internal registry, by creating atuple, rc, based on the request (line 8). If a set of records for the requestedtype exists (i.e., Stype ⊆ S in line 9), then either the new tuple is added tothe set (line 15), or if an appropriate tuple exists, it is updated (line 13).Otherwise, a new set Stype is created with the new tuple as its only element(line 18). The provider then sorts all its sets of tuples S into descendingorder, to determine if it should change the type of service it currently offers(lines 22-25). In the example depicted in Figure 6 (right), provider E ismost likely to continue to offer services of type square, but might conceiv-ably switch to offering services of type hexagon in the near future, since thisis also associated with moderately high demand.
3.3 Information Exchange
To facilitate the migration of knowledge regarding the availability of servicesand current service demand, both providers and consumers share knowledgebefore revising their respective models. This process is initiated by con-sumers, and occurs each time a consumer completes a transaction with aprovider.
3.3.1 Sharing knowledge with Providers
Each consumer shares all of the tuples contained in its local registry, Rc andits current stress level, cs, with each of the providers that are listed in theregistry. Each provider then uses an integration policy to incorporate thisknowledge into its own local registries (i.e., Stype for each of the service typesthe provider knows about). This integration policy limits the number oftuples merged from the consumer’s knowledge for each given type (i.e., tuplesfrom Stype) with its own knowledge, based on cs. This stress level indirectlyrepresents the quality of knowledge the consumer possesses; low cs valuessuggest that the tuples provide an accurate representation of the currentavailability of services, whereas high cs values suggest that the knowledge ispoor or that the supply of that particular service type is low, thus leading todifficulties in provisioning services. The maximum number of informationtuples the provider is willing to substitute (tn ∈ Z) for each service type
9If the provider is in the process of reconfiguring or switching, all requests are re-jected until any currently executed services have been completed, and the provider hassuccessfully changed its current service offering.
22

type is defined as follows:
tn = (1− cs) ∗mc
where mc is the size of the set of tuples provided by the consumer for a givenservice type. The provider selects the highest ranking tn tuples (ordered byeach tuple’s bias parameter) for integration into its registry. Each providermaintains a limit (mp) on the number of tuples it stores, which determineswhich of the consumer’s tuples are retained.
3.3.2 Tuple Integration
There are three possible ways that each new tuple may be integrated into theprovider’s registries, based on whether the provider has existing informationon αp (specified by the tuple), namely: add, substitute or update. If noneof the tuples in Stype refer to this provider, then the tuple is added orsubstituted, using the following policy: if |Stype| < mp then the new tupleis simply added to Stype. Otherwise, a tuple for some other provider ispotentially removed to allow the new tuple to be stored. The way thisis done is based on the bias value; the provider inspects those tuples forwhich the bias is less than that in the new tuple, and randomly selects oneof these to be substituted. If none are found, then the new tuple is notintroduced. This mechanism guarantees that only knowledge that has anequal (or higher) bias than that existing within a provider’s memory will beintroduced.
The third integration mechanism, update, modifies an existing tuplemaintained by the provider. As this new tuple represents an additional,subjective evaluation of provider αp, the new bias is calculated by averagingthe new and previous tuple.
3.3.3 Sharing knowledge with Consumers
Providers maintain bias rankings for other provider agents that they maybe aware of (through exchanging information with consumers), and organisethese with respect to service type (as illustrated in the schematic represen-tation in Figure 6 (right)). Thus, a provider may appear within more thanone set of tuples Stype, depending on the knowledge that was acquired fromdifferent consumers during the last information sharing phase (e.g., in Fig-ure 6, provider E believes that provider B offers services of type hexagon andcircle). Providers can therefore deal with incoming information in a manner
23

that is sensitive to the type of service required by the consumer they are in-teracting with. If provider E interacts with a consumer attempting to secureservice type pentagon and, during this interaction, learns that the consumerassociates provider G with a high bias estimate, this new information willbe used to update E ’s bias estimate for provider G as a provider of servicetype pentagon.
Hence, each provider shares all the knowledge it possesses about otherproviders (i.e., S), based on its aggregated knowledge shared by differentconsumers. As consumers will have existing (if somewhat limited) knowl-edge of different service types, each consumer organises its knowledge, S,into two distinct subsets: Sact and Sinact, prior to sharing with differentproviders. The set Sact contains all the tuples rp ∈ S where the type of rp
corresponds to that known by the consumer (i.e., type appears in Rc, andthus is considered active information). The remaining tuples are consid-ered inactive information, shared (indirectly) between different consumersthrough common providers.
The proportion of data retained from each of these new sets is determinedby the current stress of the consumer, such that the higher the value of cs,the greater proportion of tuples from Sinact will be retained. The consumerorders each set (based on bias), and then selects max(0, |Sact| − 2cs) tuplesfrom Sact, and min(2cs, |Sinact|) tuples from Sinact for retention. The topranking tn tuples are then integrated into the consumer’s local registry,Rc using the same mechanism as that described in Section 3.3.2. The onlydifference is that the bias value is not aggregated, but rather is calculated byaveraging the new and previous tuple. In addition, the bias of all rc ∈ Sinact
are simply replaced by bias = 1.This process facilitates the discovery of new services from a group of
providers that may not offer a desired service type, but through consecutiveinteractions, may reconfigure to satisfy new consumers. Thus, consumersare willing to retain a small number of tuples pertaining to these providers(i.e., those that appear in the set Sinact) within their local memory onlywhen their allocative stress is high. As this, from a global system pointof view, may indicate change in the demand occurring within the system,this mechanism allows providers to ‘migrate’ to a community with increasedservice demand. However, introduction of information into the consumer’sregistry does not guarantee that the provider will change its current serviceoffering.
24

4 Experimental Evaluation
In this paper we explore two hypotheses that underlie the design of themodel presented in Section 3; namely:
Hypothesis 1 A stimulus-response mechanism that facilitates the propa-gation of limited knowledge regarding resource availability results inthe formation of stable communities, whereby roles are well establishedand correspond to the needs of the community.
Hypothesis 2 When information flow between peers is limited, this mech-anism can deal with significant fluctuation in the demand for differentresources by smoothly reorganising agent communities.
[Table 1 about here.]
In Section 4.2, the performance of the decentralised resource allocationmodel is compared to that of a system employing centralised control andanalysis of the system’s capacity to form local communities for a variety ofservice scenarios is conducted. The registries managed by each agent areexamined to visualise the network of connectivity between different agentsand to verify the formation and structure of communities corresponding tohomogeneous service usage (thus supporting Hypothesis 1). This is followed,in Section 4.3, by an investigation of the stability of the emergent communi-ties when service demand is dynamic. The results demonstrate that in thecases where the size of the service registries is limited, providers provide astable supply of relevant services to the fluctuating market, whereas whenthe service registry size is large or unlimited (thus simulating the case whereservices can be discovered through a centralised registry, such as a match-maker middle-agent (Sycara et al., 1997)), the supply of services degeneratesand becomes chaotic (thus supporting Hypothesis 2).
The following experiments were carried out using a variety of modelconfigurations. Table 1 lists the default parameter values (introduced inSection 3) used for each of the evaluations; in the case where a parametermay be different, the new parameter values are explicitly defined. For exam-ple, the empirical evaluation in Section 4.2 (Hypothesis 1) uses Ctype = 5,whereas in Section 4.3 (Hypothesis 2), Ctype = 2. Note that all time mea-surements are quoted as simulation time seconds, and do not relate to realtime. Each evaluation was performed 10 times, and the results were testedfor statistical significance.
25

Before either of these studies is presented, in Section 4.1 we first intro-duce an assortativity metric that will be used to evaluate the communitystructure exhibited by a population of software agents.
4.1 Assortativity Metric
An assortativity metric has been defined to evaluate the structure of theinformation flow between individual agents. This measure represents thestrength of the community structure in a population of consumers interestedin securing the same service type.
In order to calculate assortativity for a particular service type, we firstidentify the set of consumers interested in securing that service, C. We thendetermine the complete set of providers known to this set of consumers, P,and populate a square matrix M of size |P| × |P|, where |P| corresponds tothe number of unique providers in P. Each element of M , Mi,j , correspondsto the number of consumers in C that simultaneously know both provider iand provider j. Note that some but perhaps not all of the members of Pwill be configured to offer the service type sought by members of C.
We can interpret M as specifying a network of undirected connectionsbetween members of P. In the simplest case, we might determine thatan edge (i, j) exists only where Mi,j > e. If most network edges connectproviders that offer the same type of service then consumer agents are awareof appropriate providers and share a consistent collective memory.
The assortativity metric, H, can be defined as follows:
H =1n
n∑i
di
where i is one of the n ≤ |P| providers in P that have at least one networkneighbour, and di is the proportion of these neighbours that offer the sameservice type as i.
In a random system, the proportion of network edges connecting pro-viders offering the same service will converge to 1
T , where T is the numberof service types. The baseline assortativity, H, of communities in such adisorganised system will therefore also tend to be 1
T .
4.2 Demand variety
In this analysis, the system’s ability to form local communities was exam-ined over a range of scenarios with differing numbers of service types. The
26

community structure was investigated, to explore the types of links thatemerge through sharing limited information between peers.
4.2.1 Scenario Configuration
To explore the effect that different combinations of service types may haveon demand, and hence on community organisation, the number of uniqueservice types demanded by consumer agents was varied, such that the de-mand variety is defined as V = |Capability| ∈ [1, 6] (see Section 3.2). Eachconsumer was configured to require exactly one type of service from thepool of available service types, such that the demand for each service typewas equal. Thus, when V = 1, all consumers shared the same type of ser-vice requirements, whereas for V = 2, the consumer population comprisedtwo equally-sized sub-populations that differed in the service they required.Based on the perceived service demand, providers can choose to offer a singleservice selected from the set Capability, as defined in Table 2.
[Table 2 about here.]
In each case, a provider is configured to offer no more than Ctype “units”of the same service at any one time (i.e., Ctype is its service capacity). Themaximum number of tuples in each consumer’s memory is defined as mc =10; i.e., each consumer will remember details of up to 10 providers aftereach information exchange phase (Section 3.3). On initialisation, consumersare given a random selection of information about the existence of differentproviders. As the providers have no preference for providing any service,the selection of services they provide is initially randomised. To facilitatefaster convergence on the creation of communities, only information residingin the Sact set (Section 3.3.3) was used during the first 200s of simulationtime10.
4.2.2 Evaluation and Analysis
Before analysing the way in which the decentralised resource allocationmodel operates, we first contrast its performance with that of an idealisedsystem reliant on centralised control, described below. This comparison isperformed over a range of scenarios that vary in terms of the demand variety,V , exhibited by consumers.
10The value of 200s was found empirically for a range of experiments and values of mc.Tests on unlimited memory or local registry size (i.e., mc = ∞) failed to converge, despitea range of bootstrapping values tested.
27

By contrast with the decentralised model, the centralised model utilisesa single centrally maintained ideal registry that is divided into sub-registries,each of which corresponds to one of the service types demanded by consumeragents. Upon initialisation, the tuple associated with each provider is allo-cated to the sub-registry associated with the service that it is configured toprovide.
Every simulated second, each sub-registry is updated instantaneouslywith truthful information about the state of all providers currently config-ured to offer the associated service. Should a provider switch which serviceit provides, its associated tuple will switch to the appropriate sub-registry.Each of these sub-registries is sorted in order of the currently available sparecapacity offered by each provider such that providers with most spare ca-pacity are at the head of the list. Consumers no longer make use of any localmemory, but instead rely on the central registry, consulting the contents ofthe sub-registry associated with the service that they require and queryingproviders in order of their spare capacity.
Under realistic conditions, centrally maintaining information on pro-viders would require interactions between the centralised registry and everyprovider agent, each of which would consume time and computational re-source. Here, we do not explicitly model these costs, but simply impose aone second latency between consecutive instantaneous updates.
For the centralised model, Figure 7 shows that system performance (orthroughput, calculated as the ratio of successful service allocations to overallservice requests) is low across all scenarios and lowest for scenarios whereconsumers exhibit low demand variety. This is a consequence of the con-gestion created by herding which is maximised where all consumers demandthe same service and have access to the same information on providers, andminimised to the extent that consumers are divided into many groups withdifferent service requirements. In the limit where each consumer requires aunique type of service provided by a unique provider, near optimal through-put could be achieved by the centralised model.
By contrast, the system performance of the decentralised model is notunduly affected by varying demand variety, remaining close to the optimum.For the case where V = 1, all consumers issue requests for the same servicetype (i.e., type A), encouraging all providers to switch to offer this type ofservice. Once this has been achieved, there is no pressure for any providerto switch, and the only service allocation failures that may occur are dueto requests being sent to providers that are busy. Those consumers stressedby such failures are more likely to update their registries. Thus, the onlytype of organisation occurring within the environment is due to consumers
28

replacing knowledge of over-committed providers. Since there is sufficientaggregate supply to meet consumer demand and consumers have differentassessments of provider utility, eventually a stable assignment of consumersto providers is able to form.
[Figure 7 about here.]
The task of achieving a stable supply of services becomes more chal-lenging for cases where V > 1, since providers may choose to switch theservice that they offer on the basis of the (local) consumer demand thatthey experience. However, the performance of the decentralised model wasnear-optimal for all scenarios where V ∈ [2, 3, 4, 5, 6], reflecting the fact thatthe organisation of information across the agent communities was effective,allowing consumers to establish and interact with an appropriate set of pro-viders (with respect to the desired service type), and thus allowing providersto stabilise their selection of offered services, without the need to continuallyswitch. Since each agent is capable of utilising only a subset of the locallyavailable information due to the limited size of their local service registries,this stability emerges from the efficient organisation of shared informationthat evolves across the different agent communities.
[Figure 8 about here.]
[Figure 9 about here.]
This efficient organisation is captured by the assortativity metric de-scribed in Section 4.1 which summarises the way in which the contents ofagent registries correlated with their service demands. This metric distillsinformation on which providers are known (and utilised) by which consumersinto a measure of the coherence of a system’s communities. Low values sug-gest a lack of any community structure, whereas high values reflect distinctcommunities with very few links between each community.
Strongly assortative community structure was achieved by the decen-tralised model independent of the number of different service types requiredby the consumer community. Figure 8 illustrates that this level of assor-tativity is achieved rapidly in the decentralised model and at a rate thatis independent of demand variety, V . Hence, unlike the centralised model,decentralised system performance scales well with demand variety.
The resulting network topologies are illustrated in Figure 9(a) for thescenario V = 3. In this topology, nodes represent providers, and edgesrepresent the case where both providers are known by at least one consumer,
29

and the weight of this edge represents the cardinality of the set of consumersthat know the two providers. At t = 20s there is little evidence of anycommunity structure, and the links between providers offering different typesof services suggests that there is little organisation in the information beingshared by the consumer population. This is supported by the fact that theedges between providers are generally weak, suggesting that provider pairsare known by comparatively few consumers.
However, the rapid increase in community strength over time in Figure 8demonstrates that this initial system instability recedes due to the forma-tion of strong local communities which are homogeneous with respect toservice type. By t = 80s, the scenarios generally converge to stable configu-rations, where providers rarely switch to other service types, and consumersresolve any request conflicts by identifying those providers that are in lessdemand within the community. The corresponding network topology at timet = 250s is also illustrated in Figure 9(b), where three distinct and highlyconnected communities have formed. The strongest edges (correspondingto cardinalities approaching 40 pairs of providers) within the network arethose between providers that offer the same service type (typically foundwithin a local community), whereas the weakest connections mainly existbetween communities. In the absence of external perturbation (e.g., changesin consumer demand, or removal of providers) community structure remainsstable, i.e., communities do not change in size, providers do not reconfigure,and consumers interact with the appropriate community.
[Figure 10 about here.]
The rapid community convergence observed for those scenarios where Vwas high (Figure 8) suggest that there may be processes that catalyse theefficient organisation of interactions between consumers and providers, suchthat the allocation of services to the most appropriate providers emerges tobe both stable and efficient at the global level. To explore this, an analysis ofcommunity strength was conducted for both consumer and provider serviceregistries for the scenario where V = 5. The network topology for consumersis presented in Figure 10(a), where five separate communities (correspondingto the five available service types) are clearly visible, with strong edgeswithin the communities (where the providers have a mean assortativity valueof 0.94), and weak edges between communities.
Providers organise their information corresponding to service type (seeSection 3.2), which can result in information corresponding to those servicetypes not currently offered by a stable provider becoming stale. This is
30

due to the fact that providers will rarely interact with consumers desiringalternate service types. Thus, to analyse the providers’ registries (i.e., S),the assortativity metric should be modified, so that only information that isrecent is considered by the modified metric. The resulting network topologyfor providers is presented in Figure 10(b), which reveals the existence of fivedistinct community structures (with mean strength equal to 0.83).
4.3 Dynamic Service Demand
The analysis in the previous section confirms the hypothesis that stablecommunity structures form such that the supply of services can organiseto satisfy service demand (provided that sufficient resources are available).However, this assumes that the demand is static and fixed. In this section,the validity of Hypothesis 2 is explored, whereby the stability of communitiesthat emerge from the stimulus-response behaviour of the model is explored ina highly dynamic environment where service demand is continually changing.
4.3.1 Scenario Configuration
To investigate the performance of limiting the size (mc) of consumer serviceregistries (and hence information flow), and compare it to the case wherecomplete information is available, the scenario was modified to facilitatechanges in service demand over time. For all providers in this scenario,Capability = {A,B}, and thus V = |Capability| = 2 for all providers in thisscenario. The service capacity for each provider is restricted to satisfyingtwo service requests at any time; i.e., CA = CB = 2 (Table 3).
[Table 3 about here.]
Consumer demand varies exogenously, with demand for service type A,oscillating in anti-phase with the demand for service type B. This variationis implemented by altering the average sleep period that consumers undergobetween successive service requests. Thus, when the average sleep periodfor consumers requesting A is longer than that for consumers requesting B,then the demand for providers of service type B will effectively be greater.The sleep period is defined as:
sleeptype = rand + δtype
where rand is a random value drawn from the range [0, ω], and δtype is de-rived from the sinusoidal function of time (illustrated in Figure 11). Thus,
31

by varying δA and a corresponding δB which is 180◦ out of phase, a sym-metrical change in demand can be achieved for the two services. To allowthe system to achieve a steady state, demand for both types of service isequal and constant for the first 200s11.
Within each evaluation, several simulation runs were performed withdifferent service registry, or memory sizes, mc, to evaluate the model withlimited information retention, and these results were contrasted with a globalinformation model.
[Figure 11 about here.]
[Figure 12 about here.]
4.3.2 Evaluation and Analysis
Figure 12 illustrates the mean performance of the model with respect tomc. The graphs are normalised with respect to the optimal system perfor-mance experienced by the system in equilibrium during steady state (i.e.,when service-demand is satisfied by supply such than no reconfiguration ofproviders is necessary). An analysis of the model’s efficiency in successfullysatisfying service requests for different sizes of memory (Figure 12) revealsthat the system efficiently satisfies service requests only for certain caseswhere 4 < mc < 12. In addition, the level of information flow betweenconsumers is low under such conditions, suggesting that the distribution ofknowledge across different consumers regarding local providers is relativelystable. However, for memory sizes outside this range, performance falls toa level below that achieved if global knowledge was available (mc = ∞),where the flow of information between consumers is maximised.
Three general types of behaviour can be observed, based on the way inwhich the model responds to changing conditions for different memory sizes.These are captured in Figure 13, which illustrates the behaviour emergingfrom three representative cases (i.e., mc ∈ {2, 5, 20}). When mc = 2 (Fig-ure 13 empty rectangles), the performance degrades as a result of the con-sumers’ inability to resolve service request conflicts in a timely manner. Asa result, the stress level grows within an increasing number of unsatisfiedconsumers. This catalyses the re-organisation and sharing of the consumers
11Whilst this scenario is relatively simple compared to real patterns of demand, theintent is to evaluate the behaviour of the system (and resulting communities) whilst main-taining full control of the demand dynamics. More complex scenarios (and real-world casestudies) could be explored in future work.
32

local knowledge, resulting in the acquisition of knowledge about new pro-viders which are likely to be more suitable to the consumer’s tasks. However,given the high volume of shared information from stressed consumers, pro-viders become selective regarding the information they retain. Since thenumber of retained types is so small, information loss occurs, resulting inthe formation of isolated groups of agents aware of only small groups ofproviders, which are unable to propagate this information to other, similargroups.
[Figure 13 about here.]
[Figure 14 about here.]
The model for mc = 5 exemplifies a scenario in which efficient perfor-mance is exhibited (Figure 13 solid rectangles). In this case, the modelresponds smoothly to changes in demand, due to the fact that the con-sumers’ service registries are large enough to retain some information aboutlocal consumers despite the change in demand, but small enough that littleof the new information exchanged is retained, and hence does not compro-mise future service provision. As a consequence, there are comparativelyfew consumers that experience stress high enough to necessitate a continualreorganisation of the local service registry (as in the case when mc = 2),and thus require new information (less than 10%). This also limits thenumber of providers that observe large changes in service demand, and thusreduces the number of providers that subsequently switch services. The wayin which providers switch services in response to the changes in demand isillustrated in Figure 14. During the initial 200s, local communities start toform corresponding to the two service types, with roughly equal numbers ofproviders supporting each community. However, as the demand for one ser-vice type increases, the level of reorganisation experienced by the consumerpopulation is limited, and thus the number of providers that switch matchesthe resulting demand, yielding a stable, but dynamic environment.
As the number of known providers increases (e.g., in the case wheremc = 20), the performance becomes degenerate (empty circles in Figure 13).In this case, as consumers become stressed due to increases in service de-mand, they exchange and retain larger quantities of information regardingnew providers. This compromises their ability to successfully locate serviceproviders, as there will be greater competition for the highest ranking ones.This leads to an increase in the stress of the consumers, which in turn ex-erts unnecessary pressure on providers to switch due to a continuous and
33
elevated exchange of information. Thus the equilibrium destabilises, as pro-viders fail to respond to changes in the service demand (as illustrated bythe empty rectangles in Figure 14), and the community structure is lost.
[Figure 15 about here.]
The case where mc = ∞ corresponds to that where global informationis available to all agents (solid circles on Figure 13). In this case, herdingoccurs, where a large number of consumers ends up crowding for the mostattractive providers. As the number of requests that can simultaneously besatisfied is small (Ctype = 2 for these experiments), a substantial numberof requests are rejected, resulting in large numbers of new queries beingissued. This results in an increase in stress experienced by a large number ofconsumers, which increases the pressure on providers to continually switch,thus further destabilising any community structure. The resulting behaviourof providers (which offer services of a given type) varies in a similar way tothat observed when mc = 20 (empty rectangles in Figure 14).
A system that effectively manages service provision can be characterisedby a community structure that is stable enough to sustain internal reorgan-isation. Therefore, to better understand the relationship between the modelperformance and the manner in which agents share local information, ananalysis of the community strength (using the assortativity metric definedin Section 4.1), was used. Figure 15 plots the assortativity strength of con-sumers against time for two different scenarios; where mc = 5 (Figure 15(a))and mc = 20 (Figure 15(b)).
As the consumers experience increased stress due to rising demand for agiven service type, they exert increasing pressure on the providers to satisfythis demand, which in turn strengthens the community structure. In thescenario explored within Figure 15(a), the community strength approached0.9 as the demand for a service type reached its peak; reflecting the fact thatthe majority of knowledge retained by the consumers was correctly identi-fying relevant providers. Correspondingly, as the service demand falls, thestrength of the community decreases accordingly. Figure 15(b) illustratesthe pathological case, whereby larger memory size (mc = 20) causes pro-viders to switch far too frequently, compromising the ability of consumersto effectively locate relevant providers. In this case, the community strengthbecomes erratic, and no longer varies in phase with changes in service de-mand.
These results suggest that the formation of strong and adaptive commu-nities (i.e., those that exhibit high assortativity) is accompanied by good
34

system performance and a robust response to varying demand. Recall thatservice provision depends on the co-adaptive stability between agents re-sponding to locally perceived changes. The formation of a strong commu-nity by agents interested in a particular service type yields an exchange ofinformation that is constrained. If a community is strong, knowledge passedto consumers can be exploited to induce a small subset of providers to switchservice types, minimising the risk of destabilising the availability of servicesto other consumers in other local communities. This raises the question ofhow strong should a community be in order to support this process opti-mally? A tightly linked community (where community strength approachesone) could prevent reorganisation when there are changes in demand. How-ever, if the community is too weak, then the availability of services willbe destabilised. A second question thus arises: under what conditions issuch a system capable of forming strong communities? As demonstratedin this paper, simply varying the amount of information available to agentsis sufficient to bring about changes in system behaviour: from being toodisconnected, to effectively evolving self-organising communities, and even-tually to a configuration where agents regress into a chaotic flux.
[Figure 16 about here.]
Figure 16 plots the community strength as a function of memory size.In those cases where the size is too small or too big, degenerate behaviourresults, similar to that illustrated in Figure 15(b). For those cases wheremc ∈ {2, 3}, consumers retain insufficient knowledge to successfully facilitatea useful flow of information as the environment changes. In contrast, whenthe memory size is large (i.e., mc > 15), consumers retain more informa-tion about the environment, and consequently can better stimulate changein the provider population. As levels of stress increase, there is a greaterchance that larger numbers of consumers will compete for the most favouredproviders, resulting in a feedback loop that escalates stress levels, which in-creases the pressure on providers to change, yielding further destabilisation.It is only within the intermediate range of cases (i.e., 4 ≤ mc < 15) that thecommunity strength increases. Here, each agent is able to adapt to changesin the environment effectively, without necessarily being able to identify theglobally optimal providers. The close agreement between Figures 16 and 12demonstrates that it is the strength of the communities formed through in-formation flowing through the system that directly underpins and accountsfor system performance.
35

4.4 Discussion
When first confronted by the problem of configuring computational resourcesand allocating them in response to varying consumer need, it seems likelythat smart enough agents employing probabilistic and possibly collaborativereasoning of some kind might be able to circumvent the “herding” problem.This may indeed be the case, but instead it may be that, as Hogg and Hu-berman (1991) concluded, the smarter the agents, the more likely they are tosuffer from some kind of co-ordination problem. Our approach here has beento explore whether these potentially intractable co-ordination problems canbe avoided by employing much simpler agents and relying on asymmetriesin their knowledge state that arise naturally under conditions of only localinformation flow.
A critical factor in achieving the efficient performance is the organisa-tion of knowledge across the consumer and provider populations. A systemwhere consumers successfully organise their local knowledge supports ongo-ing interaction between providers that can supply the services that the cor-responding consumers require. Moreover, such an organisation also has theability to smoothly reconfigure the supply of services in response to changesin demand. By contrast, operating on the wrong information will resultin degraded performance due to high numbers of rejected queries and timespent on needlessly reconfiguring service providers. Populations of agentsthat possess only incomplete local knowledge must therefore rely on the ap-propriate flow of information in order to keep this knowledge up to date,and coherent enough to be of use. This must be achieved in the absenceof any global flow-facilitating mechanisms that determine what informationshould flow to which agent.
An analysis of the information flow that emerges from the evaluationof our model can provide a number of insights into the dynamics of self-organisation, and in particular, how self-organisation can emerge from lo-calised decision-making within the context of resource management prob-lems involving configuration of providers to offer services based on locallyperceived demand. Although results demonstrate that the size of the localregistry containing provider information is one of the critical factors influ-encing the flow of information between agents in the neighbourhood, andthus the cohesion and stability of the community as a whole, there are otherinterdependent variables that play an important role in the process. Suchvariables include: the frequency of information exchange, the quantity of in-formation exchanged in a single exchange transaction, and thus the level ofinfluence an agent has on another agent’s decision making. These variables
36

have been demonstrated to play a key role in achieving self-organisationand adaptation for a number of other decentralised architectures (Guerinand Kunkle, 2004; Brueckner and Parunak, 2003b; Packard, 1988). In themodel presented in this paper, the extent of exchanged information was dy-namically affected by consumer stress (cs) which determined the amount ofinformation that both consumer and provider agents were willing to accept.Likewise, the level of consumer stress was an important factor in determin-ing the impact of the consumer, whilst querying the provider for a givenservice type. Finally, this stress level was also significant in establishing thedemand for a scarce resource, and hence encouraging providers to switchthe type of service they currently provided. As all of these factors have animpact on how agent interactions evolve, and thus how information flowsthrough the system, we plan to i) conduct a further investigation to ana-lyze how these parameters affect each other in order to formally identifythe synergistic relationship between these parameters and their influence onthe dynamic stability of the system, and ii) to identify efficient techniquesfor automatically self-regulating them in a decentralised manner based oninformation available locally to each agent.
This research highlights functional substitutability, i.e., the ability of acomponent to change its behaviour in response to changes in demand. Thisis desirable with many scenarios where there is a risk of failure in one com-ponent, such as within robotic rescue scenarios (Kitano, 2000) whereby arobot may be able to perform several different tasks (e.g., sensing, moving,performing actions etc), but only a few of these are needed for any givenscenario. However, changes in the environment may necessitate correspond-ing changes in the roles (at run time) that those robots perform. Similarbehaviours have been observed within biological systems. In natural antcolonies, it has been observed that within what is often ascribed as a homo-geneous community of ants sharing the same behavioural repertoire, therearise leaders that strongly stimulate the actions of other ants by their morefrequent activity (Dobrzanski and Dobrzanska, 1987). Such hyperactive antsstimulate the workload of the colony in every aspect (food foraging, nestbuilding, brood feeding, etc.). Thus, leader and follower roles arise undercertain conditions (rather than being inherent, programmed behaviours).However, a complete understanding of this social stimulation process is stillunclear.
37

5 Conclusions
In this paper, we have investigated how a simple stimulus-response mecha-nism inspired by a study of emergent behaviours within biological systemscan be used to facilitate the emergence of stable behaviour in a large multi-agent system. We argue that this approach or something like it is necessaryto support collaborative behaviour of large-scale, decentralised IT systems,such as in autonomic computing systems. The paper’s contribution is todemonstrate that constrained information flow can enable simple agents tosolve a decentralised co-ordination problem through the self-organisationof agent communities. These communities arise spontaneously as a conse-quence of local gossiping. They reflect the nature of the pressure experiencedby the system, are stable, and are capable of smoothly reconfiguring to copewith changes in consumer demand.
Future work will explore scenarios in which the demand for computa-tional resource may outstrip supply (or vice versa), the challenge of combin-ing power management considerations with performance targets in a singleautonomic scheme, and the robustness of decentralised behaviour to sys-temic parameters and the types of system noise and error that characterisereal-world environments.
Acknowledgements
Thanks to the SENSe and AIC research groups at the University of Southamp-ton for discussion of these ideas.
38

References
Arthur, W. B. (1994). Inductive reasoning and bounded rationality. Amer-ican Economic Review, 84:406–411.
Babaoglu, O., Meling, H., and Montresor, A. (2002). Anthill: A frameworkfor the development of agent-based peer-to-peer systems. Technical Re-port UBLCS-2001-09, University of Bologna, Italy. Presented at the 22ndInternational Conference on Distributed Computing Systems.
Bonabeau, E. (2002). Predicting the unpredictable. Harvard Business Re-view, 80:1–9.
Bonabeau, E., Sobkowski, A., Theraulaz, G., and Deneubourg, J. (1997).Adaptive task allocation inspired by a model of division of labor in socialinsects. In Lundh, D., Olsson, B., and Narayanan, A., editors, Biocom-puting and Emergent Computation, pages 36–45. World Scientific.
Brueckner, S. and Parunak, H. V. D. (2003a). Self-organizing MANET man-agement. In Marzo, G. D., Karageorgos, A., Rana, O. F., and Zambonelli,F., editors, Engineering Self-Organising Systems, pages 1–16. Springer.
Brueckner, S. A. and Parunak, H. V. D. (2003b). Information-driven phasechanges in multi-agent coordination. In Proceedings of the Second Interna-tional Joint Conference on Autonomous Agents and Multiagent Systems,pages 950–951, NY, USA. ACM Press.
Bullock, S. and Cliff, D. (2004). Complexity and emergent behaviour in ICTsystems. Technical Report HP-2004-187, Hewlett-Packard Labs.
Bullock, S., Ladley, D., and Kerby, M. (in press). Wasps, termites andwaspmites: Distinguishing competence from performance in collectiveconstruction. Artificial Life.
Bullock, S. and Todd, P. (1999). Made to measure: Ecological rationalityin structured environments. Minds and Machines, 9:497–541.
Challet, D. and Zhang, C. (1997). Emergence of cooperation and organi-zation in an evolutionary game. Physica A: Statistical and TheoreticalPhysics, 246:407–418.
De Roure, D. (2003). On self-organization and the semantic grid. IEEEIntelligent Systems, 18:77–79.
39

Dobrzanski, J. and Dobrzanska, J. (1987). About the joint action byants: Collaboration or participation? Panstwowe Wydawnictwo Naukowe,36:61–75.
Durfee, E. H. (2001). Scaling up agent coordination strategies. IEEE Com-puter, 34(7):1–8.
Estrin, D., Culler, D., Pister, K., and Sukhatme, G. (2002). Connectingthe physical world with pervasive networks. IEEE Pervasive Computing,1(1):59–69.
Forrest, S., Balthrop, J., Glickman, M., and Ackley, D. (2005). Computationin the wild. In Park, K. and Willins, W., editors, The Internet as a Large-Scale Complex System, pages 203–227. Oxford University Press.
Gershenson, C. and Heylighen, F. (2005). How can we think the complex?In Richardson, K., editor, Managing the Complex, volume 1 of ManagingOrganizational Complexity: Philosophy, Theory and Application, chap-ter 3, pages 1–14. Information Age Publishing.
Gordon, D. (2002). The organization of work in social insect colonies. Com-plexity, 8(1):43–46.
Guerin, S. and Kunkle, D. (2004). Emergence of constraint in self-organizingsystems. Journal of Nonlinear Dynamics, Psychology, and Life Sciences,8:2:131–146.
Heylighen, F. (1991). Modelling emergence. World Futures: The Journal ofGeneral Evolution, 31:89–104.
Hogg, T. and Huberman, B. A. (1991). Controlling chaos in distributedsystems. IEEE Transactions on Systems, Man and Cybernetics, 21:1325–1332.
Hogg, T. and Huberman, B. A. (2002). Dynamics of large computationalecosystems. Technical Report HPL-2002-77, Information Dynamics Lab-oratory, Hewlett-Packard Laboratories, Palo Alto.
Kay, J. J. (1984). Self-Organization In Living Systems. PhD thesis, Depar-ment of Systems Design Engineering, University of Waterloo.
Keil, D. and Goldin, D. (2004). Modelling indirect interaction in open com-putational systems. In Workshop on Enabling Technologies: Infrastruc-ture for Collaborative Enterprises, pages 371–377, Washington, DC, USA.IEEE Computer Society.
40

Kephart, J., Chan, H., Das, R., Levine, D., Tesauro, G., Rawson, F.,and Lefurgy, C. (2007). Coordinating multiple autonomic managers toachieve specified power-performance tradeoffs. In ICAC ’07: Proceed-ings of the Fourth International Conference on Autonomic Computing,page 24, Washington, DC, USA. IEEE Computer Society.
Kephart, J. O. and Chess, D. M. (2003). The vision of autonomic computing.IEE Computer, 36(1):41–50.
Kephart, J. O. and Das, R. (2007). Achieving self-management via utilityfunctions. IEEE Internet Computing, 11(1):40–48.
Kitano, H. (2000). Robocup rescue: A grand challenge for multi-agentsystems. In ICMAS ’00: Proceedings of the Fourth International Con-ference on MultiAgent Systems (ICMAS-2000), pages 5–12, Washington,DC, USA. IEEE Computer Society.
Ladley, D. and Bullock, S. (2004). Logistic constraints on 3d termite con-struction. In Dorigo, M., Birattari, M., Blum, L. M., Mondada, F., andStutzle, T., editors, Proceedings of the Fourth International Workshop onAnt Colony Optimisation, pages 178–189. Springer, Berlin.
Ladley, D. and Bullock, S. (2005). The role of logistic constraints on termiteconstruction of chambers and tunnels. Journal of Theoretical Biology,234:551–564.
Levins, R. (1966). The strategy of model building in population biology.American Scientist, 54:421–431.
Merkle, D. and Middendorf, M. (2004). Dynamic polyethism and competi-tion for tasks in threshold reinforcement models of social insects. AdaptiveBehavior, 12(3-4):251–262.
Mesarovic, M., Sreenath, S., and Keene, J. (2004). Search for organizingprinciples: Understanding in systems biology. Systems Biology, 1(1):19–27.
Noble, J., Di Paolo, E. A., and Bullock, S. (2001). Adaptive factors in theevolution of signalling systems. In Cangelosi, A. and Parisi, D., editors,Simulating the Evolution of Language, pages 53–78. Springer, Heidelberg.
Packard, N. H. (1988). Adaptation toward the edge of chaos. In Kelso, J.,Mandell, A., and Shlesinger, M., editors, Dynamic Patterns in ComplexSystems, pages 293–301. World Scientific.
41
Pynadath, D. and Tambe, M. (2002). The communicative multiagent teamdecision problem: Analyzing teamwork theories and models. Journal ofArtificial Intelligence Research, 16:389–423.
Robinson, G. E. (1992). Regulation of division of labor in insect societies.Annual Review of Entomology, 37:637–665.
Saffre, F. and Shackleton, M. (2008). “embryo”: An autonomic co-operativeservice management framework. In Bullock, S., Noble, J., Watson, R., andBedau, M. A., editors, Artificial Life XI: Proceedings of the Eleventh Inter-national Conference on the Simulation and Synthesis of Living Systems,pages 513–520. MIT Press, Cambridge, MA.
Saffre, F., Tateson, R., Halloy, J., Shackleton, M., and Deneubourg, J.-L.(2009). Aggregation dynamics in overlay networks and their implicationsfor self-organized distributed applications. Computer Journal, 52(4):397–412.
Savit, R., Manuca, R., and Riolo, R. (1999). Adaptive competition, marketefficiency, and phase transitions. Physical Review Letters, 82:2203–2206.
Seeley, T. D. (2002). When is self-organization used in biological systems?Biological Bulletin, 202:314–318.
Sen, S., Roychowdhury, S., and Arora, N. (1996). Effects of local informationon group behavior. In Proceedings of the Second International Conferenceon Multi-Agent Systems, pages 315–321. AAAI Press, Menlo Park, CA.
Shehory, O. and Kraus, S. (1998). Methods for task allocation via agentcoalition formation. Artificial Intelligence, 101:165–200.
Simon, H. A. (1956). Rational choice and the structure of the environment.Psychological Review, 63(2):129–138.
Stein, S., Jennings, N. R., and Payne, T. (2008). Flexible service provisioningwith advance agreements. In Proceedings of the 7th International JointConference on Autonomous Agents and Multi-Agent Systems, volume 1,pages 249–256.
Stone, P. and Veloso, M. (2000). Layered learning and flexible teamworkin RoboCup simulation agents. In Veloso, M., Pagello, E., and Kitano,H., editors, RoboCup-99: Robot Soccer World Cup III, pages 495–508,London, UK. Springer, Berlin.
42

Sycara, K., Decker, K., and Williamson, M. (1997). Middle-agents for theinternet. In Pollack, M. E., editor, Proceedings of the Fifteenth Interna-tional Joint Conference on Artificial Intelligence (IJCAI-97), pages 578–583. Morgan Kaffman.
Tanenbaum, A. and Renesse, R. V. (1985). Distributed operating systems.ACM Computing Surveys, 17(4):419–470.
Tesauro, G. (2007). Reinforcement learning in autonomic computing: Amanifesto and case studies. IEEE Internet Computing, 11(1):22–30.
Theraulaz, G., Bonabeau, E., and Deneubourg, J. (1998). Response thresh-old reinforcement and division of labour in insect societies. Proceedingsof the Royal Society of London, Series B, 265:327–332.
Wang, M., Kandasamy, N., Guez, A., and Kam, M. (2007). Distributedcooperative control for adaptive performance management. IEEE InternetComputing, 11(1):31–39.
Zambonelli, F., Mamei, M., and Roli, A. (2002). What can cellular automatatell us about the behavior of large multi-agent systems? In Garcia, A. F.,de Lucena, C. J. P., Zambonelli, F., Omicini, A., and Castro, J., editors,Software Engineering for Large-Scale Multi-Agent Systems, Research Is-sues and Practical Applications, pages 216–231. Springer.
Zambonelli, F. and Parunak, H. V. D. (2001). Signs of a revolution incomputer science and software engineering. In Second Italian Workshopon Objects and Agents, pages 1–12. Springer, Heidelberg.
43
List of Figures
1 Three classes of control organisation: a) centralised control,b) distributed control reliant on consensual, up-to-date, globalinformation, and c) fully decentralised control. Service pro-viders and consumers are represented by small circles, cen-tral executives or central repositories by large circles. Agentsmay store information (lozenges) and/or execute co-allocationalgorithms (brains). Dotted lines connote information ex-change, whereas dashed lines connote the pairing of servicesand resources achieved by the co-allocation process. Hybridclasses of control architecture may combine elements of cen-tralised, distributed and decentralised control. . . . . . . . . . 48
2 An overview of the resource management organisation pro-cess. Consumers (U) impose a demand for different types ofresources (service requirements) on resource providers (smallcircles). The inefficient disorganised configuration (left) rep-resents the case in which providers have no knowledge of whatservices are in demand, and consumers don’t know which pro-viders offer their desired services. The organised configura-tion (right) represents the case in which service demand issatisfied by local supply. . . . . . . . . . . . . . . . . . . . . . 49
3 The system viewed as a network of peers limited in knowledgeabout other agents by the maximum size of their memory (inthis example each peer is aware of only two other agents).Consumers do not interact directly with other consumers;however, they can indirectly affect each other’s behaviourthrough the information they rely on and share with com-monly known providers. During the exchange of informationbetween consumers and providers, a network reorganisationprocess occurs that may lead to the removal or addition of newconnections between agents that may consequently becomeaware of each other’s existence, or conversely, loose knowl-edge about each other. For example, C1 and C2 know aboutthe same provider P1, through which information about theexistence of provider P3 can be passed to C2, thus formingtwo new links between P3 and P1 and between P3 and C2. . 50
44

4 Several different types of service (represented by the threedifferent polygons: square, circle, and hexagon) are requiredby service consumers (open polygons numbered 1 to 5 ) andoffered by service providers (solid polygons labelled A to F ).Consumers 1 and 2 query providers A and B, respectively,requesting the same type of service (i.e., type hexagon). Pro-vider B is not configured to offer this service type (it currentlyprovides square services), whereas provider A could satisfythe request, provided it is available and has spare capacity.Consumers 3 and 4 have provisioned tasks to provider C. Dis busy whilst reconfiguring to offer a different type of ser-vice. Consumer 5 is exchanging information with provider E,whereas consumer 6 is “sleeping” between jobs. Finally, pro-vider F is currently unoccupied, but available to offer servicesof type circle. . . . . . . . . . . . . . . . . . . . . . . . . . . . 51
5 Relation between consumer stress and the failure ratio (f). . . 526 Schematic representation of the internal state held by Con-
sumer 5 (left) and Provider E (right). Consumer 5 experi-ences a current level of stress, S, based on the number of failedqueries whilst trying to provision the previous two services (f1and f2, respectively). Consumer 5 also retains rankings (i.e.,bias) for mc known providers (in this case, the providers D,E and F, all of which are believed to provide services of typecircle). Between jobs, Consumer 5 sleeps for some random pe-riod drawn from the uniform distribution [0, ω]. Provider E iscurrently configured to perform service (square), and main-tains estimates of the demand for all known service types,plus bias estimates for all known service providers, organisedby type of service offered. . . . . . . . . . . . . . . . . . . . . 53
45

7 Mean throughput of jobs as a proportion of optimal through-put (horizontal line) for decentralised (D) and centralised (C)resource management with differing levels of demand vari-ety, V . For the centralised resource management strategy,throughput declines with decreasing V as a consequence of theincreasing congestion created by herding. For decentralisedresource management, throughput is near optimal for V = 1and remains high where more than one variety of service is re-quired by the consumer population. Each bar represents themean throughput for the final 600 seconds of 10 independentsimulation runs. Error bars represent standard deviationsabout the mean. . . . . . . . . . . . . . . . . . . . . . . . . . 54
8 Strongly assortative community structure is achieved rapidly.The rate of convergence is independent of demand variety.Each curve represents a single representative run: where V =3 (dotted line), V = 4 (dashed line) and V = 6 (solid line). . 55
9 Network representing the organisation of a model with V = 3at different times in the simulation, illustrating the formationof communities. Links indicate relations between providersoffering the following service types: A (box), B (diamond),and C (triangle). Solid circles are singleton nodes, i.e., eachis a provider that is only known by one consumer. . . . . . . 56
10 Networks representing the organisation of a model with V = 5at t = 250s, based on (a) the consumers’ service registries(Rc), and (b) the provider’s registries (S). The links indi-cate relations between providers offering the following servicetypes: A (box), B (diamond), C (triangle), D (solid box) andE (solid diamond). Solid circles are singleton nodes, i.e., eachis a provider that is only known by one consumer. . . . . . . 57
11 Variance of δtype parameter stimulating the change in demandof services, for type A (dotted line) and B (continuous line). . 58
12 The mean system throughput for different memory retentionsizes (i.e., varying mc). The dotted line corresponds to thecase where mc = ∞. . . . . . . . . . . . . . . . . . . . . . . . 59
13 The performance (i.e., system throughput) of four systemconfigurations with differing memory sizes: mc = 2 (emptyrectangles), mc = 5 (solid rectangles), mc = 20 (empty cir-cles), and mc = ∞ (solid circles). . . . . . . . . . . . . . . . . 60
46

14 The number of resources currently offering service of type Bwith respect to changing demand for B (dotted lines) for twosystem configurations: solid rectangles (mc = 5) and emptyrectangles (mc = 20). . . . . . . . . . . . . . . . . . . . . . . . 61
15 The assortativity strength for communities providing servicetypes A and B over time. The triangles represents communitystrength for service community A (where mc = 5), whereasthe circles represent the corresponding community strengthfor community B. The rectangles and crosses denote the cor-responding populations (for A and B) when (mc = 20). . . . 62
16 The mean community strength as a function of memory size. 63
47
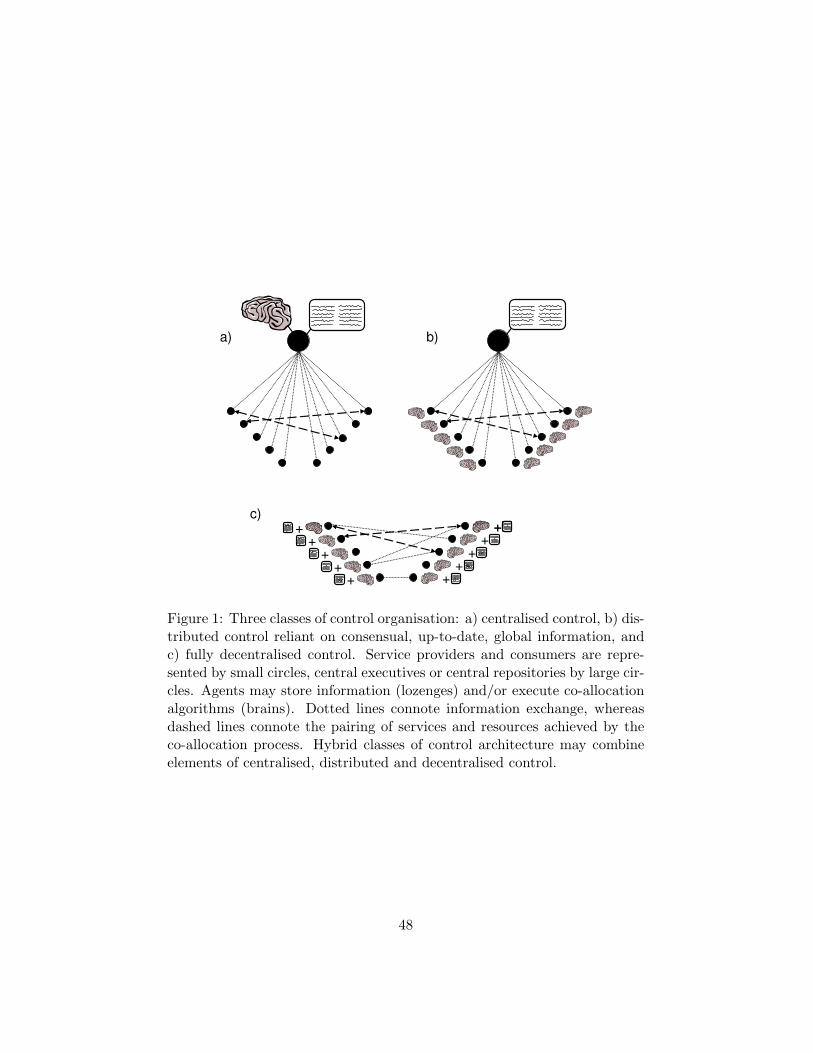
Figure 1: Three classes of control organisation: a) centralised control, b) dis-tributed control reliant on consensual, up-to-date, global information, andc) fully decentralised control. Service providers and consumers are repre-sented by small circles, central executives or central repositories by large cir-cles. Agents may store information (lozenges) and/or execute co-allocationalgorithms (brains). Dotted lines connote information exchange, whereasdashed lines connote the pairing of services and resources achieved by theco-allocation process. Hybrid classes of control architecture may combineelements of centralised, distributed and decentralised control.
48

CA A
AA
AC
CC
CC
BB
B
B
BU
U
U
U
U
U
U U
U
U
U
U
U
U
U
U
U
U
system system
Figure 2: An overview of the resource management organisation process.Consumers (U) impose a demand for different types of resources (servicerequirements) on resource providers (small circles). The inefficient disor-ganised configuration (left) represents the case in which providers have noknowledge of what services are in demand, and consumers don’t know whichproviders offer their desired services. The organised configuration (right)represents the case in which service demand is satisfied by local supply.
49

C3C6
C5
C4
P1
C2
C1
P2
P3
P4
P5
P C
Provider Consumer
Mutual AwarenessBetween Providers
Providers knownby Consumers
Consumers implicitlyconnected through
shared Providers
Figure 3: The system viewed as a network of peers limited in knowledgeabout other agents by the maximum size of their memory (in this exampleeach peer is aware of only two other agents). Consumers do not interact di-rectly with other consumers; however, they can indirectly affect each other’sbehaviour through the information they rely on and share with commonlyknown providers. During the exchange of information between consumersand providers, a network reorganisation process occurs that may lead tothe removal or addition of new connections between agents that may conse-quently become aware of each other’s existence, or conversely, loose knowl-edge about each other. For example, C1 and C2 know about the sameprovider P1, through which information about the existence of provider P3can be passed to C2, thus forming two new links between P3 and P1 andbetween P3 and C2.
50

3
4
6
5
2
1
C
E
F
B
A
D
Consumers Providers Allocation Query
Service Execution
Information Exchange
Reconfiguring
“Asleep”
Key a)
Figure 4: Several different types of service (represented by the three differ-ent polygons: square, circle, and hexagon) are required by service consumers(open polygons numbered 1 to 5 ) and offered by service providers (solidpolygons labelled A to F ). Consumers 1 and 2 query providers A and B, re-spectively, requesting the same type of service (i.e., type hexagon). ProviderB is not configured to offer this service type (it currently provides squareservices), whereas provider A could satisfy the request, provided it is avail-able and has spare capacity. Consumers 3 and 4 have provisioned tasks toprovider C. D is busy whilst reconfiguring to offer a different type of service.Consumer 5 is exchanging information with provider E, whereas consumer6 is “sleeping” between jobs. Finally, provider F is currently unoccupied,but available to offer services of type circle.
51

0
0.1
0.2
0.3
0.4
0.5
0.6
0.7
0.8
0.9
1
0 0.1 0.2 0.3 0.4 0.5 0.6 0.7 0.8 0.9 1
cons
umer
age
nt s
tress
val
ue
failure ratio (f)
consumer stress
Figure 5: Relation between consumer stress and the failure ratio (f).
52

F E D … 5
S
ω
f1 f2
B … … E
C D …
F B …
G … …
b)
Figure 6: Schematic representation of the internal state held by Consumer5 (left) and Provider E (right). Consumer 5 experiences a current level ofstress, S, based on the number of failed queries whilst trying to provisionthe previous two services (f1 and f2, respectively). Consumer 5 also retainsrankings (i.e., bias) for mc known providers (in this case, the providersD, E and F, all of which are believed to provide services of type circle).Between jobs, Consumer 5 sleeps for some random period drawn from theuniform distribution [0, ω]. Provider E is currently configured to performservice (square), and maintains estimates of the demand for all known servicetypes, plus bias estimates for all known service providers, organised by typeof service offered.
53

0
0.2
0.4
0.6
0.8
1
Me
an
syste
m t
hro
ug
hp
ut
1D C
2D C
3D C
4D C
5D C
6D C
Demand variety
Figure 7: Mean throughput of jobs as a proportion of optimal throughput(horizontal line) for decentralised (D) and centralised (C) resource manage-ment with differing levels of demand variety, V . For the centralised resourcemanagement strategy, throughput declines with decreasing V as a conse-quence of the increasing congestion created by herding. For decentralisedresource management, throughput is near optimal for V = 1 and remainshigh where more than one variety of service is required by the consumer pop-ulation. Each bar represents the mean throughput for the final 600 secondsof 10 independent simulation runs. Error bars represent standard deviationsabout the mean.
54

0
0.1
0.2
0.3
0.4
0.5
0.6
0.7
0.8
0.9
1
0 25 50 75 100 125 150 175 200 225 250
Asso
rtativ
ity s
treng
th
Simulation time (sec)
Figure 8: Strongly assortative community structure is achieved rapidly. Therate of convergence is independent of demand variety. Each curve representsa single representative run: where V = 3 (dotted line), V = 4 (dashed line)and V = 6 (solid line).
55

(a) At t=20s, there is no convergence
(b) At t=250s, communities start to converge
Figure 9: Network representing the organisation of a model with V = 3at different times in the simulation, illustrating the formation of communi-ties. Links indicate relations between providers offering the following servicetypes: A (box), B (diamond), and C (triangle). Solid circles are singletonnodes, i.e., each is a provider that is only known by one consumer.
56

(a) Consumer Information Only
(b) Provider Information Only
Figure 10: Networks representing the organisation of a model with V = 5at t = 250s, based on (a) the consumers’ service registries (Rc), and (b)the provider’s registries (S). The links indicate relations between providersoffering the following service types: A (box), B (diamond), C (triangle), D(solid box) and E (solid diamond). Solid circles are singleton nodes, i.e.,each is a provider that is only known by one consumer.
57
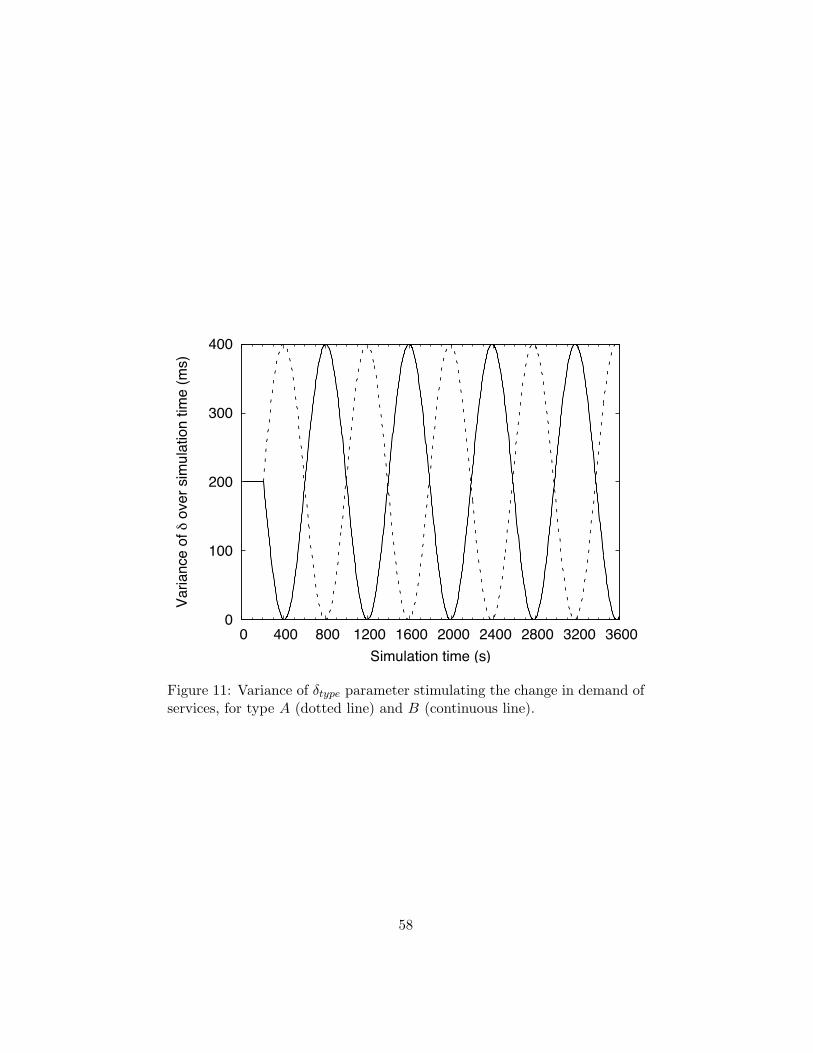
0
100
200
300
400
0 400 800 1200 1600 2000 2400 2800 3200 3600
Varia
nce
of !
ove
r sim
ulat
ion
time
(ms)
Simulation time (s)
Figure 11: Variance of δtype parameter stimulating the change in demand ofservices, for type A (dotted line) and B (continuous line).
58

0
0.1
0.2
0.3
0.4
0.5
0.6
0.7
0.8
0.9
1
0 2 4 6 8 10 12 14 16 18 20 22 24 26 28 30
Mea
n th
roug
hput
Memory Size
Figure 12: The mean system throughput for different memory retention sizes(i.e., varying mc). The dotted line corresponds to the case where mc = ∞.
59
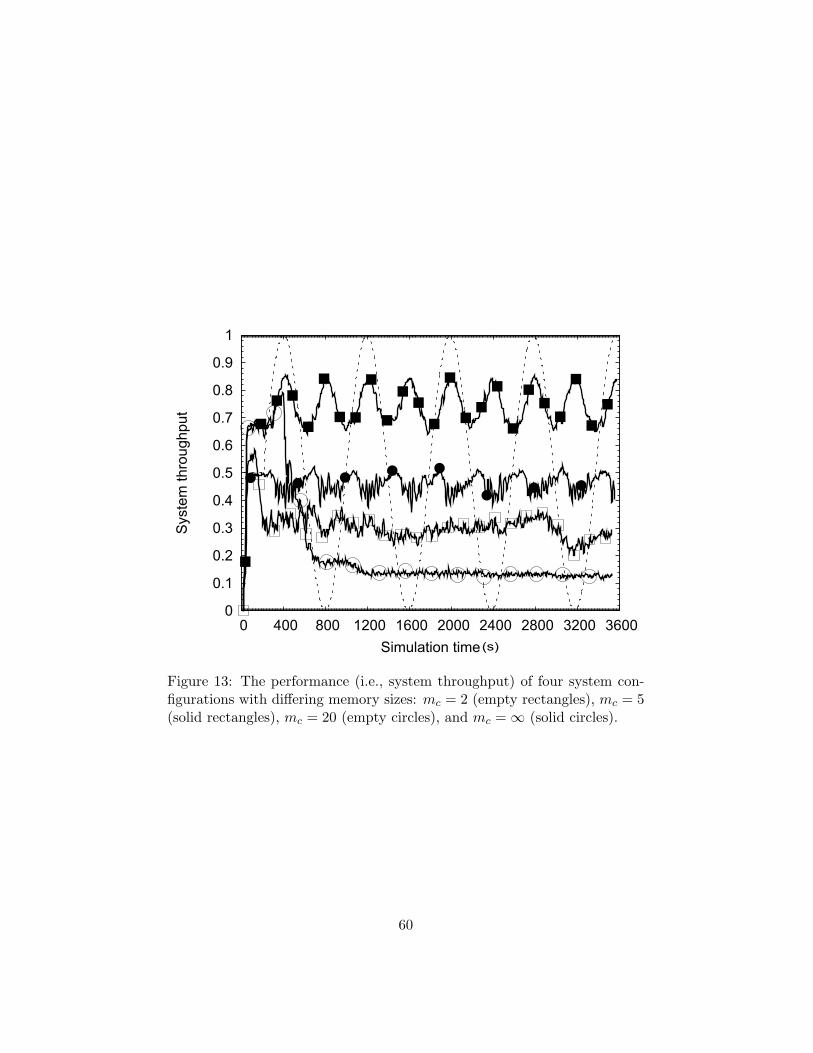
0
0.1
0.2
0.3
0.4
0.5
0.6
0.7
0.8
0.9
1
0 400 800 1200 1600 2000 2400 2800 3200 3600
Sys
tem
thro
ughp
ut
Simulation time(s)
Figure 13: The performance (i.e., system throughput) of four system con-figurations with differing memory sizes: mc = 2 (empty rectangles), mc = 5(solid rectangles), mc = 20 (empty circles), and mc = ∞ (solid circles).
60
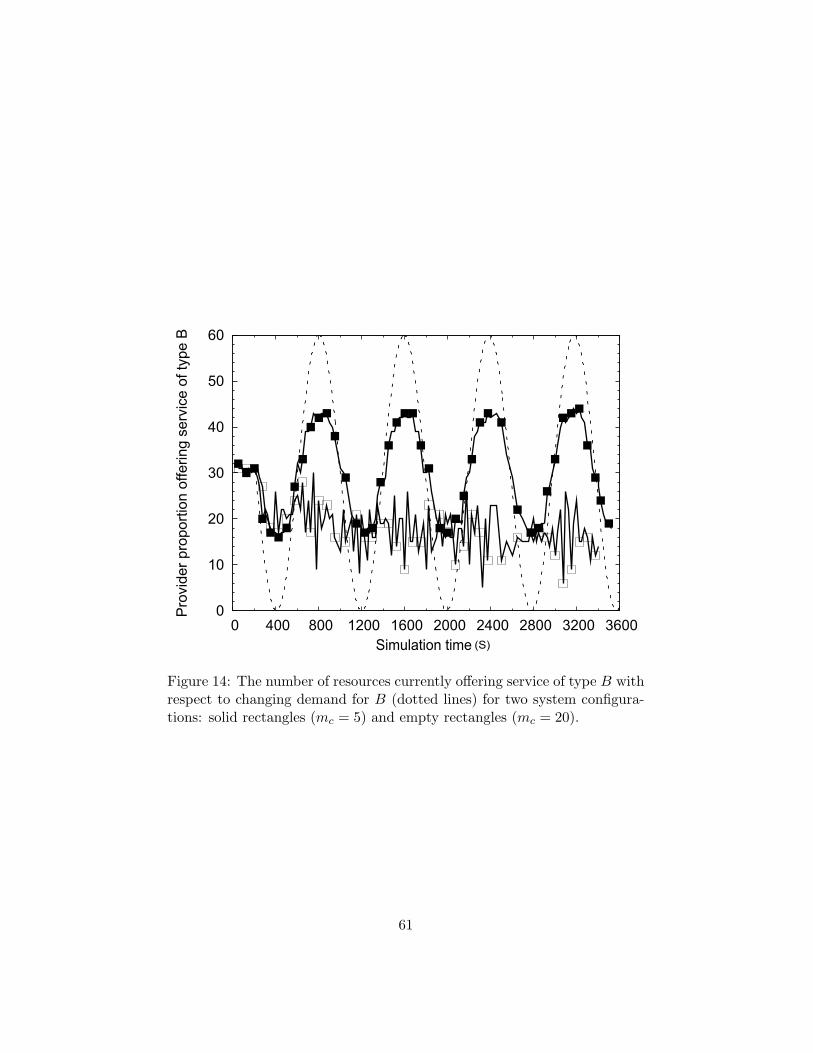
0
10
20
30
40
50
60
0 400 800 1200 1600 2000 2400 2800 3200 3600
Pro
vide
r pr
opor
tion
offe
ring
serv
ice
of ty
pe B
Simulation time (S)
Figure 14: The number of resources currently offering service of type B withrespect to changing demand for B (dotted lines) for two system configura-tions: solid rectangles (mc = 5) and empty rectangles (mc = 20).
61

0
0.1
0.2
0.3
0.4
0.5
0.6
0.7
0.8
0.9
1
0 400 800 1200 1600 2000 2400 2800 3200 3600
Ass
orta
tivity
str
engt
h
Simulation time (s)
(a) Small memory model (mc = 5)
0
0.1
0.2
0.3
0.4
0.5
0.6
0.7
0.8
0.9
1
0 400 800 1200 1600 2000 2400 2800 3200 3600
Ass
orta
tivity
str
engt
h
Simulation time (s)
(b) Large memory model (mc = 20)
Figure 15: The assortativity strength for communities providing servicetypes A and B over time. The triangles represents community strengthfor service community A (where mc = 5), whereas the circles represent thecorresponding community strength for community B. The rectangles andcrosses denote the corresponding populations (for A and B) when (mc = 20).
62

0
0.1
0.2
0.3
0.4
0.5
0.6
0.7
0.8
0.9
1
0 5 10 15 20 25 30
Mea
n co
mm
unity
str
engt
h
Memory size
Figure 16: The mean community strength as a function of memory size.
63

List of Tables
1 The parameters used to configure the evaluation (unless oth-erwise stated). . . . . . . . . . . . . . . . . . . . . . . . . . . 65
2 A variety of different sets of service types for different demandvariety settings. Note that 600 consumers each requiring oneservice can, in principle, be satisfied exactly by 120 providerseach with a capacity 5. . . . . . . . . . . . . . . . . . . . . . . 66
3 Parameters used for the scenario when service demand is dy-namic. . . . . . . . . . . . . . . . . . . . . . . . . . . . . . . . 67
64
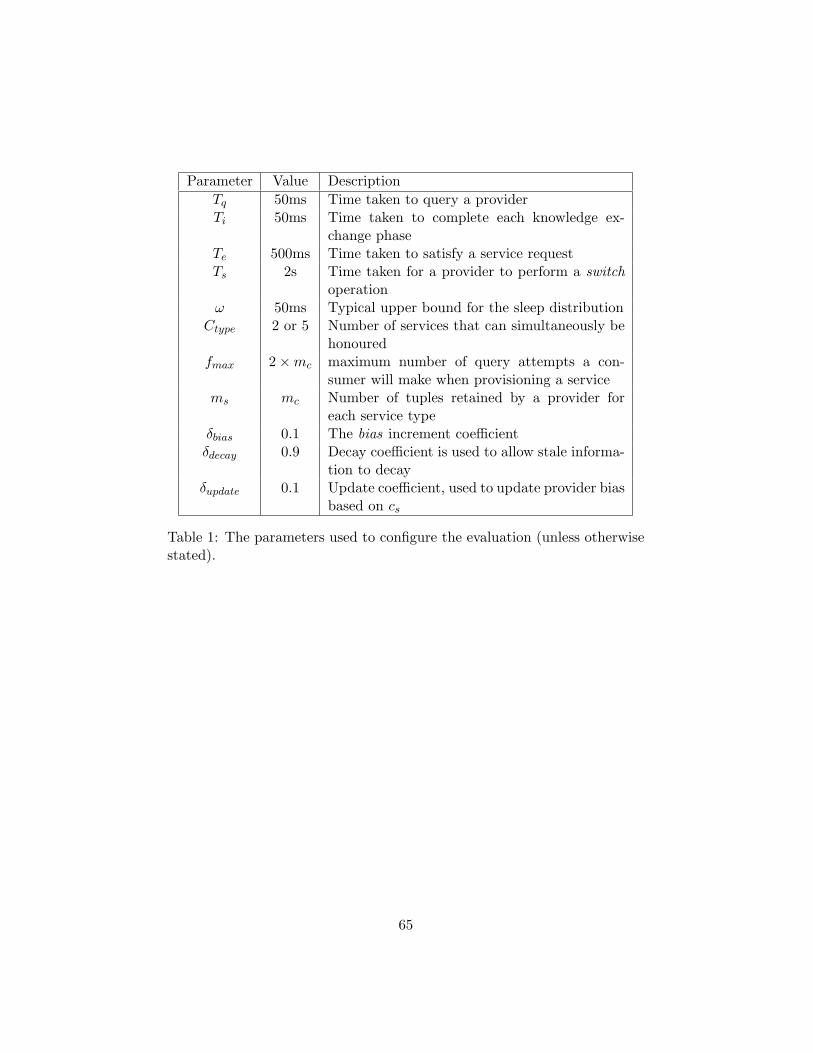
Parameter Value DescriptionTq 50ms Time taken to query a providerTi 50ms Time taken to complete each knowledge ex-
change phaseTe 500ms Time taken to satisfy a service requestTs 2s Time taken for a provider to perform a switch
operationω 50ms Typical upper bound for the sleep distribution
Ctype 2 or 5 Number of services that can simultaneously behonoured
fmax 2×mc maximum number of query attempts a con-sumer will make when provisioning a service
ms mc Number of tuples retained by a provider foreach service type
δbias 0.1 The bias increment coefficientδdecay 0.9 Decay coefficient is used to allow stale informa-
tion to decayδupdate 0.1 Update coefficient, used to update provider bias
based on cs
Table 1: The parameters used to configure the evaluation (unless otherwisestated).
65

V Set of service types Number of Number of Service Capacity(Capability) Consumers Providers Ctype
1 {A} 600 120 52 {A,B} 600 120 53 {A,B, C} 600 120 54 {A,B, C, D} 600 120 55 {A,B, C, D, E} 600 120 56 {A,B, C, D, E, F} 600 120 5
Table 2: A variety of different sets of service types for different demandvariety settings. Note that 600 consumers each requiring one service can, inprinciple, be satisfied exactly by 120 providers each with a capacity 5.
66

V Set of service types Number of Number of Service Capacity(Capability) Consumers Providers Ctype
2 {A,B} 120 60 2
Table 3: Parameters used for the scenario when service demand is dynamic.
67