SELF-DESIGNED WASTEWATER TREATMENT SYSTEM - Theseus
47
Xiao Yao SELF-DESIGNED WASTEWATER TREATMENT SYSTEM FOR DOMESTIC WASTEWATER Wastewater treatment in areas outside sewer networks in Kokkola Bachelor Thesis CENTRAL OSTROBOTHNIA UNIVERSITY OF APPLIED SCIENCES Degree Program in Chemistry and Technology April 2012
Transcript of SELF-DESIGNED WASTEWATER TREATMENT SYSTEM - Theseus
Xiao Yao
SELF-DESIGNED WASTEWATER TREATMENT SYSTEM FOR DOMESTIC WASTEWATER Wastewater treatment in areas outside sewer networks in Kokkola
Bachelor Thesis CENTRAL OSTROBOTHNIA UNIVERSITY OF APPLIED SCIENCES Degree Program in Chemistry and Technology April 2012
ABSTRACT
CENTRAL OSTROBOTHNIA
UNIVERSITY OF APPLIED
SCIENCES
Date
April, 2012
Author
Xiao Yao
Degree programme
Degree Program of Chemistry and Technology
Name of thesis
Self-designed wastewater treatment system for domestic wastewater:
Wastewater treatment in areas outside sewer networks in Kokkola
Instructor
Laura Rahikka
Pages
40+ Appendices (4)
Supervisor
Laura Rahikka
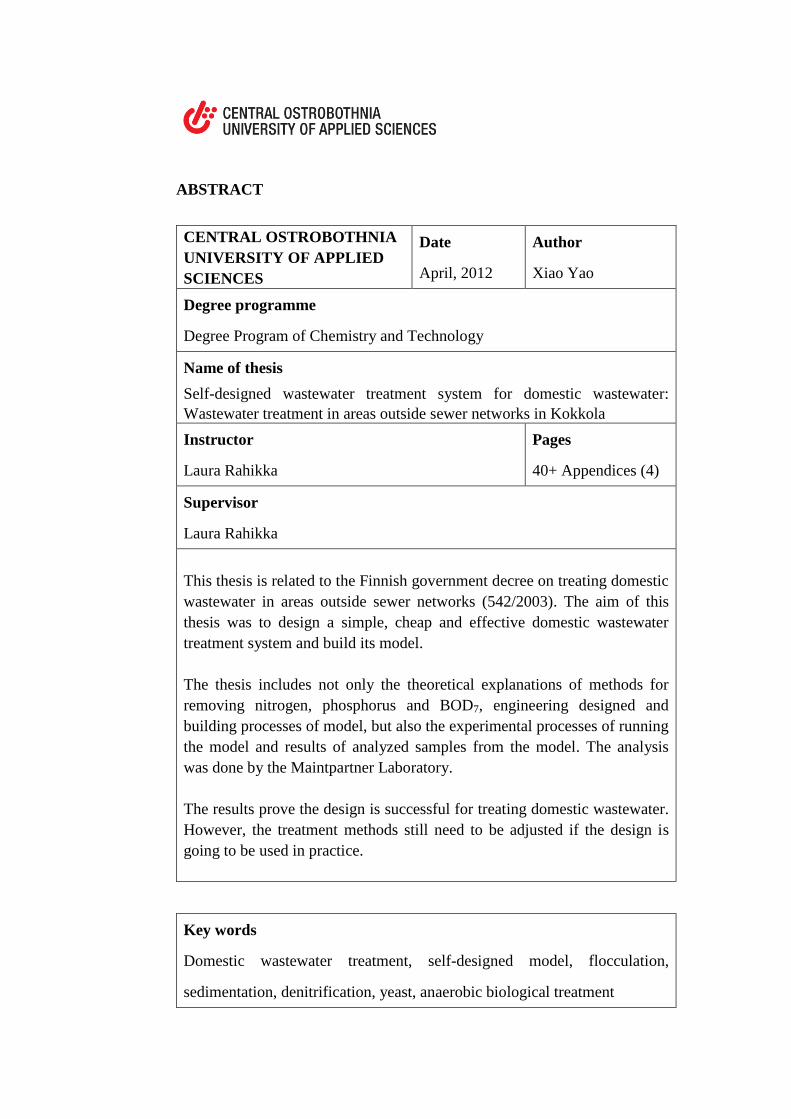
This thesis is related to the Finnish government decree on treating domestic
wastewater in areas outside sewer networks (542/2003). The aim of this
thesis was to design a simple, cheap and effective domestic wastewater
treatment system and build its model.
The thesis includes not only the theoretical explanations of methods for
removing nitrogen, phosphorus and BOD7, engineering designed and
building processes of model, but also the experimental processes of running
the model and results of analyzed samples from the model. The analysis
was done by the Maintpartner Laboratory.
The results prove the design is successful for treating domestic wastewater.
However, the treatment methods still need to be adjusted if the design is
going to be used in practice.
Key words
Domestic wastewater treatment, self-designed model, flocculation,
sedimentation, denitrification, yeast, anaerobic biological treatment
TABLE OF CONTENTS
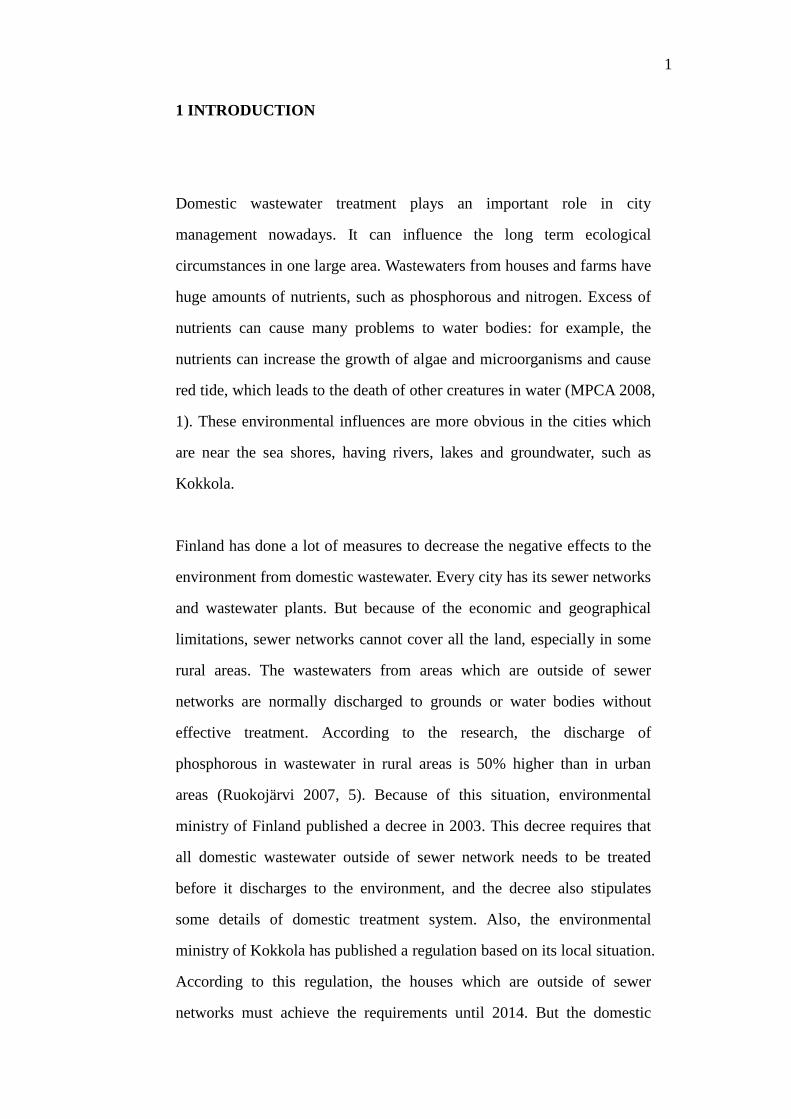
1 INTRODUCTION ........................................................................................ 1
2 BACKGROUND OF ENVIRONMENTAL DECREE ................................ 3
2.1 Decree requirements of Finland .......................................................... 3
2.2 Regulations of Kokkola ...................................................................... 5
3 DESIGN OF DOMESTIC WASTEWATER TREATMENT SYSTEM ....... 7
3.1 Methods of designed treatment system ............................................... 7
3.1.1 Primary treatment of designed treatment system ...................... 7
3.1.2 Secondary treatment of designed treatment system .................. 9
3.1.3 Other methods for practical treatment system ........................ 11
3.2 Self-designed domestic wastewater treatment system ...................... 16
3.2.1 Structure of system ................................................................. 16
3.2.2 Building procedure of designed model system ....................... 19
4 SIMULATIONS OF DESIGNED MODEL SYSTEM ............................... 23
4.1 Test run of designed model system ................................................... 24
4.1.1 Equipment and chemicals ....................................................... 24
4.1.2 Process of test run ................................................................... 25
4.1.3 Data and results of test run...................................................... 27
4.1.4 Conclusion of test run ............................................................. 28
4.2 Model run of designed model system ............................................... 29
4.2.1 Process of model run ............................................................... 31
4.2.2 Results of model run ............................................................... 35
5 CONCLUSIONS AND DISCUSSION....................................................... 37
REFERENCES
APPENDICES
1
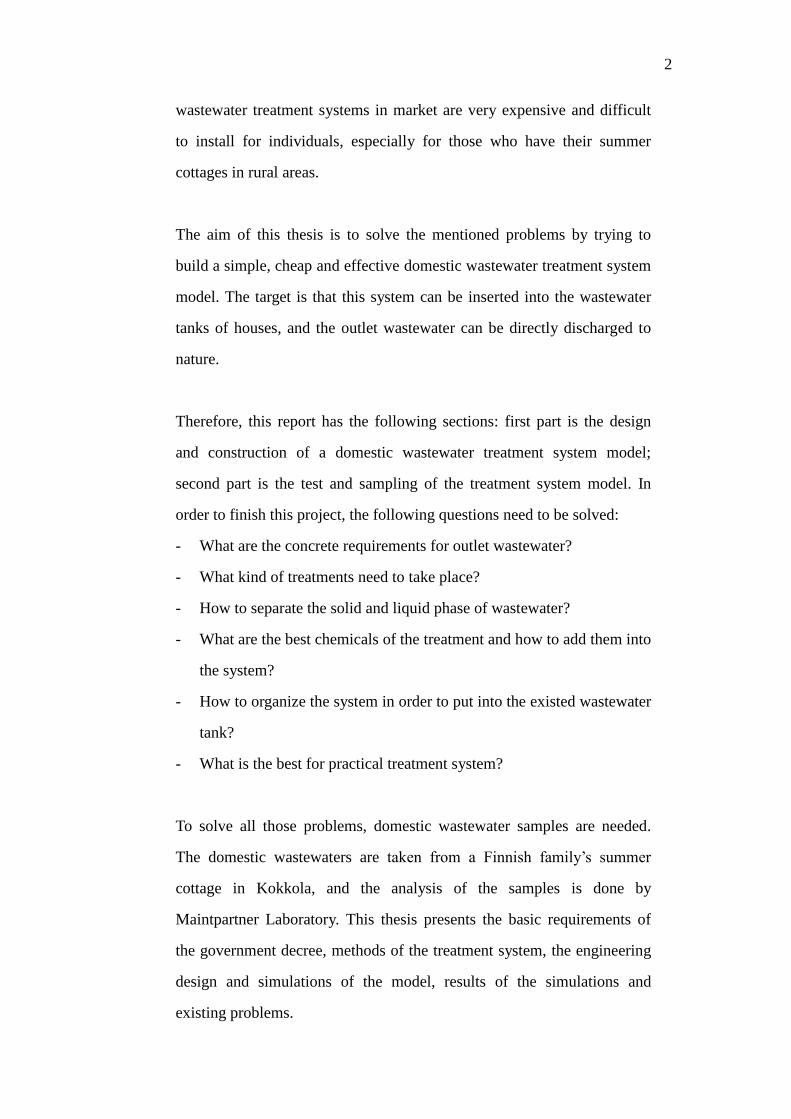
1 INTRODUCTION
Domestic wastewater treatment plays an important role in city
management nowadays. It can influence the long term ecological
circumstances in one large area. Wastewaters from houses and farms have
huge amounts of nutrients, such as phosphorous and nitrogen. Excess of
nutrients can cause many problems to water bodies: for example, the
nutrients can increase the growth of algae and microorganisms and cause
red tide, which leads to the death of other creatures in water (MPCA 2008,
1). These environmental influences are more obvious in the cities which
are near the sea shores, having rivers, lakes and groundwater, such as
Kokkola.
Finland has done a lot of measures to decrease the negative effects to the
environment from domestic wastewater. Every city has its sewer networks
and wastewater plants. But because of the economic and geographical
limitations, sewer networks cannot cover all the land, especially in some
rural areas. The wastewaters from areas which are outside of sewer
networks are normally discharged to grounds or water bodies without
effective treatment. According to the research, the discharge of
phosphorous in wastewater in rural areas is 50% higher than in urban
areas (Ruokojärvi 2007, 5). Because of this situation, environmental
ministry of Finland published a decree in 2003. This decree requires that
all domestic wastewater outside of sewer network needs to be treated
before it discharges to the environment, and the decree also stipulates
some details of domestic treatment system. Also, the environmental
ministry of Kokkola has published a regulation based on its local situation.
According to this regulation, the houses which are outside of sewer
networks must achieve the requirements until 2014. But the domestic
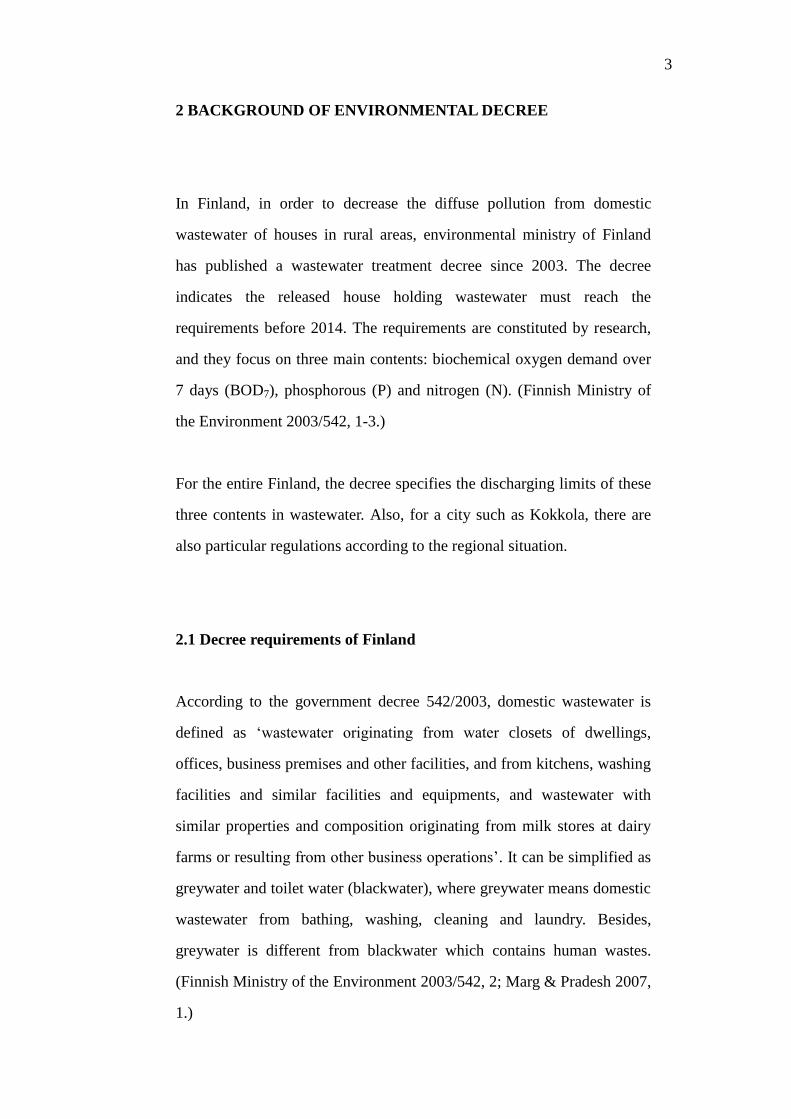
2
wastewater treatment systems in market are very expensive and difficult
to install for individuals, especially for those who have their summer
cottages in rural areas.
The aim of this thesis is to solve the mentioned problems by trying to
build a simple, cheap and effective domestic wastewater treatment system
model. The target is that this system can be inserted into the wastewater
tanks of houses, and the outlet wastewater can be directly discharged to
nature.
Therefore, this report has the following sections: first part is the design
and construction of a domestic wastewater treatment system model;
second part is the test and sampling of the treatment system model. In
order to finish this project, the following questions need to be solved:
- What are the concrete requirements for outlet wastewater?
- What kind of treatments need to take place?
- How to separate the solid and liquid phase of wastewater?
- What are the best chemicals of the treatment and how to add them into
the system?
- How to organize the system in order to put into the existed wastewater
tank?
- What is the best for practical treatment system?
To solve all those problems, domestic wastewater samples are needed.
The domestic wastewaters are taken from a Finnish family’s summer
cottage in Kokkola, and the analysis of the samples is done by
Maintpartner Laboratory. This thesis presents the basic requirements of
the government decree, methods of the treatment system, the engineering
design and simulations of the model, results of the simulations and
existing problems.
3
2 BACKGROUND OF ENVIRONMENTAL DECREE
In Finland, in order to decrease the diffuse pollution from domestic
wastewater of houses in rural areas, environmental ministry of Finland
has published a wastewater treatment decree since 2003. The decree
indicates the released house holding wastewater must reach the
requirements before 2014. The requirements are constituted by research,
and they focus on three main contents: biochemical oxygen demand over
7 days (BOD7), phosphorous (P) and nitrogen (N). (Finnish Ministry of
the Environment 2003/542, 1-3.)
For the entire Finland, the decree specifies the discharging limits of these
three contents in wastewater. Also, for a city such as Kokkola, there are
also particular regulations according to the regional situation.
2.1 Decree requirements of Finland
According to the government decree 542/2003, domestic wastewater is
defined as ‘wastewater originating from water closets of dwellings,
offices, business premises and other facilities, and from kitchens, washing
facilities and similar facilities and equipments, and wastewater with
similar properties and composition originating from milk stores at dairy
farms or resulting from other business operations’. It can be simplified as
greywater and toilet water (blackwater), where greywater means domestic
wastewater from bathing, washing, cleaning and laundry. Besides,
greywater is different from blackwater which contains human wastes.
(Finnish Ministry of the Environment 2003/542, 2; Marg & Pradesh 2007,
1.)
4
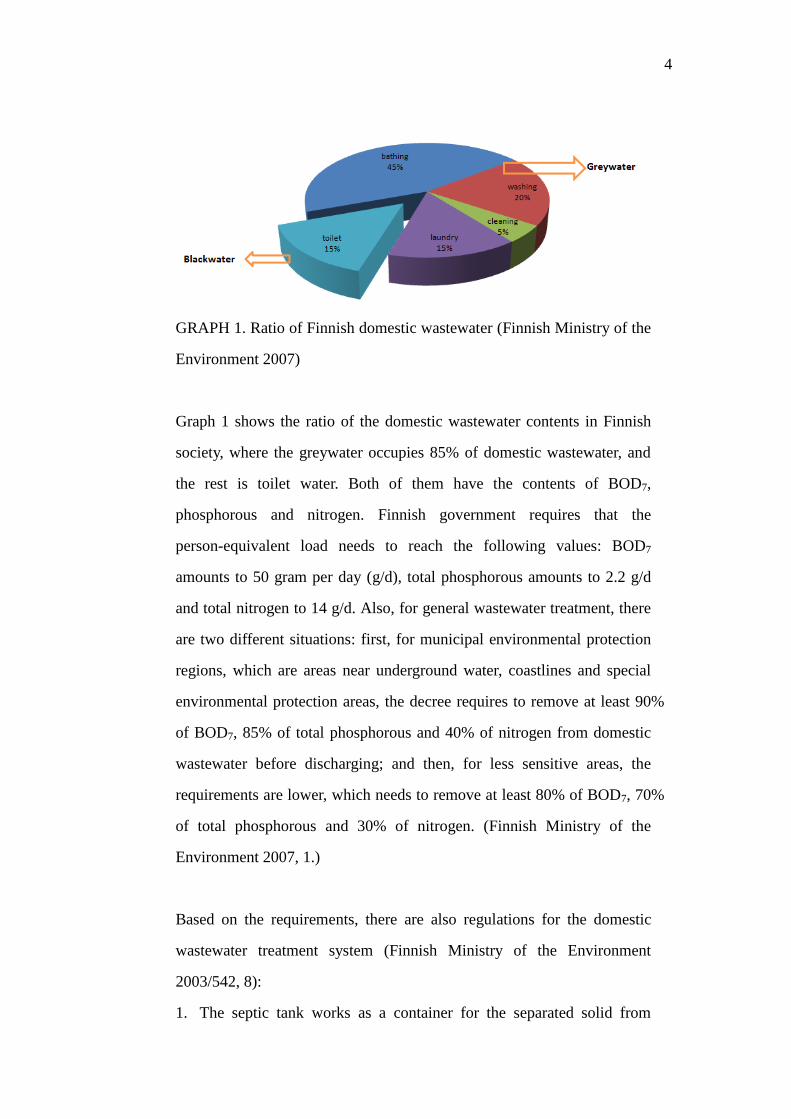
GRAPH 1. Ratio of Finnish domestic wastewater (Finnish Ministry of the
Environment 2007)
Graph 1 shows the ratio of the domestic wastewater contents in Finnish
society, where the greywater occupies 85% of domestic wastewater, and
the rest is toilet water. Both of them have the contents of BOD7,
phosphorous and nitrogen. Finnish government requires that the
person-equivalent load needs to reach the following values: BOD7
amounts to 50 gram per day (g/d), total phosphorous amounts to 2.2 g/d
and total nitrogen to 14 g/d. Also, for general wastewater treatment, there
are two different situations: first, for municipal environmental protection
regions, which are areas near underground water, coastlines and special
environmental protection areas, the decree requires to remove at least 90%
of BOD7, 85% of total phosphorous and 40% of nitrogen from domestic
wastewater before discharging; and then, for less sensitive areas, the
requirements are lower, which needs to remove at least 80% of BOD7, 70%
of total phosphorous and 30% of nitrogen. (Finnish Ministry of the
Environment 2007, 1.)
Based on the requirements, there are also regulations for the domestic
wastewater treatment system (Finnish Ministry of the Environment
2003/542, 8):
1. The septic tank works as a container for the separated solid from

5
pre-treating wastewater.
2. The cesspool is also called holding tank, it is for holding the
wastewater.
3. The soil infiltration system is connected to the ground and allowing
ground to absorb the pre-treated water.
4. The sand filter system contains sands or other soil materials which
works as a filter to purify the treated wastewater.
5. The Package plant is different from 1-4 and has function of treating
wastewater, it can be physical, chemical or biological treatment
systems.
This decree presents the primary regulations for the entire Finland, and on
the basis of it, different regions can have their own detailed regulations
according to different situations.
2.2 Regulations of Kokkola
Based on the local situation, the environmental ministry of Kokkola
published a local regulation in 2011 (Valtioneuvoston asetus
talousjätevesien käsittelystä viemäriverkostojen ulkopuolisilla alueilla).
This regulation has the same basic information as decree 542/2003, but
more detailed requirements for specific areas. It divides the city into four
main parts: ground water areas, beach areas, buffer zones and basic
treatment areas. Each area has its own required wastewater treatment
system. For the first three areas, the systems are more limited because of
their high sensitivity. Also, the basic treatment area covers most of
Kokkola city, and the regulation of wastewater treatment system for this
area is the same as in government decree 542/2003. More details for the
area differences can be found in the Appendix 1, and this thesis only
6
focuses on the basic treatment area.
As a standard comparison of the model treatment system, Table 1 shows
the parameters of existed wastewater tanks for houses in Kokkola. The
parameters are used to calculate the wastewater volume and compare it
with the model. Also, the load of domestic water from one person is
according to the data from environmental ministry of Kokkola.
TABLE 1. Parameters of wastewater tank and personal daily load in
Kokkola
Wastewater tank parameters
Loads (per person)
Height (m) 4 BOD7 (g/d) 70
Diameter (m) 1 Phosphorous (g/d) 3
Volume (m3) 3.14 Nitrogen (g/d) 14
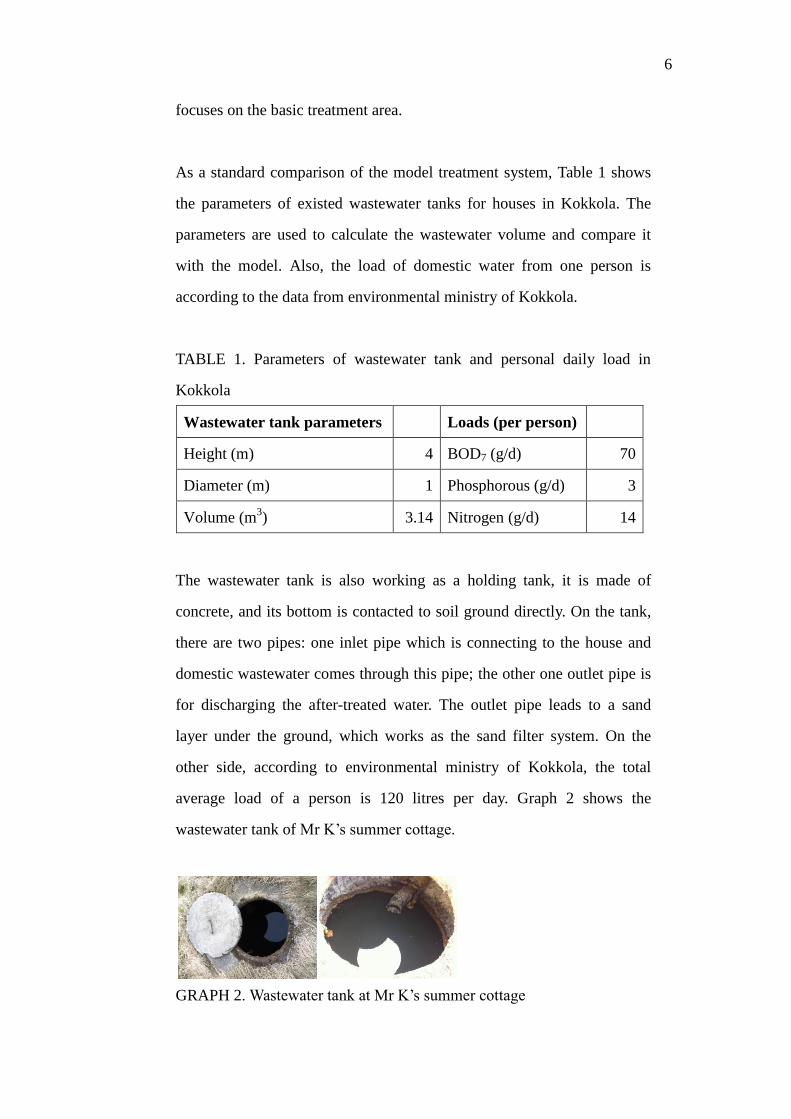
The wastewater tank is also working as a holding tank, it is made of
concrete, and its bottom is contacted to soil ground directly. On the tank,
there are two pipes: one inlet pipe which is connecting to the house and
domestic wastewater comes through this pipe; the other one outlet pipe is
for discharging the after-treated water. The outlet pipe leads to a sand
layer under the ground, which works as the sand filter system. On the
other side, according to environmental ministry of Kokkola, the total
average load of a person is 120 litres per day. Graph 2 shows the
wastewater tank of Mr K’s summer cottage.
GRAPH 2. Wastewater tank at Mr K’s summer cottage
7
3 DESIGN OF DOMESTIC WASTEWATER TREATMENT
SYSTEM
In Finland, domestic wastewater basically consists of greywater and
blackwater. Because of the complicated contents in domestic wastewater,
there are problems to separate the solid and liquid phases of it. Also, how
to remove the BOD7, phosphorous and nitrogen efficiently is also a
crucial problem.
3.1 Methods of designed system
Various methods have been used to treat wastewater, such as
sedimentation, flocculation, chemical precipitation, anaerobic and aerobic
biological technologies and filtration. Because the aim of this thesis is to
build a simple, effective and cheap treatment system for houses, the
chosen methods must not be complicated, and the design needs to be
convenient to assemble.
3.1.1 Primary treatment of designed treatment system
The first step of the domestic wastewater treatment system is to separate
the solid and liquid phases of domestic wastewater. After separation, the
solid stays in septic tank and can be taken away regularly by pump. And
then the taken solid can be transferred by cars and used in farms as
fertilizer. On the other hand, the liquid goes to future treatments in the
system and can be discharged to nature. The primary separation can be

8
done by gravity directly. In this step, solid phase is heavier than liquid
phase so that the solid can stay at the bottom of septic tank and form
sludge. This process is called sedimentation. Besides, there are floating
particulates in the wastewater. The system needs to avoid these
particulates go to the further treatment system as much as possible. For
this purpose, a screen or filter can be helpful to filter most of the
particulates and keep them in the septic tank. Also, flocculation is also a
useful method in this case.
The basic principle of flocculation is to form groups of solid particulates
by using flocculating agents. This method can speed up the sedimentation,
take away part of nitrous and phosphoric contents and also decrease
BOD7. There are many kinds of chemicals which can be used as
flocculating agents. The wastewater treatment plant normally uses
aluminium salt and ferric salt. For instance, poly-aluminium chloride
(Al2Cl(OH)5), aluminium sulphate (Al2(SO4)3*16H2O), ferric sulphate
(Fe2(SO4)3*9H2O), ferric chloride (FeCl3*6H2O), and sodium aluminate
(NaAlO2). The model uses Al2(SO4)3*16H2O and FeCl3*6H2O as the final
choices. There are series of chemical reactions taking place, and each of
them has its effect for reaching the target. (FSC Architects and Engineers
2003; EPA 2000.)
The following equations show the chemical reactions in primary
treatment (FSC Architects and Engineers 2003, 2-5):
- For flocculation:
Al3+
+H2O = Al(OH)2+
+H+
(1)
Al (OH)2+
+H2O = Al(OH)2+
+H+
(2)
Al(OH)2+
+H2O = Al(OH)3↓+H+
(3)
9
Al(OH)3+H2O = Al(OH)4-
+H+
(4)
Fe3+
+H2O = Fe(OH)2+
+H+
(5)
Fe (OH)2+
+H2O = Fe(OH)2+
+H+
(6)
Fe(OH)2+
+H2O = Fe(OH)3↓+H+
(7)
Fe(OH)3+H2O = Fe(OH)4-
+H+
(8)
For taking away nitrous contents (EPA 2000):
Fe3+
+3NH3*H2O = Fe(OH)3↓+3NH4+
(9)
NH3+H2O = NH4+
+OH- (10)
For taking away phosphoric contents (FSC Architects and Engineers 2003,
2-6):
Al3+
+PO43+
= AlPO4↓ (11)
Fe3+
+PO43+
= FePO4↓ (12)
For decrease BOD7 (Sharma 2001, 12):
4Fe3+
+O2+2H2O = 4Fe3+
+4OH- (13)
All the solid precipitations stay in the septic tank and form sludge, and
then the liquid goes through the screen to next treatment.
3.1.2 Secondary treatment of designed treatment system
After the sedimentation and primary treatment, most of the solid
particulates are separated from liquid, and the liquid goes to the secondary
treatment tank. The secondary treatment mainly focuses on decreasing the
amount of nitrous and phosphoric contents. In this stage, calcium
10
carbonate (CaCO3) and alcohol play the main roles. Consider the
simulation period limit, the model treatment system uses chalkstone (also
known as limestone) and methanol in the model system. The pre-treated
wastewater first goes through layers of chalkstones, and there are
hydroxide ions formed. This process can adjust the pH of wastewater for
further treatment. Also, in order to remove the phosphoric contents, the
added chalkstones must be sufficient to increase the pH to 10, and then
the calcium ions can react with phosphate to form hydroxyapatite
precipitate (Ca5(OH)(PO4)3) (EPA 2000). After this process, the liquid
goes to the next stage where contains methanol. In this stage, methanol
works as a carbon source for growing bacteria and also causes
denitrification, which can remove the nitrous contents by converting them
to gas form and discharging to atmosphere (Methanol institute 2011). The
following equations show the chemical reactions which are taken places
in secondary treatment (Strom 2006, 9; The water plant company 2012):
- Chalkstone (CaCO3):
5Ca2+
+4OH-+3HPO4
2- = Ca5(OH)(PO4)3↓+3H2O (14)
- Methanol (CH3OH):
6NH3+5CH3OH+12O2 = 3N2↑+5CO2↑+19H2O (15)
During this process, most of the nitrous and phosphoric contents are taken
away, and hopefully the ratios can reach the requirements in
environmental decree. The treated wastewater can be discharged through
the outlet pipe and goes to the sand layer underground, and it works as a
natural sand filter. After the sand filter, the wastewater can discharge to
nature directly.
11
3.1.3 Other methods for practical treatment system
Because the space and time limitations, there are many other methods can
be useful in wastewater treatment but cannot be presented in the model.
However, in the practical system, these methods can also be used. This
chapter presents three most practical methods, and all of them can be add
into this designed real wastewater treatment system without any
difficulties.
The first method is a kind of chemical treatment by using hypochlorous
acid (HOCl), which can be used to remove the nitrous contents and lead
to chlorination to purify the wastewater. Hypochlorous acid can react with
ammonium ions (NH4+
) and forms nitrogen gas. About 7.5 milligrams of
chloride can oxidize 1 milligram of ammonium ions. This chemical can
be add to the secondary reaction tank with methanol, which is used to take
more nitrous contents away. The following equations show the chemical
reactions which are taken places in this case (EPA 1974, 17):
NH4++ HOCl = NH2Cl+H
++H2O (16)
2NH2Cl+ HOCl = N2↑+3Cl-+ H2O+ 3H
+ (17)
But the disadvantage of this method is that there are chloric contents, and
too much chlorine can be toxic and cause problems to the environment.
(EPA, 1974.)
12
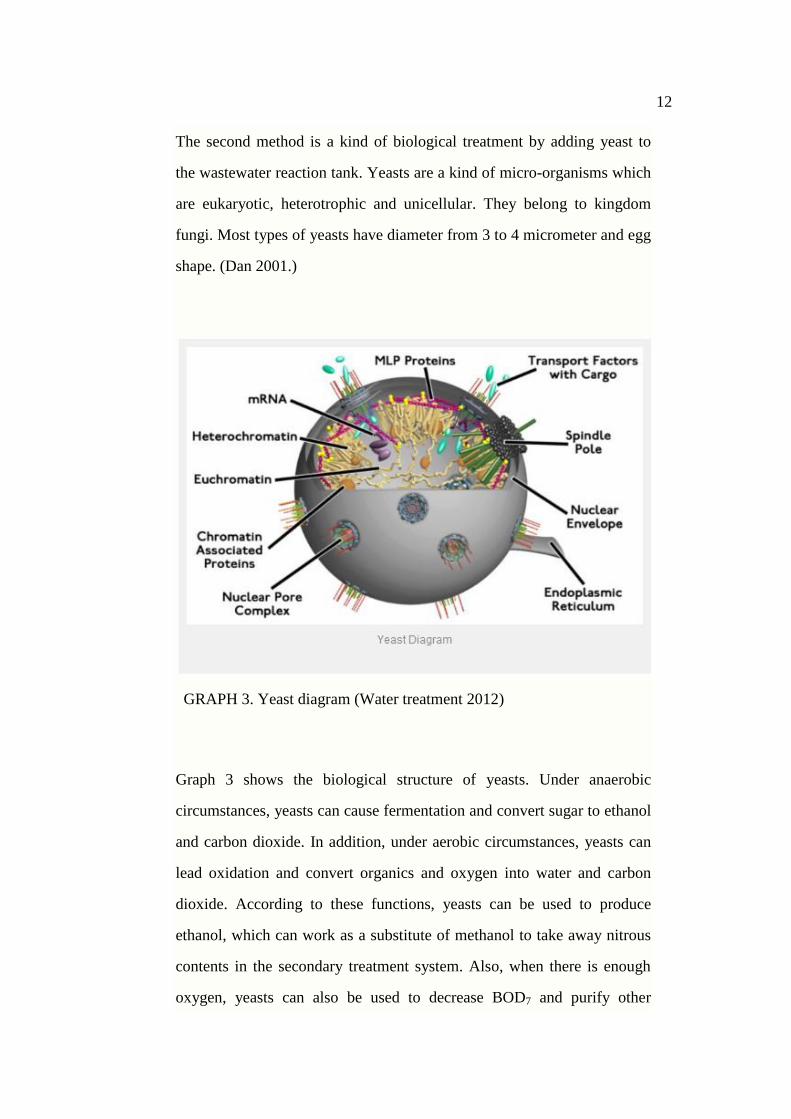
The second method is a kind of biological treatment by adding yeast to
the wastewater reaction tank. Yeasts are a kind of micro-organisms which
are eukaryotic, heterotrophic and unicellular. They belong to kingdom
fungi. Most types of yeasts have diameter from 3 to 4 micrometer and egg
shape. (Dan 2001.)
GRAPH 3. Yeast diagram (Water treatment 2012)
Graph 3 shows the biological structure of yeasts. Under anaerobic
circumstances, yeasts can cause fermentation and convert sugar to ethanol
and carbon dioxide. In addition, under aerobic circumstances, yeasts can
lead oxidation and convert organics and oxygen into water and carbon
dioxide. According to these functions, yeasts can be used to produce
ethanol, which can work as a substitute of methanol to take away nitrous
contents in the secondary treatment system. Also, when there is enough
oxygen, yeasts can also be used to decrease BOD7 and purify other
13
organic matters in wastewater. The following equations show the
chemical reactions which are taken places in this case (Dan 2001, 22-24):
- Fermentation
C6H12O6
C2H5OH + CO2+new yeast cells
(18)
- Oxidation
Organics+O2
CO2+H2O+new yeast
cells+end products (19)
The disadvantage of this method is that to breed yeasts and complete the
transformations take longer period than chemical treatments. Also, yeasts
are influenced by many factors: for instance, they require certain
environment where pH of water needs to be lower than 7 and the
temperature needs to be higher than 8 degrees Celsius, so the final results
are difficult to predict and control. (Dan 2001.)
The third method is also biological, and it is called anaerobic biological
treatment by breeding anaerobic bacteria in the treatment system. The
anaerobic reaction can be divided to four steps (Dan 2001, 17; Mrowiec
& Suschka 2008, 1-6):
14
1. Hydrolysis: Because polymeric organics have large molecular
volumes, they cannot go through the cell wall of anaerobic bacteria.
And the large molecules needs enzyme which is contained in the
wastewater to decompose them to smaller ones. For instance, the
cellulose in wastewater can be decomposed by cellulase enzyme into
cellobiose and glucose, and starch can be decomposed into maltose
and glucose, and protein into peptide and amino acid. After
decomposition, these decomposed smaller molecules can go through
the cell wall of bacteria and continue biological decomposition.
2. Acidification: in this step, all the decomposed organic molecules are
converted by bacteria into other compounds. Most formed compounds
are volatile fatty acid, and also small amount of alcohols, lactic acid,
carbon dioxide, hydrogen, ammonia and hydrogen sulphide.
3. Acetogenic activity: during this process, the products from last step
convert to acetic acid, carbonic acid, hydrogen and new cells.
4. Methanogenic activity: all the acetic acid, hydrogen, carbonic acid,
formic acid and methanol are converted into methane, carbon dioxide
and new cells. This process is the most important step in the anaerobic
reaction and it takes long time.
The following equations show the chemical reactions which are
happening in the last step of the anaerobic reaction (Mrowiec & Suschka
2008, 3):
CH3COO-+H2O = CH4+HCO3
- (20)
HCO3-+H
++4H2 = CH4+3H2O (21)
15
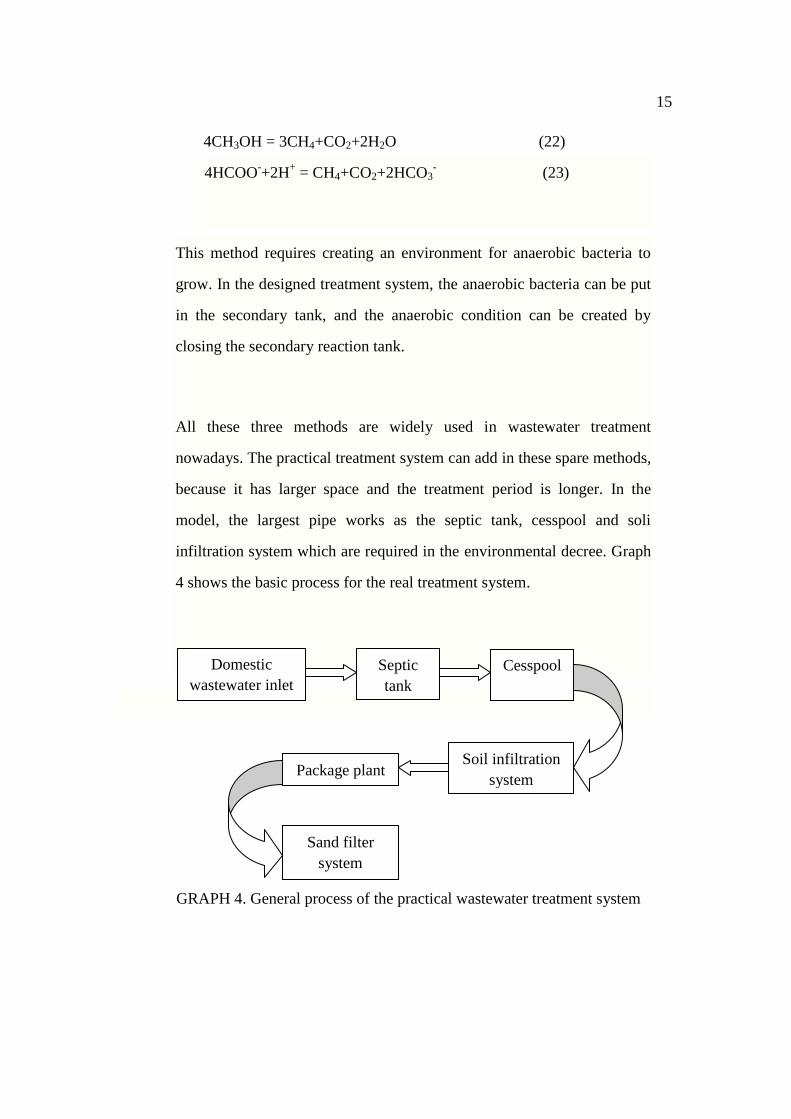
4CH3OH = 3CH4+CO2+2H2O (22)
4HCOO-+2H
+ = CH4+CO2+2HCO3
- (23)
This method requires creating an environment for anaerobic bacteria to
grow. In the designed treatment system, the anaerobic bacteria can be put
in the secondary tank, and the anaerobic condition can be created by
closing the secondary reaction tank.
All these three methods are widely used in wastewater treatment
nowadays. The practical treatment system can add in these spare methods,
because it has larger space and the treatment period is longer. In the
model, the largest pipe works as the septic tank, cesspool and soli
infiltration system which are required in the environmental decree. Graph
4 shows the basic process for the real treatment system.
GRAPH 4. General process of the practical wastewater treatment system
Domestic
wastewater inlet
Septic
tank
Cesspool
Soil infiltration
system Package plant
Sand filter
system
16
3.2 Self-designed domestic wastewater treatment system
The self-design includes both practical system and model system. The
model is built to represent the basic engineering structure and chemical
treatment methods of the real treatment system. The methods which are
used in the model are limited, and the real system can be more
complicated and detailed. The model uses a large cylindrical plastic pipe
to represent the real concrete wastewater tank, and the secondary
treatment tank is consist of four smaller pipes which can be put into the
largest one. The materials used in this model are ready-made pipes and
tubes, so the size of these materials cannot be changed, but it can be
adjusted and is good enough to represent the whole treatment system. The
pipes are made of acrylic material and tubes are normal plastic water
pipes which are typically used in boats.
3.2.1 Structure of system
In the practical system, based on methods and requirements from the
decree, the model has two main parts. The first part is an existed concrete
wastewater tank which functions as the septic tank, cesspool and soil
infiltration system. Domestic wastewater comes through the inlet tube and
falls down to the bottom of it. The chemicals which are used for primary
treatment are placed under the inlet tube, and the wastewater flow takes
and mixes chemicals by itself. After this, the wastewater stays in the tank
and begins to react with the chemicals. As time goes by, the water level in
the tank is raised by adding more and more wastewater, and then the
wastewater goes to the second part of the system. The second part of the
17
system functions as a package plant, and it is in cylinder form and places
on wall of the wastewater tank. This cylinder can be closed from the top
which can create an anaerobic environment for anaerobic bacteria growth.
At the lower part of this cylinder, there is a screen placed for preventing
floating materials and other solid particulates from wastewater going into
next treatment part. Moreover, on the screen are layers of chalkstone, and
the wastewater goes through them and then to the upper part. Besides, in
this cylinder, there are three smaller cylinders which are closed from both
sides, and they are placed at the upper parts of the larger cylinder. While
water level rises, the wastewater goes in to those three cylinders through
small tubes. There are also three tubes connecting the cover of the three
smaller cylinders with atmosphere. These three tubes are used for adding
methanol or other chemicals. Also, in order to balance the pressure of this
system, the three tubes can be used to release the produced gases.
In the model system, the first part is a largest pipe which represents the
wastewater tank in the real system and works as a primary treatment tank.
Inside of the largest pipe, four smaller pipes represent the secondary
treatment system in the practical system. This part is made up of four
pipes, where three smaller pipes are contained in one bigger pipe. The
three smaller pipes are covered from both sides, and there are three plastic
tubes connected on the top of each pipe.
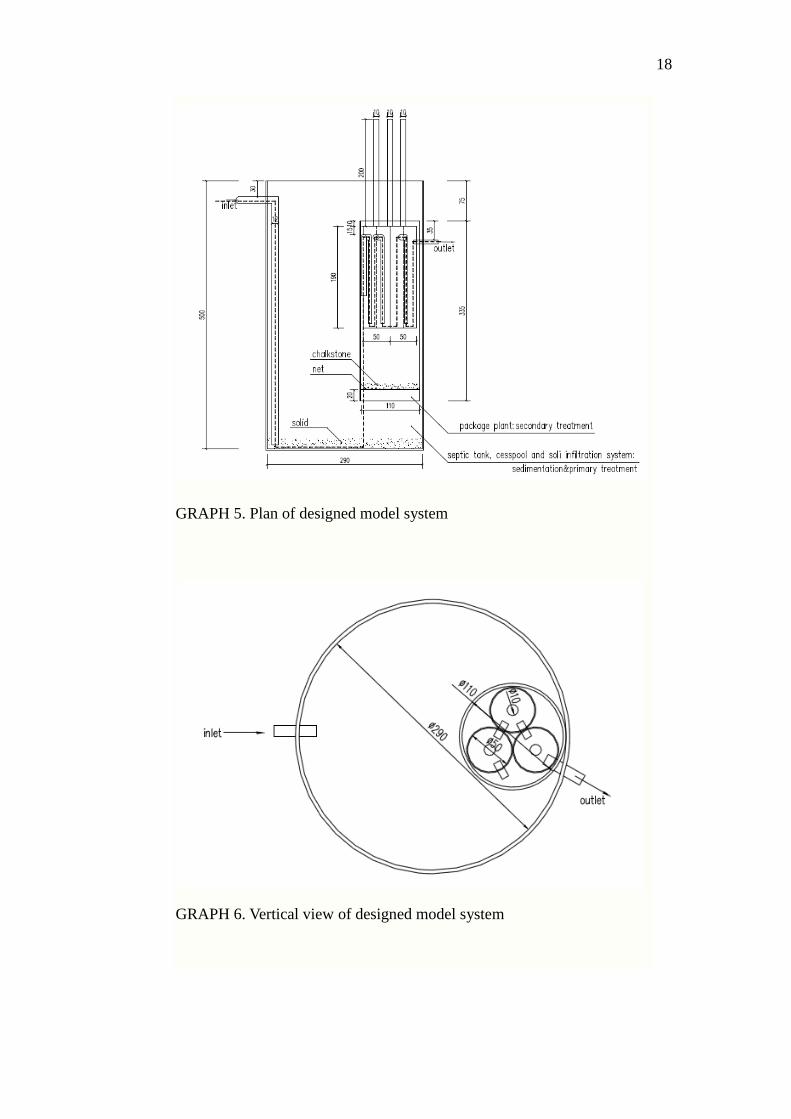
In order to explain the details of the system more clear, Graph 5 is the
plan and Graph 6 is vertical view of the model system. Besides, Graph 7
shows the three-dimensional view of the whole designed system. All these
graphs are drawn by using computer aided design (CAD) software.
18
GRAPH 5. Plan of designed model system
GRAPH 6. Vertical view of designed model system
19
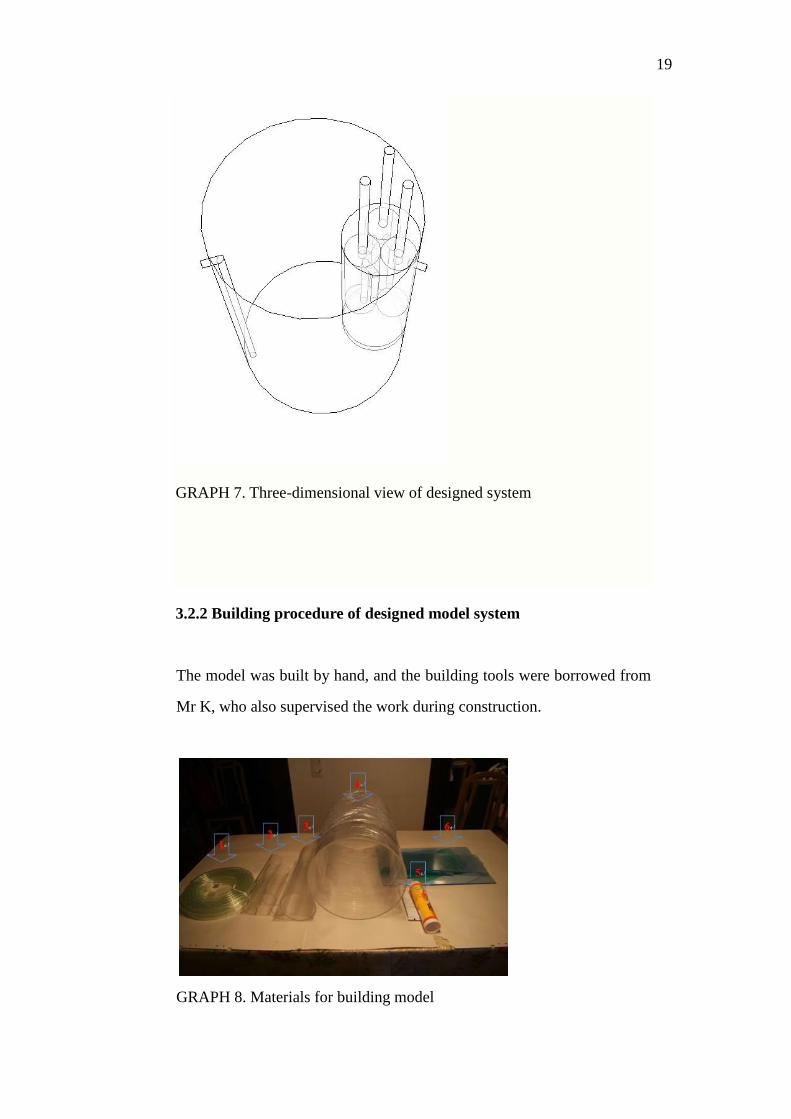
GRAPH 7. Three-dimensional view of designed system
3.2.2 Building procedure of designed model system
The model was built by hand, and the building tools were borrowed from
Mr K, who also supervised the work during construction.
GRAPH 8. Materials for building model
20
Graph 8 shows the main materials for building the model. No.1 indicates
the connecting tube for inlet and outlet, and it is also used to connect the
three smaller pipes for secondary treatment system. No.2, 3 and 4 are
acrylic pipes with three different sizes. No.5 indicates two materials
which are used to glue the covers of pipes and fulfil the possible gap in
order to prevent water or air leaking. No.6 has the same materials as 2, 3
and 4, and they are used to make the covers for pipes.
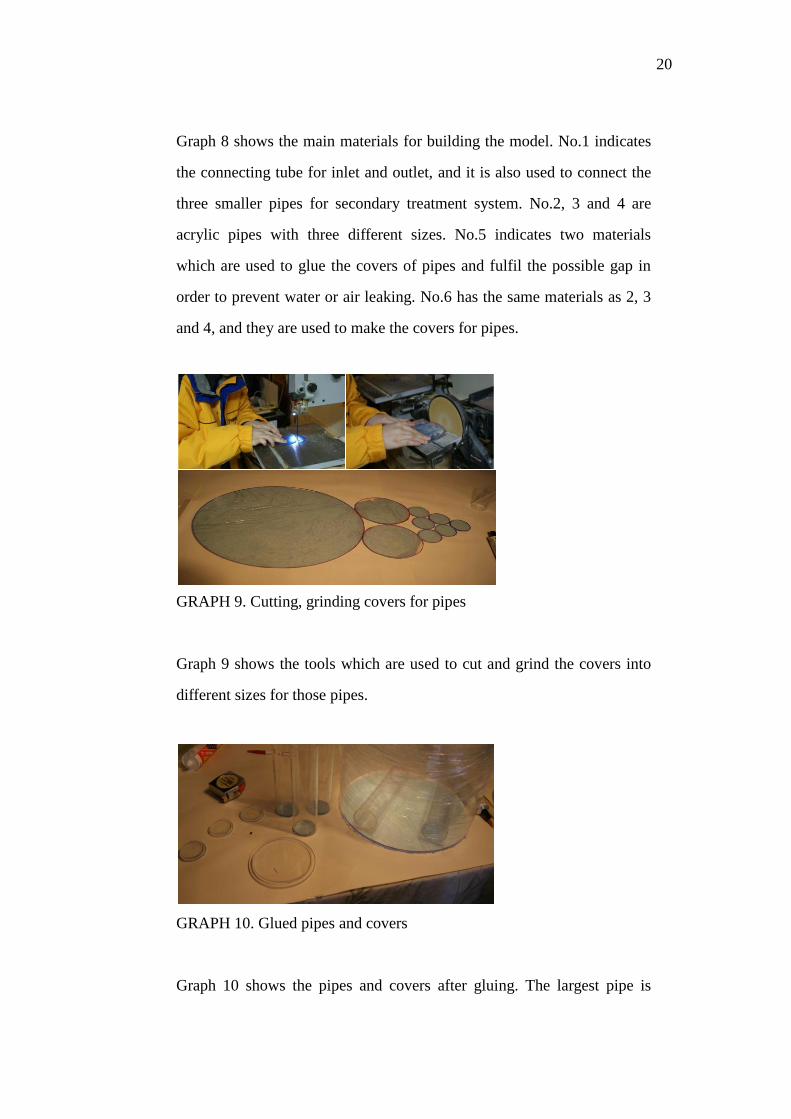
GRAPH 9. Cutting, grinding covers for pipes
Graph 9 shows the tools which are used to cut and grind the covers into
different sizes for those pipes.
GRAPH 10. Glued pipes and covers
Graph 10 shows the pipes and covers after gluing. The largest pipe is
21
covered and glued on one side, and the three smaller pipes are covered
and glued on both sides. All the covers are first glued and then made
water-tight by using silicone sealant.
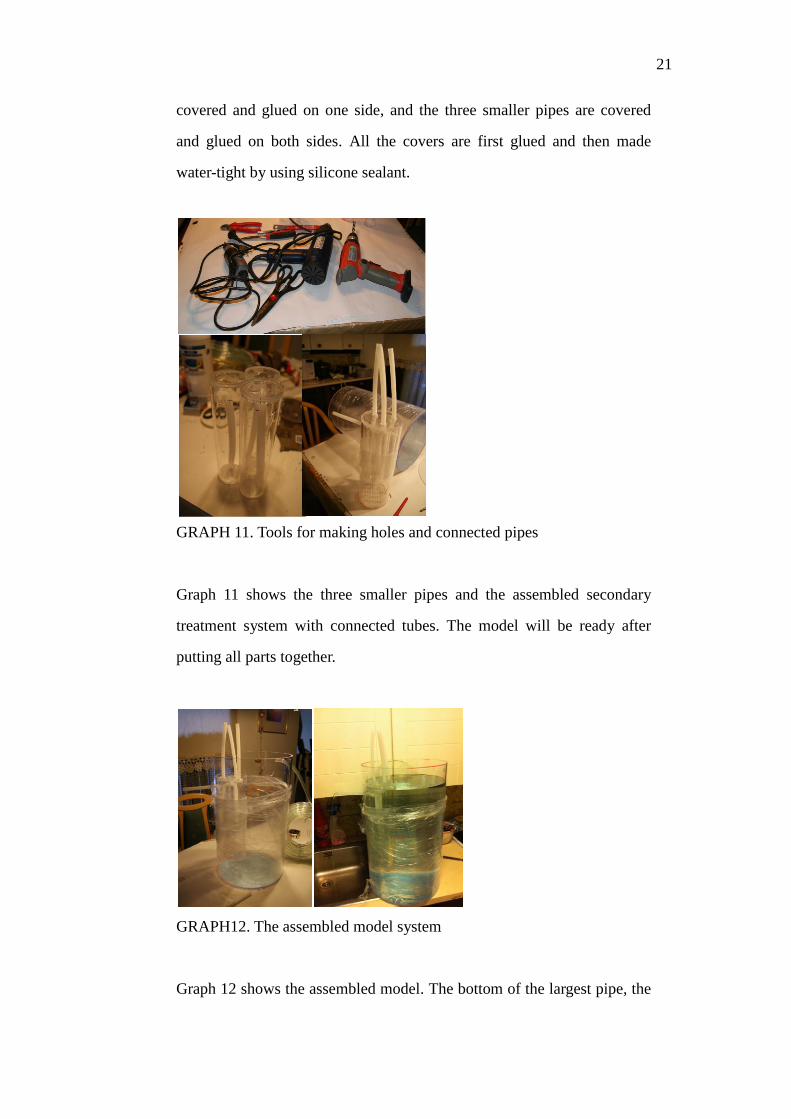
GRAPH 11. Tools for making holes and connected pipes
Graph 11 shows the three smaller pipes and the assembled secondary
treatment system with connected tubes. The model will be ready after
putting all parts together.
GRAPH12. The assembled model system
Graph 12 shows the assembled model. The bottom of the largest pipe, the
22
connecting tubes of secondary treatment and the outlet tubes are
water-tight, so the wastewater path can go as planned and the model can
work well without leaking. After assembling the model system, it can be
taken to the laboratory to run simulation with domestic wastewater
samples.
The principle for the model is as simple as possible, so the model has no
electrical parts in its mechanism. But in the practical system, electrical
mixing and pumping system can be added in, and they can make the
whole system more effective. After mixing, the wastewater can react
better with chemicals than in the model. Also, the more wastewater
contact with air in the first holding tank, the more nitrous contents can be
taken away. Besides, in the real treatment system, there is enough space
for adding other kinds of chemicals, and the reaction time period is much
longer than what is presented in the simulation of model. All in all, the
simulation of model cannot totally represent the effects and results of the
real treatment system, and it is limited by time, space and methods. The
simulation can only show the working mechanism and basic methods of
the real treatment system during short time period. Besides, the sand filter
system is not presented in the simulation.
23
4 SIMULATIONS OF DESIGNED MODEL SYSTEM
There are two parts in this chapter: the first part is the simulation of the
model. This part was made in the laboratory by myself, and my thesis
teacher advised me during the simulation. The second part is sampling
and analysis. The analysis was done in the Maintpartner Laboratory,
which also does the water analysis for Kokkola City. This part presents
the results and the discussion of appeared problems according to the
results.
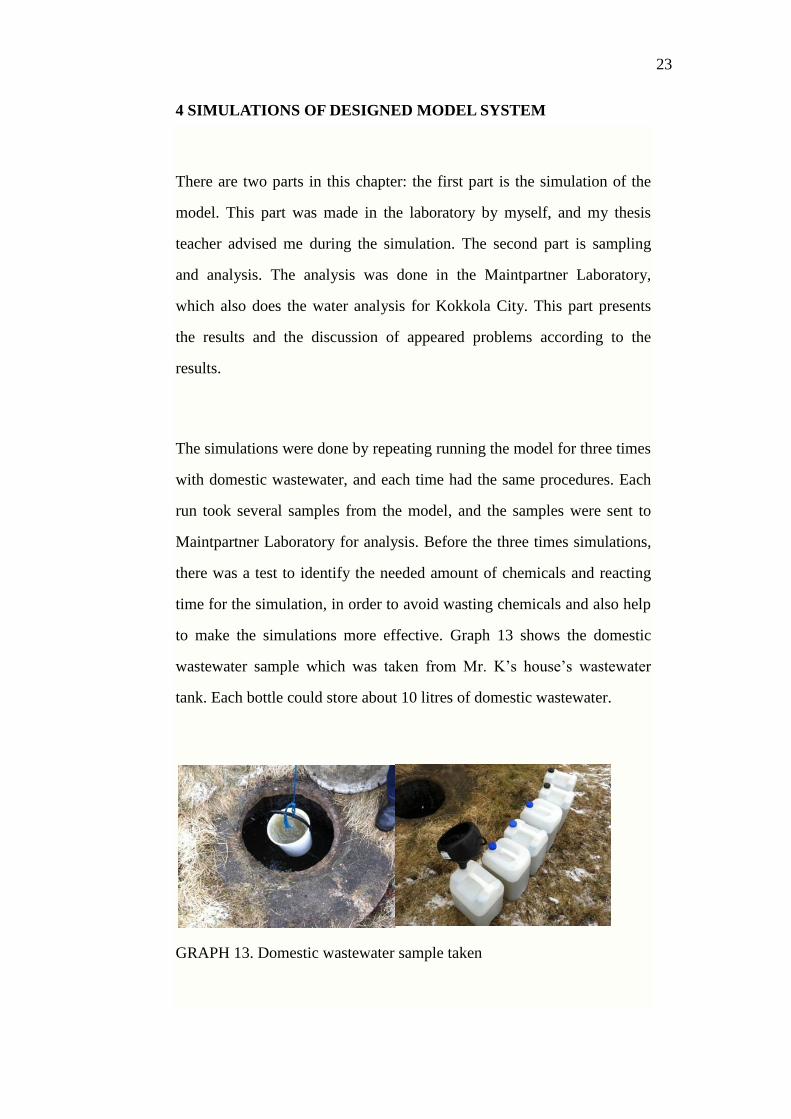
The simulations were done by repeating running the model for three times
with domestic wastewater, and each time had the same procedures. Each
run took several samples from the model, and the samples were sent to
Maintpartner Laboratory for analysis. Before the three times simulations,
there was a test to identify the needed amount of chemicals and reacting
time for the simulation, in order to avoid wasting chemicals and also help
to make the simulations more effective. Graph 13 shows the domestic
wastewater sample which was taken from Mr. K’s house’s wastewater
tank. Each bottle could store about 10 litres of domestic wastewater.
GRAPH 13. Domestic wastewater sample taken
24
4.1 Test run of designed model system
The test was to identify the best amount for flocculation by using
Al2(SO4)3*16H2O and FeCl3*6H2O to react with domestic wastewater.
According to research, the pH of wastewater and the concentration of
flocculants could influence flocculation. For Al2(SO4)3*16H2O and
FeCl3*6H2O, the best pH value of wastewater is from 5.5 to 8, and the
best ratio by weight of the flocculants and wastewater is 0.5-1.5:1000.
Also, according to the properties of two chemicals, the used amount of
FeCl3*6H2O needed to be higher than Al2(SO4)3*16H2O. Therefore, in
this test, the ratio between Al2(SO4)3*16H2O and FeCl3*6H2O is 2:5, the
chemicals were dissolved in diluted water and had the concentration 0.02
grams per litre. Five different amounts of the solution were added
respectively into 400 millilitres domestic wastewater to figure out the best
flocculants’ amount for flocculation. (Fasemore 2004.)
4.1.1 Equipment and chemicals
Measuring cylinders
Bakers
Balance
pH measuring equipment
Measuring pipes
Mixing plate
Al2(SO4)3*16H2O
25
FeCl3*6H2O
Domestic wastewater
4.1.2 Process of test run
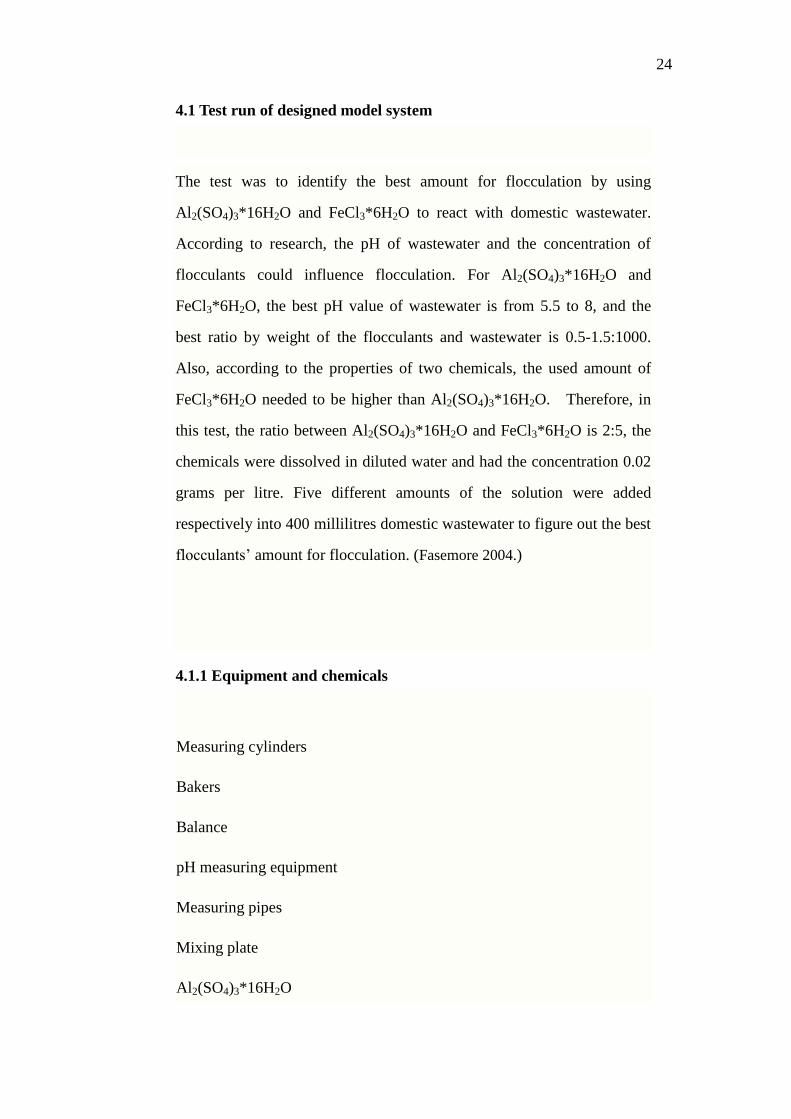
The first step was taking 300 millilitres wastewater sample to measure its
pH, and the measured pH value was about 7.6. Graph 14 shows the pH of
wastewater sample.
GRAPH 14. pH of wastewater sample.
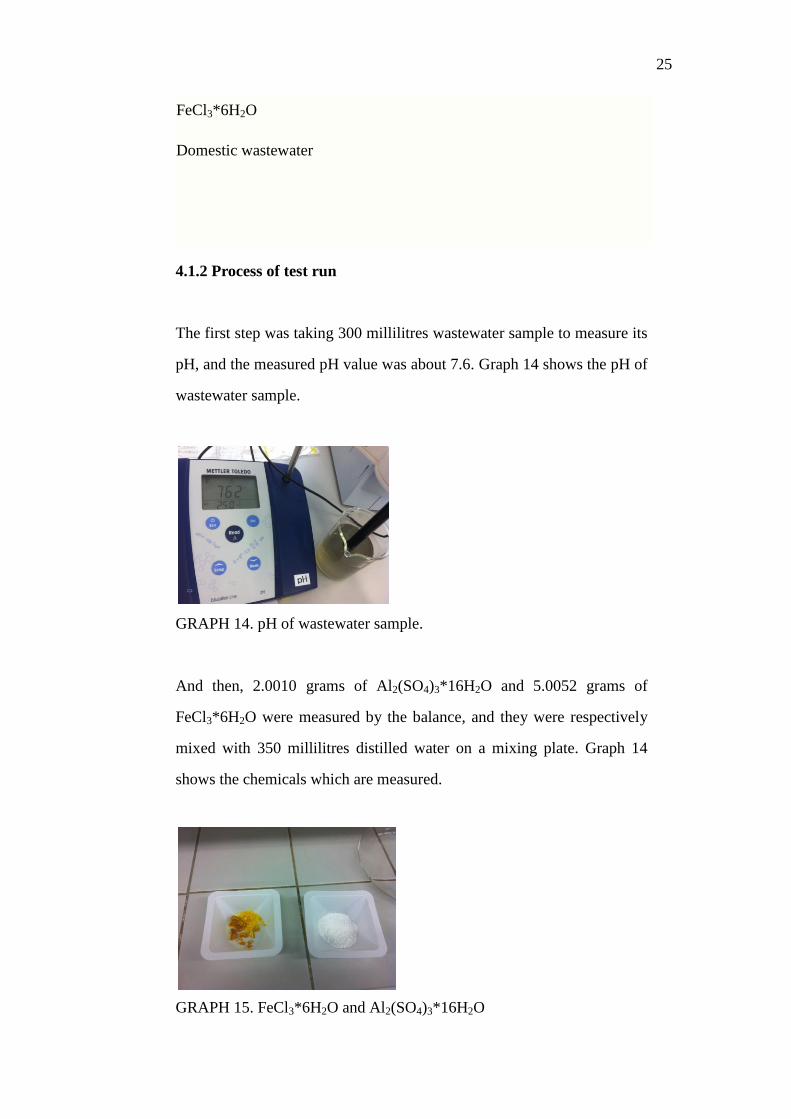
And then, 2.0010 grams of Al2(SO4)3*16H2O and 5.0052 grams of
FeCl3*6H2O were measured by the balance, and they were respectively
mixed with 350 millilitres distilled water on a mixing plate. Graph 14
shows the chemicals which are measured.
GRAPH 15. FeCl3*6H2O and Al2(SO4)3*16H2O
26
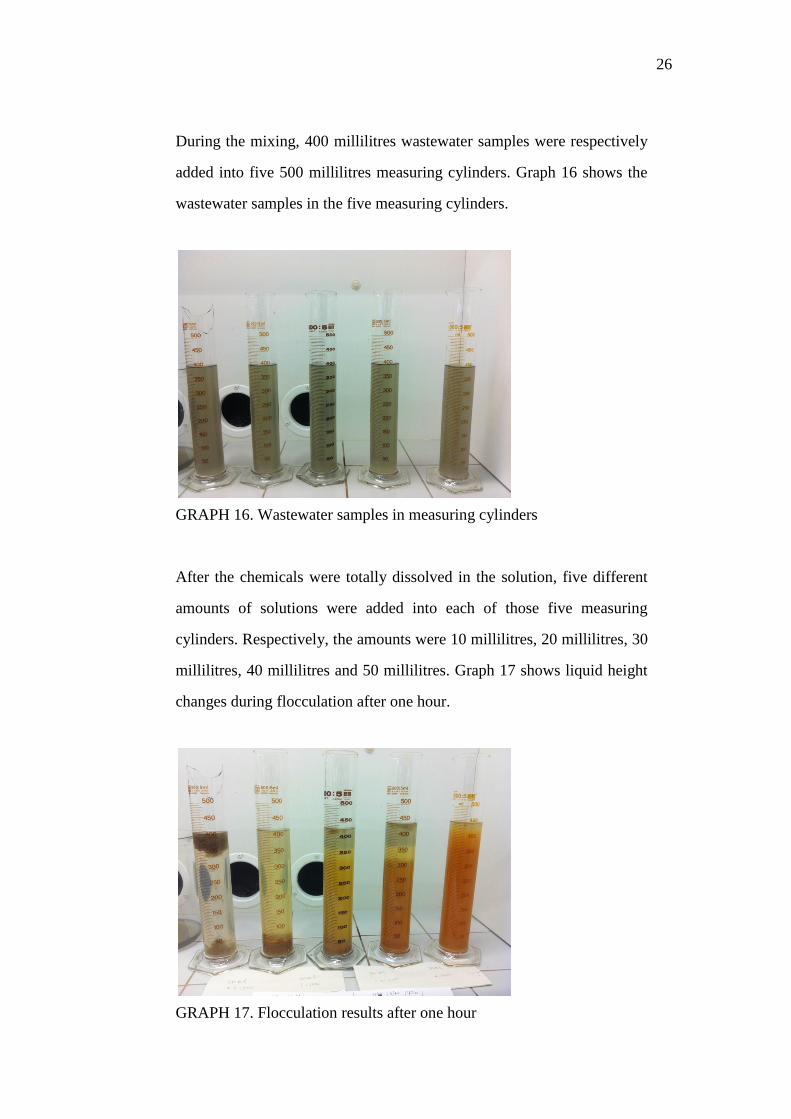
During the mixing, 400 millilitres wastewater samples were respectively
added into five 500 millilitres measuring cylinders. Graph 16 shows the
wastewater samples in the five measuring cylinders.
GRAPH 16. Wastewater samples in measuring cylinders
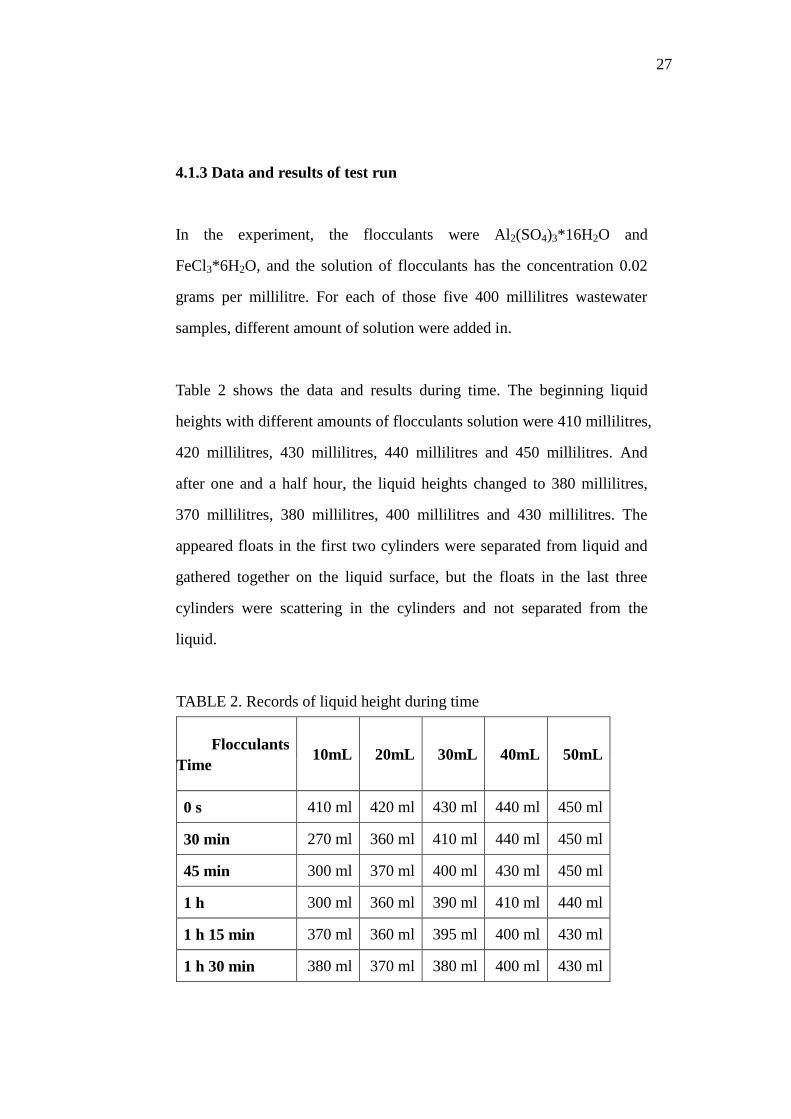
After the chemicals were totally dissolved in the solution, five different
amounts of solutions were added into each of those five measuring
cylinders. Respectively, the amounts were 10 millilitres, 20 millilitres, 30
millilitres, 40 millilitres and 50 millilitres. Graph 17 shows liquid height
changes during flocculation after one hour.
GRAPH 17. Flocculation results after one hour
27
4.1.3 Data and results of test run
In the experiment, the flocculants were Al2(SO4)3*16H2O and
FeCl3*6H2O, and the solution of flocculants has the concentration 0.02
grams per millilitre. For each of those five 400 millilitres wastewater
samples, different amount of solution were added in.
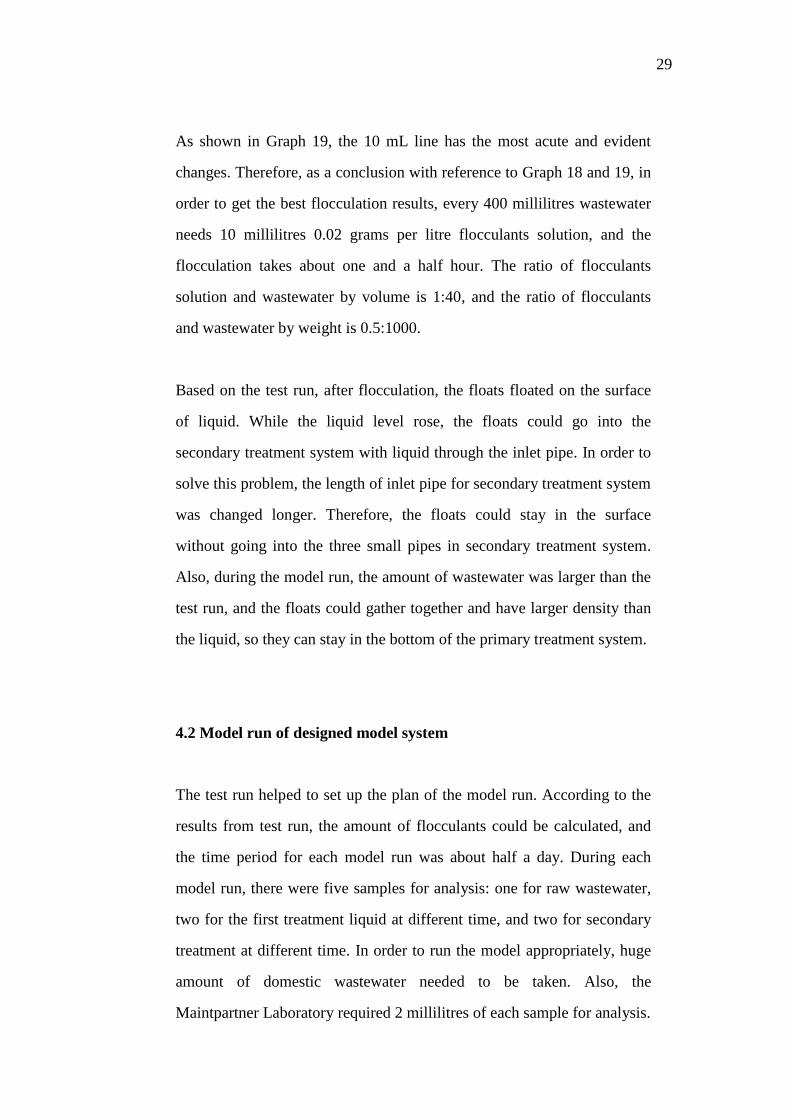
Table 2 shows the data and results during time. The beginning liquid
heights with different amounts of flocculants solution were 410 millilitres,
420 millilitres, 430 millilitres, 440 millilitres and 450 millilitres. And
after one and a half hour, the liquid heights changed to 380 millilitres,
370 millilitres, 380 millilitres, 400 millilitres and 430 millilitres. The
appeared floats in the first two cylinders were separated from liquid and
gathered together on the liquid surface, but the floats in the last three
cylinders were scattering in the cylinders and not separated from the
liquid.
TABLE 2. Records of liquid height during time
Flocculants
Time 10mL 20mL 30mL 40mL 50mL
0 s 410 ml 420 ml 430 ml 440 ml 450 ml
30 min 270 ml 360 ml 410 ml 440 ml 450 ml
45 min 300 ml 370 ml 400 ml 430 ml 450 ml
1 h 300 ml 360 ml 390 ml 410 ml 440 ml
1 h 15 min 370 ml 360 ml 395 ml 400 ml 430 ml
1 h 30 min 380 ml 370 ml 380 ml 400 ml 430 ml
28
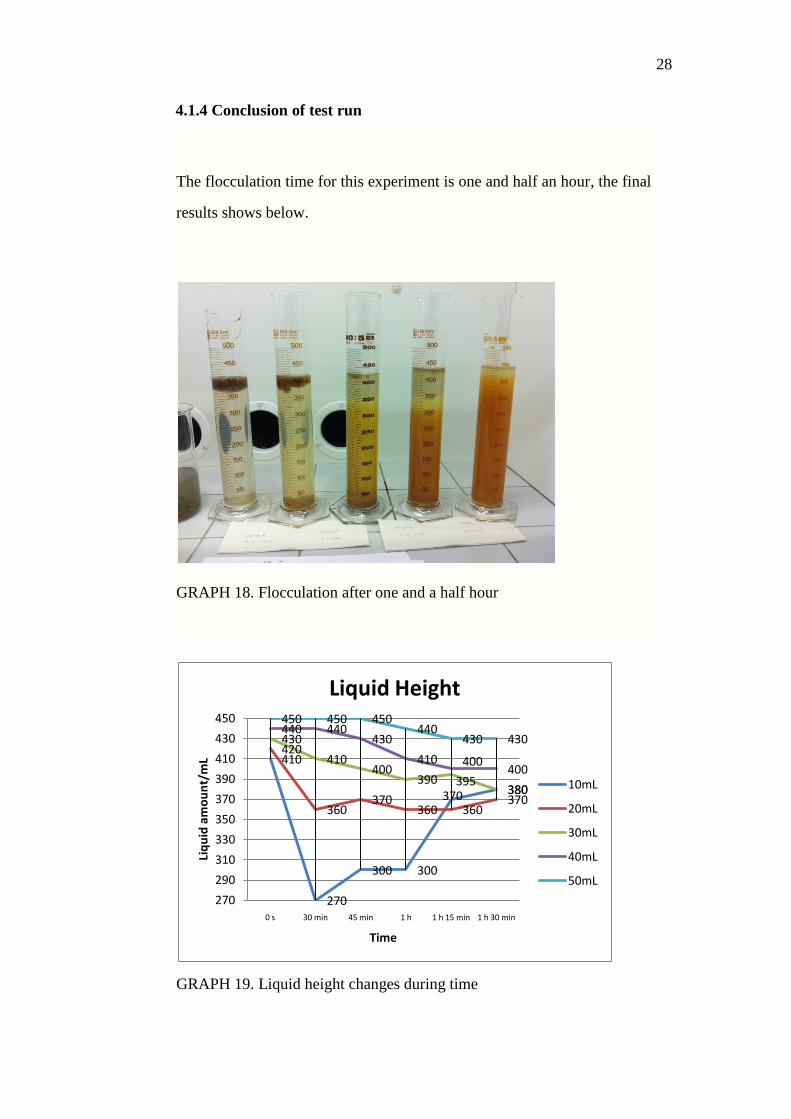
4.1.4 Conclusion of test run
The flocculation time for this experiment is one and half an hour, the final
results shows below.
GRAPH 18. Flocculation after one and a half hour
GRAPH 19. Liquid height changes during time
410
270
300 300
370 380
420
360 370
360 360 370
430
410 400
390 395 380
440 440 430
410 400 400
450 450 450 440
430 430
270
290
310
330
350
370
390
410
430
450
0 s 30 min 45 min 1 h 1 h 15 min 1 h 30 min
Liq
uid
am
ou
nt/
mL
Time
Liquid Height
10mL
20mL
30mL
40mL
50mL
29
As shown in Graph 19, the 10 mL line has the most acute and evident
changes. Therefore, as a conclusion with reference to Graph 18 and 19, in
order to get the best flocculation results, every 400 millilitres wastewater
needs 10 millilitres 0.02 grams per litre flocculants solution, and the
flocculation takes about one and a half hour. The ratio of flocculants
solution and wastewater by volume is 1:40, and the ratio of flocculants
and wastewater by weight is 0.5:1000.
Based on the test run, after flocculation, the floats floated on the surface
of liquid. While the liquid level rose, the floats could go into the
secondary treatment system with liquid through the inlet pipe. In order to
solve this problem, the length of inlet pipe for secondary treatment system
was changed longer. Therefore, the floats could stay in the surface
without going into the three small pipes in secondary treatment system.
Also, during the model run, the amount of wastewater was larger than the
test run, and the floats could gather together and have larger density than
the liquid, so they can stay in the bottom of the primary treatment system.
4.2 Model run of designed model system
The test run helped to set up the plan of the model run. According to the
results from test run, the amount of flocculants could be calculated, and
the time period for each model run was about half a day. During each
model run, there were five samples for analysis: one for raw wastewater,
two for the first treatment liquid at different time, and two for secondary
treatment at different time. In order to run the model appropriately, huge
amount of domestic wastewater needed to be taken. Also, the
Maintpartner Laboratory required 2 millilitres of each sample for analysis.
30
Before running the model, there were some calculations. Table 3 shows
the parameters for model. The parameters were used to calculate the
amount of needed domestic wastewater and flocculants.
TABLE 3. Parameters of model
Height(cm) Diameter(cm) Volume(L)
Big tank 50 29 33.00925
Secondary tank 33.5 11 3.1819975
Three small pipes
in secondary tank 9 5 0.176625
From Graph 5, the height of outlet tube was 39 centimetres, so the
maximum volume of the whole model was about 26 litres, also there were
five samples for each run and each sample needed 2 litres, so every run
needed about 36 litres domestic wastewater. Based on the data from test
run, 36 litres domestic wastewater needed about 900 millilitres 0.02 g/ml
flocculants solution. Before the liquid went into the three small pipes in
secondary treatment, the wastewater needed to stay in the primary
treatment tank for flocculation and sedimentation. So at the beginning of
the run, water level needed to be lower than the inlet tube of the three
small pipes and the measured height was 35 centimetres, which leaded to
23 litres domestic wastewater.
Except the designed model system, the model run needed the same
equipment and chemicals in the test run.

31
4.2.1 Process of model run
In order to get reliable results, the model run needed to be repeated for
three times, each time had the same procedures. First step was taking 300
litres wastewater sample to measure the pH.
GRAPH 20. pH of three model runs
Graph 20 shows the pH for three runs were respectively 7.49, 7.57 and
7.55. All three pH values were in the range 5.5-8, which were suitable for
flocculation.
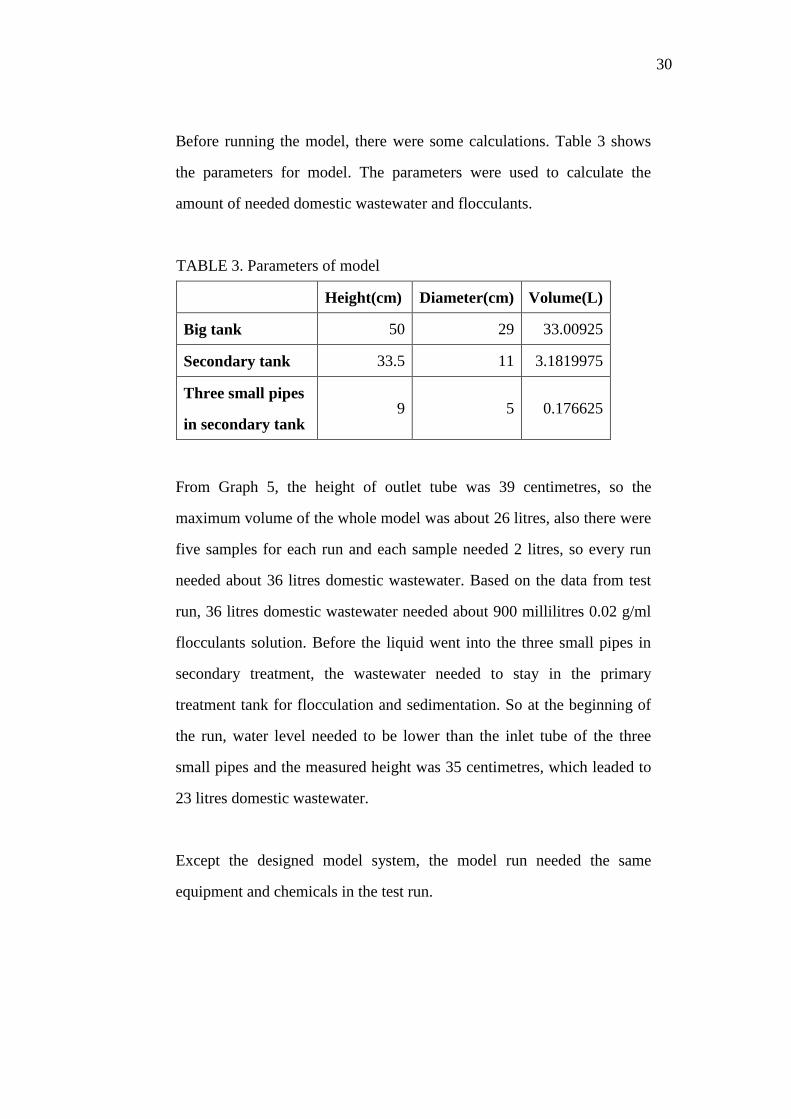
As time went by, 20 grams flocculants were dissolved into 1 litre
flocculants solution, and there were 5.7 grams of Al2(SO4)3*16H2O and
14.3 grams of FeCl3*6H2O. Table 4 and Graph 21 show the real values
and solution for three runs.
TABLE 4. Real values of Al2(SO4)3*16H2O and FeCl3*6H2O
Al2(SO4)3*16H2O FeCl3*6H2O
1st run (g) 5.702 14.3207
2nd run (g) 5.7017 14.3075
3rd run (g) 5.7082 14.3014
32
GRAPH 21. Flocculants solution
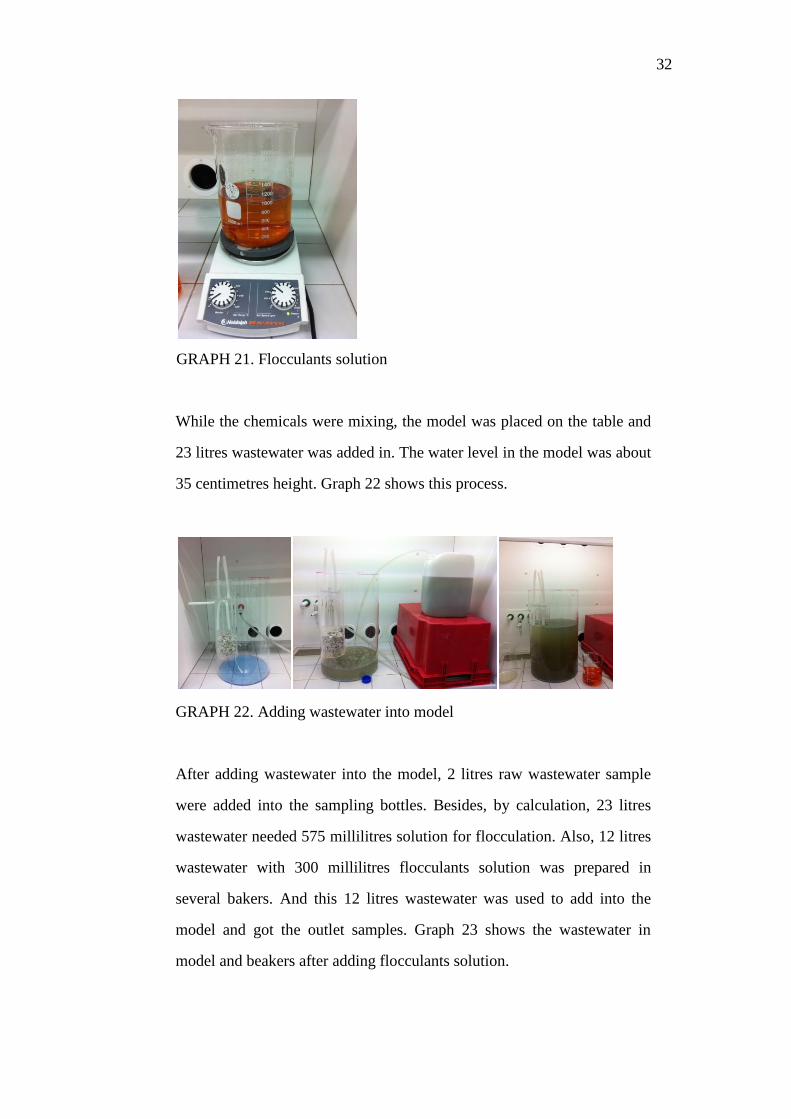
While the chemicals were mixing, the model was placed on the table and
23 litres wastewater was added in. The water level in the model was about
35 centimetres height. Graph 22 shows this process.
GRAPH 22. Adding wastewater into model
After adding wastewater into the model, 2 litres raw wastewater sample
were added into the sampling bottles. Besides, by calculation, 23 litres
wastewater needed 575 millilitres solution for flocculation. Also, 12 litres
wastewater with 300 millilitres flocculants solution was prepared in
several bakers. And this 12 litres wastewater was used to add into the
model and got the outlet samples. Graph 23 shows the wastewater in
model and beakers after adding flocculants solution.
33
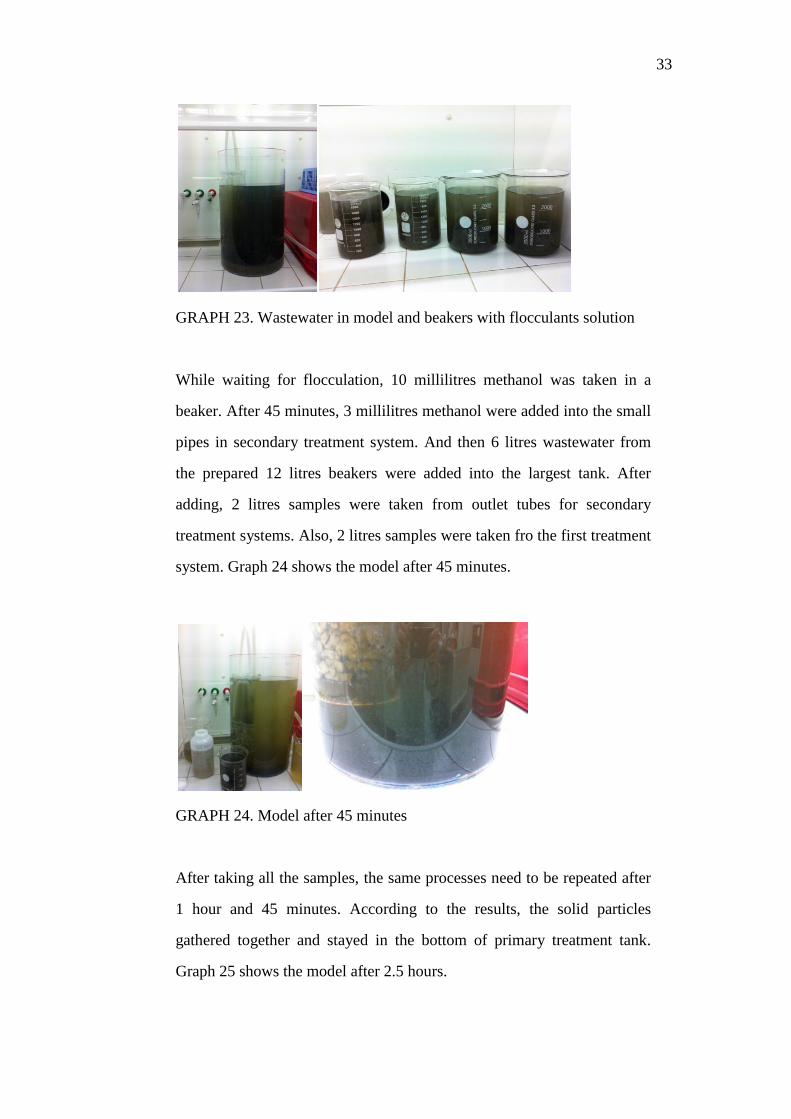
GRAPH 23. Wastewater in model and beakers with flocculants solution
While waiting for flocculation, 10 millilitres methanol was taken in a
beaker. After 45 minutes, 3 millilitres methanol were added into the small
pipes in secondary treatment system. And then 6 litres wastewater from
the prepared 12 litres beakers were added into the largest tank. After
adding, 2 litres samples were taken from outlet tubes for secondary
treatment systems. Also, 2 litres samples were taken fro the first treatment
system. Graph 24 shows the model after 45 minutes.
GRAPH 24. Model after 45 minutes
After taking all the samples, the same processes need to be repeated after
1 hour and 45 minutes. According to the results, the solid particles
gathered together and stayed in the bottom of primary treatment tank.
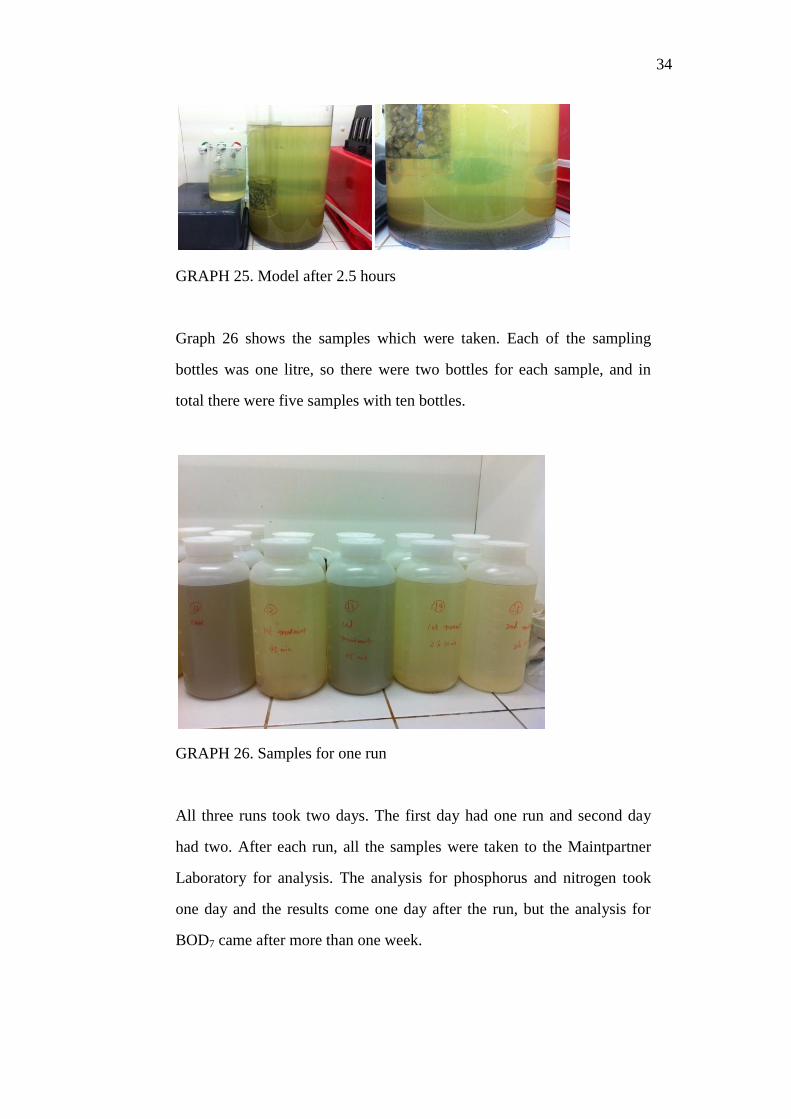
Graph 25 shows the model after 2.5 hours.
34
GRAPH 25. Model after 2.5 hours
Graph 26 shows the samples which were taken. Each of the sampling
bottles was one litre, so there were two bottles for each sample, and in
total there were five samples with ten bottles.
GRAPH 26. Samples for one run
All three runs took two days. The first day had one run and second day
had two. After each run, all the samples were taken to the Maintpartner
Laboratory for analysis. The analysis for phosphorus and nitrogen took
one day and the results come one day after the run, but the analysis for
BOD7 came after more than one week.
35
4.2.2 Results of model run
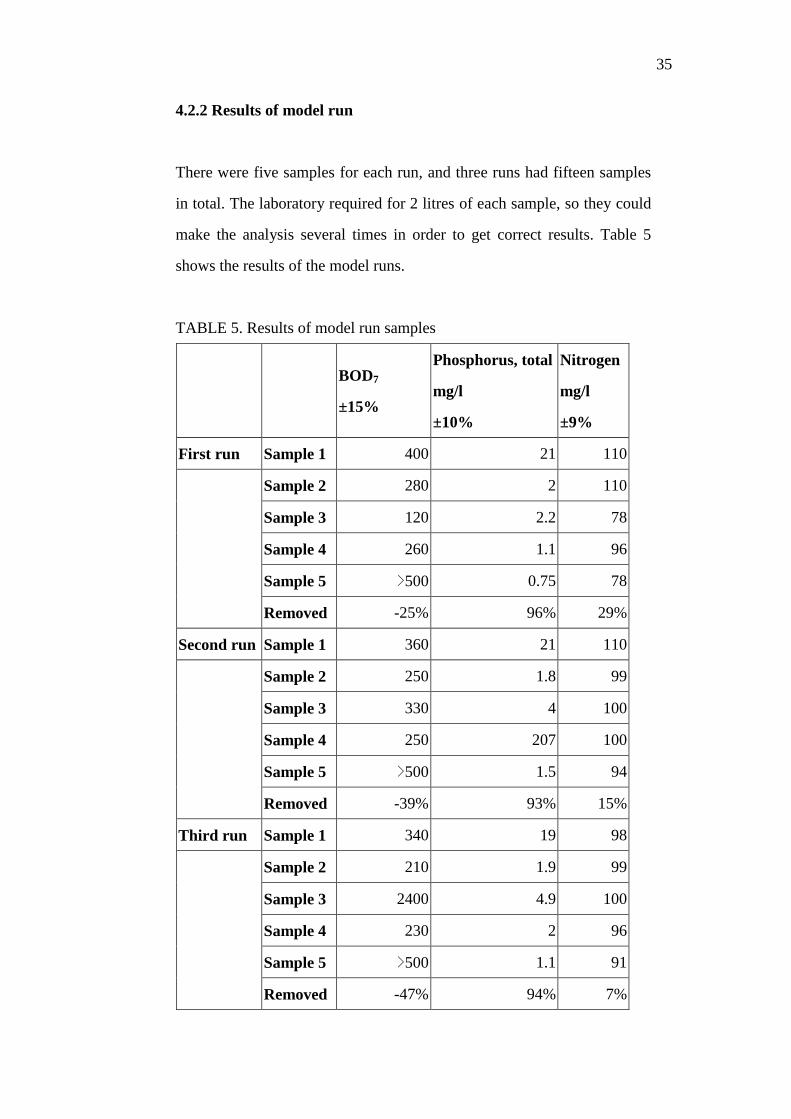
There were five samples for each run, and three runs had fifteen samples
in total. The laboratory required for 2 litres of each sample, so they could
make the analysis several times in order to get correct results. Table 5
shows the results of the model runs.
TABLE 5. Results of model run samples
BOD7
±15%
Phosphorus, total
mg/l
±10%
Nitrogen
mg/l
±9%
First run Sample 1 400 21 110
Sample 2 280 2 110
Sample 3 120 2.2 78
Sample 4 260 1.1 96
Sample 5 >500 0.75 78
Removed -25% 96% 29%
Second run Sample 1 360 21 110
Sample 2 250 1.8 99
Sample 3 330 4 100
Sample 4 250 207 100
Sample 5 >500 1.5 94
Removed -39% 93% 15%
Third run Sample 1 340 19 98
Sample 2 210 1.9 99
Sample 3 2400 4.9 100
Sample 4 230 2 96
Sample 5 >500 1.1 91
Removed -47% 94% 7%
36
The environmental decree requires removing at least 80% of BOD7, 70%
of total phosphorous and 30% of nitrogen (Finnish Ministry of the
Environment 2007, 1). As shown in Table 5, the amount of phosphorous
was successfully decreased, but the amount of nitrogen did not achieve
the requirements. Based on the data, for phosphorous, the reactions were
mainly happened in the primary treatment system. The primary treatment
worked perfectly where the phosphorous was removed by more than 90%.
But for nitrogen, the first run got the best result, where nitrogen was
removed by 29%. There were some possible reasons to explain this result.
First of all, during the first run, the liquid stayed in the secondary
treatment system longer period than the last two runs, because the last two
runs were finished in one day and the time was rush. In this case,
methanol has enough time to react with NH3 in the first run. Moreover,
the secondary treatment tanks were not cleaned well enough after each
run, so the amount of nitrogen in the second and third runs had only
removed by 15% and 7%. Besides, the model system did not present the
sand filter system, which could filter small solid particles away. On the
other hand, the amount of BOD7 was increasing according to Table 5. The
data shows that BOD7 amount was decreased well in the first treatment,
but increased after secondary treatment. This result is because of that
methanol reacts with the wastewater sample and forms more oxygen. In
this case, in order to fix this problem, in the secondary treatment tanks,
after adding methanol, there can be some ferric salt added in, which can
remove the formed extra oxygen. Another option is that instead of using
methanol, hypochlorous acid or other chemicals can be used to continue
remove the nitrogen in the liquid. The original results of model runs are
shown in Appendix 2.

37
5 CONCLUSIONS AND DISCUSSION
Domestic wastewater treatment is always important for a city, and the
government decree proves that it is necessary to control the discharge of
domestic wastewater outside sewer networks. This thesis follows the
requirements of environmental decree to create a wastewater treatment
system for family houses in Kokkola. The present methods are
flocculation, sedimentation and chemical treatment. Besides, there are
also other methods can be applied into the designed wastewater treatment
system. As was shown in the simulation part and the practical experiences
in wastewater treatment plants, the methods are proved effective for
wastewater treatment purposes. The designed treatment system is
presented by building a model, which can explain part of practical system.
The design is easy to assemble in the real wastewater tank and the
materials and methods of the system are cheap and easy to achieve.
However, because of the limitations of time and chemicals, the present
methods in the model treatment system was failed to remove enough
nitrogen and BOD7, the design for practical treatment system has enough
space to apply more methods.
Compared the model system with practical system, the practical system
has larger wastewater tank, which is represented as the primary treatment
pipe in the model. Based on the data from Mr. K’s summer cottage, the
wastewater tank is 3.14 cubic metres and can hold about 2500 litres
domestic wastewater. Also, the daily load for per person in Kokkola is
120 litres. Also, on the average, there are 3 to 4 people living in one
family house. By calculation, the daily load of wastewater for one family
house is 360 to 480 litres, and the wastewater tank can hold the
wastewater for 5 to 7 days. During this period, the chosen methods can
38
work better in the practical system than in the model system. Moreover,
other biological methods, such as yeast and anaerobic biological treatment
can also be used in the practical system. In addition, the solution form of
chemicals is not convenient for adding into the practical system. In order
to solve this problem, the chemicals can be hold in a package which
allows wastewater go through, and the chemicals can dissolve in the
wastewater by themselves, so the residents can lift the package up and add
the chemicals time after time.
In conclusion, the aim of this thesis, which is building a simple, cheap and
effective domestic wastewater treatment system model, has basically
reached. But for practical system, there are still many questions need to be
solved. For instance, if the design is used in practice, how to adjust the
flow rates, chemical kinds, chemical amounts and biological treatments to
get the best results? This question still needs to be solved.
REFERENCES
Dan, N. P. 2001. Biological treatment of high salinity wastewater using
yeast and bacterial systems. Asian Institute of Technology, School of
Environment, Resources and Development, Bangkok, Thailand.
Fasemore, O. A. 2004. The flocculation of paint wastewater using
inorganic salts. University of the Witwatersrand, Johannesburg
FSC Architects and Engineers, Yellowknife, America 2003. Class II water
treatment plant operator program manual.
Marg, N. and Pradesh, M. 2007. Greywater reuse in rural schools wise
water management: guidance manual. National Environmental
Engineering Research Institute & United Nations Children's Fund,
UNICEF, India.
Methanol institute 2011. Methanol and wastewater denitrification.
Available:
http://www.methanol.org/Methanol-Basics/Resources/Methanol-and-Wast
ewater-Denitrification.aspx?lang=en-US. Accessed 29 March 2012.
Ministry of the Environment. Finland 2003. Government decree on
treating domestic wastewater in areas outside sewer networks. 2003/542
Ministry of the Environment, Finland 2007. Filters for holiday home
wastewater treatment: greywater filter to meet provisions of new
legislation.
Minnesota Pollution Control Agency (MPCA), America 2008. Nutrients:
Phosphorous, Nitrogen Sources, Impact on Water Quality.
Mrowiec, B. and Suschka, J. 2008. Anaerobic wastewater treatment
process. University of Bielsko-Biala, Poland.
Ruokojärvi, A. 2007. Rural wastewater treatment in Finland, the United
Kingdom and Hungary. Savonia University of Applied Sciences,
Engineering Kuopio, Finland.
Sharma, S. K. 2001. Adsorptive Iron Removal from Groundwater.
UNESCO-IHE, Institute for water education, Netherlands.
Strom, P. F. 2006. Phosphorus Removal. Rutgers University, New
Brunswick, New Jersey, America.
The water plant company, Long Island, New York, America 2012.
Nitrification & Denitrification.
United States Environmental Protection Agency (EPA), America 1974.
Physical-chemical nitrogen removal.
United States Environmental Protection Agency (EPA), America 2000.
Wastewater technology fact sheet: Chemical precipitation.
Water treatment 2012. Water treatment plants: Yeast diagram. Available:
http://watertreatmentsss.com/yeast-diagram/. Accessed 29 March 2012.
APPENDIX 1/1
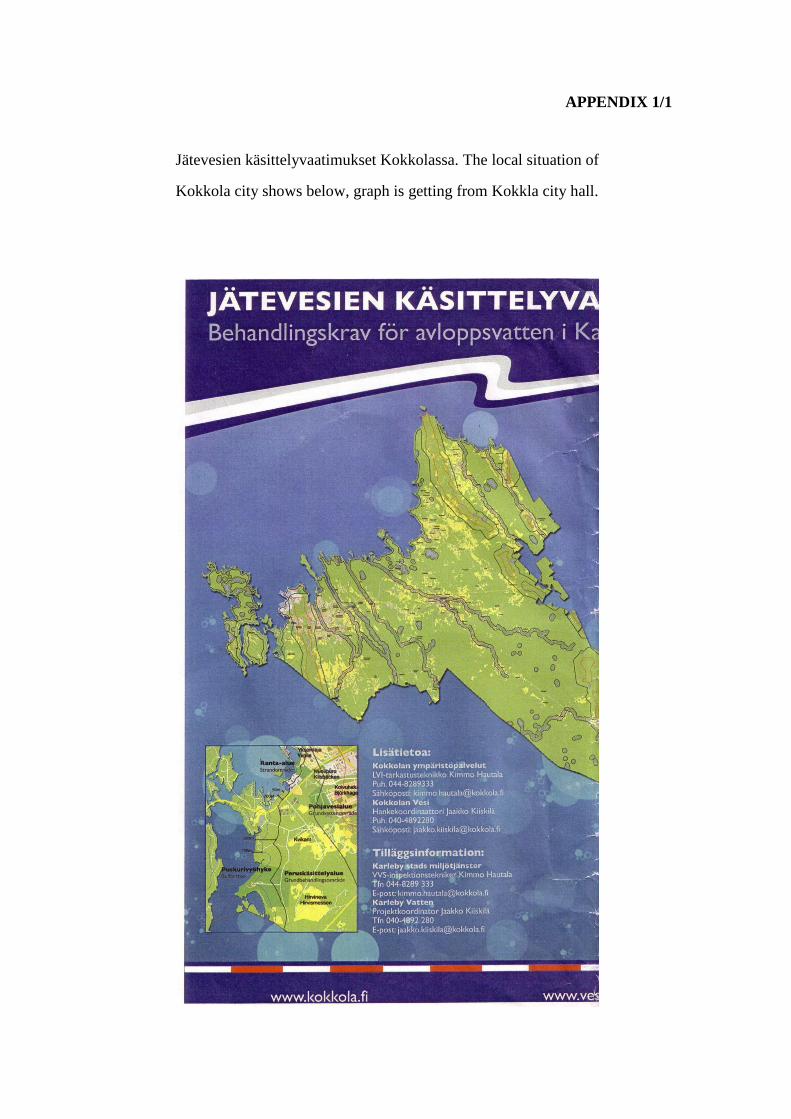
Jätevesien käsittelyvaatimukset Kokkolassa. The local situation of
Kokkola city shows below, graph is getting from Kokkla city hall.
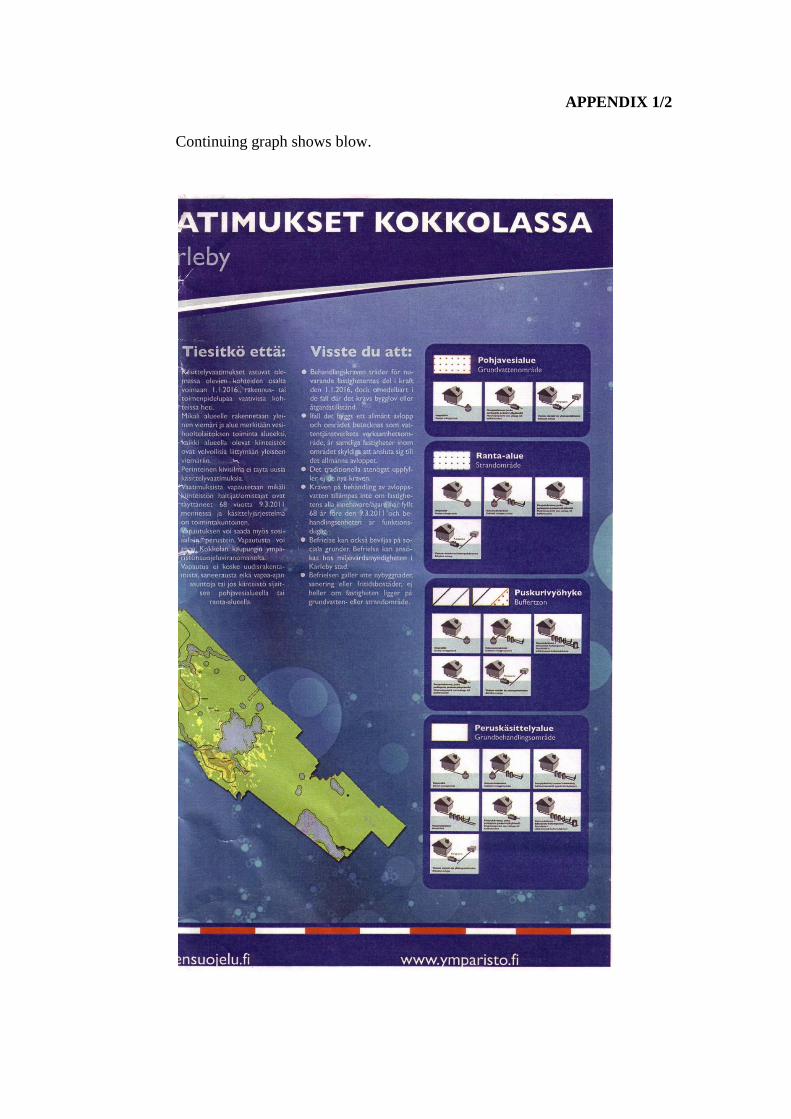
APPENDIX 1/2
Continuing graph shows blow.
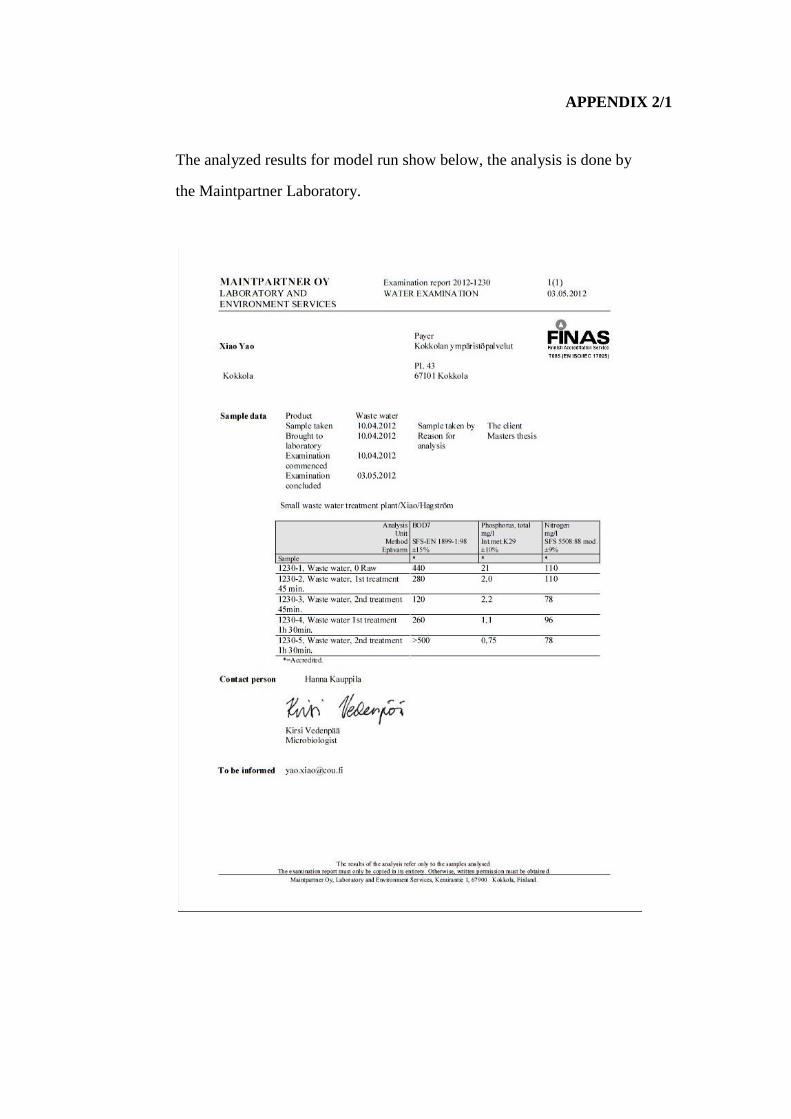
APPENDIX 2/1
The analyzed results for model run show below, the analysis is done by
the Maintpartner Laboratory.
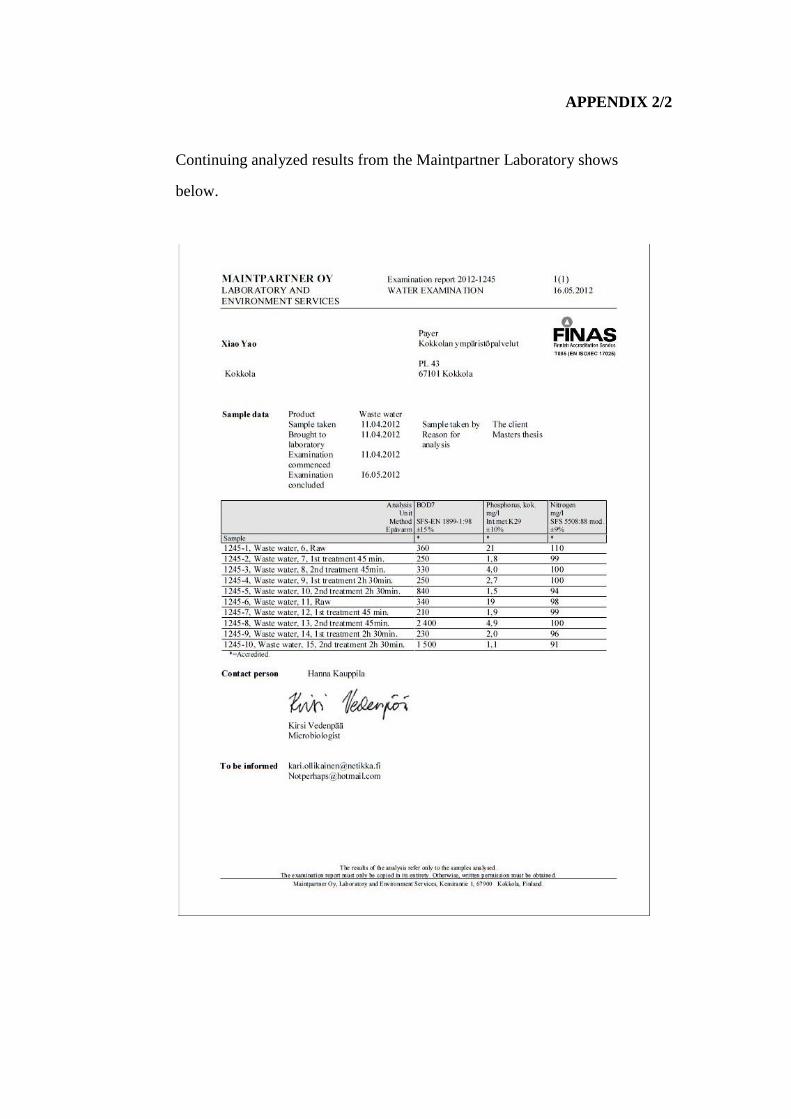
APPENDIX 2/2
Continuing analyzed results from the Maintpartner Laboratory shows
below.