
Self-cleaning optical surfaces for the inkjet and 3D ...
103
Self-cleaning optical surfaces for the inkjet and 3D printing industry Mehmet Alican Noyan ADVERTIMENT La consulta d’aquesta tesi queda condicionada a l’acceptació de les següents condicions d'ús: La difusió d’aquesta tesi per mitjà del r e p o s i t o r i i n s t i t u c i o n a l UPCommons (http://upcommons.upc.edu/tesis) i el repositori cooperatiu TDX ( http://www.tdx.cat/ ) ha estat autoritzada pels titulars dels drets de propietat intel·lectual únicament per a usos privats emmarcats en activitats d’investigació i docència. No s’autoritza la seva reproducció amb finalitats de lucre ni la seva difusió i posada a disposició des d’un lloc aliè al servei UPCommons o TDX. No s’autoritza la presentació del seu contingut en una finestra o marc aliè a UPCommons (framing). Aquesta reserva de drets afecta tant al resum de presentació de la tesi com als seus continguts. En la utilització o cita de parts de la tesi és obligat indicar el nom de la persona autora. ADVERTENCIA La consulta de esta tesis queda condicionada a la aceptación de las siguientes condiciones de uso: La difusión de esta tesis por medio del repositorio institucional UPCommons (http://upcommons.upc.edu/tesis) y el repositorio cooperativo TDR (http://www.tdx.cat/?locale- attribute=es) ha sido autorizada por los titulares de los derechos de propiedad intelectual únicamente para usos privados enmarcados en actividades de investigación y docencia. No se autoriza su reproducción con finalidades de lucro ni su difusión y puesta a disposición desde un sitio ajeno al servicio UPCommons No se autoriza la presentación de su contenido en una ventana o marco ajeno a UPCommons (framing). Esta reserva de derechos afecta tanto al resumen de presentación de la tesis como a sus contenidos. En la utilización o cita de partes de la tesis es obligado indicar el nombre de la persona autora. WARNING On having consulted this thesis you’re accepting the following use conditions: Spreading this thesis by the institutional repository UPCommons (http://upcommons.upc.edu/tesis) and the cooperative repository TDX (http://www.tdx.cat/?locale- attribute=en) has been authorized by the titular of the intellectual property rights only for private uses placed in investigation and teaching activities. Reproduction with lucrative aims is not authorized neither its spreading nor availability from a site foreign to the UPCommons service. Introducing its content in a window or frame foreign to the UPCommons service is not authorized (framing). These rights affect to the presentation summary of the thesis as well as to its contents. In the using or citation of parts of the thesis it’s obliged to indicate the name of the author.
Transcript of Self-cleaning optical surfaces for the inkjet and 3D ...

Self-cleaning optical surfaces for the inkjet and 3D printing industry
Mehmet Alican Noyan
ADVERTIMENT La consulta d’aquesta tesi queda condicionada a l’acceptació de les següents condicions d'ús: La difusió d’aquesta tesi per mitjà del r e p o s i t o r i i n s t i t u c i o n a l UPCommons (http://upcommons.upc.edu/tesis) i el repositori cooperatiu TDX ( h t t p : / / w w w . t d x . c a t / ) ha estat autoritzada pels titulars dels drets de propietat intel·lectual únicament per a usos privats emmarcats en activitats d’investigació i docència. No s’autoritza la seva reproducció amb finalitats de lucre ni la seva difusió i posada a disposició des d’un lloc aliè al servei UPCommons o TDX. No s’autoritza la presentació del seu contingut en una finestra o marc aliè a UPCommons (framing). Aquesta reserva de drets afecta tant al resum de presentació de la tesi com als seus continguts. En la utilització o cita de parts de la tesi és obligat indicar el nom de la persona autora.
ADVERTENCIA La consulta de esta tesis queda condicionada a la aceptación de las siguientes condiciones de uso: La difusión de esta tesis por medio del repositorio institucional UPCommons (http://upcommons.upc.edu/tesis) y el repositorio cooperativo TDR (http://www.tdx.cat/?locale-attribute=es) ha sido autorizada por los titulares de los derechos de propiedad intelectual únicamente para usos privados enmarcados en actividades de investigación y docencia. No se autoriza su reproducción con finalidades de lucro ni su difusión y puesta a disposición desde un sitio ajeno al servicio UPCommons No se autoriza la presentación de su contenido en una ventana o marco ajeno a UPCommons (framing). Esta reserva de derechos afecta tanto al resumen de presentación de la tesis como a sus contenidos. En la utilización o cita de partes de la tesis es obligado indicar el nombre de la persona autora.
WARNING On having consulted this thesis you’re accepting the following use conditions: Spreading this thesis by the i n s t i t u t i o n a l r e p o s i t o r y UPCommons (http://upcommons.upc.edu/tesis) and the cooperative repository TDX (http://www.tdx.cat/?locale-attribute=en) has been authorized by the titular of the intellectual property rights only for private uses placed in investigation and teaching activities. Reproduction with lucrative aims is not authorized neither its spreading nor availability from a site foreign to the UPCommons service. Introducing its content in a window or frame foreign to the UPCommons service is not authorized (framing). These rights affect to the presentation summary of the thesis as well as to its contents. In the using or citation of parts of the thesis it’s obliged to indicate the name of the author.
ICFO-INSTITUT DE CIENCIES
FOTONIQUES
&
UPC-UNIVERSITAT POLITECNICA DE
CATALUNYA
Self-cleaning optical surfacesfor the inkjet and 3D
printing industry
Mehmet Alican Noyan
Thesis advisor: Prof. Valerio Pruneri
PhD Thesis - 2017


to my family and friends


Abstract
Liquid and solid repellent surfaces are key to many industries. Forexample, construction industry benefits from self-cleaning windows,cements, paints, roof tiles, and corrosion resistant surfaces, while easy-to-clean, antifingerprint and antibacterial surfaces are highly relevantfor display applications.
In inkjet and 3D printers, the unwanted deposition on the innerparts of raw materials in the form of liquid, aerosol or solid particu-lates may cause device malfunctioning. In particular, ink aerosol andpowder may obstruct light passage in several key components, suchas sensors and lamps. To address this, the thesis proposes and inves-tigates novel designs and methods to reduce ink aerosol and powdercontamination on transparent surfaces.
In the first part, Joule heating and hydrophobicity against inkaerosol contamination are studied. The former effect is provided bya transparent conducting film (TCF), while the latter through a self-assembled monolayer (SAM) coating. The combination of the twoeffects reduce transmittance loss from an average of 10% to less than1.5% in the presence of ink aerosol. Correspondingly, the area of thesurface covered by ink decreases from around 45% to less than 2%.Results obtained with the glass substrates are subsequently extendedto the plastic window of a commercial inkjet printer calibration sensor.Furthermore, effectiveness of the proposed self-cleaning surfaces inside
i

an inkjet printer is demonstrated.In the second part, a technology called “electric curtain” is used
to design a self-cleaning surface against powder contamination in 3Dprinters. Powders are the starting material for forming the objectsand are largely present inside the printer. It is shown that an electriccurtain can clean about 50% of the powder that deposits on the sur-face . The thesis also proposes a new electric curtain design consistingof a double electrode layer which significantly increases the particleremoval efficacy to more than 70%, with plenty of margin of improve-ment.
In summary, in this thesis novel self-cleaning transparent surfacesare proposed and their potential for inkjet and 3D printing industryis demonstrated in real operating conditions.
ii
Resumen
En la actualidad, el uso de superficies repelentes de partıculas solidasy lıquidas es de gran importancia en el ambito de la industria. Uncaso concreto es el de la industria de la construccion, donde el uso deventanas, cementos, pinturas y tejas que son ‘autolimpiables’ junto consuperficies resistentes a la corrosion son de gran utilidad. Asimismo,superficies faciles de limpiar, antibacterianas y antihuella son de vitalimportancia para aplicaciones de visualizacion. En el caso concreto delas impresoras de tinta y 3D puede existir la deposicion de partıculaslıquidas y solidas respectivamente, durante el funcionamiento de losequipos. Esto conlleva a un mal funcionamiento de las mismas ya que,tanto el aerosol procedente de las tintas como el polvo utilizado en lasimpresoras 3D, pueden obstruir el paso de la luz en los componentesprincipales de la impresora, como son los sensores y lamparas. Conel fin de solucionar las cuestiones descritas previamente, en esta tesisse ha desarrollado un nuevo diseno y procedimiento para reducir lacontaminacion provocada por los aerosoles y el polvo.
En la primera parte, se estudia la reduccion de la contaminacionde aerosoles en el sensor de la impresora mediante dos vıas, el calen-tamiento del mismo por efecto Joule y modificando quımicamente lasuperficie del sensor transformandola en hidrofobica. El efecto Joule seproporciona a traves de una pelıcula conductora transparente (TCF),mientras que la hidrofobicidad se confiere mediante un revestimiento
iii

de monocapa autoensamblada (SAM). La combinacion de ambos efec-tos hace que la perdida de transmision se reduzca de un 10% a un valorigual o inferior del 1.5%. Asimismo, el area recubierta por el aerosoldisminuye de un 45% a un valor de 2%. Estos resultados obtenidospara substratos de vidrio se aplicaron posteriormente a una ventanade plastico de un sensor comercial utilizado en impresoras de tinta.Finalmente, se demuestra la efectividad del proceso propuesto (efectoJoule y SAM) al instalarse en una impresora industrial.
En la segunda parte, una tecnologıa llamada “cortina electrica”se utiliza para disenar una superficie de autolimpieza contra la con-taminacion de polvo en impresoras 3D. Los polvos son el material departida para formar los objetos y estan en gran parte presentes dentrode la impresora. Se muestra que una cortina electrica puede limpiaraproximadamente el 50% del polvo que se deposita en la superficie.La tesis tambien propone un nuevo diseno de cortina electrica consis-tente en una capa de doble electrodo que aumenta significativamentela eficacia de eliminacion de partıculas a mas del 70%, con suficientemargen de mejora.
En resumen, en esta tesis se proponen nuevas superficies transpar-entes de autolimpieza y se demuestra su potencial para la industria deimpresion por inyeccion y 3D en condiciones reales de funcionamiento.
iv

Acknowledgements
I consider it my privilege to acknowledge the help, assistance andsupport of the many individuals without whom this thesis would nothave been possible.
First of all, I would like to express my sincere gratitude to mythesis supervisor Prof. Valerio Pruneri for his guidance and continuoussupport during the course of this thesis.
I would like to thank Vittoria, Waldimar, Kavitha, Roland, Rinu,Dhriti, Vahagn, Inge, Albert, Kutlu, Onur, and Zafer for their help atvarious points during my PhD. I would like to especially express mygratitude to Vittoria, for not expelling me from her lab even though Ipainted it all over with ink and powder.
Also, I would like to thank ICFO’s cleanroom, mechanical work-shop, electronic workshop and maintanence teams for alleviating thechallenges of experimental research.
I would like to thank Denis Guilhot and Silvia Carrasco from ICFOKnowledge and Technology Transfer unit for their invaluable help andJoan Saez, Xavier Bruch, Esteve Comas, Jordi Ferran, Carles Castell-sague and Bernat Poll Crespo from HP Barcelona for their continuoussupport during our collaboration.
Personally, I would like to thank all OPTO and ICFO friends formaking my life in Barcelona much more pleasant. It has been anamazing experience.
v

Finally, I am grateful to my lovely sister Aslı and my parents fortheir love and support and to my dear Inci, for everything.
vi

Contents
Abstract i
Resumen iii
Acknowledgements v
List of Figures xv
List of Tables xvii
List of Publications xix
1 Introduction 11.1 Self-cleaning surfaces overview . . . . . . . . . . . . . . 11.2 Aim of the thesis . . . . . . . . . . . . . . . . . . . . . 41.3 Thesis outline . . . . . . . . . . . . . . . . . . . . . . . 5
2 Self-cleaning surfaces for inkjet printing 72.1 Introduction . . . . . . . . . . . . . . . . . . . . . . . . 72.2 Background . . . . . . . . . . . . . . . . . . . . . . . . 10
2.2.1 Joule heating . . . . . . . . . . . . . . . . . . . 102.2.2 Basics of wetting . . . . . . . . . . . . . . . . . 112.2.3 Self-assembled monolayer (SAM) . . . . . . . . 13
vii

CONTENTS
2.3 Methods . . . . . . . . . . . . . . . . . . . . . . . . . . 132.3.1 Joule Heating . . . . . . . . . . . . . . . . . . . 132.3.2 Hydrophobicity . . . . . . . . . . . . . . . . . . 152.3.3 Aerosol Deposition . . . . . . . . . . . . . . . . 162.3.4 Characterization . . . . . . . . . . . . . . . . . 16
2.4 Results and discussion . . . . . . . . . . . . . . . . . . 182.4.1 TCF and SAM on the fused silica . . . . . . . . 182.4.2 TCF and SAM on the calibration sensor window 29
2.5 Conclusions . . . . . . . . . . . . . . . . . . . . . . . . 30
3 Inkjet printer test of the self-cleaning surfaces 313.1 Introduction . . . . . . . . . . . . . . . . . . . . . . . . 313.2 Experimental details . . . . . . . . . . . . . . . . . . . 323.3 Results and Discussion . . . . . . . . . . . . . . . . . . 34
4 Self-cleaning surfaces for 3D printing 394.1 Introduction . . . . . . . . . . . . . . . . . . . . . . . . 394.2 State of the art in powder removal . . . . . . . . . . . 414.3 Background . . . . . . . . . . . . . . . . . . . . . . . . 42
4.3.1 Particle adhesion . . . . . . . . . . . . . . . . . 424.3.2 Electric curtain . . . . . . . . . . . . . . . . . . 43
4.4 Methods . . . . . . . . . . . . . . . . . . . . . . . . . . 444.4.1 Design and fabrication . . . . . . . . . . . . . . 444.4.2 Particle deposition . . . . . . . . . . . . . . . . 464.4.3 Signal application . . . . . . . . . . . . . . . . . 474.4.4 Characterization . . . . . . . . . . . . . . . . . 47
4.5 Results and Discussion . . . . . . . . . . . . . . . . . . 494.6 Conclusions . . . . . . . . . . . . . . . . . . . . . . . . 53
5 Double layer electric curtain 555.1 Introduction . . . . . . . . . . . . . . . . . . . . . . . . 555.2 Methods . . . . . . . . . . . . . . . . . . . . . . . . . . 56
viii

CONTENTS
5.3 Results and discussion . . . . . . . . . . . . . . . . . . 58
6 Conclusions 69
Bibliography 72
ix


List of Figures
1.1 Total market forecast for self-cleaning surfaces (n-techresearch 2015 [1]). . . . . . . . . . . . . . . . . . . . . . 2
2.1 a) Calibration sensor used in HP inkjet printers. b)Printer during color calibration . . . . . . . . . . . . . 9
2.2 A simple schematic visualization of the concept pro-posed to reduce ink aerosol contamination . . . . . . . 10
2.3 Contact angle, θc, the measure of wettability. . . . . . . 11
2.4 Sliding angle(α), advancing contact angle(θA) and re-ceding contact angle(θR). . . . . . . . . . . . . . . . . . 12
2.5 A schematic of (a) a self-assembled monolayer (SAM)on a surface and (b) an example SAM methyl-terminated,n-alkylsiloxane monolayer on Si/SiO2. Methyl (CH3) isa commonly used terminal group for hydrophobicity [2]. 14
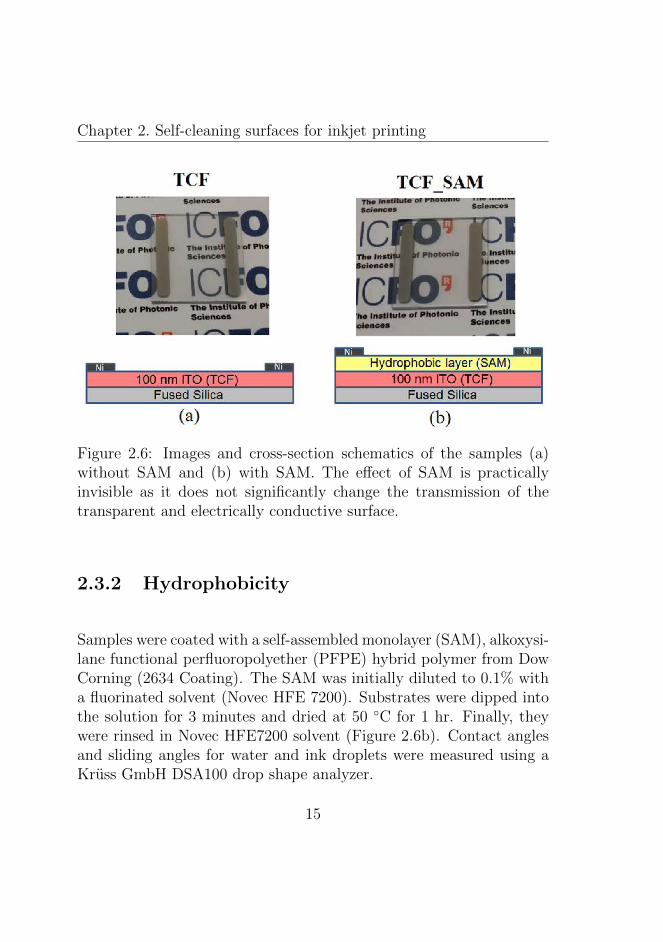
2.6 Images and cross-section schematics of the samples (a)without SAM and (b) with SAM. The effect of SAM ispractically invisible as it does not significantly changethe transmission of the transparent and electrically con-ductive surface. . . . . . . . . . . . . . . . . . . . . . . 15
xi

LIST OF FIGURES
2.7 Image showing the elements of the spray setup. (a)Glass microspray and the sample to be sprayed. Bothare fixed with holders for repeatability. (b) Pressurecontroller for fixing the spray pressure and the purgevalve for fixing the spray time. . . . . . . . . . . . . . . 17
2.8 Temperature evolution of the sample upon Joule heat-ing. The power required to keep the temperature ofthe sample between 80-85 C was measured to be 0.64W/cm2. The sample was suspended in air during theexperiment, and the ambient temperature was 27.5 C. 19
2.9 Contact angles of water and ink droplets of 5 µL onsamples with and without SAM. . . . . . . . . . . . . . 20
2.10 Experimental flowchart presenting the spraying and heat-ing procedures. . . . . . . . . . . . . . . . . . . . . . . 21
2.11 Characterization of the samples shown in the experi-mental flowchart. (a) Optical transmittance spectra.Fill area corresponds to the standard deviation. (b)Light microscopy images. . . . . . . . . . . . . . . . . . 22
2.12 (a) Image showing light-ink drop interaction dependingon the contact angle. (b) Absorption spectrum of ink-water solution for varying ink concentrations. . . . . . 25
2.13 Light intensity vs. time graph showing how sprayingand heating effects the detected light. . . . . . . . . . . 28
2.14 Effect of hydrophobicity and heating on the actual sen-sor window. . . . . . . . . . . . . . . . . . . . . . . . . 29
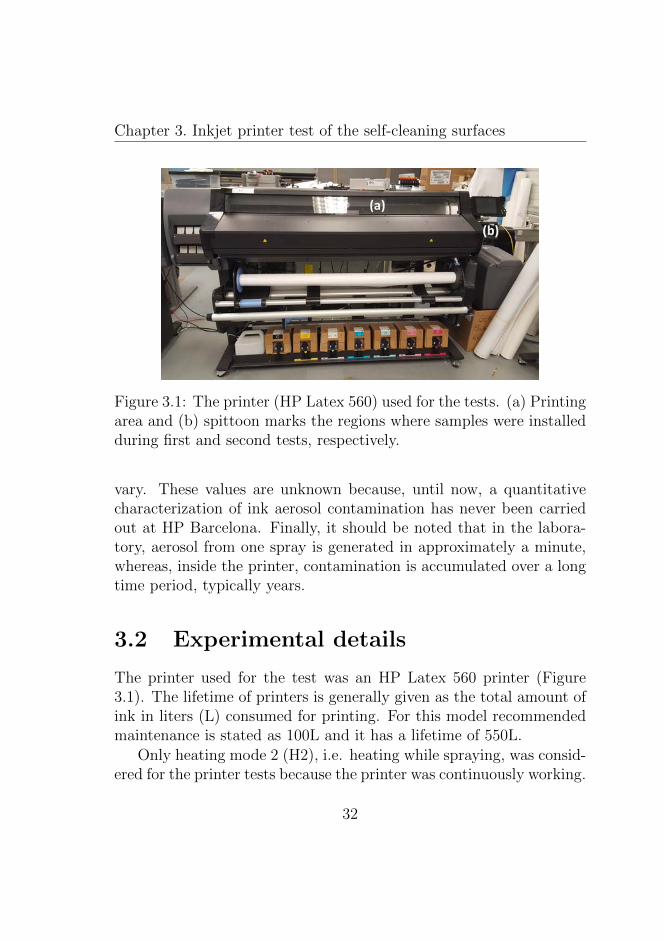
3.1 The printer (HP Latex 560) used for the tests. (a)Printing area and (b) spittoon marks the regions wheresamples were installed during first and second tests, re-spectively. . . . . . . . . . . . . . . . . . . . . . . . . . 32
3.2 First test in the printing region. (a) Sample installation.(b) IR image of the samples. . . . . . . . . . . . . . . . 33
xii

LIST OF FIGURES
3.3 Second test in the spittoon region. (a) Sample installa-tion. (b) IR image of the samples. ”Easyclean” refersto the SAM layer. . . . . . . . . . . . . . . . . . . . . . 34
3.4 Characterization of the samples tested inside the printer.(a) Optical transmittance spectrum. (b) Light microscopyimages. . . . . . . . . . . . . . . . . . . . . . . . . . . . 36
4.1 Schematic representation of HP multi jet fusion tech-nology [3]. . . . . . . . . . . . . . . . . . . . . . . . . . 40
4.2 (a) Powder contamination on curing lamp glass afterseveral printing jobs (PAC 12%). (b) Glass failure dueto contamination. . . . . . . . . . . . . . . . . . . . . . 41
4.3 A simple schematic showing the surfing mode motion ofpositively and negatively charged particles on an elec-tric curtain. Dotted lines represent the electric field,small solid arrows represent direction of particle mo-tion, and f represents the frequency of AC oscillation. . 45
4.4 Design and fabrication of the electric curtain. Top andcross section views are given on the left hand side. Aschematic of the fabrication is given on the right handside. . . . . . . . . . . . . . . . . . . . . . . . . . . . . 46
4.5 Image of the powder deposition setup showing (a) pow-der blower, (b) pressure controller, and (c) purge valve. 47
4.6 Image of the electric curtain setup showing (a) wave-form generator, (b) high voltage amplifier, (c) insulat-ing box, and (d) oscilloscope. Inset shows (e) USB mi-croscope and terminals. . . . . . . . . . . . . . . . . . . 48
4.7 Transmission behavior of the electric curtain comparedto the bare substrate. Inset shows the image of a fabri-cated sample. . . . . . . . . . . . . . . . . . . . . . . . 50
xiii

LIST OF FIGURES
4.8 Cleaning factor (CF) vs. applied voltage (V) for a100nm ITO electric curtain with D=0.5mm and L=1mm.Error bars represent the standard deviation. For theCF at 2000V, the standard deviation is smaller thanthe square itself. . . . . . . . . . . . . . . . . . . . . . . 51
4.9 Light microscopy images of the samples at three differ-ent voltages (a) 0 V (b) 600 V and (c) 2000 V. Yellowstripes are the electrodes and gray is the substrate. . . 52
4.10 Edges of the EC after cleaning. . . . . . . . . . . . . . 52
4.11 Force vs. position showing places where forces are zeroor negative [4]. . . . . . . . . . . . . . . . . . . . . . . 54
5.1 Double layer electric curtain. Top scheme shows thecross-section and below is the top view of a fabricatedsample. . . . . . . . . . . . . . . . . . . . . . . . . . . . 56
5.2 (a) Double layer EC with 4 terminals. Terminal pairsconnected to the top and bottom EC’s are indicated onthe image (b) Combinations of potentials applied to thedouble layer EC. ‘G’ refers to the electrode connectedto the ground and ‘AC’ refers to the electrode with thevoltage alternating between +V and -V. . . . . . . . . 57
5.3 Areas used to calculate CFs. . . . . . . . . . . . . . . . 58
5.4 (a) E-field simulation and CF for the single layer EC. . 59
5.4 (b) E-field simulation and CF for the double layer EC. 60
5.4 (c) E-field simulation and CF for the double layer ECstructure, where opposite electrodes are on top of eachother. . . . . . . . . . . . . . . . . . . . . . . . . . . . 61
5.4 (d) E-field simulation and CF for the double layer EC,where all bottom electrodes are connected to AC. . . . 62
5.4 (e) E-field simulation and CF for the double layer EC,where AC is placed under G electrode. . . . . . . . . . 63
xiv

LIST OF FIGURES
5.4 (f)E-field simulation and CF for the double layer EC,where AC is placed under AC electrode. . . . . . . . . 64
5.4 (g) E-field simulation and CF for the double layer EC,where all bottom electrodes are connected to G. . . . . 65
5.4 (h) E-field simulation and CF for the double layer EC,where G is placed under AC electrode. . . . . . . . . . 66
5.4 (i) E-field simulation and CF for the double layer EC,where G is placed under G electrode. . . . . . . . . . . 67
xv


List of Tables
2.1 Image processing results of the images shown in Fig-ure 2.11b. Values indicated by plus or minus sign arestandard deviations. . . . . . . . . . . . . . . . . . . . 23
3.1 Image processing results of the images shown in Fig-ure 3.4b. Values indicated by plus or minus sign arestandard deviations. . . . . . . . . . . . . . . . . . . . 35
xvii


List of Publications
Publications included in this thesis
Journal Articles
• M. A. Noyan, D. Guilhot, V. Pruneri, ‘‘Functionalized trans-parent surfaces with enhanced self-cleaning against ink aerosolcontamination” Adv. Mater. Technol. 2, 1600113, 2016.
Patents
• V. Pruneri, M. A. Noyan, ‘‘Ink aerosol removal from a sur-face through heating and hydrophobicity”, Invention disclosure,2016.
• V. Pruneri, M. A. Noyan, Filed patent application, 2017.
Other relevant publications and conference contri-butions
Journal Articles
• J. A. Zielinska, A. Zukauskas, C. Canalias, M. A. Noyan, M. W.Mitchell, ‘‘Fully-resonant, tunable, monolithic frequency conver-
xix

sion as a coherent UVA source” Opt. Express 25, 1142-1150,2017.
Talks
• M. A. Noyan, K. K. Gopalan, R. A. Maniyara, M. M. Martin-Frances, V. Mkhitaryan, J. Rombaut Segarra, M. Rude, R. Sibilo,I. Mannelli, J. Canet Ferrer, V. Pruneri, ‘‘Multifunctional nano-structured optical surfaces for industrial applications” Nanometa2017, Seefeld, Austria, January 2017 (invited talk).
• M. A. Noyan, V. Pruneri, ‘‘Liquid and aerosol repellent transpar-ent surfaces for ink-jet printing applications”, 5th InternationalConference on Multifunctional, Hybrid and Nanomaterials, Lis-bon, Portugal, March 2017 (oral presentation).
Chapter 1
Introduction
With the advent of nanotechnology, our ability to tailor surfaces hasgrown rapidly. This has lead to significant developments in self-cleaningsurfaces. These surfaces have proved to be useful in a wide range ofareas from labor saving applications, such as self-cleaning windows, tolife saving application of antibacterial surfaces. Commercial productshave been available for a while now, but their full potential has yetto be harnessed. A recent report expects rapid growth in the marketfor self-cleaning surfaces market, and, in particular, predicts the totalmarket value to reach $3.3 billion by 2020 (Figure 1.1). The mainfocus of this thesis is the development of novel self-cleaning structuresfor inkjet and 3D printers, demonstrating yet another industry thatcan benefit from this technology.
1.1 Self-cleaning surfaces overview
A self-cleaning surface is a surface capable of reducing or preventingthe occurrence of any type of unwanted matter. This matter could beanything, such as a dust particles or a bacteria, or could even be a
1

Chapter 1. Introduction
Figure 1.1: Total market forecast for self-cleaning surfaces (n-techresearch 2015 [1]).
phase such as corrosion or ice. Examples of these surfaces can be read-ily found in nature and, therefore, biomimicry has played an importantrole in the development of self-cleaning surfaces. A botanist namedWilhelm Barthlott and his team at the University of Bonn discoveredthat structural features on plant leaves, combined with their waxysurface chemistry, result in a non-wettable surface, i.e. a hydrophobicsurface. Dirt particles are picked up by rolling water droplets and arecleaned off the surface [5, 6]. The team fabricated surfaces mimickingthese plant leaves and, noticing their industrial potential, patentedthe idea and trademarked it as ”Lotus Effect R©” [7]. So far, hydropho-bicity has helped in the realization of self-cleaning windows, cements,paints and roof tiles.
The opposite of hydrophobicity is hydrophilicity, whereby waterwets the surfaces almost completely. These surfaces can clean them-selves due to water entering beneath the particles and detaching theparticles from the surface. There are products on the market which
2

Chapter 1. Introduction
combine hydrophilicity with photocatalysis in order to improve thecleaning performance. In 2001, glass manufacturer Pilkington an-nounced the first commercial self-cleaning product Pilkington Activ
TM.
This is a window designed for homeowners which is capable of cleaningthe dirt accumulating on itself. The window is coated with TiO2 and,on contact with sunlight, the coating chemically breaks down the dirton the window via the process of photocatalysis. Later, upon raining,water forms a layer on the surface, washing away the decomposed dirtparticles.
Mature hydrophobic and hydrophilic technologies dominate to-day’s market for self-cleaning materials. As well as the self-cleaningarchitectural components mentioned above, another area where thesetechnologies are used is self-cleaning fibers and fabrics. This mightreduce the world’s water consumption, helping us to preserve our en-vironment. In addition, hydrophobic surfaces also present opportuni-ties to prevent corrosion. There are many other self-cleaning surfaces,however, not based on hydrophobic and hydrophilic technologies aloneand their market share is expected to increase in the following years [1].
One important example of the above is antibacterial surfaces. Thesesurfaces are indispensable for the medical industry as they are usedin many components interacting with the human body. The foodindustry also benefits from these surfaces as the antibacterial per-formance of food packing is critical for conserving food. There arevarious working principles behind anti-bacterial surfaces; for exam-ple, their topographies are designed such that they can disrupt thecell membrane, killing the bacteria [8]. Another mechanism dependson metals being lethal to cells. Studies indicate that different met-als create different kinds of damages due to oxidative stress, proteindysfunction or membrane damage [9].
Anti-icing surfaces are also important because ice on roads, aero-plane wings and windows, as well as icicles, might be dangerous tohuman life. Some of these surfaces are thermally driven [10]. For ex-
3

Chapter 1. Introduction
ample, an indium tin oxide (ITO) defrosting coating is used for someaircrafts’ cockpit windows. When a current passes through the ITO,it provides heat due to Joule heating and defrosts the window.
Dust repellent surfaces are another type of self-cleaning surface.This technology is important, for example, for solar cells as dust con-tamination can decrease conversion efficiency. As explained previously,hydrophobic and hydrophilic surfaces can be used to clean dust par-ticles but they depend on water being abundant. However, this isnot the case for arid regions and in space. To overcome this limita-tion, a surface that can clean dust using an electrostatic action wasdeveloped. A set of electrodes creates alternating electric fields on thesurface and causes dust particles to move away dust. This is called anelectric curtain or electrodynamic screen [11].
1.2 Aim of the thesis
This thesis has been devoted to the development of self-cleaning sur-faces for inkjet and 3D printers in order to deal with contamination ofcritical printer parts. The self-cleaning properties of these parts wouldincrease their lifespan. This project has been an industrial project incollaboration with an industrial partner, Hewlett-Packard Barcelona.Surfaces validated in the laboratory were tested on-site, inside theprinters at Hewlett-Packard Barcelona.
The first objective of this thesis is to develop a transparent surfacecapable of reducing or preventing ink aerosol contamination generatedinside inkjet printers. For this, a surface combining Joule heating andhydrophobicity has been designed. The second objective is to design atransparent surface for 3D printers with the ability to clean the powderwhich contaminates the printer parts. For this, an “electric curtain”,consisting in surface electric fields applied through properly designedmultilayer co-planar electrodes, was used.
4

Chapter 1. Introduction
For both surfaces, the aim has been to fabricate correspondingsamples, to build a deposition system to create the contamination, toapply the cleaning procedure and finally to develop a characterizationprotocol to quantify the effect of cleaning.
Last but not least, objective in both cases has been to ensure indus-trial applicability. This has been achieved by using identical substratesand contaminants as the ones utilized in the printers and by furthertesting of the surfaces inside the printers.
1.3 Thesis outline
The thesis can be divided into two parts. The first part (Chapters 2and 3) describes the self-cleaning surfaces for inkjet printers and thesecond part (Chapters 4 and 5) presents the self-cleaning surfaces for3D printers. Including the introduction (Chapter 1) and conclusions(Chapter 6), there are six chapters in total.
In the first part, Chapter 2 starts by describing the ink aerosolcontamination problem, and stating conventional solutions proposedand the solution presented in this work. Later, basic principles ofJoule heating and wettability of liquids on flat surfaces are described.The chapter goes on to explain the details of fabrication, testing andcharacterization of the self-cleaning structures against ink aerosol con-tamination. The chapter ends with a discussion of the obtained results.Chapter 3 presents the testing of the surfaces explained in Chapter 2.The experimental procedures and results are explained and discussedin detail.
In the second part, Chapter 4 tests the effectiveness of the elec-tric curtain technology against the powder used in 3D printing. Thechapter starts by explaining how this powder contamination is formedand describes what problems it poses. It goes on to explain the var-ious powder removal efforts studied so far. Before going into the ex-
5

Chapter 1. Introduction
perimental details, a brief background on particle adhesion and theelectric curtain is presented. Then fabrication,testing and characteri-zation methods are given in detail and, finally, the results are shownand discussed. Chapter 5 introduces a novel structure, a double layerelectric curtain, which further improves the self-cleaning performanceover a single layer electric curtain. It describes the structure in de-tail and how its performance is characterized. Later, simulations andtesting of the several double layer electric curtain configurations aregiven and compared with a single layer electric curtain.
Finally, Chapter 6 summarizes the results and presents an outlookfor future directions.
6

Chapter 2
Self-cleaning surfaces forinkjet printing
2.1 Introduction
Aerosol is the name given to small particles (solid or liquid) suspendedin air (or any other gas), and it can be seen in nature. Fog, for example,is a natural aerosol made up of small water droplets. Volcanic aerosoland desert dust are other examples of natural aerosol. They affect ourplanet’s atmosphere significantly. Aerosols are generated artificially,too. They are used in medical treatments for respiratory illnesses,in sprays to deliver consumer products such as deodorant and paint,and also in agriculture for pesticide delivery. Ink aerosol forms insideinkjet printers, the most common printer type on the market today,as an unwanted side effect of printing.
Inkjet printing is used extensively for printing text and images ontosubstrates, but it is also used for printing electronics, optical devicesand biological arrays [12–16]. The basic principle of inkjet printingis to fire ink droplets generated through the application of a pulse of
7

Chapter 2. Self-cleaning surfaces for inkjet printing
pressure, through a set of nozzles and onto a substrate (paper, plastic,etc.) in order to create the pixels of the intended image [17]. The inkis made of a colorant (e.g. pigment, dye) and a vehicle (e.g. water,organic solvent). The ink droplets in the aerosol can originate fromtwo main mechanisms: (i) dispersion into the surrounding air of largerprinting droplets flying from the printhead to the paper, and (ii) thedroplets themselves, when tiny enough to get incorporated into theaerosol.
To prevent ink drying on the nozzles, printheads clean them byspraying excess ink into a separate component called a spittoon. Thisaction is an important source of aerosol generation. The aerosol gen-eration issue is more critical in large format printers, as these are highperformance machines consuming significant amounts of ink comparedto desktop printers.
Ink aerosol can accumulate on the mechanical components, whichmay get in contact with the printing media, hence decreasing the qual-ity of the image. It can also accumulate on encoder strips, causing falsereadings and, eventually, failures. However, the most significant detri-mental effect of ink aerosol is the contamination of the transparentwindows of the optical sensors, one of which is a multi-purpose sen-sor used for calibration of the printhead position, and also the colorand media advanced systems (Figure 2.1). Aerosol deposition on thisphoto-detector protection window reduces transparency and preventsthe light from reaching the sensor, which affects its functional perfor-mance.
Several approaches have been proposed in order to reduce the ef-fects associated with ink aerosol contamination, for example optimiz-ing designs and algorithms to reduce the amount of ink generated [18]or to increase its collection while it flies around inside the printerchamber [19]. However, these methods are holistic i.e. they reduceaerosol contamination on critical parts as well as non-critical parts.An approach addressing the issue of aerosol contamination on specific
8

Chapter 2. Self-cleaning surfaces for inkjet printing
(a) (b)
Figure 2.1: a) Calibration sensor used in HP inkjet printers. b) Printerduring color calibration
parts would save energy.
This part of the thesis focuses on designing and developing func-tionalized surfaces that can prevent and reduce ink aerosol contami-nation. Figure 2.2 depicts the proposed surface functionalization ap-proaches. First, transparent conducting films (TCFs) were used inorder to heat up the surface of a transparent substrate using elec-trical currents (Joule effect). In this way, liquid ink vehicle dropletsthat were in contact with the surface evaporate. Secondly, we ap-plied a low surface tension self-assembled monolayer (SAM) to achievehydrophobic surfaces. Such surfaces have large contact angles thatprevent the spreading of the droplets, thus reducing the area shad-owed by the ink aerosol and thereby increasing wavelength-dependenttransparency. Moreover, vehicle and colorant slippage are more likelythanks to the lower sliding angle. While it is known that functionalizedsurfaces with TCF or SAM can repel liquids [20], they have never beenapplied to ink aerosol or in a demanding environment such as that ofa high-throughput printer. Thirdly, for the first time, we combinedJoule heating and hydrophobicity to further enhance the self-cleaningproperties provided by the two methods separately. A combination
9

Chapter 2. Self-cleaning surfaces for inkjet printing
Figure 2.2: A simple schematic visualization of the concept proposedto reduce ink aerosol contamination
of a TCF and a SAM has been reported before, but the aim of thatwork was to protect the TCF from environmental degradation usingthe SAM [21]. Heating or self-cleaning were not involved.
2.2 Background
In this section, a brief background on Joule heating, wetting and self-assembled monolayers are given.
2.2.1 Joule heating
When an electric current passes through a conductor, heat is produced.This phenomenon is called Joule heating (also, ohmic or resistive heat-ing) and it was first described by James Prescott Joule in 1840. He didseveral experiments involving a wire immersed in water and measuredthe temperature rise caused by a current passing through the wire. Hededuced that the heat produced was proportional to the square of the
10

Chapter 2. Self-cleaning surfaces for inkjet printing
Figure 2.3: Contact angle, θc, the measure of wettability.
current multiplied by the resistance of the wire. The heating is causedby particle collisions during current passage.
Combined with Ohm’s law (V=IR), the equations describing Jouleheating can be given as:
P = I2R = IV = V 2/R (2.1)
where P is the power in watts (W), I is the current in amperes (A),R is the resistance in ohms (Ω) and V is the potential difference involts (V).
2.2.2 Basics of wetting
The wettability of liquids on flat, homogeneous surfaces depends onthe interfacial energies between the vapor, liquid and solid phases. Themeasure of wettability is the contact angle. It is the angle between theliquid/solid and liquid/vapor interface at the three-phase boundarypoint (Figure 2.3).
Young’s equation (Equation 2.2) gives the relation between inter-facial tensions and the contact angle. Therefore, the contact angle isalso referred as Young’s contact angle [22].
11

Chapter 2. Self-cleaning surfaces for inkjet printing
Figure 2.4: Sliding angle(α), advancing contact angle(θA) and recedingcontact angle(θR).
γSL + γLV cosθc = γSV (2.2)
If the contact angle is less than 90, it is said that the liquid wetsthe surface (philic) whereas if the contact angle is greater than 90thesurface is non-wetting (phobic). Water is the most common liquidused for the measurements, and, therefore, the contact angle of wateron a surface is given a specific name, which is the water-contact-angle(WCA). If the WCA is less than 90, the surface is termed hydrophilic,if it is more than 90, the surface is hydrophobic and, finally, if theWCA is more than 150, then the surface is called superhydrophobic.
The other important wetting merit is the tilting (or sliding) angle(Figure 2.4). This is the tilt angle of a surface where the droplet startsto slide. The difference between the advancing and the receding anglegives the contact angle hysteresis. On slippery surfaces, the slidingangle and contact angle hysteresis are low.
12
Chapter 2. Self-cleaning surfaces for inkjet printing
2.2.3 Self-assembled monolayer (SAM)
To change wetting properties of surfaces, self-assembled monolayers(SAM) are typically used. They are molecular chains which spointa-neously grow on surfaces. They consist of a head group which formsthe chemical bond with the surface of the substrate and ending witha terminal group (Figure 2.5a).
SAMs modify the surface chemistry so that one can obtain morewetting or less wetting of liquids. For a given liquid and vapor, saywater and air, degree of wetting is governed by the surface energy ofthe substrate (Figure 2.3, Equation 2.2). If the surface energy of thesubstrate is high, liquid would wet the surface (philic), whereas, ifthe surface energy of the substrate is low, liquid would not wet thesurface (phobic). Phobic or philic surfaces could be obtained withSAMs by modifying their terminal groups accordingly. Figure 2.5bshows an example of a SAM. The terminal group in this case is methyl(CH3) which makes the sample hydrophobic. Instead, alcohol (OH) orcarboxyl (COOH) terminal groups could be used to obtain hydrophilicsurfaces.
2.3 Methods
2.3.1 Joule Heating
The TCF for surface Joule heating was a 100 nm-thick Indium TinOxide (ITO) film deposited onto 25 x 25 mm2 fused silica substratesusing sputtering (AJA International ATC Orion 8 HV). After cleaningthe substrate using acetone and ethanol in an ultrasonic bath, sput-tering of the ITO was carried out. The substrate-target distance wasset to 30 cm. When the base pressure reached 0.01 mTorr, Ar (20sccm) and O2 (1 sccm), deposition precursor gases were introducedinto the system and the deposition pressure was set to 2 mTorr. After
13

Chapter 2. Self-cleaning surfaces for inkjet printing
(a) (b)
Figure 2.5: A schematic of (a) a self-assembled monolayer (SAM) on asurface and (b) an example SAM methyl-terminated, n-alkylsiloxanemonolayer on Si/SiO2. Methyl (CH3) is a commonly used terminalgroup for hydrophobicity [2].
deposition of the TCF, nickel stripe electrical contacts were depositedonto the ITO to achieve a uniform current (heating) over the entiretransparent surface (Figure 2.6a). A power supply (AIM-TTI Instru-ments EL302R) was used to apply a constant electrical current andthe temperature distribution over the heated surface was measuredwith an IR camera (Keysight Technologies U5855A TrueIR ThermalImager). The average temperature was kept constant between 80 Cand 85 C for all experiments, by applying direct current of 0.27A and9V.
The Joule heating might change optical and electrical characteris-tics of the ITO due to annealing [23]. This would cause inconsistencieswhen comparing heated and non-heated samples. Therefore, ITO filmswere annealed at 250 C for 25 minutes, much higher temperature andlonger time than those for the Joule heating so that no change of theITO properties will occur during the experiments.
14
Chapter 2. Self-cleaning surfaces for inkjet printing
Figure 2.6: Images and cross-section schematics of the samples (a)without SAM and (b) with SAM. The effect of SAM is practicallyinvisible as it does not significantly change the transmission of thetransparent and electrically conductive surface.
2.3.2 Hydrophobicity
Samples were coated with a self-assembled monolayer (SAM), alkoxysi-lane functional perfluoropolyether (PFPE) hybrid polymer from DowCorning (2634 Coating). The SAM was initially diluted to 0.1% witha fluorinated solvent (Novec HFE 7200). Substrates were dipped intothe solution for 3 minutes and dried at 50 C for 1 hr. Finally, theywere rinsed in Novec HFE7200 solvent (Figure 2.6b). Contact anglesand sliding angles for water and ink droplets were measured using aKruss GmbH DSA100 drop shape analyzer.
15

Chapter 2. Self-cleaning surfaces for inkjet printing
2.3.3 Aerosol Deposition
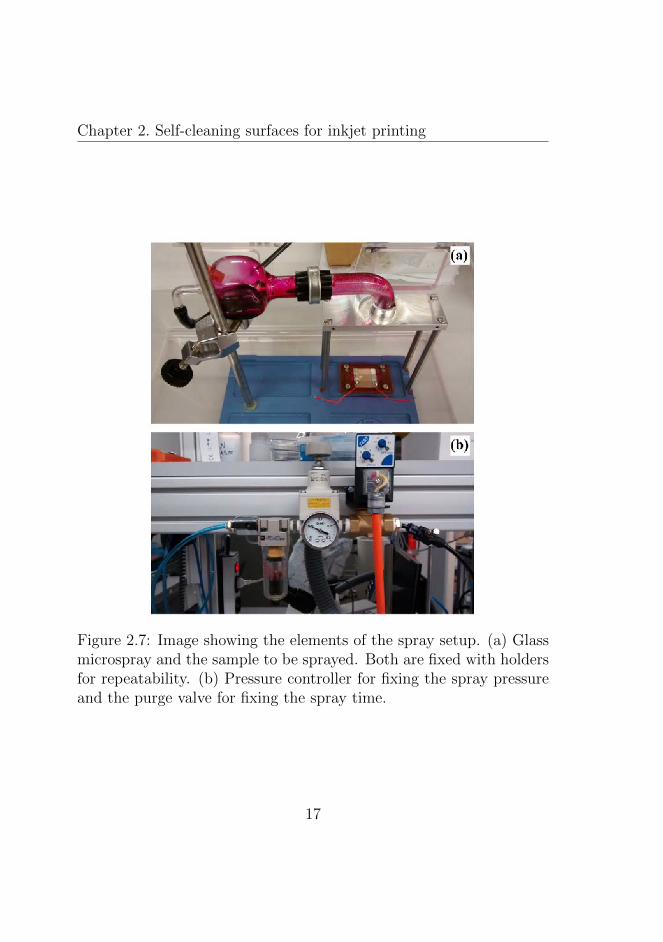
This study required a repeatable aerosol generation and depositionsystem, capable of generating aerosol particles with sizes similar tothe ones generated inside the printer. Early studies involving aerosolsgenerally used custom-built aerosol generation systems and nowadaysa variety of commercial aerosol generators exist [24]. In our experi-ments, a spray setup was built for aerosol deposition, comprising anAgar Scientific Glass microspray device. For repeatability, a purgevalve and pressure controller were used instead of a hand squeeze ballpump. Holders were used to fix the microspray and the target sub-strate. Each sample was sprayed for 48 seconds. Electrical wiringenabled the application of an electrical current to the sample while itwas in the setup. Images of the spray setup can be seen in Figure 2.7.
2.3.4 Characterization
A UV-Vis spectrophotometer (Perkin Elmer Lambda 950) was used tomeasure the transmittance (T%) of the samples, which can be consid-ered a reliable quantification of the overall aerosol contamination onthe samples. The measurement was carried out between 300nm and800nm, in the sensor working range. Optical microscopy was used toanalyze the ink aerosol distribution on the substrate. The images wereprocessed using an image processing software (ImageJ), to measure thepercentage of area covered by the ink aerosol (PAC, %), the numberof particles per unit area (Np/mm
2) and the average size (µm2) of theparticles. The experiments and measurements were repeated 3 timeson each sample and each time (i.e. each spray) 5 images were takenfrom different points of the sample.
16
Chapter 2. Self-cleaning surfaces for inkjet printing
Figure 2.7: Image showing the elements of the spray setup. (a) Glassmicrospray and the sample to be sprayed. Both are fixed with holdersfor repeatability. (b) Pressure controller for fixing the spray pressureand the purge valve for fixing the spray time.
17

Chapter 2. Self-cleaning surfaces for inkjet printing
2.4 Results and discussion
First part discusses the results obtained with the substrate fused silica.Later, second section, extends the concept on to the calibration sensorwindow.
2.4.1 TCF and SAM on the fused silica
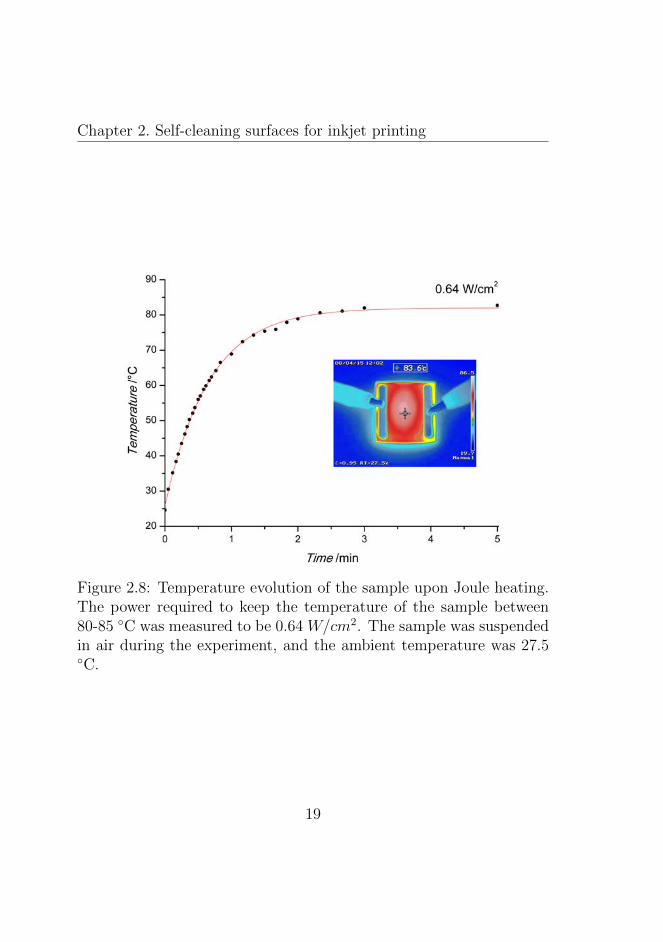
Before the experiments with ink aerosol, the Joule heating and hy-drophobicity were characterized. For the Joule heating, an electricalcurrent was applied to the sample using the TCF. In order to main-tain the temperature of the sample between 80-85 C, the necessarypower per unit surface area was measured to be 0.64 W/cm2. It tookless than 3 minutes to reach the desired temperature. When the tem-perature was stabilized, heat distribution over the sample surface wasobserved to be uniform. Figure 2.8 shows the evolution of temperatureover time upon the application of power and an IR image shows theheat distribution.
For hydrophobicity due to SAM, contact angle (CA) and slidingangle measurements were carried out for both water and ink. For thesamples without SAM and with SAM, the CAs of for a 5 µL waterdroplet were 78and 113, respectively. For the ink, the three-phaseboundary moved after the droplet was placed onto the surface, and,therefore, CAs at t = 0 min and t = 10 min were measured. The CAsof a 5 µL ink droplet on the samples without SAM and with SAM were48and 67at t = 0 min, and 13and 41at t = 10 min, respectively(Figure 2.9). On the sample with SAM, the sliding angles for 8 µLand 10 µL water droplets were measured to be 42and 22, and for inkdroplets 50and 35, respectively. For the same volume of water andink droplets, no sliding was observed on the sample without SAM.The effects of SAM on absorption, reflection and transmission werenegligible.
18
Chapter 2. Self-cleaning surfaces for inkjet printing
Figure 2.8: Temperature evolution of the sample upon Joule heating.The power required to keep the temperature of the sample between80-85 C was measured to be 0.64 W/cm2. The sample was suspendedin air during the experiment, and the ambient temperature was 27.5C.
19

Chapter 2. Self-cleaning surfaces for inkjet printing
Figure 2.9: Contact angles of water and ink droplets of 5 µL on sampleswith and without SAM.
After the characterization of TCF Joule heating and SAM hy-drophobocity, two different structures described in the methods sec-tion (Figure 2.6) were considered for ink aerosol experiments. Sampleswith TCF alone (Figure 2.6a) and with TCF coated with SAM (Figure2.6b) were sprayed using an ad-hoc deposition system (see experimen-tal section for more details). Two different Joule heating modes wereconsidered (Figure 2.10): in the first one the samples were heated af-ter spraying the aerosol (heating mode 1, H1) while in the second, thesamples were first heated and then maintained at a given temperatureduring spraying (heating mode 2, H2).
Transmittance (T%) spectra of the samples are given in Figure2.11a and light microscopy images of the samples are presented inFigure 2.11b. From the light microscopy images, the percentage ofthe area covered by ink (PAC), the number of particles per unit area(Np/mm
2), and the average size (µm2) of the particles were extracted
20

Chapter 2. Self-cleaning surfaces for inkjet printing
Figure 2.10: Experimental flowchart presenting the spraying and heat-ing procedures.
using image analysis, and are presented in Table 2.1. Clearly, thefigure of merit for the sensor window is T%. The more transparentthe surface, the cleaner it is in terms of ink contamination. The lightmicroscopy images were analyzed and quantitatively translated intovalues for further clarification of the effects of TCF and SAM on theT%.
The T% spectra of the samples reveal that the sample with SAMand subjected to heating mode 2 (TCF SAM aerosol H2) is the oneless prone to ink aerosol contamination. The difference in opticaltransmittance between TCF SAM aerosol H2 and the uncontaminatedbare sample (TCF) is less than 1.5%, for every wavelength in the mea-sured spectrum. Individual effects of TCF (Joule heating) and SAM(hydrophobicity) can also be deduced from the spectrum. Firstly, forTCF, it can be seen that the Joule heating increases the transparencyof the samples contaminated with ink (both with and without SAM).As explained in the experimental section, two different heating modes
21

Chapter 2. Self-cleaning surfaces for inkjet printing
Figure 2.11: Characterization of the samples shown in the experimen-tal flowchart. (a) Optical transmittance spectra. Fill area correspondsto the standard deviation. (b) Light microscopy images.
22

Chapter 2. Self-cleaning surfaces for inkjet printing
Table 2.1: Image processing results of the images shown in Figure2.11b. Values indicated by plus or minus sign are standard deviations.
Sample Area covered byink (PAC) [%]
Particle count[Np/mm2]
Averagesize [µm2]
TCF aerosol(control)
45.62±6.15 245.89±93.30 2052.55±643.99
TCF aerosolH1
8.33±0.51 475.40±26.58 175.35±8.58
TCF aerosolH2
15.27±2.78 27.55±4.45 5663.90±1319.66
TCF SAMaerosol
7.82±0.61 93.54±6.38 841.01±100.25
TCF SAMaerosol H1
3.04±0.37 90.06±4.52 339.88±52.76
TCF SAMaerosol H2
1.71±0.25 19.28±2.09 893.98±145.12
23

Chapter 2. Self-cleaning surfaces for inkjet printing
were used. Of these, heating mode 2 (blue curves) outperforms heatingmode 1 (red curves).
Secondly, with regard to the effect of SAM, a significant differencebetween the samples with SAM and without SAM draws our attention:there is a specific absorbance pattern for the samples without SAM,which is absent for the samples with SAM. It is reasonable to anticipatespecific absorbance from ink, because it is used to provide a specificcolor, but the inks used for all the experiments were the same and onlyin the case of samples without SAM do we observe this wavelength-specific absorption. We believe that the observed difference is relatedto the height of the droplets. In the case of the samples with SAM, thedroplets had a larger contact angle, and, therefore, a larger averageheight, and acted as dark spots for the probing light. Hence, therewas a wavelength-independent decrease in transparency. On the otherhand, in the case of the samples without SAM, the droplets werespread over a larger area, allowing light to pass through them andconsequently evidencing the colorant absorption fingerprint (Figure2.12a). This is also consistent with the observed absorption spectraof the ink-water solution for varying ink concentrations, from 0.1% to100% (Figure 2.12b). Above 5% ink concentration, the absorption ofthe ink (colorant) was no longer evident.
This means that the effect of SAM is wavelength dependent. Com-paring the dotted and solid curves of the same color in Figure 2.11a,one can see that below 600 nm, the samples with SAM are moretransparent than the samples without SAM. However, above 600 nm,TCF SAM aerosol is less transparent than TCF aerosol, above 600nm. For the samples with heating, SAM does not affect transparencysignificantly. This can be seen by comparing TCF aerosol H1 withTCF SAM aerosol H1 and TCF aerosol H2 with TCF SAM aerosol H2,above 600 nm.
Light microscopy images of the samples were taken and studiedin order to understand the mechanisms behind the observed transmit-
24

Chapter 2. Self-cleaning surfaces for inkjet printing
Figure 2.12: (a) Image showing light-ink drop interaction dependingon the contact angle. (b) Absorption spectrum of ink-water solutionfor varying ink concentrations.
25

Chapter 2. Self-cleaning surfaces for inkjet printing
tance spectra. First, let us understand how heating increases the trans-parency of contaminated samples. Upon heating TCF SAM aerosol,one obtains TCF SAM aerosol H1. Comparing the light microscopyimages of these two samples, one can see that almost all of the inkdroplets remained on the surface but they became smaller. This isconfirmed by the PAC value going down from 7.82 ± 0.61 % to 3.04± 0.37 % while the number of particles stay almost the same. Thissuggests that the vehicle evaporates but the colorant stays on thesurface (ink consists of a colorant and a vehicle). This can also beseen for the samples without SAM by comparing TCF aerosol withTCF aerosol H1. One could observe some vehicle evaporation andcolorant density increase in the centers of the ink droplets. To see theeffect of the two different heating modes (H1 and H2), let us com-pare TCF SAM aerosol with TCF SAM aerosol H2. The PAC valuedecreases from 7.82 ± 0.61 % to 1.71 ± 0.25 % but this time the num-ber of particles does not stay the same, it goes down from 93.54 ±6.38 to 19.28 ± 2.09. This might indicate that a large fraction of thedroplets evaporated or drifted away through convection before touch-ing the surface, and comparing the samples without SAM supportsthis possibility. The evaporated droplet shape (colorant concentratedon the center leaving some vehicle around the edge), which can beseen on TCF aerosol H1, cannot be seen on TCF aerosol H2. Thisalso suggests that the droplets might have evaporated before touchingthe surface. This explains why heating mode 2 outperforms heatingmode 1 in transmittance measurements. Heating mode 1 removes thevehicle from the surface leaving the colorant behind, whereas heatingmode 2 removes the vehicle and, in addition, prevents some of the inkreaching the surface, thus decreasing the colorant on the surface.
The effect of SAM can be seen by comparing the light microscopyimages of TCF aerosol and TCF SAM aerosol. As anticipated, thedroplet spreads more on the sample without SAM than on the samplewith SAM. The PAC value goes down from 45.62 ± 6.15 % to 7.82
26

Chapter 2. Self-cleaning surfaces for inkjet printing
± 0.61 %, respectively. In other words, the sample with SAM hasa larger uncontaminated area (100% – (7.82 ± 0.61%)) compared tothe sample without SAM (100% - (45.62 ± 6.15%)). Hence one mightexpect the samples with SAM to be more transparent compared to thesamples without SAM, but, as explained previously, droplets on thesample with SAM are less transparent compared to the droplets on thesample without SAM. This is due to the difference in average dropletheight (Figure 2.12), and the transparency of the droplets on the sam-ple without SAM is greatly dependent on the wavelength due to thespecific absorption of the ink. This interplay between opposite forcesdetermines the wavelength dependency of the effect of SAM observedin the transmittance measurements. Below 600 nm, the droplets onboth samples TCF SAM aerosol and TCF aerosol have similar opac-ity due to specific absorbance of the thinner droplets on TCF aerosol.Hence the PAC determines the transparency, with a lower PAC re-sulting in higher transmittance values. Above 600 nm, droplets on thesample with TCF aerosol become almost transparent. This increasesthe transparency of TCF aerosol above TCF SAM aerosol. In addi-tion, one can see that SAM also affects the evaporation behavior of thedroplets. On TCF aerosol H1, there are traces of the vehicle aroundthe remaining colorant, whereas the surrounding of the colorant onTCF SAM aerosol H1 lacks visible traces of the vehicle. This is be-cause SAM reduces the stickiness of the surface.
Transparency evolution was also observed “in situ” and Figure2.13 shows how spraying decreased the transparency of the samplewith ITO and SAM, whilst heating increased it, with a cleaning stepof 50s.
27

Chapter 2. Self-cleaning surfaces for inkjet printing
Figure 2.13: Light intensity vs. time graph showing how spraying andheating effects the detected light.
28
Chapter 2. Self-cleaning surfaces for inkjet printing
Figure 2.14: Effect of hydrophobicity and heating on the actual sensorwindow.
2.4.2 TCF and SAM on the calibration sensorwindow
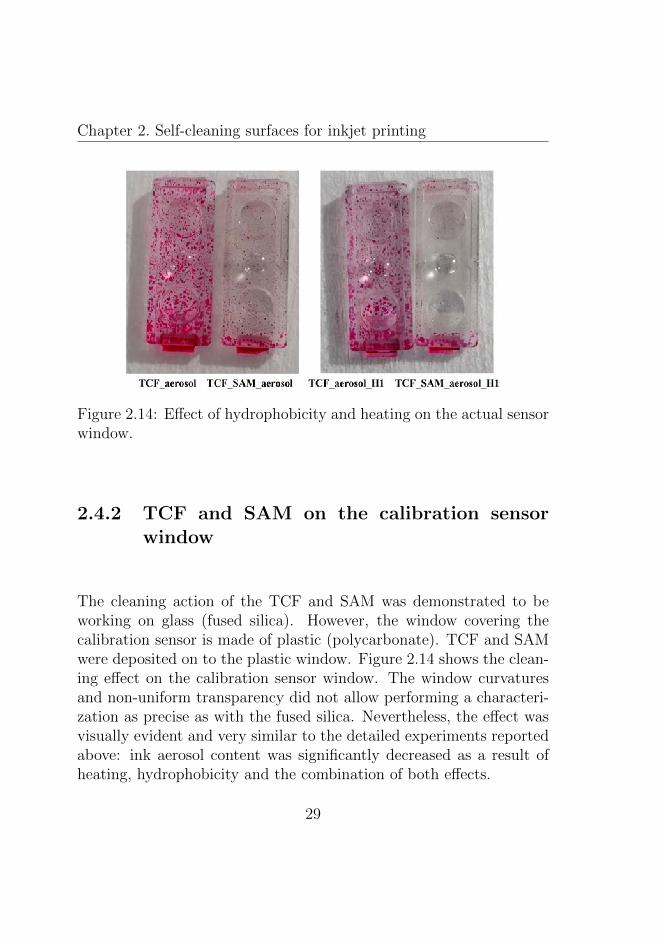
The cleaning action of the TCF and SAM was demonstrated to beworking on glass (fused silica). However, the window covering thecalibration sensor is made of plastic (polycarbonate). TCF and SAMwere deposited on to the plastic window. Figure 2.14 shows the clean-ing effect on the calibration sensor window. The window curvaturesand non-uniform transparency did not allow performing a characteri-zation as precise as with the fused silica. Nevertheless, the effect wasvisually evident and very similar to the detailed experiments reportedabove: ink aerosol content was significantly decreased as a result ofheating, hydrophobicity and the combination of both effects.
29

Chapter 2. Self-cleaning surfaces for inkjet printing
2.5 Conclusions
We have investigated the self-cleaning effect of transparent surfacescovered with a transparent conducting film (TCF) and a hydrophobicself-assembled monolayer (SAM) against ink aerosol contamination.The former method induced Joule heating. Even though Joule heat-ing and hydrophobicity individually reduced ink aerosol contamination(depending on the wavelength), the experiments revealed that a com-bination of both methods was far more effective. Without hydropho-bicty and Joule heating, the transmittance loss of the bare substratesprayed with ink was around 10% on average and reached 20% in thespecific absorption range of the ink. Transmittance loss was reduced tobelow 1.5% for the sprayed samples treated with both hydrophobicityand Joule heating. In addition, this treatment reduced the percent-age of the area covered by ink from 45.62 ± 6.15 % to 1.71 ± 0.25%. The results obtained with glass substrates were extended to theplastic window of an optical calibration sensor widely used in commer-cial inkjet printers, thus demonstrating the potential of the proposedapproach to prevent and reduce aerosol contamination in real worldapplications.
30

Chapter 3
Inkjet printer test of theself-cleaning surfaces
3.1 Introduction
In the previous chapter, a transparent surface capable of reducing andpreventing ink aerosol contamination was demonstrated. To simulatethe ink aerosol generated inside an inkjet printer, a custom-built setupwas used (see section 2.3/Aerosol deposition). The conditions inside aprinter, however, aren’t the same and because of this, cleaning perfor-mance of the structures might be different. For this reason, surfaceswere tested inside a large format inkjet printer, and this chapter isdevoted to this experiment.
Several differences between the ink aerosol generated in a labora-tory and in a printer can be noted. First of all, in a printer, a set ofdifferent colors is used, which means that the specific absorbance forone color seen in the laboratory experiments is not expected withina printer setting. In addition, the size distribution and the amountof ink aerosol contamination for a given printing volume might also
31
Chapter 3. Inkjet printer test of the self-cleaning surfaces
Figure 3.1: The printer (HP Latex 560) used for the tests. (a) Printingarea and (b) spittoon marks the regions where samples were installedduring first and second tests, respectively.
vary. These values are unknown because, until now, a quantitativecharacterization of ink aerosol contamination has never been carriedout at HP Barcelona. Finally, it should be noted that in the labora-tory, aerosol from one spray is generated in approximately a minute,whereas, inside the printer, contamination is accumulated over a longtime period, typically years.
3.2 Experimental details
The printer used for the test was an HP Latex 560 printer (Figure3.1). The lifetime of printers is generally given as the total amount ofink in liters (L) consumed for printing. For this model recommendedmaintenance is stated as 100L and it has a lifetime of 550L.
Only heating mode 2 (H2), i.e. heating while spraying, was consid-ered for the printer tests because the printer was continuously working.
32

Chapter 3. Inkjet printer test of the self-cleaning surfaces
(a) (b)
Figure 3.2: First test in the printing region. (a) Sample installation.(b) IR image of the samples.
After the power supply for Joule heating was set, it was left on duringthe whole experiment. The tested samples were TCF aerosol, TCFSAM aerosol, TCF aerosol H2, and TCF SAM aerosol H2.
The ideal place to mount the samples would be right beside thecalibration sensor. However, this sensor is inside a moving part calleda printhead carrier so this would be technically very difficult becauseelectrical wiring is required for heating the samples. Therefore, for thefirst experiment, the samples were placed on the metal plate behind theprinthead carrier, where printing occurs (Figure 3.1a). This locationwas easily accessible. A direct current of 3.1A and 29V was necessaryto heat the samples to around 80 C. This is much higher than thepower used in the laboratory experiments, the reason being that themetal plate behind the samples acts as a heat sink for the heatedsamples. The area of installation with the samples and their IR imagescan be seen in Figure 3.2.
In the second experiment (Figure 3.3), the samples were placedbeside the spittoon (Figure 3.1b). In this region, a higher amount of
33

Chapter 3. Inkjet printer test of the self-cleaning surfaces
(a) (b)
Figure 3.3: Second test in the spittoon region. (a) Sample installation.(b) IR image of the samples. ”Easyclean” refers to the SAM layer.
ink aerosol was expected. This time samples were placed on plastic;therefore, 9V, 0.8A DC was enough for reaching above 80 C.
3.3 Results and Discussion
The first test ran up to 100L printing time, close to its recommendedmaintenance. It took 100 days to reach that level. None of the samplesaccumulated aerosol. From this, we can conclude that there was notenough ink aerosol generation close to the metal plate behind theprinthead carriage.
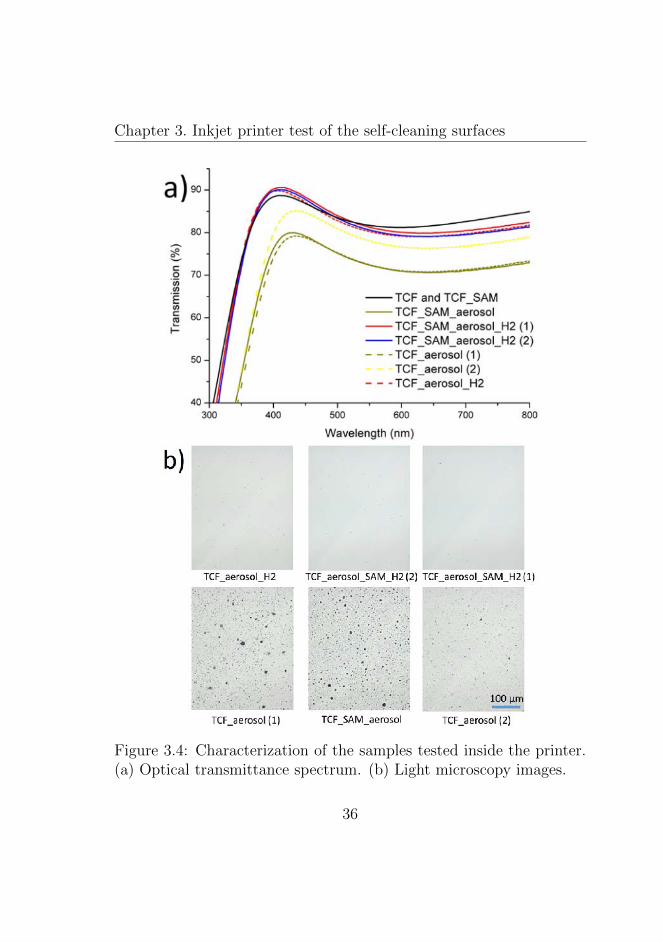
For the second test, in the region of the spittoon, more aerosolgeneration was expected due to spitting action of the printheads. Inaddition, we planned to drive the printer until the end of its lifetime.At around 100L, aerosol accumulation was observed and the experi-ment kept running until 400L of ink had been, a total of 208 days. TheT% and light microscopy images of the samples are given in Figure
34

Chapter 3. Inkjet printer test of the self-cleaning surfaces
Table 3.1: Image processing results of the images shown in Figure3.4b. Values indicated by plus or minus sign are standard deviations.
Sample Area covered byink (PAC) [%]
Particle count[Np/mm2]
Averagesize [µm2]
TCF aerosol(1)
6.57±2.14 37e3±8e3 1.76±0.23
TCF aerosol(2)
2.71±0.40 27e3±4e3 0.99±0.03
TCF SAMaerosol
7.11±0.55 41e3±5e3 1.74±0.11
TCF aerosolH2
0.12±0.02 446±114 2.92±0.90
TCF SAMaerosol H2 (1)
0.02±0.01 124±61 1.55±0.69
TCF SAMaerosol H2 (2)
0.08±0.04 422±19.94 109±0.51
3.4 and particle analysis of the ink content on the samples are shownin Table 3.1.
Before considering the effects of Joule heating and hydrophobicity,two important differences between the printer test and the laboratorytests should be noted, as mentioned previously in the introduction.The first one is the fact that the particle sizes for the aerosol gen-erated inside the printer test (Table 3.1) are much smaller than forthe aerosol generated in the laboratory (Table 2.1). Secondly, in thelab experiment only one color is used, whereas the actual printer usesseveral different colors. Therefore, as expected, a specific absorption
35
Chapter 3. Inkjet printer test of the self-cleaning surfaces
Figure 3.4: Characterization of the samples tested inside the printer.(a) Optical transmittance spectrum. (b) Light microscopy images.
36

Chapter 3. Inkjet printer test of the self-cleaning surfaces
cannot be seen in the transmission measurement of the samples testedinside the printer (Figure 3.4).
Comparing the ink contamination on TCF aerosol (1) and TCFaerosol (2) indicates that aerosol distribution is not homogeneous inthe regions where the samples were installed. They are identical sam-ples but one has 7% of its surface area covered with ink, whereas theother has only 3% coverage. Another shortcoming of the test was thelow sample size. In the lab, experiments were repeated many times,over several days. In the case of the printer test, however, one exper-iment takes hundreds of days and consumes one large format printer.Still, there are several conclusions that can be drawn from this exper-iment.
Firstly, comparing samples with/without Joule heating, a cleardifference can be seen. The area covered by ink decreases from 3-7%to 0.1% upon Joule heating. The effect of SAM is not as apparent,however. For the samples without heating, the sample with SAM(TCF SAM aerosol) has more area covered by ink compared to theones without SAM (TCF aerosol (1), (2)). This was not expected be-cause, as shown in the previous chapter, SAM increases the ink contactangle, resulting in less spreading of ink. This might be due to the verysmall droplet volumes. For the samples with heating, however, thesamples with SAM (TCF SAM aerosol H2 (1), (2)) has less ink con-tamination and are more transparent than the sample without SAM(TCF aerosol H2). In order to reach a conclusive result about theeffect of SAM, more experiments are needed with more samples andin a setting where aerosol distribution is homogeneous.
Another unexpected behavior can be seen when the transmissionbehavior of the heated samples (TCF SAM aerosol H2 (1), (2) andTCF aerosol H2) is compared with that of the clean samples (TCFand TCF SAM). Within the wavelength range 350-500nm, these heatedsamples are even more transparent than the clean sample. This isprobably due to annealing. The Joule heating action of the samples
37
Chapter 3. Inkjet printer test of the self-cleaning surfaces
were essentially annealing the samples for 200 days, and according torelated literature, annealing increases the transparency of ITO filmsin the visible region [23]. Despite this, from the image analysis (Table3.1) it can be seen that ink contamination of the heated samples is atmost 0.1%, which should cause very little transmission loss.
The final conclusion is with regard to the transmission loss causedby the ink aerosol. By comparing the transmission of the clean sam-ples (TCF and TCF SAM) with their contaminated counterparts(TCF aerosol (1) and TCF SAM aerosol) it can be said that inkaerosol causes an average of 10% transmission loss in the visible re-gion.
38

Chapter 4
Self-cleaning surfaces for 3Dprinting
4.1 Introduction
We are surrounded by particles. From subatomic particles like elec-trons to macroscopic particles like powder, they vary greatly in size.Macroscopic particles with sizes of between one micron and one mil-limeter are crucial in today’s technological world. They are used inmany industries, including agriculture, civil engineering, food, phar-maceuticals, energy, manufacturing and so on. As well as being cru-cial to today’s technology, they can also be harmful. They cause airpollution, which results in both environmental and industrial healthhazards, and most of the powders are explosive due to their high sur-face area. In addition, they are responsible for contamination to alarge degree.
Powder is also used in HP 3D printers. Powders are both thebuilding blocks of the technology, and the cause of problems relatedto contamination. This and the following chapter presents a solution
39

Chapter 4. Self-cleaning surfaces for 3D printing
Figure 4.1: Schematic representation of HP multi jet fusion technology[3].
for powder related problems in HP 3D printers.
HP 3D printers use a technology called multi jet fusion [3]. This isa type of powder bed and inkjet head 3D printing. In multi jet fusion,firstly, a layer of powder is laid by a carriage. A second carriagepasses over the powder bed applying a pair of agents, a fusing agentto define the solid layer and a detailing agent to prevent fusing ofthe neighboring powder. Finally, a curing lamp provides energy tocatalyze the fusing agent. Figure 4.1 shows the multi jet fusion processschematically.
As with the ink aerosol contamination described in the previouschapters, a percentage of the powder flies around inside the printer,contaminating printer parts. One of these parts is the glass coveringthe curing lamp (represented as “energy” in Figure 4.1). This contam-ination causes two major problems: loss in energy transmission andglass failure due to fusing on the glass (Figure 4.2).
In this part of the thesis, we explore how we can reduce this powdercontamination on printer parts, in particular on the curing lamp glass.
40

Chapter 4. Self-cleaning surfaces for 3D printing
(a) (b)
Figure 4.2: (a) Powder contamination on curing lamp glass after sev-eral printing jobs (PAC 12%). (b) Glass failure due to contamination.
4.2 State of the art in powder removal
Before now, various powder/dust removal methods have been proposed[25–27], including brushing, fluid jetting, vibration, self-cleaning filmsand an electric curtain. Except for the electric curtain, none of thesemethods has proved to be useful. The electric curtain, however, hasturned out to be the most feasible and widely studied/applied powderremoval method available. It does not require moving parts and addedmass is not significant. However, high working voltages are needed;for example, Sims et al. notes 20% cleaning at 500V and 60% cleaningat 5kV [28].
An electric curtain was first described in a NASA technical reportby Tatom et al in 1967 [29]. However, their results were prelimi-nary and they were not able to demonstrate a working example ofthe device. Masuda et al. developed the idea extensively laying downtheoretical and experimental bases for the electric curtain, starting in1970 [30–35]. In recent years, a team at NASA led by Dr. Carlos I.
41

Chapter 4. Self-cleaning surfaces for 3D printing
Calle has become the greatest contributor in the development of theconcept. Lunar and Martian dust is a significant problem for NASAmissions. Lunar dust causes vision obscuration, false instrument read-ings, dust coating and contamination, seal failures and clogging dur-ing Apollo missions [36]. On the Pathfinder mission, solar cell outputpower decreased by 0.3% per Martian day [37]. Calle et al developedtransparent electric curtains [28,38] and tested them in environmentssimulating the moon [39] and Mars [40]. Testing in space has alsobeen demonstrated [41].
Dust contamination is a serious problem, not only in space, butalso on Earth. Photovoltaic systems need constant cleaning for dustcontamination in order to prevent the decrease in conversion efficiency.An electric curtain has been studied among other cleaning methods toaddress this problem [26,27,42,43].
4.3 Background
A brief introduction to particle-substrate adhesion is useful in order tounderstand the concept of an electric curtain. Therefore, firstly, thebasics of particle adhesion will be explained and this will be followedby the fundamentals of the electric curtain concept.
4.3.1 Particle adhesion
In this section, we present the concept of adhesion, considering solidparticles (1-100µm in diameter) on solid substrates in gaseous media.The interaction of particles with a solid surface is called adhesion, andautohesion is the name given to the interaction of particles with eachother.
Adhesion is comprised of several different forces. First importantcomponent arises from molecular attraction. Permanent or induced
42

Chapter 4. Self-cleaning surfaces for 3D printing
dipoles in the surface regions of two interacting bodies attract eachother. This are called van der Waals interactions and they are effec-tive over separation distances of up to 40 nm [44]. Another source ofadhesion is due to capillary forces. These arise because of liquid con-densation in the gaps between the particles and the surface. Thirdly,when particles are charged prior to contact, Coulomb forces mightmanifest between the surface and the charged particle.
The forces of adhesion are determined by external (e.g. humid-ity or composition of the gas medium) and internal (e.g. particlecharge and shape) conditions of the particle/substrate system in ques-tion. Under specific conditions, certain components of adhesive forcecan override others. For example, if the particles are highly charged,Coulomb forces might govern the adhesion interaction. If, however,the contact zone is conductive or if moisture is present, charges canleak off, reducing the Coulomb forces. In fact, when the relative hu-midity is above 65%, capillary forces dominate over all other forces ofadhesion but when the relative humidity is below 50%, capillary forcesare negligible [44, 45].
If an external force is applied to a particle, detachment dependson the magnitude and direction of the applied force. Friction andadhesion both oppose removal and displacement. Friction preventsmovement in a direction parallel to the surface whereas adhesion op-poses displacement perpendicular to the surface. It should be notedthat friction is solely caused by adhesion if there is not any externalload.
4.3.2 Electric curtain
The typical electric curtain (also called an electrodynamic screen) con-sist of an interdigitated array of electrodes resting on a substrate.Upon the application of an AC voltage, the structure generates alter-nating electric fields on the surface. This field can lift and transport
43
Chapter 4. Self-cleaning surfaces for 3D printing
charged and uncharged particles using dielectrophoretic and electro-static forces [11].
There are two types of electric curtain: single-phase (standingwaves) and poly-phase (travelling waves). Previously, it was thoughtthat travelling wave fields were the only way to transport particles,and that standing wave fields could only levitate but not transportthe particles. Recently, however, it has been shown both theoreti-cally [4,11] and experimentally [46] that single-phase electrics curtaincan transport particles. In this thesis, we have focused on single-phaseelectric curtains and, indeed, have shown net transport of particles.
There are two transport modes for particles excited by a single-phase electric curtain: a surfing mode and a hopping mode [11]. In thesurfing mode, particles roll along the surface in a single direction. Forthis, electrode AC oscillation should change sign just as the particlegets to the neighboring electrode pair so that it can experience a forcein a single direction (Figure 4.3). In the hopping mode, the particlereceives a vertical push when it is on top of the electrode. Hoppingheight and length can exceed several multiples of the electrode period.
Atten et al. noted that when the operation voltage of the elec-tric curtain is higher than the ionization voltage, dielectric barrierdischarge (DBD) occurs, causing uncharged and weakly charged par-ticles to acquire more charge. This, in turn, improves the cleaningefficiency of the electric curtain [46].
4.4 Methods
4.4.1 Design and fabrication
As previously stated, for this work, we have chosen a single-phaseelectric curtain. The main parameters for an electric curtain are elec-trode width (D) and period (L), but other parameters to consider are
44

Chapter 4. Self-cleaning surfaces for 3D printing
Figure 4.3: A simple schematic showing the surfing mode motion ofpositively and negatively charged particles on an electric curtain. Dot-ted lines represent the electric field, small solid arrows represent di-rection of particle motion, and f represents the frequency of AC oscil-lation.
electrode material and thickness. We used an electric curtain designwith D=0.5mm and L=1mm. In order to have a transparent electriccurtain, we used a 100nm thick ITO as the electrode material. Thisstructure was fabricated on a borosilicate 3.3 substrate, which is theexact glass used in HP multi jet fusion 3D printers to cover the curinglamp. It was cut to 35x35mm pieces using a dicer and cleaned usingacetone and ethanol in an ultrasonic bath. A photoresist (AZ5214E)layer was spin coated. The electrode pattern was written onto thephotoresist by exposing it with the laser writer (Microtech LW405B).Later, with development (AZ726 MIF), patterns were revealed. Theelectrode material was deposited using sputtering (AJA InternationalATC Orion 8 HV), and, finally, a lift-off in acetone revealed the elec-tric curtain structure. The electric curtain design and fabrication canbe seen in Figure 4.4.
45

Chapter 4. Self-cleaning surfaces for 3D printing
Figure 4.4: Design and fabrication of the electric curtain. Top andcross section views are given on the left hand side. A schematic of thefabrication is given on the right hand side.
4.4.2 Particle deposition
The powder used for generating contamination was polyamide 12 (alsoknown as nylon 12) with a size distribution between 20 and 80 µm.As with the substrate, this is the type of powder used in HP MJF3D printers. A spray setup was built the for powder deposition (Fig-ure 4.5). This utilized a powder blower (Model 119, DeVilbiss) whichwas connected to a pressure controller and a purge valve. The pres-sure controller sets the pressure going into the powder blower and thepurge valve sets the blowing time. During the experiments initial pow-der contamination was kept between 20 and 40% PAC, and humidityduring deposition and signal application was kept below 50% RH inorder to prevent capillary forces coming into play.
46

Chapter 4. Self-cleaning surfaces for 3D printing
Figure 4.5: Image of the powder deposition setup showing (a) powderblower, (b) pressure controller, and (c) purge valve.
4.4.3 Signal application
A digital waveform generator (BK Precision 4052) was used to gener-ate the AC signal. It was connected to a high-voltage amplifier (Trek20/20C) which can amplify the signal by a factor of 2000. Appliedvoltage refers to the amplitude of the signal, unless otherwise stated.An oscilloscope (YOKOGAWA DML2024) was used to monitor thesignal. For safety reasons, the signal application to the electric curtainwas conducted inside an insulating box, which shuts off the amplifierwhen the lid is open. This setup is shown in Figure 4.6.
4.4.4 Characterization
A USB microscope (XCSOURCE USB 20X-800X) was placed intothe electric curtain setup for taking in situ images and videos of the
47

Chapter 4. Self-cleaning surfaces for 3D printing
Figure 4.6: Image of the electric curtain setup showing (a) waveformgenerator, (b) high voltage amplifier, (c) insulating box, and (d) os-cilloscope. Inset shows (e) USB microscope and terminals.
48
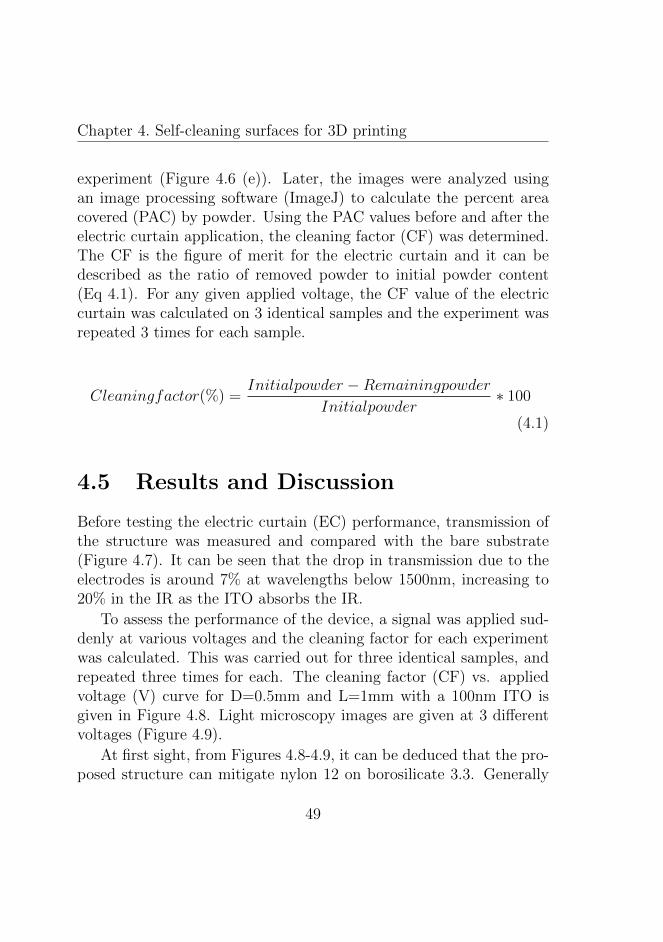
Chapter 4. Self-cleaning surfaces for 3D printing
experiment (Figure 4.6 (e)). Later, the images were analyzed usingan image processing software (ImageJ) to calculate the percent areacovered (PAC) by powder. Using the PAC values before and after theelectric curtain application, the cleaning factor (CF) was determined.The CF is the figure of merit for the electric curtain and it can bedescribed as the ratio of removed powder to initial powder content(Eq 4.1). For any given applied voltage, the CF value of the electriccurtain was calculated on 3 identical samples and the experiment wasrepeated 3 times for each sample.
Cleaningfactor(%) =Initialpowder −Remainingpowder
Initialpowder∗ 100
(4.1)
4.5 Results and Discussion
Before testing the electric curtain (EC) performance, transmission ofthe structure was measured and compared with the bare substrate(Figure 4.7). It can be seen that the drop in transmission due to theelectrodes is around 7% at wavelengths below 1500nm, increasing to20% in the IR as the ITO absorbs the IR.
To assess the performance of the device, a signal was applied sud-denly at various voltages and the cleaning factor for each experimentwas calculated. This was carried out for three identical samples, andrepeated three times for each. The cleaning factor (CF) vs. appliedvoltage (V) curve for D=0.5mm and L=1mm with a 100nm ITO isgiven in Figure 4.8. Light microscopy images are given at 3 differentvoltages (Figure 4.9).
At first sight, from Figures 4.8-4.9, it can be deduced that the pro-posed structure can mitigate nylon 12 on borosilicate 3.3. Generally
49

Chapter 4. Self-cleaning surfaces for 3D printing
Figure 4.7: Transmission behavior of the electric curtain compared tothe bare substrate. Inset shows the image of a fabricated sample.
speaking, it can be said that as the voltage increases, the cleaning in-creases. However there are different regions and, initially, (up to 100V) no particle movement was observed. This is because the electricalforce on the particles was less than the adhesion force.
Between 100 and 200 V, individual particle movements were ob-served, but there was still no bulk movement. There might be severalreasons for this individual behavior. Firstly, some particles might havea higher charges than others, meaning that the electrical force couldbe higher, helping them to overcome the adhesion force below 200V.Secondly, particles are not perfect spheres, but, rather, they are irregu-larly shaped objects. This creates a unique contact geometry betweeneach particle and the substrate. In addition, particle sizes vary. Forthese reasons, the adhesion force is not equal for all particles and,therefore, individual particles with lower adhesion might readily movebelow 200V.
50

Chapter 4. Self-cleaning surfaces for 3D printing
Figure 4.8: Cleaning factor (CF) vs. applied voltage (V) for a 100nmITO electric curtain with D=0.5mm and L=1mm. Error bars rep-resent the standard deviation. For the CF at 2000V, the standarddeviation is smaller than the square itself.
51

Chapter 4. Self-cleaning surfaces for 3D printing
(a) (b) (c)
Figure 4.9: Light microscopy images of the samples at three differentvoltages (a) 0 V (b) 600 V and (c) 2000 V. Yellow stripes are theelectrodes and gray is the substrate.
(a) (b) (c)
Figure 4.10: Edges of the EC after cleaning.
Above 200V, bulk movement begins and almost all particles startmoving. This means that the electrical force is larger than the adhesionforce for most of the particles. The majority of these particles moveparallel to the surface in the direction perpendicular to the electrodes,and move out of the region covered by the electrodes. They stop rightafter the last electrode, which can be confirmed by looking at theedges (Figure 4.10a and 4.10b). Powder movement in the directionparallel to the electrode length is insignificant. The amount of powderin Figure4.10c is similar to the initial powder contamination.
52

Chapter 4. Self-cleaning surfaces for 3D printing
As the voltage increases above 200V, the cleaning factor increasesfurther because of a greater force on the particles. Hence, one wouldexpect this to go on until almost all of the particles are removed, but,rather, the cleaning effect saturates after 400V, with a 60% cleaningfactor.
Between 600 and 1500V, the cleaning factor remains more or lessthe same. The possible reason for this can be deduced by looking atFigure 4.9b. The remaining particles are not randomly distributed,but, rather, most of them are located at the electrode edges as if theyare ’stuck’ there. The reason behind this has been explained by Sunet al. [4] by plotting forces perpendicular to the electrode with respectto position (Figure 4.11). The positions where the forces are zero ornegative are indicated as traps. This means that if a particle is initiallyat a trap, it will not move. Also, if a particle passing over a trap doesnot have enough inertia, it will get stuck there. Edge traps are moreeffective due to negative forces there, meaning particles are drawn tothe traps, whereas the trap at the center of the electrode is only apoint of zero force.
Above 1500V, sparks were observed due to dielectric barrier dis-charge (DBD). These sparks were seen locally at some regions of theelectrodes, extending to the whole surface of the electric curtain ataround 2000V. At this voltage, sparks were observed over the wholeelectrode structure, removing almost all the powder. This has beenobserved previously, and the reason why DBD improves cleaning isexplained before in section 4.3.2.
4.6 Conclusions
In this chapter, a structure capable of reducing powder contaminationhas been demonstrated. The powder and the substrate to be cleanedwere the same materials used in HP MJF 3D printers. It has been
53
Chapter 4. Self-cleaning surfaces for 3D printing
Figure 4.11: Force vs. position showing places where forces are zeroor negative [4].
shown that cleaning performance depends on the applied voltage. At600V, for example, 60% cleaning is observed, whereas above 1500V,sparks due to DBD occur and the cleaning factor increases to 99%.
Edge traps were identified as the phenomena preventing completecleaning below 1500V. Most of the particles remaining after cleaningwere observed at the edge traps. The next chapter describes a novelstructure to decrease/eliminate these edge traps.
54

Chapter 5
Double layer electric curtain
5.1 Introduction
In the previous chapter, a transparent surface capable of mitigatingpowder was demonstrated. This surface was comprised of an electriccurtain. It was shown that 60% of the initial contamination couldbe removed. This could be extended up to 99% when the workingvoltage surpasses the DBD. After cleaning, most of the remainingparticles were observed at the edges of the electrodes. This is due tothe trap states shown in Figure 4.11, which are caused by the highconcentration of the electric field at the electrode edges. If these trapstates can be eliminated, i.e. if the electric field at the electrode edgescan be reduced, one could expect cleaning to improve.
We propose a double layer electric curtain to address this issue.Figure 5.1 shows the cross-section of the double layer electric curtain,together with a light microscopy image of a fabricated sample (topview). The top layer geometry was the same as used previously, i.e.D=0.5mm and L=1mm, and the geometry of the bottom layer waschosen to be D=0.6mm and L=1mm. For the electric field lines to
55

Chapter 5. Double layer electric curtain
Figure 5.1: Double layer electric curtain. Top scheme shows the cross-section and below is the top view of a fabricated sample.
penetrate, a thinner substrate was needed. Therefore 170 µm thickcoverslips (Menzel - D 263 M borosilicate glass) were used as the sub-strate.
With this structure, it was anticipated that the electric field at theelectrode edges could be modified.
5.2 Methods
Fabrication methods were identical to the ones described for the singlelayer electric curtain, the only difference being the need for alignmentof the top and bottom layer electric curtains. This was achieved using
56

Chapter 5. Double layer electric curtain
(a) (b)
Figure 5.2: (a) Double layer EC with 4 terminals. Terminal pairsconnected to the top and bottom EC’s are indicated on the image(b) Combinations of potentials applied to the double layer EC. ‘G’refers to the electrode connected to the ground and ‘AC’ refers to theelectrode with the voltage alternating between +V and -V.
the laser writer software. The same powder deposition and signalapplication systems were used to test the samples.
The structure was tested as follows: Terminals for the top electriccurtain were held constant, but for the bottom electric curtain, variouscombinations were tested. Figure 5.2 shows an example of the doublelayer EC device with its 4 terminals and the combination of potentialsapplied to these terminals.
For characterization purposes, an electric field simulation and anelectric curtain test were conducted for each case shown in Figure 5.2.For the simulations COMSOL, a commercial finite element analysissoftware was used.
As described in the previous chapter, the cleaning factor (CF) is theperformance figure of merit for an electric curtain. On a single layerelectric curtain, both terminals (i.e. ground and AC) have identicalelectric field distributions, causing the amount of particles stickingat the edges to be identical. On the double layer electric curtain,
57

Chapter 5. Double layer electric curtain
Figure 5.3: Areas used to calculate CFs.
however, depending on the configuration, different electric fields canbe observed for G and AC electrodes on the same sample. This causeslocalized variations of the cleaning factor. Therefore, three differentcleaning factor values are given for these samples: firstly, for the areaaround the ground electrode, secondly, for the area around the ACelectrode, and thirdly, for the entire sample. Figure 5.3 shows theareas used to calculate these three cleaning factors.
5.3 Results and discussion
For each case represented in Figure 5.2, the electric field simulation,the image of the sample after the electric curtain (EC) application,and the related cleaning factor values are given in Figure 5.4.
At first glance, one can see that the bottom electric curtain canindeed change the electric field at the edges of the top electric curtain.
58

Chapter 5. Double layer electric curtain
Figure 5.4: (a) E-field simulation and CF for the single layer EC.
59
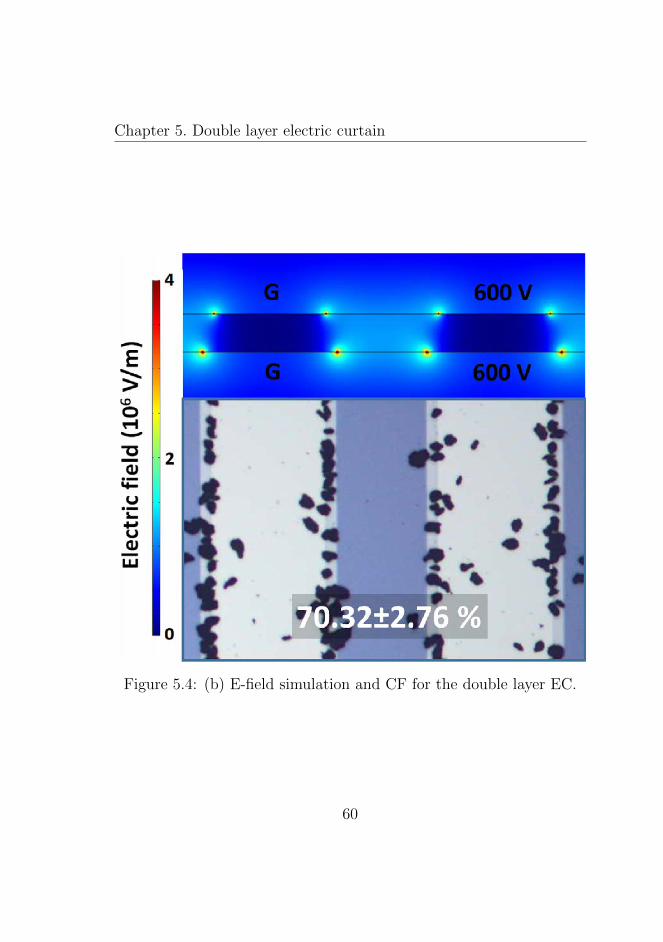
Chapter 5. Double layer electric curtain
Figure 5.4: (b) E-field simulation and CF for the double layer EC.
60

Chapter 5. Double layer electric curtain
Figure 5.4: (c) E-field simulation and CF for the double layer ECstructure, where opposite electrodes are on top of each other.
61

Chapter 5. Double layer electric curtain
Figure 5.4: (d) E-field simulation and CF for the double layer EC,where all bottom electrodes are connected to AC.
62

Chapter 5. Double layer electric curtain
Figure 5.4: (e) E-field simulation and CF for the double layer EC,where AC is placed under G electrode.
63

Chapter 5. Double layer electric curtain
Figure 5.4: (f)E-field simulation and CF for the double layer EC,where AC is placed under AC electrode.
64

Chapter 5. Double layer electric curtain
Figure 5.4: (g) E-field simulation and CF for the double layer EC,where all bottom electrodes are connected to G.
65

Chapter 5. Double layer electric curtain
Figure 5.4: (h) E-field simulation and CF for the double layer EC,where G is placed under AC electrode.
66

Chapter 5. Double layer electric curtain
Figure 5.4: (i) E-field simulation and CF for the double layer EC,where G is placed under G electrode.
67

Chapter 5. Double layer electric curtain
Depending on the configuration, it either lowers the electric field or itincreases it, or it does both at the same time.
It can be said that the simulations and experiments are in goodagreement with each other. As the electric field concentration at theedges of the electrodes decreases, particle sticking at the edges de-crease as well. The cleaning factor for the areas around the individualelectrodes was used as a measure for the particles sticking at the edges.The higher the cleaning factor for an electrode, the lower the numberof particles sticking to that electrode.
Compared to the single layer electric curtain (Figure 5.4a) thereis one configuration with a lower electric field concentration at theedges (Figure 5.4b), and one with a higher electric field concentration(Figure 5.4c). In addition, there are several configurations where oneelectrode has lower traps and the other has higher traps on the samesample, compared to the single layer electric curtain (Figures 5.4d-i).Among these, some configurations deviate significantly from the singlelayer, where traps are completely eliminated in one electrode and verystrong on the opposing electrode (Figures 5.4d,e,g,h), whilst, for theothers, the deviation is smaller (Figures 5.4f,i).
In conclusion, a structure that can reduce electric field concen-tration at the electrode edges, hence the trapping effects, has beenintroduced (Figure 5.4b). The idea behind decreasing the edge trapswas to improve cleaning. Indeed, it has been shown that this struc-ture increases the cleaning factor from 50% for the single layer elec-tric curtain to 70% for the double layer. In addition to this, othercombinations were demonstrated, where in one electrode, traps arealmost completely eliminated but the opposing electrode has moretraps. With these structures, local cleaning factors rise above 85%around the electrode where traps are eliminated (Figures 5.4d,e,g,h).
68

Chapter 6
Conclusions
Self-cleaning surfaces are promising for a wide range of applicationswith many industries that can benefit from these technologies. Thisthesis has demonstrated novel self-cleaning surfaces for printing de-vices.
In particular, a surface combining Joule heating and hydrophobic-ity to be used against ink aerosol contamination in inkjet printers andanother surface capable of reducing powder contamination occurringinside 3D printers have been proposed and developed for the first timeto our knowledge.
In Chapter 2, we investigated the self-cleaning effect of transpar-ent surfaces covered with transparent conductive films (TCFs) anda self-assembled monolayer (SAM) against ink aerosol contaminationthat occurs in printers. Although Joule heating and hydrophobicity re-duced ink aerosol contamination individually, the optimal results wereseen when these two methods were combined. Without hydrophobic-ity or Joule heating, the transmittance loss was as high as 20%, theaverage loss being around 10%. On the other hand, when the sampleswere treated with both hydrophobicity and Joule heating the transmit-tance loss dropped significantly to 1.5%. In addition, this treatment
69

Chapter 6. Conclusions
reduced the percentage of the area covered by ink from 45.62±6.15 %to 1.71±0.25%. The results obtained from the glass substrates wereextended to the ”real” plastic windows used in the calibration sensorsof inkjet printers, which demonstrates the viability of the method inthe printing industry.
In the next chapter, Chapter 3, these surfaces were tested insidea large format inkjet printer. The results revealed that these surfacesare indeed able to reduce ink aerosol contamination generated insidean actual printer. However, some differences were noted. The effect ofJoule heating on the cleaning performance was obvious and it seemedto be the main mechanism for cleaning. On the other hand, regardingthe effect of SAM, no conclusive result could be reached due to lowsample size and non-homogeneity of the ink aerosol contamination.
In chapter 4, a structure consisting of co-planar transparent elec-trodes capable of reducing the powder contamination was demon-strated. While 60% cleaning was observed at 600V, the cleaning factorincreased to 99% above 1500V due to sparks that occur as a result ofdielectric barrier discharge (DBD). Edge traps caused by the concen-tration of the electric field at the electrode edges were identified asthe limiting factor for cleaning to reach above 60%. To address thisproblem, a novel structure was proposed and described in Chapter 5.
This new structure, named double layer electric curtain, consistedof multilayer co-planar transparent electrodes and allowed reducingelectric field concentration at the electrode edges, hence the trappingeffects. This in turn leads to a much higher level of cleaning andparticle removal. For the specific conditions (material, voltage etc.)reported in the thesis, this method increased the cleaning factor from50% for the single layer curtain to 70% for the double layer electriccurtain. In some structures local cleaning factors going above 85%were observed due to almost complete elimination of the trap states.
70

Chapter 6. Conclusions
Outlook Though the results of the thesis are very promising and assuch being protected by patents and trademark secret in some cases,there is still further room for significant improvements to the cleaningperformances of the surfaces presented.
Only flat hydrophobic surfaces were studied for ink repellent sur-faces. However, it is widely known that surface roughness combinedwith hydrophobic coatings would reveal super-hydrophobic surfaces,increasing water contact angles much above 120. This might improvethe cleaning performance. However, this is not a straightforward pro-cess as cleaning depends on the fact that the droplet stays in theCassie-Baxter state (the droplet hanging on the structures). But onactive surfaces, Cassie-Baxter to Wenzel (the droplet filling in thestructures) transition is likely to occur which would hinder cleaning.Nevertheless, specific topographical structures could be designed toprevent this transition.
For the powder cleaning surfaces, focus could be given to the studyof powder-substrate adhesion, not only displacement. Lowering adhe-sion might result in two positive outcomes. Firstly, it might preventpowder from sticking to the surface. Secondly, it might lower theworking voltages for the electric curtain because, for a fixed electrodedesign and signal frequency and shape, the working voltage dependson the adhesive force between the powder and the substrate.
71


Bibliography
[1] n-tech research, “Markets for Self-Cleaning Coating and Surfaces:2015 to 2022,” tech. rep., 2015.
[2] B. Bhushan and H. Liu, “Self-Assembled Monolayers for Control-ling Adhesion, Friction and Wear,” in Nanotribology and Nanome-chanics, pp. 885–928, Berlin/Heidelberg: Springer-Verlag, 2005.
[3] “HP Multi Jet Fusion technology,” Tech. Rep. 4AA4-5472ENW,http://www8.hp.com/h20195/v2/GetPDF.aspx/4AA4-5472EEW.pdf, 2014.
[4] Q. X. Sun, N. N. Yang, X. B. Cai, and G. K. Hu, “Mechanism ofdust removal by a standing wave electric curtain,” Science China:Physics, Mechanics and Astronomy, vol. 55, no. 6, pp. 1018–1025,2012.
[5] W. Barthlott and C. Neinhuis, “Purity of the sacred lotus, or es-cape from contamination in biological surfaces,” Planta, vol. 202,pp. 1–8, 4 1997.
[6] C. Neinhuis, “Characterization and Distribution of Water-repellent, Self-cleaning Plant Surfaces,” Annals of Botany, vol. 79,pp. 667–677, 6 1997.
73

BIBLIOGRAPHY
[7] W. Barthlott, “Self-cleaning surfaces of objects and process forproducing same,” no. US6660363 B1, 1995.
[8] C. D. Bandara, S. Singh, I. O. Afara, A. Wolff, T. Tesfamichael,K. Ostrikov, and A. Oloyede, “Bactericidal Effects of NaturalNanotopography of Dragonfly Wing on Escherichia coli,” ACSApplied Materials & Interfaces, vol. 9, pp. 6746–6760, 3 2017.
[9] J. Lemire, J. Harrison, and R. Turner, “Antimicrobial activity ofmetals: mechanisms, molecular targets and applications,” NatureReviews Microbiology, 2013.
[10] S. Kiruthika, R. Gupta, G. U. Kulkarni, J. Zhao, S. Garner,P. Cimo, Z. Barcikowski, A. Mignerey, L. Hu, Y. H. Lee, and J.-U. Park, “Large area defrosting windows based on electrothermalheating of highly conducting and transmitting Ag wire mesh,”RSC Adv., vol. 4, pp. 49745–49751, 10 2014.
[11] G. Liu and J. S. Marshall, “Particle transport by standing waveson an electric curtain,” Journal of Electrostatics, vol. 68, no. 4,pp. 289–298, 2010.
[12] P. Calvert, “Inkjet Printing for Materials and Devices,” ChemicalMaterials, vol. 13, pp. 3299–3305, 2001.
[13] G. Cummins and M. P. Desmulliez, “Inkjet printing of conductivematerials: a review,” Circuit World, vol. 38, no. 4, pp. 193–213,2012.
[14] J. T. Delaney, P. J. Smith, and U. S. Schubert, “Inkjet printingof proteins,” Soft Matter, vol. 5, no. 24, p. 4866, 2009.
[15] M. Singh, H. M. Haverinen, P. Dhagat, and G. E. Jabbour,“Inkjet printing-process and its applications,” Advanced Mate-rials, vol. 22, no. 6, pp. 673–685, 2010.
74

BIBLIOGRAPHY
[16] T. Xu, J. Jin, C. Gregory, J. J. Hickman, and T. Boland, “Inkjetprinting of viable mammalian cells,” Biomaterials, vol. 26, no. 1,pp. 93–99, 2005.
[17] S. D. Hoath, Fundamentals of Inkjet Printing: The Science ofInkjet and Droplets. Wiley-VCH, 2016.
[18] C. L. Holstun and S. D. Asakawa, “Selection of printing conditionsto reduce ink aerosol,” no. US7066564 B2, 2006.
[19] M. Boleda, R. R. Giles, and P. D. Gast, “Ink aerosol control forlarge format printer,” no. US6203152 B1, 2001.
[20] P. Ragesh, V. Anand Ganesh, S. V. Nair, and A. S. Nair, “Areview on ‘self-cleaning and multifunctional materials’,” Journalof Materials Chemistry A, vol. 2, p. 14773, 6 2014.
[21] H. Lemire, K. Peterson, M. Breslau, K. Singer, I. Martin, andR. H. French, “Degradation of Transparent Conductive Oxides,and the Beneficial Role of Interfacial Layers,” MRS Proceedings,vol. 1537, no. mrss13-1537, 2013.
[22] N. J. Shirtcliffe, G. McHale, S. Atherton, and M. I. Newton, “Anintroduction to superhydrophobicity.,” Advances in colloid andinterface science, vol. 161, pp. 124–38, 12 2010.
[23] S. Song, T. Yang, J. Liu, Y. Xin, Y. Li, and S. Han, “Rapid ther-mal annealing of ITO films,” Applied Surface Science, vol. 257,no. 16, pp. 7061–7064, 2011.
[24] R. N. Udey, a. D. Jones, and G. R. Farquar, “Aerosol andMicroparticle Generation Using a Commercial Inkjet Printer,”Aerosol Science and Technology, vol. 47, no. 4, pp. 361–372, 2013.
75

BIBLIOGRAPHY
[25] G. Landis, “Mars dust removal technology,” IECEC-97 Proceed-ings of the Thirty-Second Intersociety Energy Conversion Engi-neering Conference (Cat. No.97CH6203), vol. 1, pp. 764–767,1997.
[26] G. He, C. Zhou, and Z. Li, “Review of self-cleaning method forsolar cell array,” Procedia Engineering, vol. 16, pp. 640–645, 2011.
[27] A. Alshehri, B. Parrott, A. Outa, A. Amer, F. Abdellatif,H. Trigui, P. Carrasco, S. Patel, and I. Taie, “Dust mitigationin the desert: Cleaning mechanisms for solar panels in arid re-gions,” 2014 Saudi Arabia Smart Grid Conference, SASG 2014,pp. 1–6, 2015.
[28] R. A. Sims, A. S. Biris, J. D. Wilson, C. U. Yurteri, M. K.Mazumder, C. I. Calle, and C. R. Buhler, “Development of atransparent self-cleaning dust shield for solar panels,” Proceed-ings ESA-IEEE joint meeting on electrostatics, no. 1, pp. 814–821, 2003.
[29] F. B. Tatom, V. Srepel, R. D. Johnson, N. A. Contaxes, J. G.Adams, H. Seaman, and B. L. Cline, “Lunar dust degradationeffects and removal/prevention concepts,” Tech. Rep. TR-792-7-207A, Northrop Space Laboratories, 1967.
[30] S. Masuda, K. Fujibayashi, and K. Ishida, “Electrodynamic be-haviour of charged aerosol particles in non-uniform alternatingfields and its applications in dust control,” Staub-Reinhaltungsder Luft, vol. 30, no. 11, pp. 449–456, 1970.
[31] S. Masuda, K. Fujibayashi, K. Ishida, and H. Inaba, “Confine-ment and transportation of charged aerosol clouds via electriccurtain,” Electrical Engineering in Japan, vol. 92, no. 1, pp. 43–52, 1972.
76

BIBLIOGRAPHY
[32] S. Masuda and Y. Matsumoto, “Theoretical characteristics ofstandingwave electric curtains,” Electrical Engineering in Japan,vol. 93, no. 1, 1973.
[33] S. Masuda, Y. Matsumoto, and K. Akutsu, “Characteristicsof standingwave, ringtype electric curtain. experimental study,”Electrical Engineering in Japan, vol. 93, no. 1, 1973.
[34] S. Masuda and T. Kamimura, “Approximate methods for calcu-lating a non-uniform travelling field,” Journal of Electrostatics,vol. 1, no. 4, pp. 351–370, 1975.
[35] S. Masuda, M. Washizu, and I. Kawabata, “Movement of bloodcells in liquid by nonuniform traveling field,” IEEE Transactionson Industry Applications, vol. 24, no. 2, pp. 217–222, 1988.
[36] J. R. Gaier, “The Effects of Lunar Dust on EVA Systems Duringthe Apollo Missions,” Nasa/Tm-2005-213610/Rev1, no. March,pp. 1–16, 2007.
[37] G. A. Landis and P. P. Jenkins, “Measurement of the settling rateof atmospheric dust on Mars by the MAE instrument on MarsPathfinder,” Journal of Geophysical Research, vol. 105, no. E1,p. 1855, 2000.
[38] C. I. Calle, J. L. Mcfall, C. R. Buhler, S. J. Snyder, andE. E. Arens, “Dust Particle Removal by Electrostatic and Di-electrophoretic Forces with Applications to NASA ExplorationMissions,” ESA Annual Meeting on Electrostatics, p. 1, 2008.
[39] C. I. Calle, C. R. Buhler, J. L. McFall, and S. J. Snyder, “Particleremoval by electrostatic and dielectrophoretic forces for dust con-trol during lunar exploration missions,” Journal of Electrostatics,vol. 67, no. 2-3, pp. 89–92, 2009.
77

BIBLIOGRAPHY
[40] C. I. Calle, C. R. Buhler, M. R. Johansen, M. D. Hogue, and S. J.Snyder, “Active dust control and mitigation technology for lunarand Martian exploration,” Acta Astronautica, vol. 69, no. 11-12,pp. 1082–1088, 2011.
[41] C. I. Calle, P. J. Mackey, M. D. Hogue, M. R. Johansen, H. Yim,P. B. Delaune, and J. S. Clements, “Electrodynamic Dust Shieldson the International Space Station: Exposure to the space envi-ronment,” Journal of Electrostatics, vol. 71, no. 3, pp. 257–259,2013.
[42] H. K. Elminir, A. E. Ghitas, R. Hamid, F. El-Hussainy, M. Be-heary, and K. M. Abdel-Moneim, “Effect of dust on the transpar-ent cover of solar collectors,” Energy Conversion and Manage-ment, vol. 47, pp. 3192–3203, 11 2006.
[43] M. Mani and R. Pillai, “Impact of dust on solar photovoltaic (PV)performance: Research status, challenges and recommendations,”Renewable and Sustainable Energy Reviews, vol. 14, pp. 3124–3131, 12 2010.
[44] K. L. Mittal and R. Jaiswal, Particle adhesion and removal. JohnWiley & Sons, 2015.
[45] A. D. Zimon, Adhesion of Dust and Powder. Boston, MA:Springer US, 1982.
[46] P. Atten, H. L. Pang, and J.-L. Reboud, “Study of dust removalby standing wave electric curtain for application to solar cellson Mars.,” IEEE Transactions on Industry Applications, vol. 45,p. 75, 2009.
78