Self-Assessing Locally-Designed Assessments
48
Self-Assessing Locally-Designed Assessments Jennifer Borgioli Learner-Centered Initiatives, Ltd.
description
Self-Assessing Locally-Designed Assessments. Jennifer Borgioli Learner-Centered Initiatives, Ltd. Handouts. qualityrubrics.pbworks.com/DATAG. Organizational Focus. Assessment to produce learning… a nd not just measure learning. - PowerPoint PPT Presentation
Transcript of Self-Assessing Locally-Designed Assessments

Self-Assessing Locally-Designed AssessmentsJennifer Borgioli
Learner-Centered Initiatives, Ltd.

Handouts
qualityrubrics.pbworks.com/DATAG

Organizational Focus
Assessment to produce learning…
and not just measure learning.

“Less than 20% of teacher preparation programs contain higher level or advanced courses in psychometrics (assessment design) or instructional data analysis.”
Inside Higher Education, April 2009

To be assessment savvy….

1999 APA Testing Standards

“The higher the stakes of an assessment’s results, the higher the expectation for the documentation supporting the assessment design and the decisions made based on the assessment results.”


Performance-Based Assessments (PBAs)
• A performance task is an assessment that requires students to demonstrate achievement by producing an extended written or spoken answer, by engaging in group or individual activities, or by creating a specific product. (Nitko, 2001)

Three Types of Measurement Error
• Subject effect• Test effect• Environmental effects
Subject Effects

Testing FatigueTest Familiarity
Bias
Score
Score

Test Effects


Final Eyes isn’t about editing
rather “is this what you want the students to see/read?”

Test from Period 1
Test from Period 2

Compare with . . .
Environmental Effects

Reliability = Consistency

Reliability
Indication of how consistently an assessment measures its intended target and the extent to which scores are relatively free of error. Low reliability means that scores cannot be trusted for decision making. Necessary but not sufficient condition to ensure validity.

three general ways to collect evidence of reliability
• Stability: How consistent are the results of an assessment when given at two time-separated occasions?
• Alternate Form: How consistent are the results of an assessment when given in two different forms?;
• Internal Consistency: How consistently do the test’s items function?

Cronbach’s Alpha
• “In statistics, Cronbach's (alpha) is a coefficient of reliability. It is commonly used as a measure of the internal consistency or reliability of a psychometric test score for a sample of examinees. Alpha is not robust against missing data.”

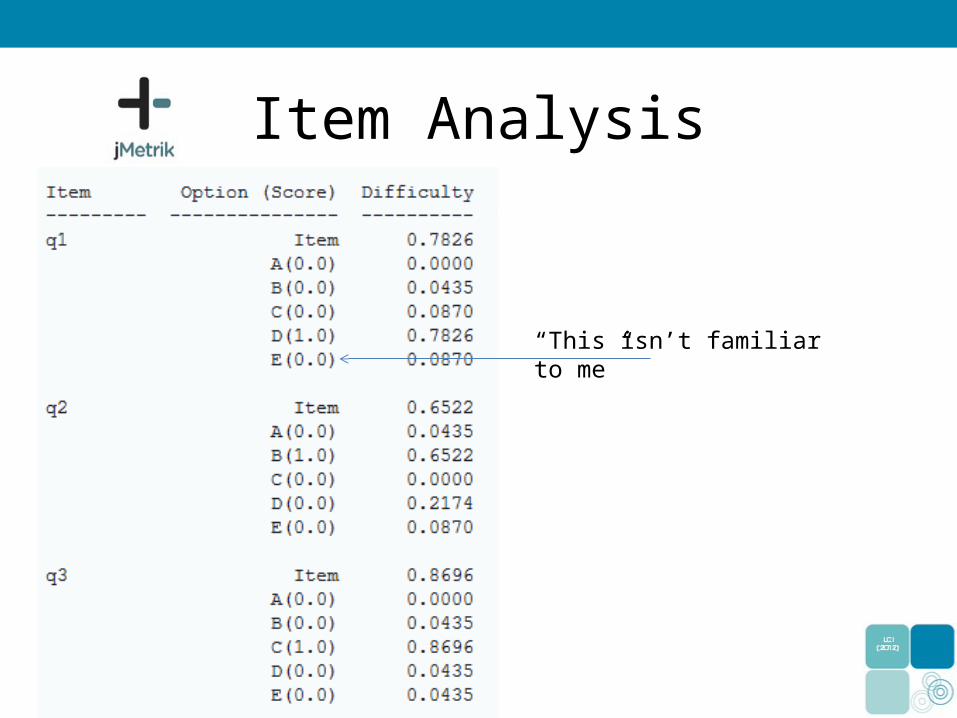
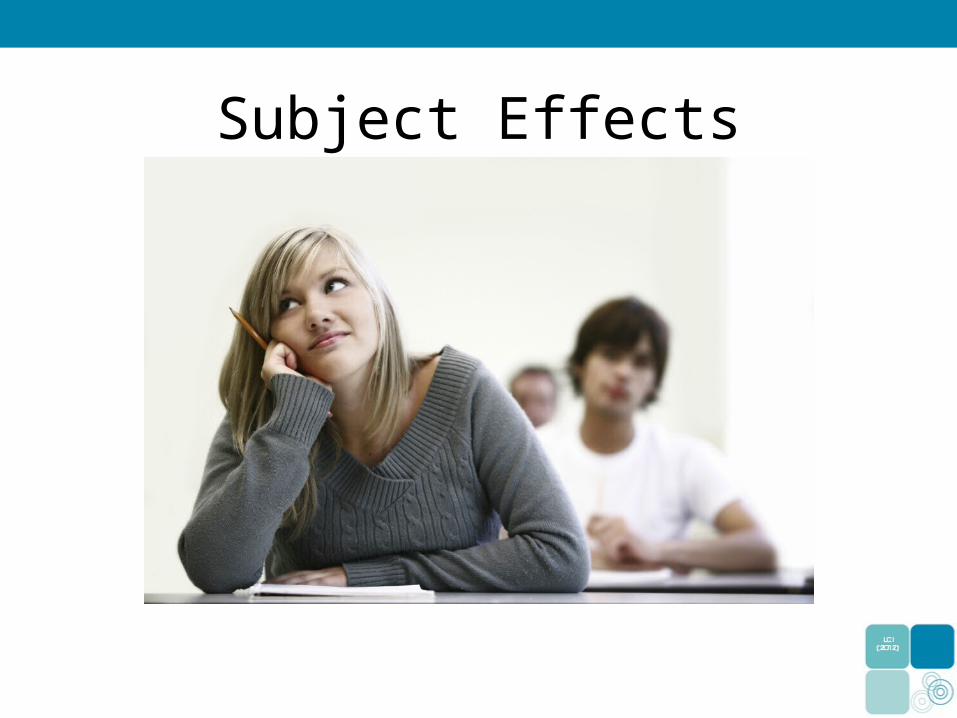
Item Analysis
“This isn’t familiar to me”

1 2 3 4 5 6 7 8 9 10 11 12 13 14 15 16 17 18 19 20 21 22 23 24 25 26 27 28 29 300%
10%
20%
30%
40%
50%
60%
70%
80%
90%
Percent of Students Selecting Choice “E”
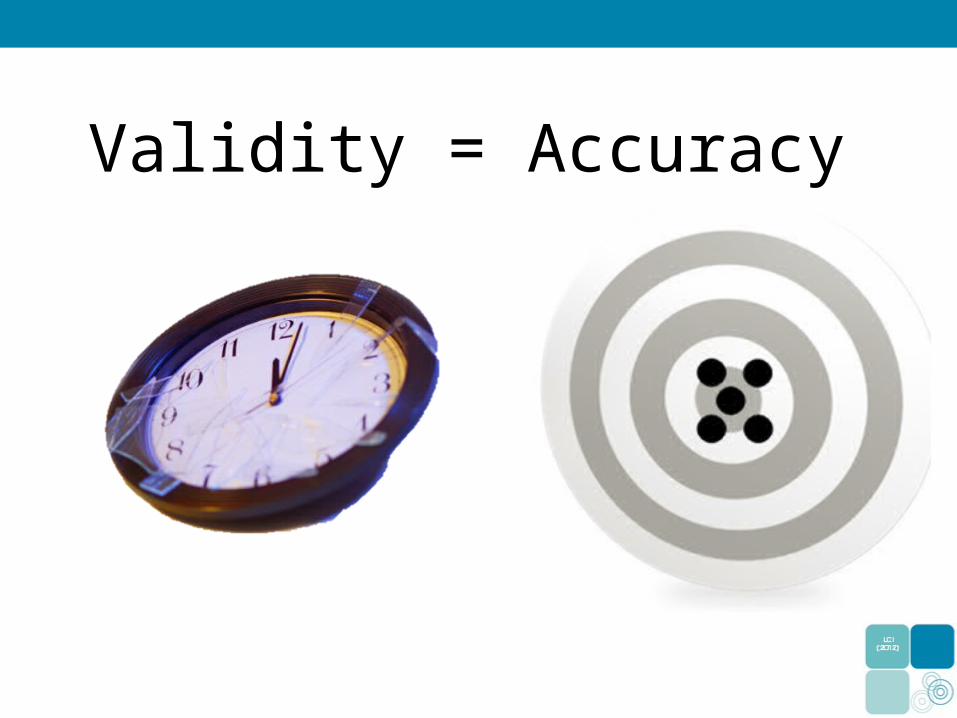
Validity = Accuracy

How do we ensure alignment and validity in assessment?Degrees of Alignment
Strong The assessment/learning activity clearly aligns to the target; the assessment/activity and the target are almost one in the same. The language of the standard is explicit. You could confidently infer or conclude the level of student learning/understanding for the target.
Moderate The assessment/learning activity addresses the target; the target is included in the learning experience but is not the primary focus. The language of the standard is only partially used. You would need an additional data point to confidently infer the level of student learning/understanding for the target.
Weak The assessment/activity misses the target; it might prepare kids for the target, but doesn’t address it. You could not assess level of student learning/understanding for the target.

If you want to assess your students’ ability to perform, design, apply, interpret. . .
. . . then assess them with a performance or product task that requires them to perform, design, apply, or interpret.

How many?3-5
3 – 5 standards in a PBA (reflected in rows in the rubric)
3 – 5 items per standard on a traditional test


Minimum

Basic

Articulated
New York State Learning Standard: Read to collect and interpret data, facts, and ideas from unfamiliar texts (4 items, 15% of test)
23
The student chose a response that completes the sentence
with an inference that is related to another element in the
passage but not to the specified detail
The student chose a response that completes the sentence
with an inference that is related to the main idea of the
passage but not to the specified detail
Correct Response: The student chose the correct response,
demonstrating that the student can infer a detail from passage
text
The student chose a response that completes the sentence
with an inference that may be based on prior knowledge and not supported by the passage
24
The student chose a response that describes a point of view
that is mentioned in the passage, but that is not the
author or narrator's point of view
The student chose a response that describes a point of view
that is related to passage content, but that is not stated
or implied in the passage
Correct Response: The student chose the correct response,
demonstrating that the student can infer an author or
narrator's point of view
The student chose a response that describes a point of view that is contradicted by details
in the passage


One assessment does not an assessment
system make.

Fairness and Bias
Fair tests are accessible and enable all students to show what they know. Bias emerges when features of the assessment itself impede students’ ability to demonstrate their knowledge or skills.

In 1876, General George Custer and his troops fought Lakota and Cheyenne warriors at the Battle of the Little Big Horn. In there had been a scoreboard on hand, at the end of that battle which of the following score-board representatives would have been most accurate?
A. Soldiers > IndiansB. Soldiers = IndiansC. Soldiers < IndiansD. All of the above scoreboards are equally accurate


What are other attributes of quality assessments?

Standard Error of Measurement
• An estimate of the consistency of a student’s score if the student had retaken the test innumerable times

How is the SEM calculated?: The SEM is calculated by dividing the SD by the square root of N. This relationship is worth remembering, as it can help you interpret published data.
Calculating the SEM with ExcelExcel does not have a function to compute the standard error of a mean. It is easy enough to compute the SEM from the SD, using this formula.=STDEV()/SQRT(COUNT())
For example, if you want to compute the SEM of values in cells B1 through B10, use this formula:=STDEV(B1:B10)/SQRT(COUNT(B1:B10))
The COUNT() function counts the number of numbers in the range. If you are not worried about missing values, you can just enter N directly. In that case, the formula becomes:=STDEV(B1:B10)/SQRT(10)


WHEN DESIGNING A PRE/POST PERFORMANCE TASK
• the standards and thinking demands must stay the same.
• the modality that students express their thinking through must also stay the same.
• the content of the baseline and post must be different. • the rubrics for the pre/post will be the same in terms of thinking
and modality, but the content dimension will be different.