SelectiveNeuronalEntrainmenttotheBeatandMeter Embedde · PDF...
11
Behavioral/Systems/Cognitive Selective Neuronal Entrainment to the Beat and Meter Embedded in a Musical Rhythm Sylvie Nozaradan, 1,2 Isabelle Peretz, 2 and Andre ´ Mouraux 1 1 Institute of Neuroscience, Universite ´ Catholique de Louvain (UCL), B-1200 Bruxelles, Belgium, and 2 International Laboratory for Brain, Music, and Sound Research (BRAMS), Universite ´ de Montre ´al, Montre ´al, Quebec H3C 3J7, Canada Fundamental to the experience of music, beat and meter perception refers to the perception of periodicities while listening to music occurring within the frequency range of musical tempo. Here, we explored the spontaneous building of beat and meter hypothesized to emerge from the selective entrainment of neuronal populations at beat and meter frequencies. The electroencephalogram (EEG) was recorded while human participants listened to rhythms consisting of short sounds alternating with silences to induce a spontaneous perception of beat and meter. We found that the rhythmic stimuli elicited multiple steady state-evoked potentials (SS-EPs) observed in the EEG spectrum at frequencies corresponding to the rhythmic pattern envelope. Most importantly, the amplitude of the SS-EPs obtained at beat and meter frequencies were selectively enhanced even though the acoustic energy was not necessarily predominant at these frequencies. Furthermore, accelerating the tempo of the rhythmic stimuli so as to move away from the range of frequencies at which beats are usually perceived impaired the selective enhancement of SS-EPs at these frequencies. The observation that beat- and meter- related SS-EPs are selectively enhanced at frequencies compatible with beat and meter perception indicates that these responses do not merely reflect the physical structure of the sound envelope but, instead, reflect the spontaneous emergence of an internal representation of beat, possibly through a mechanism of selective neuronal entrainment within a resonance frequency range. Taken together, these results suggest that musical rhythms constitute a unique context to gain insight on general mechanisms of entrainment, from the neuronal level to individual level. Introduction Feeling the beat is fundamental to the experience of music (London, 2004). It refers to the spontaneous ability to perceive periodicities (as expressed for instance through periodic head nodding or foot tapping in musical stimuli that are not strictly periodic in reality) (London, 2004; Phillips-Silver et al., 2010). This phenomenon is well illustrated by syncopated rhythms, that is, rhythmic patterns in which the perceived beat does not systematically coincide with an actual sound (Fitch and Rosenfeld, 2007; Velasco and Large, 2011). Moreover, beats are usually perceived within meters (e.g., a waltz, which is a three-beat meter) corresponding to (sub)harmonics — i.e., integer ratios— of beat frequency. These multiple periodic levels are nested hierarchically. Among these, the beat may be considered as the most prominent periodicity (London, 2004). Finally, perception and movement on beat and meter has been shown to occur within a specific range of tempo corresponding to frequencies around 2 Hz (van Noorden and Moelants, 1999; Lon- don, 2004; Repp, 2005, 2006) and assimilated to a resonance frequency range within which internal representations of beat and meter would be optimally induced by external inputs (van Noorden and Moelants, 1999; Large, 2008). How the brain spontaneously builds internal beat representa- tions from music remains unknown. Recently, we showed that listening to simple periodic sounds elicits periodic neuronal ac- tivities frequency tuned to the periodicity of the sound envelope. This neuronal entrainment was captured in the human electro- encephalogram (EEG) as a beat-related, steady state-evoked po- tential (SS-EP) appearing at the exact frequency of the beat (Nozaradan et al., 2011). Here, using this novel approach, we explored the EEG ac- tivity induced by listening to complex rhythmic patterns that can be assimilated to syncopated rhythms and are commonly found in Western music. The patterns consisted in sequences of events, that is, sounds alternating with silences (Fig. 1) such as to induce a spontaneous perception of a beat and meter based on the preferential grouping of four events (Essens and Povel, 1985). This was confirmed by a task performed at the end of the EEG recording in which participants were asked to tap along with the beat spontaneously perceived in each pat- tern. Therefore, building on prior assumptions (Essens and Povel, 1985), which were confirmed by the tapping task, the multiple frequencies constituting the envelope spectrum of the five sound patterns were categorized as either (1) related to the beat and metric levels (integer ratio subdivisions and Received July 4, 2012; revised Sept. 14, 2012; accepted Oct. 8, 2012. Author contributions: S.N., I.P., and A.M. designed research; S.N. performed research; S.N. and A.M. analyzed data; S.N., I.P., and A.M. wrote the paper. S.N. is supported by the Fund for Scientific Research of the French-Speaking Community of Belgium (F.R.S.- FNRS). A.M. has received the support from the French-speaking community of Belgium (F.R.S.-FNRS) FRSM 3.4558.12 Convention Grant. I.P. is supported by the Natural Sciences and Engineering Research Council of Canada, the Canadian Institutes of Health Research, and a Canada Research Chair. Correspondence should be addressed to Dr. Andre ´ Mouraux, Institute of Neurosciences, Universite ´ Catholique de Louvain, 53 Avenue Mounier—UCL 53.75, B-1200 Bruxelles, Belgium. E-mail: [email protected]. DOI:10.1523/JNEUROSCI.3203-12.2012 Copyright © 2012 the authors 0270-6474/12/3217572-10$15.00/0 17572 • The Journal of Neuroscience, December 5, 2012 • 32(49):17572–17581
Transcript of SelectiveNeuronalEntrainmenttotheBeatandMeter Embedde · PDF...
Behavioral/Systems/Cognitive
Selective Neuronal Entrainment to the Beat and MeterEmbedded in a Musical Rhythm
Sylvie Nozaradan,1,2 Isabelle Peretz,2 and Andre Mouraux1
1Institute of Neuroscience, Universite Catholique de Louvain (UCL), B-1200 Bruxelles, Belgium, and 2International Laboratory for Brain, Music, and SoundResearch (BRAMS), Universite de Montreal, Montreal, Quebec H3C 3J7, Canada
Fundamental to the experience of music, beat and meter perception refers to the perception of periodicities while listening to musicoccurring within the frequency range of musical tempo. Here, we explored the spontaneous building of beat and meter hypothesized toemerge from the selective entrainment of neuronal populations at beat and meter frequencies. The electroencephalogram (EEG) wasrecorded while human participants listened to rhythms consisting of short sounds alternating with silences to induce a spontaneousperception of beat and meter. We found that the rhythmic stimuli elicited multiple steady state-evoked potentials (SS-EPs) observed inthe EEG spectrum at frequencies corresponding to the rhythmic pattern envelope. Most importantly, the amplitude of the SS-EPsobtained at beat and meter frequencies were selectively enhanced even though the acoustic energy was not necessarily predominant atthese frequencies. Furthermore, accelerating the tempo of the rhythmic stimuli so as to move away from the range of frequencies at whichbeats are usually perceived impaired the selective enhancement of SS-EPs at these frequencies. The observation that beat- and meter-related SS-EPs are selectively enhanced at frequencies compatible with beat and meter perception indicates that these responses do notmerely reflect the physical structure of the sound envelope but, instead, reflect the spontaneous emergence of an internal representationof beat, possibly through a mechanism of selective neuronal entrainment within a resonance frequency range. Taken together, theseresults suggest that musical rhythms constitute a unique context to gain insight on general mechanisms of entrainment, from theneuronal level to individual level.
IntroductionFeeling the beat is fundamental to the experience of music(London, 2004). It refers to the spontaneous ability to perceiveperiodicities (as expressed for instance through periodic headnodding or foot tapping in musical stimuli that are not strictlyperiodic in reality) (London, 2004; Phillips-Silver et al., 2010).This phenomenon is well illustrated by syncopated rhythms,that is, rhythmic patterns in which the perceived beat does notsystematically coincide with an actual sound (Fitch andRosenfeld, 2007; Velasco and Large, 2011). Moreover, beatsare usually perceived within meters (e.g., a waltz, which is athree-beat meter) corresponding to (sub)harmonics — i.e.,integer ratios— of beat frequency. These multiple periodiclevels are nested hierarchically. Among these, the beat may beconsidered as the most prominent periodicity (London, 2004).Finally, perception and movement on beat and meter has beenshown to occur within a specific range of tempo corresponding to
frequencies around 2 Hz (van Noorden and Moelants, 1999; Lon-don, 2004; Repp, 2005, 2006) and assimilated to a resonancefrequency range within which internal representations of beatand meter would be optimally induced by external inputs (vanNoorden and Moelants, 1999; Large, 2008).
How the brain spontaneously builds internal beat representa-tions from music remains unknown. Recently, we showed thatlistening to simple periodic sounds elicits periodic neuronal ac-tivities frequency tuned to the periodicity of the sound envelope.This neuronal entrainment was captured in the human electro-encephalogram (EEG) as a beat-related, steady state-evoked po-tential (SS-EP) appearing at the exact frequency of the beat(Nozaradan et al., 2011).
Here, using this novel approach, we explored the EEG ac-tivity induced by listening to complex rhythmic patterns thatcan be assimilated to syncopated rhythms and are commonlyfound in Western music. The patterns consisted in sequencesof events, that is, sounds alternating with silences (Fig. 1) suchas to induce a spontaneous perception of a beat and meterbased on the preferential grouping of four events (Essens andPovel, 1985). This was confirmed by a task performed at theend of the EEG recording in which participants were asked totap along with the beat spontaneously perceived in each pat-tern. Therefore, building on prior assumptions (Essens andPovel, 1985), which were confirmed by the tapping task, themultiple frequencies constituting the envelope spectrum ofthe five sound patterns were categorized as either (1) related tothe beat and metric levels (integer ratio subdivisions and
Received July 4, 2012; revised Sept. 14, 2012; accepted Oct. 8, 2012.Author contributions: S.N., I.P., and A.M. designed research; S.N. performed research; S.N. and A.M. analyzed
data; S.N., I.P., and A.M. wrote the paper.S.N. is supported by the Fund for Scientific Research of the French-Speaking Community of Belgium (F.R.S.-
FNRS). A.M. has received the support from the French-speaking community of Belgium (F.R.S.-FNRS) FRSM3.4558.12 Convention Grant. I.P. is supported by the Natural Sciences and Engineering Research Council of Canada,the Canadian Institutes of Health Research, and a Canada Research Chair.
Correspondence should be addressed to Dr. Andre Mouraux, Institute of Neurosciences, Universite Catholique deLouvain, 53 Avenue Mounier—UCL 53.75, B-1200 Bruxelles, Belgium. E-mail: [email protected].
DOI:10.1523/JNEUROSCI.3203-12.2012Copyright © 2012 the authors 0270-6474/12/3217572-10$15.00/0
17572 • The Journal of Neuroscience, December 5, 2012 • 32(49):17572–17581
groupings of the beat period) or (2) unrelated to beat andmeter frequencies.
We expected that these patterns would elicit multiple SS-EPsat frequencies corresponding to the frequencies of the sound pat-tern envelope in the EEG spectrum. Most importantly, we aimedto capture the spontaneous building of internal beat and meterrepresentations hypothesized to emerge from a nonlinear trans-formation of the acoustic inputs. Specifically, we examinedwhether the SS-EPs elicited at frequencies corresponding to theexpected perception of beat and meter were selectively enhanced,as such an observation would constitute evidence for a selectiveneuronal entrainment underlying beat and meter neuronalrepresentations.
Materials and MethodsParticipantsNine healthy volunteers (four females, all right-handed, mean age 29 � 4years) took part in the study after providing written informed consent.They all had musical experience in Western music, either in performance(three participants with 15–25 years of practice) or as amateur listenersor dancers. None had prior experience with the tapping task used in thepresent study. They had no history of hearing, neurological, or psychiat-ric disorder, and were not taking any drug at the time of the experiment.The study was approved by the local Ethics Committee.
Experiment 1: SS-EPs elicited by five different rhythmic patternsAuditory stimuli. The stimulus consisted of five distinct rhythmic pat-terns lasting either 2.4 s ( patterns 1, 3, and 4) or 3.2 s ( patterns 2 and 5)and looped continuously during 33 s. The structure of the patterns wasbased on the alternation of events, i.e., sounds and silence intervals of 200ms duration. The sounds consisted of 990 Hz pure tones lasting 200 ms(10 ms rise and fall time). The patterns, inspired by the work of Essensand Povel (1985), were designed to induce the perception of a beat basedon the preferential grouping of four events (i.e., a period of 0.8 s, corre-sponding to a 1.25 Hz beat) and at related metric levels. The relatedmetric levels were constituted (1) by the subdivision of the beat periodsby 2 (2.5 Hz) and 4 (5 Hz, thus corresponding to the unitary event periodat 0.2 s) and (2) by the integer ratio grouping of beat period by 2 (0.625Hz) and 4 (0.312 Hz) in patterns 2 and 5 (because these patterns con-tained 16 events, thus allowing groupings by 2 � 4 and 4 � 4 events,respectively) and by 3 (0.416 Hz) in patterns 1, 3, and 4 (because thesepatterns contained 12 events, thus allowing groupings by 3 � 4 events)(Fig. 2).
The auditory stimuli were created in Audacity 1.2.6 (http://audacity.sourceforge.net/) and presented binaurally through earphones at acomfortable hearing level (Beyerdynamic DT 990 PRO) using thePsychtoolbox extensions (Brainard, 1997) running under Matlab 6.5(MathWorks).
Experimental conditions. The five rhythmic patterns were presentedin separate blocks. In each block, the 33 s auditory pattern wasrepeated 11 times. The onset of each pattern was self-paced and pre-ceded by a 3 s foreperiod. The order of the blocks was counter-balanced across participants.
During the first 10 trials of each block, participants were asked to listencarefully to the stimulus to detect the occurrence of a very short acceler-ation (duration of two successive events reduced by 10 ms, i.e., 190 ms) ordeceleration (duration of two successive events increased by 10 ms, i.e.,210 ms) of tempo inserted at a random position in two of the trialsinterspersed within the block. The participants were instructed to reportthe detection of the change in tempo at the end of each trial. This taskensured that participants focused their attention on the temporal aspectsof the presented sound. The two trials containing a short tempo changewere excluded from further analyses.
During the 11th trial of each block, participants were asked to performa tapping task to assess their perception of a periodic beat in each of thefive patterns. They were instructed to tap to the regular periodic strongbeat of the patterns, similarly as what they would do in a concert whenspontaneously entrained to clap their hands on the beat of music. More-
over, participants were asked to start tapping as soon as they heard thefirst beat of the trial and to maintain their movement accurately paced onthe beat that they spontaneously perceived from the patterns. The tap-ping was performed using their right hand, with small up and downmovements of the hand starting from the wrist joint, maintaining theforearm and elbow fixed on an armrest cushion. When performing thetapping movement, the fingers of the tapping hand came transiently incontact with the armrest cushion. All participants naturally synchronizedtheir movement such that the occurrence of this contact coincided withthe occurrence of the beat. The experimenter remained in the recordingroom at all times to monitor compliance to these instructions.
Hand movement recordings. Movements of the hand were measuredusing a three-axis accelerometer attached to the hand dorsum(MMA7341L, Pololu Robotics and Electronics). The signals generated bythe accelerometer were digitized using three additional bipolar channelsof the EEG system. Only the vertical axis of the accelerometer signal wasanalyzed, as it sampled the greatest part of the accelerations related to thetapping movement.
EEG recording. Participants were comfortably seated in a chair with thehead resting on a support. They were instructed to relax, avoid any un-necessary head or body movement, and keep their eyes fixated on a pointdisplayed on a computer screen in front of them. The electroencephalo-gram was recorded using 64 Ag-AgCl electrodes placed on the scalpaccording to the International 10/10 system (Waveguard64 cap, Cepha-lon). Vertical and horizontal eye movements were monitored using fouradditional electrodes placed on the outer canthus of each eye and on theinferior and superior areas of the left orbit. Electrode impedances werekept below 10 k�. The signals were recorded using an average referenceamplified and low-pass filtered at 500 Hz and digitized using a samplingrate of 1000 Hz (64 channel high-speed amplifier, Advanced NeuroTechnology).
Hand movement analysis. The accelerometer signals recorded whenparticipants performed the hand-tapping movements in the last trial ofeach block were analyzed by extracting, for each rhythmic pattern, thelatencies at which the fingers hit the armrest cushion corresponding tothe time points of maximum deceleration (Fig. 1). Tapping period esti-mates were then obtained by subtracting, from each tapping latency, thelatency of the preceding tapping (Fig. 1).
Sound pattern analysis. To determine the frequencies at which steadystate-evoked potentials were expected to be elicited in the recorded EEGsignals, the temporal envelope of the 33 s sound patterns was extractedusing a Hilbert function that yielded a time-varying estimate of the in-stantaneous amplitude of the sound envelope, as implemented in theMIRToolbox (Lartillot and Toiviainen, 2007). The obtained waveformswere then transformed in the frequency domain using a discrete Fouriertransform (Frigo and Johnson, 1998) yielding a frequency spectrum ofenvelope magnitude (Bach and Meigen, 1999). The frequencies of inter-est were determined as the set of frequencies � 5 Hz, i.e., the frequencycorresponding to the 200 ms period of the unitary event of the patterns.As shown in Figure 2, the envelopes of patterns 1, 3, and 4 consisted of 12distinct frequencies ranging from 0.416 Hz to 5 Hz with an interval of0.416 Hz, whereas the envelopes of patterns 2 and 5 consisted of 16distinct frequencies ranging from 0.312 Hz to 5 Hz with an interval of0.312 Hz.
Within each pattern, z-score values were then computed across themagnitude obtained at each of these frequencies in the spectra of thepatterns envelope as follows: z � (x � �)/�, where � and � correspondedto the mean and standard deviation of the magnitudes obtained acrossthe different peaks. This procedure allowed assessing the magnitude ofeach frequency relative to the others and, thereby, determining whichfrequencies stood out relative to the entire set of frequencies.
EEG analysis in the frequency domain. The continuous EEG recordingswere filtered using a 0.1-Hz high-pass Butterworth zero-phase filter toremove very slow drifts in the recorded signals. Epochs lasting 32 s wereobtained by segmenting the recordings from �1 to �33 s relative to theonset of the auditory stimulus. The EEG recorded during the first secondof each trial was removed: (1) to discard the transient auditory evokedpotentials related to the onset of the stimulus (Saupe et al., 2009; Nozara-dan et al., 2011, 2012); (2) because SS-EPs require several cycles of stim-
Nozaradan et al. • Selective Neuronal Entrainment to Beat and Meter J. Neurosci., December 5, 2012 • 32(49):17572–17581 • 17573

ulation to be steadily entrained (Regan, 1989); and (3) because severalrepetitions of the beat are required to elicit a steady perception of beat(Repp, 2005). These EEG processing steps were carried out using Ana-lyzer 1.05 (Brain Products).
Artifacts produced by eye blinks or eye movements were removedfrom the EEG signal using a validated method based on an independentcomponent analysis (Jung et al., 2000) using the runica algorithm (Belland Sejnowski, 1995; Makeig, 2002). For each subject and condition,EEG epochs were averaged across trials. The time– domain averagingprocedure was used to enhance the signal-to-noise ratio of EEG activitiestime locked to the patterns. The obtained average waveforms were thentransformed in the frequency domain using a discrete Fourier transform(Frigo and Johnson, 1998) yielding a frequency spectrum of signal am-plitude (�V) ranging from 0 to 500 Hz with a frequency resolution of0.031 Hz (Bach and Meigen, 1999). This procedure allowed assessing theneuronal entrainment to beat and meter, i.e., the appearance of fre-quency components in the EEG elicited by the frequency components ofthe sound patterns and induced beat percept (Pikovsky et al., 2001).Importantly, the deliberate choice of computing Fourier transforms oflong-lasting epochs was justified in the present experiment by the factthat: (1) beat and meter perception is assumed to be stationary enoughalong the trials, as suggested by the results of the tapping task; and (2) itimproves the resolution of the obtained EEG frequency spectrum. In-deed, this allows concentrating the magnitude of the SS-EP into a verynarrow band necessary to enhance their signal-to-noise ratio as well as todisentangle between nearby SS-EP frequencies in the EEG spectrum(Regan, 1989). These EEG processing steps were carried out using Lets-wave4 (Mouraux and Iannetti, 2008), Matlab (The MathWorks), andEEGLAB (http://sccn.ucsd.edu).
Within the obtained frequency spectra, signal amplitude may be ex-pected to correspond to the sum of (1) stimulus-induced SS-EPs and (2)unrelated residual background noise due, for example, to spontaneousEEG activity, muscle activity, or eye movements. Therefore, to obtainvalid estimates of the SS-EPs, the contribution of this noise was removedby subtracting, at each bin of the frequency spectra, the average ampli-tude measured at neighboring frequency bins (two frequency bins rang-ing from �0.15 to �0.09 Hz and from �0.09 to �0.15 Hz relative to eachfrequency bin). The validity of this subtraction procedure relies on theassumption that, in the absence of an SS-EP, the signal amplitude at agiven frequency bin should be similar to the signal amplitude of the meanof the surrounding frequency bins (Mouraux et al., 2011; Nozaradan etal., 2011, 2012. This subtraction procedure is important: (1) to assess thescalp topographies of the elicited SS-EPs, as the magnitude of the back-ground noise is not equally distributed across scalp channels; and (2) tocompare the amplitude of SS-EPs elicited at distinct frequencies, as themagnitude of the background noise is not equally distributed across thefrequency spectrum.
The magnitude of the SS-EPs was then estimated by taking the maxi-mum noise-subtracted amplitude measured in a range of three frequencybins centered over the expected SS-EP frequency based on the spectrumof the sound envelope. This range of frequencies allowed accounting forpossible spectral leakage due to the fact that the discrete Fourier trans-form did not estimate signal amplitude at the exact frequency of any ofthe expected SS-EPs (Nozaradan et al., 2011, 2012).
To exclude any electrode selection bias, SS-EP magnitudes were averagedacross all scalp electrodes for each rhythmic pattern and participant (Fig. 2).A one-sample t test was then used to determine whether the average SS-EPamplitudes were significantly different from zero (Fig. 2). Indeed, in theabsence of an SS-EP, the average of the noise-subtracted signal amplitudemay be expected to tend toward zero. Finally, for each frequency, topograph-ical maps were computed by spherical interpolation (Fig. 3).
Like the sound pattern analysis, the amplitude of the SS-EPs obtainedat the expected frequencies were expressed as z scores, using the meanand standard deviation of the magnitudes obtained across the differentpeaks to assess how each of the different SS-EPs stood out relative to theentire set of SS-EPs (Figs. 3 and 4).
To assess specifically whether SS-EPs elicited at frequencies related tobeat and meter perception (0.416, 1.25, 2.5, and 5 Hz in patterns 1, 3 and4; 0.312, 0.625, 1.25, 2.5, and 5 Hz in patterns 2 and 5) were selectivelyenhanced, the average of the z-score values representing SS-EP ampli-tude at beat- and meter-related frequencies was compared to the averageof the z-score values representing these same frequencies in the soundpattern envelope using a one-sample t test (Fig. 3). A similar procedurewas used to compare the magnitude of SS-EPs and the magnitude of thesound envelope at frequencies unrelated to the beat and meter. Signifi-cance level was set at p � 0.05.
Finally, to compare the magnitude of each of the different SS-EPsobtained in each of the five sound patterns relative to the magnitude ofthe sound envelope, a one-sample t test was used to compare the stan-dardized SS-EP amplitudes to the standardized sound envelope magni-tudes at each frequency constituting the envelope spectrum of therhythmic patterns (Fig. 4).
EEG analysis in the time domain. The time course of the EEG signalsrecorded during presentation of the sound patterns of Experiment 1 wasexamined to give a better sense of the stimulus–response relationship.These signals were obtained after bandpass filtering the signals between0.1 and 30 Hz, segmenting the EEG epochs according to the length ofeach pattern (2.4 s length in patterns 1, 3, and 4; 3.2 s length in patterns 2and 5), and averaging these epochs (Fig. 5).
Experiment 2: SS-EPs elicited by pattern 1 presented at uppermusical tempiAll participants took part in a second experiment performed on a differ-ent day. In this experiment, participants listened to pattern 1 of the firstexperiment presented at either two or four times the original tempo. The
Figure 1. In the last trial of each block, participants were asked to perform a rhythmic hand-tapping movement synchronized to the perceived beat. Top row, Tapping periods produced by eachparticipant while listening to each of the five rhythmic patterns. Each dot corresponds to an individual tapping period. The median tapping period is represented by the horizontal black line. Bottomrow, Tapping latencies along the entire trial for each participant and each sound pattern. Note that most participants tapped at a frequency corresponding to a grouping by four events (1.25 Hz)except in pattern 5, where tapping was much less consistent.
17574 • J. Neurosci., December 5, 2012 • 32(49):17572–17581 Nozaradan et al. • Selective Neuronal Entrainment to Beat and Meter

two accelerated sound patterns were presentedin separate blocks. The order of the blocks wascounterbalanced across participants. The fastertempi were obtained by reducing the durationof the pattern events from 200 to 100 ms(tempo � 2) and 50 ms (tempo � 4). The taskwas similar to the task performed in Experi-ment 1. The sound pattern, EEG, and move-ment signals were analyzed using the sameprocedures (Figs. 6 – 8). Pattern 1 was chosenfor this second experiment because it appearedto elicit the most consistent beat percept, ascompared to the other patterns (Fig. 1). Im-portantly, increasing the tempo did not sub-stantially distort the envelope spectra ofpattern 1 (Fig. 7). Indeed, it kept relatively in-tact the balance of frequencies relative to eachother in the envelope spectrum. For example,in both the original and the accelerated ver-sions of pattern 1, the most salient frequencyremained the third frequency present in the en-velope spectrum. These accelerated patternscould thus be considered as suitable to examinethe effect of tempo on the magnitude of theelicited SS-EPs.
Experiment 3: SS-EPs elicited by pattern 2presented at upper musical tempiSix participants (three of which took part inExperiments 1 and 2) took part in a third ex-periment performed on a different day. In thisexperiment, participants listened to pattern 2of the first experiment presented at the originaltempo, and at two and three times the original
Figure 2. Top row, Structure of the five rhythmic patterns that consisted of a sequence of 200 ms pure tones (represented by a cross) and 200 ms silences (represented by a dot). Patterns 1, 3, and4 contained a succession of 12 events, whereas patterns 2 and 5 contained a succession of 16 events. Second row, Frequency spectrum of the pattern sound envelope. The thick vertical arrow marksthe expected beat frequency. The thin vertical arrows mark the related meter frequencies. Note that in patterns 3 and 5 the acoustic energy did not predominate at the frequency of the expected beatfrequency. Third row, Frequency spectrum of the EEG recorded while listening to each of the five sound patterns (noise-subtracted amplitude averaged across all scalp channels in microvolts). Fourthrow, Mean magnitude (�SEM) of the SS-EPs elicited by each of the five sound patterns (noise-subtracted amplitude averaged across all scalp channels in microvolts). SS-EP amplitudes significantlydifferent from zero are marked by *p � 0.05, **p � 0.01, or ***p � 0.001.
Figure 3. A, The red dots represent the z-score values of the magnitude of the SS-EPs elicited at frequencies related to the beatand meter (left) and frequencies unrelated to the beat and meter (right) averaged across all five sound patterns in each participant.Note that, as compared to the average z score of the sound pattern envelope at corresponding frequencies (blue dots), themagnitude of the beat- and meter-related SS-EPs was markedly enhanced, whereas the magnitude of SS-EPs unrelated to the beatand meter was markedly dampened. B, Average topographical map of the SS-EPs elicited at frequencies related to the beat andmeter (left) and at frequencies unrelated to the beat and meter (right), averaged across all patterns and participants (noise-subtracted amplitude in microvolts).
Nozaradan et al. • Selective Neuronal Entrainment to Beat and Meter J. Neurosci., December 5, 2012 • 32(49):17572–17581 • 17575

tempo. The faster tempi were obtained by reducing the duration of thepattern events from 200 to 100 ms (tempo � 2) and 66 ms (tempo � 3).The task was similar to the task performed in Experiment 1. The threetempi were presented in separate blocks. The order of the blocks wascounterbalanced across participants. The sound pattern, EEG and move-ment signals were analyzed using the same procedures as described inExperiment 1 (Figs. 6 – 8). As in Experiment 2, the spectrum of the soundenvelope of the accelerated patterns was not substantially distorted com-pared to that of the original pattern (Fig. 7). Pattern 2 was chosen herebecause in the first experiment an apparent discrepancy was observedbetween the frequency of the SS-EP selectively enhanced in the EEGspectrum (0.625 Hz, corresponding to the subharmonic of beat fre-quency and thus to a grouping by eight events) and the frequency of thetapping on this pattern (1.25 Hz, corresponding to a grouping by fourevents). Therefore, Experiment 3 aimed at clarifying the adequacy be-tween the frequency selectively enhanced in the EEG spectrum and thefrequency selected in the tapping task by using different tempi.
ResultsExperiment 1Hand-tapping movementAs shown in Figure 1, the participants tapped periodically at afrequency corresponding, in most cases, to a grouping by fourevents (1.25 Hz) and, in some cases, at related metric levels (cor-responding to a grouping by two or eight events, thus at 2.5 or0.625 Hz, respectively). Importantly, in patterns 3–5,the acousticenergy was not predominant at the frequency of the perceivedbeat selected on average for the tapping (Fig. 2) but at distinct,non-meter-related frequencies, thus confirming that the fre-quency at which a beat is perceived does not necessarily corre-spond to the frequency showing maximum acoustic energy in thephysical structure of the pattern envelope.
As compared to the tapping performed on the other soundpatterns, the distribution of tapping periods in pattern 5 showeda much greater variability, both within and across participants,indicating that this sound pattern did not elicit a stable and un-equivocal beat percept (Fig. 1).
Detection taskDuring the recording, participants performed the detection taskwith a median score of 8.5/10 (interquartile range, 8 –10) and noapparent difference in difficulty reported between the patterns.
Steady state-evoked potentialsFor each of the five sound patterns, most of the frequencies con-stituting their envelope elicited clear SS-EPs in the EEG frequencyspectrum (Fig. 2). SS-EP amplitudes were significantly differentfrom zero at most of the frequencies corresponding to the per-
ceived beat and related metric levels (Fig. 2). The scalp topogra-phy of the elicited SS-EPs was generally maximal overfrontocentral regions and symmetrically distributed over the twohemispheres (Fig. 3). Moreover, as illustrated in Figure 3, thescalp topography of the SS-EPs elicited at beat- and meter-relatedfrequencies did not substantially differ from the SS-EPs elicited atunrelated frequencies, thus suggesting that they originate fromsimilar neuronal populations or that the EEG did not allow dis-entangling the different spatial location of the underlying neuralactivity in our experiment.
At the frequencies expected to relate to beat and meter, thestandardized estimates of the SS-EP amplitudes, averaged acrossthe five sound patterns, were significantly enhanced as comparedto the standardized estimates of the sound envelope at these fre-quencies (t � 15.85, df � 8, p � 0.0001; t � 16.62, df � 8, p �0.0001; Fig. 3).
When examining the sound patterns separately, the SS-EPelicited at the expected beat frequency (1.25 Hz) was significantlyenhanced in patterns 1 (t � 3.15, p � 0.01, df � 8), 3 (t � 2.55,p � 0.03, df � 8), and 4 (t � 3.31, p � 0.01, df � 8), but not inpatterns 2 (reduced; t � 4.04, p � 0.003, df � 8) and 5 (t � 0.46,p � 0.65, df � 8) (Fig. 4). In pattern 2, the SS-EP correspondingto the beat frequency assessed in the hand-tapping condition wasnot significantly enhanced. However, the SS-EP correspondingto its subharmonic (grouping by eight events instead of fourevents) was enhanced (t � 2.48, p � 0.03, df � 8; Fig. 4). Inpattern 5, except at the frequency of the unitary event (5 Hz),none of the SS-EPs elicited at beat- and meter-related frequenciesappeared to be enhanced as compared to the sound envelope(Fig. 4). One possible explanation for the enhancement of theEEG signal observed at 5 Hz could be that although none of thefrequencies within this sound pattern was able to induce a stableperception of beat, the frequency corresponding to the rate atwhich the individual sounds were presented constituted a rela-tively salient feature in the pattern. The fact that this frequencydid not elicit a perception of beat could be related to the fact thatit lay outside the ecological range for beat and meter perception(Repp, 2006).
Time domain analysis of the EEG signalsAs displayed in Figure 5, some periodicity in the average signalscould be observed in the time domain, mostly in pattern 1, inwhich the 1.25 Hz frequency was highly enhanced compared toother frequencies in the EEG spectrum. In the other patterns,these periodicities were more difficult to assess in the time do-
Figure 4. The black bars represent the group level mean z scores of the magnitude of the SS-EPs elicited between 0 and 5 Hz within each sound pattern (error bars, SEM). The white bars representthe z scores of the magnitude of the sound envelope at corresponding frequencies. Significant differences between SS-EP and sound envelope amplitude are represented with a black (SS-EP� soundenvelope) or gray (SS-EP � sound envelope) asterisk (one-sample t test; *p � 0.05, **p � 0.01, ***p � 0.001). The expected beat and meter frequencies are highlighted by vertical arrows (beatfrequency shown in bold).
17576 • J. Neurosci., December 5, 2012 • 32(49):17572–17581 Nozaradan et al. • Selective Neuronal Entrainment to Beat and Meter
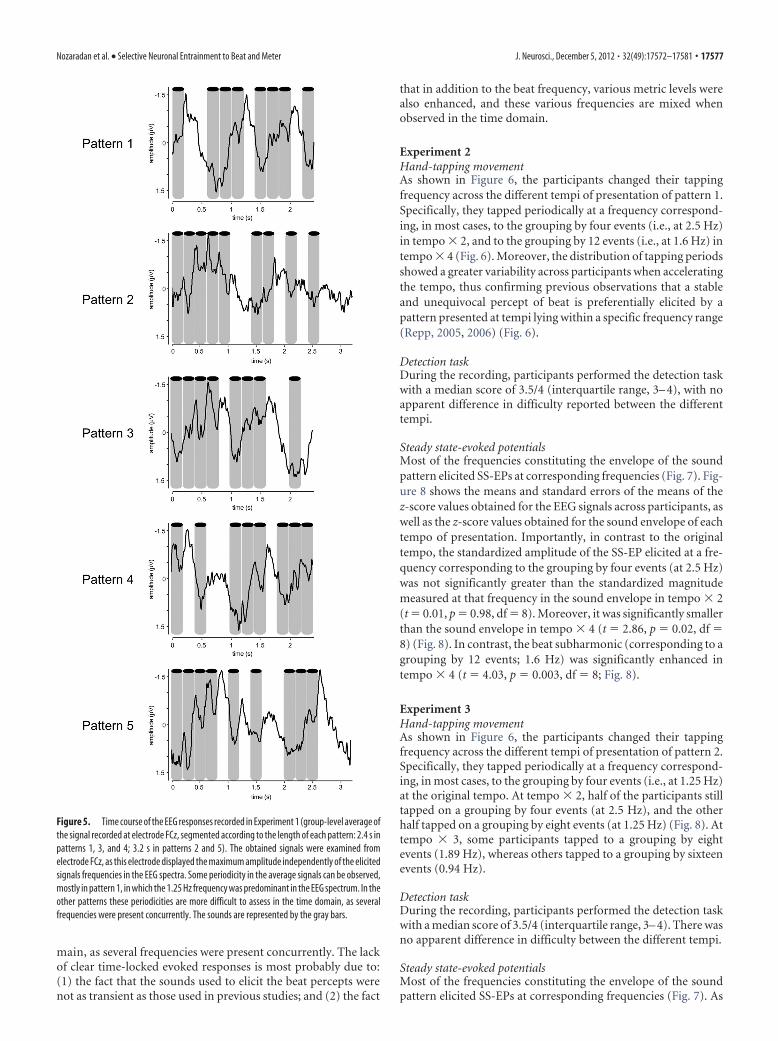
main, as several frequencies were present concurrently. The lackof clear time-locked evoked responses is most probably due to:(1) the fact that the sounds used to elicit the beat percepts werenot as transient as those used in previous studies; and (2) the fact
that in addition to the beat frequency, various metric levels werealso enhanced, and these various frequencies are mixed whenobserved in the time domain.
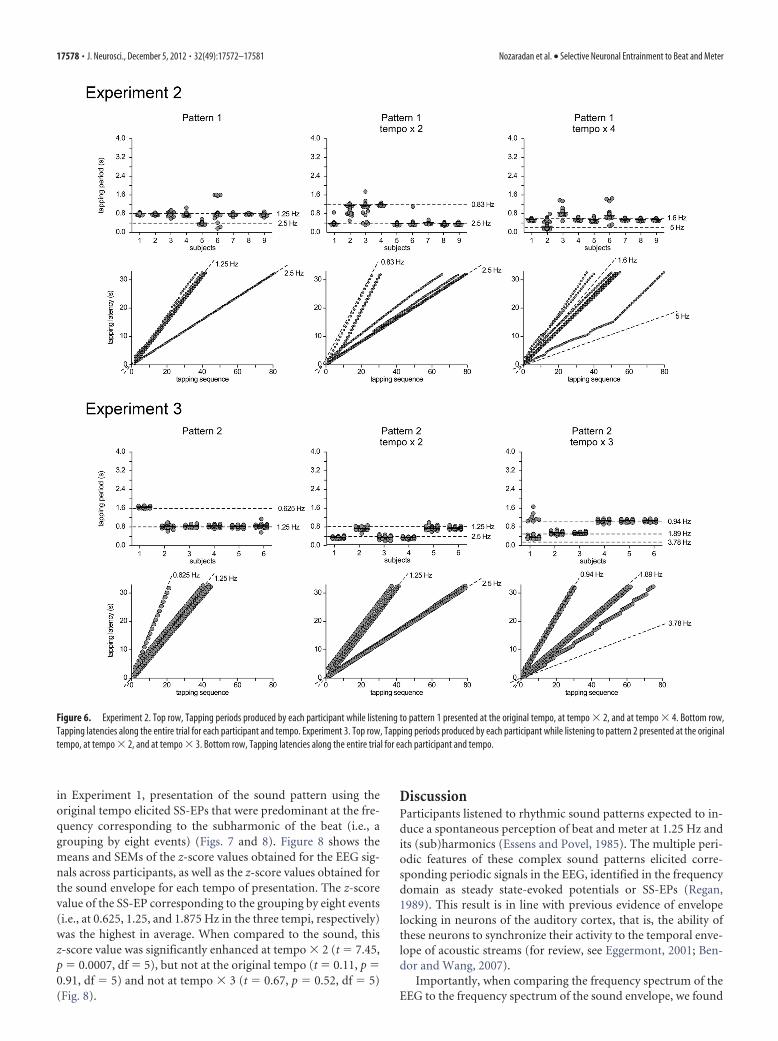
Experiment 2Hand-tapping movementAs shown in Figure 6, the participants changed their tappingfrequency across the different tempi of presentation of pattern 1.Specifically, they tapped periodically at a frequency correspond-ing, in most cases, to the grouping by four events (i.e., at 2.5 Hz)in tempo � 2, and to the grouping by 12 events (i.e., at 1.6 Hz) intempo � 4 (Fig. 6). Moreover, the distribution of tapping periodsshowed a greater variability across participants when acceleratingthe tempo, thus confirming previous observations that a stableand unequivocal percept of beat is preferentially elicited by apattern presented at tempi lying within a specific frequency range(Repp, 2005, 2006) (Fig. 6).
Detection taskDuring the recording, participants performed the detection taskwith a median score of 3.5/4 (interquartile range, 3– 4), with noapparent difference in difficulty reported between the differenttempi.
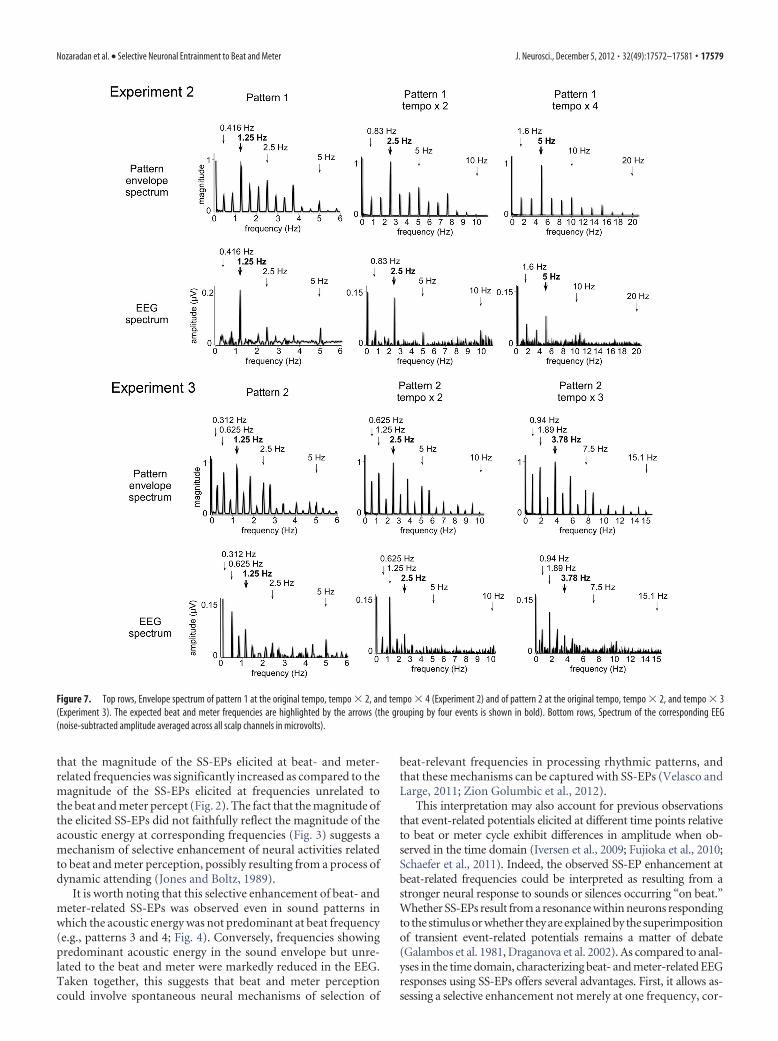
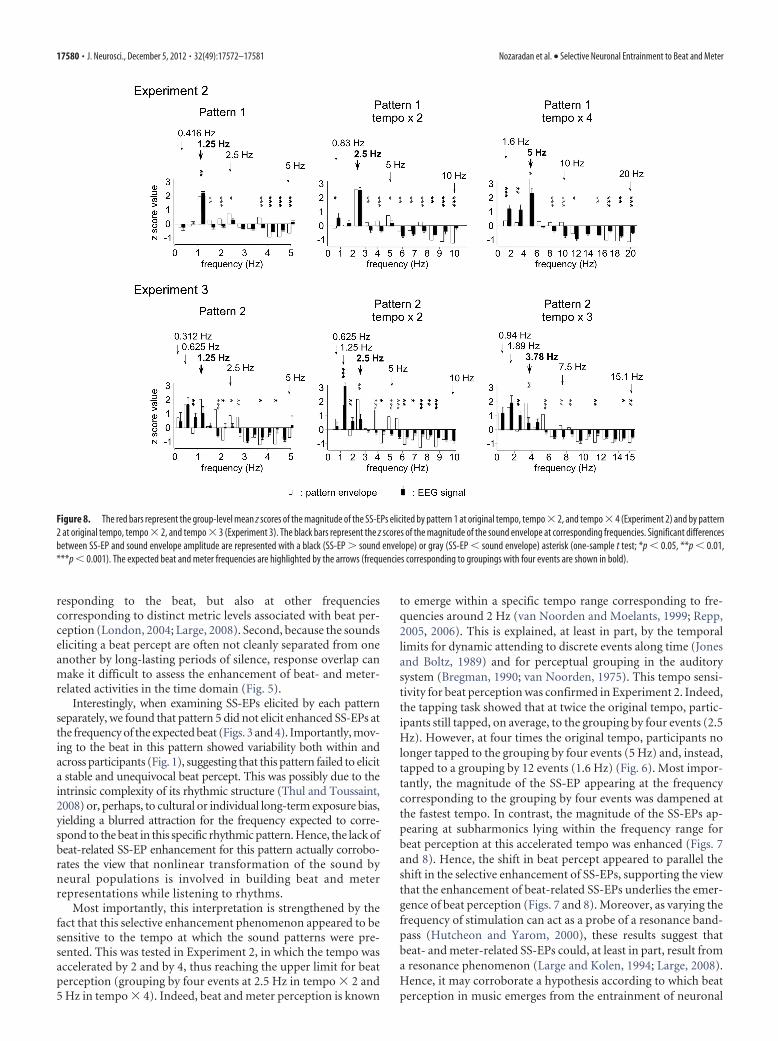
Steady state-evoked potentialsMost of the frequencies constituting the envelope of the soundpattern elicited SS-EPs at corresponding frequencies (Fig. 7). Fig-ure 8 shows the means and standard errors of the means of thez-score values obtained for the EEG signals across participants, aswell as the z-score values obtained for the sound envelope of eachtempo of presentation. Importantly, in contrast to the originaltempo, the standardized amplitude of the SS-EP elicited at a fre-quency corresponding to the grouping by four events (at 2.5 Hz)was not significantly greater than the standardized magnitudemeasured at that frequency in the sound envelope in tempo � 2(t � 0.01, p � 0.98, df � 8). Moreover, it was significantly smallerthan the sound envelope in tempo � 4 (t � 2.86, p � 0.02, df �8) (Fig. 8). In contrast, the beat subharmonic (corresponding to agrouping by 12 events; 1.6 Hz) was significantly enhanced intempo � 4 (t � 4.03, p � 0.003, df � 8; Fig. 8).
Experiment 3Hand-tapping movementAs shown in Figure 6, the participants changed their tappingfrequency across the different tempi of presentation of pattern 2.Specifically, they tapped periodically at a frequency correspond-ing, in most cases, to the grouping by four events (i.e., at 1.25 Hz)at the original tempo. At tempo � 2, half of the participants stilltapped on a grouping by four events (at 2.5 Hz), and the otherhalf tapped on a grouping by eight events (at 1.25 Hz) (Fig. 8). Attempo � 3, some participants tapped to a grouping by eightevents (1.89 Hz), whereas others tapped to a grouping by sixteenevents (0.94 Hz).
Detection taskDuring the recording, participants performed the detection taskwith a median score of 3.5/4 (interquartile range, 3– 4). There wasno apparent difference in difficulty between the different tempi.
Steady state-evoked potentialsMost of the frequencies constituting the envelope of the soundpattern elicited SS-EPs at corresponding frequencies (Fig. 7). As
Figure 5. Time course of the EEG responses recorded in Experiment 1 (group-level average ofthe signal recorded at electrode FCz, segmented according to the length of each pattern: 2.4 s inpatterns 1, 3, and 4; 3.2 s in patterns 2 and 5). The obtained signals were examined fromelectrode FCz, as this electrode displayed the maximum amplitude independently of the elicitedsignals frequencies in the EEG spectra. Some periodicity in the average signals can be observed,mostly in pattern 1, in which the 1.25 Hz frequency was predominant in the EEG spectrum. In theother patterns these periodicities are more difficult to assess in the time domain, as severalfrequencies were present concurrently. The sounds are represented by the gray bars.
Nozaradan et al. • Selective Neuronal Entrainment to Beat and Meter J. Neurosci., December 5, 2012 • 32(49):17572–17581 • 17577
in Experiment 1, presentation of the sound pattern using theoriginal tempo elicited SS-EPs that were predominant at the fre-quency corresponding to the subharmonic of the beat (i.e., agrouping by eight events) (Figs. 7 and 8). Figure 8 shows themeans and SEMs of the z-score values obtained for the EEG sig-nals across participants, as well as the z-score values obtained forthe sound envelope for each tempo of presentation. The z-scorevalue of the SS-EP corresponding to the grouping by eight events(i.e., at 0.625, 1.25, and 1.875 Hz in the three tempi, respectively)was the highest in average. When compared to the sound, thisz-score value was significantly enhanced at tempo � 2 (t � 7.45,p � 0.0007, df � 5), but not at the original tempo (t � 0.11, p �0.91, df � 5) and not at tempo � 3 (t � 0.67, p � 0.52, df � 5)(Fig. 8).
DiscussionParticipants listened to rhythmic sound patterns expected to in-duce a spontaneous perception of beat and meter at 1.25 Hz andits (sub)harmonics (Essens and Povel, 1985). The multiple peri-odic features of these complex sound patterns elicited corre-sponding periodic signals in the EEG, identified in the frequencydomain as steady state-evoked potentials or SS-EPs (Regan,1989). This result is in line with previous evidence of envelopelocking in neurons of the auditory cortex, that is, the ability ofthese neurons to synchronize their activity to the temporal enve-lope of acoustic streams (for review, see Eggermont, 2001; Ben-dor and Wang, 2007).
Importantly, when comparing the frequency spectrum of theEEG to the frequency spectrum of the sound envelope, we found
Figure 6. Experiment 2. Top row, Tapping periods produced by each participant while listening to pattern 1 presented at the original tempo, at tempo � 2, and at tempo � 4. Bottom row,Tapping latencies along the entire trial for each participant and tempo. Experiment 3. Top row, Tapping periods produced by each participant while listening to pattern 2 presented at the originaltempo, at tempo � 2, and at tempo � 3. Bottom row, Tapping latencies along the entire trial for each participant and tempo.
17578 • J. Neurosci., December 5, 2012 • 32(49):17572–17581 Nozaradan et al. • Selective Neuronal Entrainment to Beat and Meter
that the magnitude of the SS-EPs elicited at beat- and meter-related frequencies was significantly increased as compared to themagnitude of the SS-EPs elicited at frequencies unrelated tothe beat and meter percept (Fig. 2). The fact that the magnitude ofthe elicited SS-EPs did not faithfully reflect the magnitude of theacoustic energy at corresponding frequencies (Fig. 3) suggests amechanism of selective enhancement of neural activities relatedto beat and meter perception, possibly resulting from a process ofdynamic attending (Jones and Boltz, 1989).
It is worth noting that this selective enhancement of beat- andmeter-related SS-EPs was observed even in sound patterns inwhich the acoustic energy was not predominant at beat frequency(e.g., patterns 3 and 4; Fig. 4). Conversely, frequencies showingpredominant acoustic energy in the sound envelope but unre-lated to the beat and meter were markedly reduced in the EEG.Taken together, this suggests that beat and meter perceptioncould involve spontaneous neural mechanisms of selection of
beat-relevant frequencies in processing rhythmic patterns, andthat these mechanisms can be captured with SS-EPs (Velasco andLarge, 2011; Zion Golumbic et al., 2012).
This interpretation may also account for previous observationsthat event-related potentials elicited at different time points relativeto beat or meter cycle exhibit differences in amplitude when ob-served in the time domain (Iversen et al., 2009; Fujioka et al., 2010;Schaefer et al., 2011). Indeed, the observed SS-EP enhancement atbeat-related frequencies could be interpreted as resulting from astronger neural response to sounds or silences occurring “on beat.”Whether SS-EPs result from a resonance within neurons respondingto the stimulus or whether they are explained by the superimpositionof transient event-related potentials remains a matter of debate(Galambos et al. 1981, Draganova et al. 2002). As compared to anal-yses in the time domain, characterizing beat- and meter-related EEGresponses using SS-EPs offers several advantages. First, it allows as-sessing a selective enhancement not merely at one frequency, cor-
Figure 7. Top rows, Envelope spectrum of pattern 1 at the original tempo, tempo � 2, and tempo � 4 (Experiment 2) and of pattern 2 at the original tempo, tempo � 2, and tempo � 3(Experiment 3). The expected beat and meter frequencies are highlighted by the arrows (the grouping by four events is shown in bold). Bottom rows, Spectrum of the corresponding EEG(noise-subtracted amplitude averaged across all scalp channels in microvolts).
Nozaradan et al. • Selective Neuronal Entrainment to Beat and Meter J. Neurosci., December 5, 2012 • 32(49):17572–17581 • 17579
responding to the beat, but also at other frequenciescorresponding to distinct metric levels associated with beat per-ception (London, 2004; Large, 2008). Second, because the soundseliciting a beat percept are often not cleanly separated from oneanother by long-lasting periods of silence, response overlap canmake it difficult to assess the enhancement of beat- and meter-related activities in the time domain (Fig. 5).
Interestingly, when examining SS-EPs elicited by each patternseparately, we found that pattern 5 did not elicit enhanced SS-EPs atthe frequency of the expected beat (Figs. 3 and 4). Importantly, mov-ing to the beat in this pattern showed variability both within andacross participants (Fig. 1), suggesting that this pattern failed to elicita stable and unequivocal beat percept. This was possibly due to theintrinsic complexity of its rhythmic structure (Thul and Toussaint,2008) or, perhaps, to cultural or individual long-term exposure bias,yielding a blurred attraction for the frequency expected to corre-spond to the beat in this specific rhythmic pattern. Hence, the lack ofbeat-related SS-EP enhancement for this pattern actually corrobo-rates the view that nonlinear transformation of the sound byneural populations is involved in building beat and meterrepresentations while listening to rhythms.
Most importantly, this interpretation is strengthened by thefact that this selective enhancement phenomenon appeared to besensitive to the tempo at which the sound patterns were pre-sented. This was tested in Experiment 2, in which the tempo wasaccelerated by 2 and by 4, thus reaching the upper limit for beatperception (grouping by four events at 2.5 Hz in tempo � 2 and5 Hz in tempo � 4). Indeed, beat and meter perception is known
to emerge within a specific tempo range corresponding to fre-quencies around 2 Hz (van Noorden and Moelants, 1999; Repp,2005, 2006). This is explained, at least in part, by the temporallimits for dynamic attending to discrete events along time (Jonesand Boltz, 1989) and for perceptual grouping in the auditorysystem (Bregman, 1990; van Noorden, 1975). This tempo sensi-tivity for beat perception was confirmed in Experiment 2. Indeed,the tapping task showed that at twice the original tempo, partic-ipants still tapped, on average, to the grouping by four events (2.5Hz). However, at four times the original tempo, participants nolonger tapped to the grouping by four events (5 Hz) and, instead,tapped to a grouping by 12 events (1.6 Hz) (Fig. 6). Most impor-tantly, the magnitude of the SS-EP appearing at the frequencycorresponding to the grouping by four events was dampened atthe fastest tempo. In contrast, the magnitude of the SS-EPs ap-pearing at subharmonics lying within the frequency range forbeat perception at this accelerated tempo was enhanced (Figs. 7and 8). Hence, the shift in beat percept appeared to parallel theshift in the selective enhancement of SS-EPs, supporting the viewthat the enhancement of beat-related SS-EPs underlies the emer-gence of beat perception (Figs. 7 and 8). Moreover, as varying thefrequency of stimulation can act as a probe of a resonance band-pass (Hutcheon and Yarom, 2000), these results suggest thatbeat- and meter-related SS-EPs could, at least in part, result froma resonance phenomenon (Large and Kolen, 1994; Large, 2008).Hence, it may corroborate a hypothesis according to which beatperception in music emerges from the entrainment of neuronal
Figure 8. The red bars represent the group-level mean z scores of the magnitude of the SS-EPs elicited by pattern 1 at original tempo, tempo � 2, and tempo � 4 (Experiment 2) and by pattern2 at original tempo, tempo � 2, and tempo � 3 (Experiment 3). The black bars represent the z scores of the magnitude of the sound envelope at corresponding frequencies. Significant differencesbetween SS-EP and sound envelope amplitude are represented with a black (SS-EP � sound envelope) or gray (SS-EP � sound envelope) asterisk (one-sample t test; *p � 0.05, **p � 0.01,***p � 0.001). The expected beat and meter frequencies are highlighted by the arrows (frequencies corresponding to groupings with four events are shown in bold).
17580 • J. Neurosci., December 5, 2012 • 32(49):17572–17581 Nozaradan et al. • Selective Neuronal Entrainment to Beat and Meter
populations resonating at beat frequency (van Noorden andMoelants, 1999; Large, 2008).
Finally, the relationship between beat perception as assessedthrough overt movement of a body segment and selective SS-EPenhancement observed in the absence of overt movement wasexplored further in pattern 2. Indeed, although in this patternparticipants consistently moved to a grouping by four events inthe hand-tapping task (1.25 Hz; Fig. 1), the SS-EPs recorded inthe absence of hand tapping showed a relative reduction at thatfrequency in the EEG spectrum. Instead, a significant enhance-ment was observed for the SS-EP appearing at the frequencycorresponding to a grouping by eight events. A possible explana-tion for this discrepancy is that the frequency of the beat per-ceived when listening without moving differed from thefrequency of the beat perceived when performing the hand-tapping task. Indeed, the hand-tapping frequency could be biasedby several constraints, such as biomechanical constraints. Thisinterpretation is in line with evidence showing that humans arespontaneously entrained to move on musical rhythms using spe-cific body segments depending on the tempo (e.g., slow metriclevels preferentially lead to move axial body segments such asbouncing the head, whereas fast metric levels tend to entrainmore distal body parts, such as foot tapping) (van Noorden andMoelants, 1999; MacDougall and Moore, 2005; Toiviainen et al.,2010). To explore this further, we examined in Experiment 3 theeffect of accelerating the tempo of pattern 2. The tapping showedthat at two times the original tempo, half of the participants stilltapped to the grouping by four events (2.5 Hz, as in the originaltempo), but the other half tapped to the grouping by eight events(1.25 Hz) (Fig. 6). At three times the original tempo, about thesame tapping distribution was found between a tapping fre-quency corresponding to the grouping by eight (1.89 Hz) andsixteen events (0.94 Hz) (Fig. 6). In contrast, when listening with-out moving, a tendency to selective enhancement at frequenciescorresponding to the same grouping by eight events was observedacross the tempi in the EEG (Figs. 7 and 8). Hence, it could be thatperforming the hand-tapping task engaged specific constraintsleading to differences between the frequency of the beat perceivedin the hand-tapping condition and the frequency of the beat per-ceived in the passive condition.
Taken together, the observation that SS-EPs are selectivelyenhanced when elicited at frequencies compatible with beat andmeter perception indicates that these responses do not merelyreflect the physical structure of the sound envelope but insteadreflect the spontaneous emergence of an internal representationof beat, possibly through a mechanism of selective neuronal en-trainment within a resonance frequency range.
ReferencesBach M, Meigen T (1999) Do’s and don’ts in Fourier analysis of steady-state
potentials. Doc Ophthalmol 99:69 – 82. CrossRef MedlineBell AJ, Sejnowski TJ (1995) An information-maximization approach to
blind separation and blind deconvolution. Neural Comput 7:1129 –1159.CrossRef Medline
Bendor D, Wang X (2007) Differential neural coding of acoustic flutterwithin primate auditory cortex. Nat Neurosci 10:763–771. CrossRefMedline
Brainard DH (1997) The psychophysics toolbox. Spat Vis 10:433– 436.CrossRef Medline
Bregman AS (1990) Auditory scene analysis. Cambridge, MA: MIT.Draganova R, Ross B, Borgmann C, Pantev C (2002) Auditory cortical re-
sponse patterns to multiple rhythms of AM sound. Ear Hear 23:254 –265.CrossRef Medline
Eggermont JJ (2001) Between sound and perception: reviewing the searchfor a neural code. Hear Res 157:1– 42. CrossRef Medline
Essens PJ, Povel DJ (1985) Metrical and nonmetrical representations oftemporal patterns. Percept Psychophys 37:1–7. CrossRef Medline
Fitch WT, Rosenfeld AJ (2007) Perception and production of syncopatedrhythms. Music Percept 25:43–58. CrossRef
Frigo M, Johnson SG (1998) FFTW: an adaptive software architecture for theFFT. In: Proceedings of the 1998 IEEE International Conference on Acous-tics, Speech, and Signal Processing, Vol. 3, pp 1381–1384. Seattle: IEEE.
Fujioka T, Zendel BR, Ross B (2010) Endogenous neuromagnetic activityfor mental hierarchy of timing. J Neurosci 30:3458 –3466. CrossRefMedline
Galambos R, Makeig S, Talmachoff PJ (1981) A 40-Hz auditory potentialrecorded from the human scalp. Proc Natl Acad Sci U S A 78:2643–2647.CrossRef Medline
Hutcheon B, Yarom Y (2000) Resonance, oscillation and the intrinsic fre-quency preferences of neurons. Trends Neurosci 23:216 –222. CrossRefMedline
Iversen JR, Repp BH, Patel AD (2009) Top-down control of rhythm percep-tion modulates early auditory responses. Ann NY Acad Sci 1169:58 –73.CrossRef Medline
Jones MR, Boltz M (1989) Dynamic attending and responses to time. Psy-chol Rev 96:459 – 491. CrossRef Medline
Jung TP, Makeig S, Westerfield M, Townsend J, Courchesne E, Sejnowski TJ(2000) Removal of eye activity artifacts from visual event-related poten-tials in normal and clinical subjects. Clin Neurophysiol 111:1745–1758.CrossRef Medline
Large EW (2008) Resonating to musical rhythm: theory and experiment. In:The psychology of time (Simon Grondin S, ed), pp 189 –232. Bingley,West Yorkshire, UK: Emerald.
Large EW, Kolen JF (1994) Resonance and the perception of musical meter.Connect Sci 6:177–208. CrossRef
Lartillot O, Toiviainen P (2007) A Matlab toolbox for musical feature ex-traction from audio. Paper presented at the 10th International Confer-ence on Digital Audio Effects (DAFx-07), Bordeaux, France, September.
London J (2004) Hearing in time: psychological aspects of musical meter.New York: Oxford UP.
MacDougall HG, Moore ST (2005) Marching to the beat of the same drum-mer: the spontaneous tempo of human locomotion. J Appl Physiol 99:1164 –1173. CrossRef Medline
Makeig S (2002) Response: event-related brain dynamics — unifying brainelectrophysiology. Trends Neurosci 25:390. CrossRef Medline
Mouraux A, Iannetti GD (2008) Across-trial averaging of event-related EEGresponses and beyond. Magn Reson Imaging 26:1041–1054. CrossRefMedline
Mouraux A, Iannetti GD, Colon E, Nozaradan S, Legrain V, Plaghki L (2011)Nociceptive steady-state evoked potentials elicited by rapid periodic ther-mal stimulation of cutaneous nociceptors. J Neurosci 31:6079 – 6087.CrossRef Medline
Nozaradan S, Peretz I, Missal M, Mouraux A (2011) Tagging the neuronalentrainment to beat and meter. J Neurosci 31:10234 –10240. CrossRefMedline
Nozaradan S, Peretz I, Mouraux A (2012) Steady-state evoked potentials asan index of multisensory temporal binding. Neuroimage 60:21–28.CrossRef Medline
Phillips-Silver J, Aktipis CA, Bryant GA (2010) The ecology of entrainment:foundations of coordinated rhythmic movement. Music Percept 28:3–14.CrossRef Medline
Pikovsky A, Rosenblum M, Kurths J (2001) Synchronization: a universalconcept in non-linear sciences. Cambridge, UK: Cambridge UP.
Regan D (1989) Human brain electrophysiology: evoked potentials andevoked magnetic fields in science and medicine. New York: Elsevier.
Repp BH (2005) Sensorimotor synchronization: a review of the tapping lit-erature. Psychon Bull Rev 12:969 –992. CrossRef Medline
Repp BH (2006) Rate limits of sensorimotor synchronization. Adv CognPsychiatr 2:163–181.
Saupe K, Schroger E, Andersen SK, Muller MM (2009) Neural mechanismsof intermodal sustained selective attention with concurrently presentedauditory and visual stimuli. Front Hum Neurosci 3:58. CrossRef Medline
Schaefer RS, Vlek RJ, Desain P (2011) Decomposing rhythm processing:electroencephalography of perceived and self-imposed rhythmic pat-terns. Psychol Res 75:95–106. CrossRef Medline
Thul E, Toussaint G (2008) Rhythm complexity measures: a comparison of
Nozaradan et al. • Selective Neuronal Entrainment to Beat and Meter J. Neurosci., December 5, 2012 • 32(49):17572–17581 • 17581

mathematical models of human perception and performance. Paper pre-sented at the 9th International Conference on Music Information Re-trieval, Philadelphia, September.
Toiviainen P, Luck G, Thompson M (2010) Embodied meter: hierarchicaleigenmodes in music-induced movement. Music Percept 28:59 –70.CrossRef
van Noorden L (1975) Temporal coherence in the perception of tone se-quences. PhD thesis, Eindhoven University of Technology.
van Noorden L, Moelants D (1999) Resonance in the perception of musicalpulse. J New Music Res 28:43– 66. CrossRef
Velasco MJ, Large EW (2011) Pulse detection in syncopated rhythms usingneural oscillators. Paper presented at the 12th Annual Conference of theInternational Society for Music Information Retrieval, Miami, October.
Zion Golumbic EM, Poeppel D, Schroeder CE (2012) Temporal context inspeech processing and attentional stream selection: a behavioral and neu-ral perspective. Brain Lang 122:151–161. CrossRef Medline
17581a • J. Neurosci., December 5, 2012 • 32(49):17572–17581 Nozaradan et al. • Selective Neuronal Entrainment to Beat and Meter