Selective Exposure to Misinformation: Evidence …nyhan/fake-news-2016.pdfSelective Exposure to...
49
Selective Exposure to Misinformation: Evidence from the consumption of fake news during the 2016 U.S. presidential campaign Andrew Guess Department of Politics Princeton University Brendan Nyhan Department of Government Dartmouth College Jason Reifler Department of Politics University of Exeter January 9, 2018 Abstract Though some warnings about online “echo chambers” have been hyperbolic, tenden- cies toward selective exposure to politically congenial content are likely to extend to misinformation and to be exacerbated by social media platforms. We test this prediction using data on the factually dubious articles known as “fake news.” Using unique data combining survey responses with individual-level web traffic histories, we estimate that approximately 1 in 4 Americans visited a fake news website from October 7-November 14, 2016. Trump supporters visited the most fake news web- sites, which were overwhelmingly pro-Trump. However, fake news consumption was heavily concentrated among a small group — almost 6 in 10 visits to fake news web- sites came from the 10% of people with the most conservative online information diets. We also find that Facebook was a key vector of exposure to fake news and that fact-checks of fake news almost never reached its consumers. We are grateful to the Poynter Institute, Knight Foundation, and American Press Institute for generous funding support; Craig Silverman for graciously sharing data; Samantha Luks and Marissa Shih at YouGov for assistance with survey administration; and Kevin Arceneaux, Travis Coan, David Ciuk, Lorien Jasny, David Lazer, Thomas Leeper, Adam Seth Levine, Ben Lyons, Cecilia Mo, Simon Munzert, and Spencer Piston for helpful comments. We are also grateful to Angela Cai, Jack Davidson, Kathryn Fuhs, Jose Burnes Garza, Guy Green, Jessica Lu, Annie Ma, Sarah Petroni, Morgan Sandhu, Priya Sankar, Amy Sun, Andrew Wol↵, and Alexandra Woodru↵ for excellent research assistance. Reifler received funding support from the European Research Council (ERC) under the European Union’s Horizon 2020 research and innovation programme (grant agreement No. 682758).
Transcript of Selective Exposure to Misinformation: Evidence …nyhan/fake-news-2016.pdfSelective Exposure to...
Selective Exposure to Misinformation:Evidence from the consumption of fake news during the
2016 U.S. presidential campaign
Andrew GuessDepartment of PoliticsPrinceton University
Brendan NyhanDepartment of Government
Dartmouth College
Jason ReiflerDepartment of PoliticsUniversity of Exeter
January 9, 2018
Abstract
Though some warnings about online “echo chambers” have been hyperbolic, tenden-cies toward selective exposure to politically congenial content are likely to extendto misinformation and to be exacerbated by social media platforms. We test thisprediction using data on the factually dubious articles known as “fake news.” Usingunique data combining survey responses with individual-level web tra�c histories,we estimate that approximately 1 in 4 Americans visited a fake news website fromOctober 7-November 14, 2016. Trump supporters visited the most fake news web-sites, which were overwhelmingly pro-Trump. However, fake news consumption washeavily concentrated among a small group — almost 6 in 10 visits to fake news web-sites came from the 10% of people with the most conservative online informationdiets. We also find that Facebook was a key vector of exposure to fake news andthat fact-checks of fake news almost never reached its consumers.
We are grateful to the Poynter Institute, Knight Foundation, and American Press Institute for generousfunding support; Craig Silverman for graciously sharing data; Samantha Luks and Marissa Shih atYouGov for assistance with survey administration; and Kevin Arceneaux, Travis Coan, David Ciuk,Lorien Jasny, David Lazer, Thomas Leeper, Adam Seth Levine, Ben Lyons, Cecilia Mo, Simon Munzert,and Spencer Piston for helpful comments. We are also grateful to Angela Cai, Jack Davidson, KathrynFuhs, Jose Burnes Garza, Guy Green, Jessica Lu, Annie Ma, Sarah Petroni, Morgan Sandhu, PriyaSankar, Amy Sun, Andrew Wol↵, and Alexandra Woodru↵ for excellent research assistance. Reiflerreceived funding support from the European Research Council (ERC) under the European Union’sHorizon 2020 research and innovation programme (grant agreement No. 682758).
The combination of rising partisanship and pervasive social media usage in the United States have
created fears of widespread “echo chambers” and “filter bubbles” (Sunstein, 2001; Pariser, 2011).
To date, these warnings appear to be overstated. Behavioral data indicates that only a subset of
Americans have heavily skewed media consumption patterns (Gentzkow and Shapiro, 2011; Barbera
et al., 2015; Flaxman, Goel, and Rao, 2016; Guess, 2016).
However, the risk of information polarization remains. Research shows people tend to prefer
congenial information, including political news, when given the choice (e.g., Stroud, 2008; Hart
et al., 2009; Iyengar and Hahn, 2009; Iyengar et al., 2008), but these studies typically focus on how
ideological slant a↵ects the content people choose to consume; relatively little is known about how
selective exposure extends to false or misleading factual claims. Research in political science and
psychology has documented that misperceptions are often systematically related to people’s political
identities and predispositions (Flynn, Nyhan, and Reifler, 2017). In this article, we therefore
evaluate whether people di↵erentially consume false information that reinforces their political views
as theories of selective exposure would predict.
We additionally consider the extent to which social media usage exacerbates tendencies toward
selective exposure to misinformation. Though Messing and Westwood (2014) find that social en-
dorsements can help overcome partisan cues when people are choosing news content, other research
indicates that tendencies toward selective exposure to attitude-consistent news and information
may be exacerbated by the process of sharing and consuming content online (e.g., Bakshy, Mess-
ing, and Adamic, 2015). In this way, social media consumption may also be a mechanism increasing
di↵erential exposure to factually dubious but attitude-consistent information.
Finally, we analyze whether fact-checking — a new format that is increasingly used to counter
political misinformation — e↵ectively reached consumers of fake news during the 2016 election.
Though fact-checks are relatively widely read and associated with greater political knowledge (e.g.,
Gottfried et al., 2013), they are often disseminated online in a politically slanted manner that is
likely to increase selective exposure and reduce consumption of counter-attitudinal fact-checks (Shin
and Thorson, 2017). To date, however, no previous research has considered whether consumers of
fact-checks have been exposed to the claims that they evaluate. Does selective exposure undermine
the e↵ectiveness of fact-checking?
We evaluate these questions in the context of the rise of so-called “fake news,” a new form
1
of political misinformation that features prominently in journalistic accounts of the 2016 U.S.
presidential election (e.g., Solon, 2016). Data from Facebook indicates that these factually dubious
for-profit articles were shared by millions of people (Silverman, 2016). Many people also report
believing the claims that fake news sites promoted in post-election surveys (Silverman and Singer-
Vine, 2016; Allcott and Gentzkow, 2017).
However, little is known scientifically about the consumption of fake news, including who read
it, the mechanisms by which it was disseminated, and the extent to which fact-checks reached fake
news consumers. These questions are critical to understanding how selective exposure can distort
the factual information that people consume — a key question for U.S. democracy.
We therefore examine the prevalence and mechanisms of exposure to fake news websites in a
unique dataset that combines pre-election survey responses and comprehensive web tra�c data from
a national sample of Americans. Our design allows us to provide the first individual-level estimates
of visits to fake news websites, including who visited these websites, how much and which types of
fake news they consumed, and the probability that fact-checks reached fake news website readers.
We can thus provide the first measures of the prevalence of selective exposure to misinformation in
real-world behavior.
Specifically, we find that approximately one in four Americans visited a fake news website, but
that consumption was disproportionately observed among Trump supporters for whom its largely
pro-Trump content was attitude-consistent. However, this pattern of selective exposure was heavily
concentrated among a small subset of people — almost six in ten visits to fake news websites came
from the 10% of Americans with the most conservative information diets. Finally, we specifically
identify Facebook as the most important mechanism facilitating the spread of fake news and show
that fact-checking largely failed to e↵ectively reach consumers of fake news.
Taken together, these results suggest a need to revisit the study of selective exposure using
measures of real-world media consumption and to consider the behavioral mechanisms by which
people are exposed to misinformation.
2
Data and results
Data for the analyses below combine responses to an online public opinion survey from a national
sample of 2,525 Americans with web tra�c data collected passively from their computers with
their consent during the October 7–November 14, 2016 period. Our primary outcome variables are
computed from web tra�c data and measure the type and/or quantity of websites publishing fake
news that respondents visited. We employ survey weights to approximate the adult population of
the U.S. (Further details on the sample and the survey weights are provided in the Supplemen-
tary Materials, where we show that the sample closely resembles the U.S. population in both its
demographic characteristics and privacy attitudes.)
The survey questions we administered allow us to examine the relationship between demographic
and attitudinal variables (e.g., candidate preference) and visits to fake news websites. Addition-
ally, we compute three key explanatory measures from respondents’ web tra�c data: the overall
ideological slant of a person’s online media consumption (or “information diet”), which we divide
below into deciles from most liberal to most conservative using the method from Guess (2016); their
consumption of “hard news” sites classified as focusing on national news, politics, or world a↵airs
(Bakshy, Messing, and Adamic, 2015); and their Facebook usage, which we divide into terciles by
how often they visit the site.
Of course, studying fake news consumption requires defining which websites are publishing fake
news. We define pro-Trump fake news websites as those that published two or more articles that
were coded as fake news in Allcott and Gentzkow (2017), the first peer-reviewed study of fake news
in social science, and for which 80% or more of the fake news articles identified from the site were
coded as pro-Trump.1 An identical approach is used to create our measure of pro-Clinton fake news
sites. We exclude domains from these sets that were previously identified in Bakshy, Messing, and
Adamic (2015) as focusing on hard news topics in order to concentrate on the new websites that
were created around the election. Finally, we construct a measure of total fake news website visits
that includes visits to both pro-Trump and pro-Clinton fake news websites as defined above.2
1In the Supplementary Materials, we present robustness tests using two alternate outcome measures. The resultsare highly consistent with those presented below.
2Our measures of fake news consumption thus exclude more established but often factually dubious sites such asBreitbart. Due to restrictions in the Facebook API, we also cannot observe incidental exposure to fake news or otherkinds of dubious content such as “hyper-partisan” sites in the Facebook News Feed. In this sense, our estimatesrepresent a lower bound of fake news consumption.
3
The fake news sites in question, which are listed in the Supplementary Materials, display little
regard for journalistic norms or practices; reporting suggests most were created to generate profits
(Silverman and Alexander, 2017). Though they sometimes publish accurate information, they
also frequently publish false claims, distort genuine news reports, and copy or repurpose content
from other outlets. It is important to note, however, that there is still considerable diversity in
the stories that these sites publish. Some content is deeply misleading or fabricated (e.g., the
“Pizzagate” conspiracy theory), while other articles instead selectively amplify political events in
an over-the-top style that flatters the prejudices of a candidate’s supporters.
Total fake news consumption
We estimate that 27.4% of Americans age 18 or older visited an article on a pro-Trump or pro-
Clinton fake news website during our study period, which covered the final weeks of the 2016
election campaign (95% CI: 24.4%–30.3%). While this proportion may appear small, 27% of the
voting age population in the United States is more than 65 million people. In total, articles on pro-
Trump or pro-Clinton fake news websites represented an average of approximately 2.6% of all the
articles Americans read on sites focusing on hard news topics during this period. The pro-Trump
or pro-Clinton fake news that people read was heavily skewed toward Donald Trump — people
saw an average (mean) of 5.45 articles from fake news websites during the study period of October
7–November 14, 2016. Nearly all of these were pro-Trump (average of 5.00 pro-Trump articles).
Selective exposure to fake news
There are stark di↵erences by candidate support in the frequency and slant of fake news website
visits.3 We focus specifically in this study on respondents who reported supporting Hillary Clinton
or Donald Trump in our survey (76% of our sample) because of our focus on selective exposure by
candidate preference. People who supported Trump were far more likely to visit fake news websites
— especially those that are pro-Trump — than Clinton supporters. Among Trump supporters,
40% read at least one article from a pro-Trump fake news website (mean = 13.1, 95% CI: 7.8, 18.3)
3Our analysis considers visits to fake news websites as defined above but we show in the Supplementary Materialsthat the results in Table 1 (below) are consistent if we instead only consider visits to specific article URLs thatAllcott and Gentzkow (2017) identify as being classified as false or misleading by fact-checkers. The results are alsoconsistent if we consider visits to websites identified by Silverman (2016) as publishing the most widely shared fakenews articles before the 2016 election (see the Supplementary Materials).
4
compared with only 15% of Clinton supporters (mean = 0.51, 95% CI: 0.39, 0.64). Consumption
of articles from pro-Clinton fake news websites was much lower, though also somewhat divided by
candidate support. Clinton supporters were modestly more likely to have visited pro-Clinton fake
news websites (11.3%, mean articles: 0.85) versus Trump supporters (2.8%, mean articles: 0.05).
The di↵erences by candidate preference that we observe in fake news website visits are even more
pronounced when expressed in terms of the composition of the overall news diets of each group.
Articles on fake news websites represented an average of 6.2% of the pages visited on sites that
focused on news topics among Trump supporters versus 0.8% among Clinton supporters.
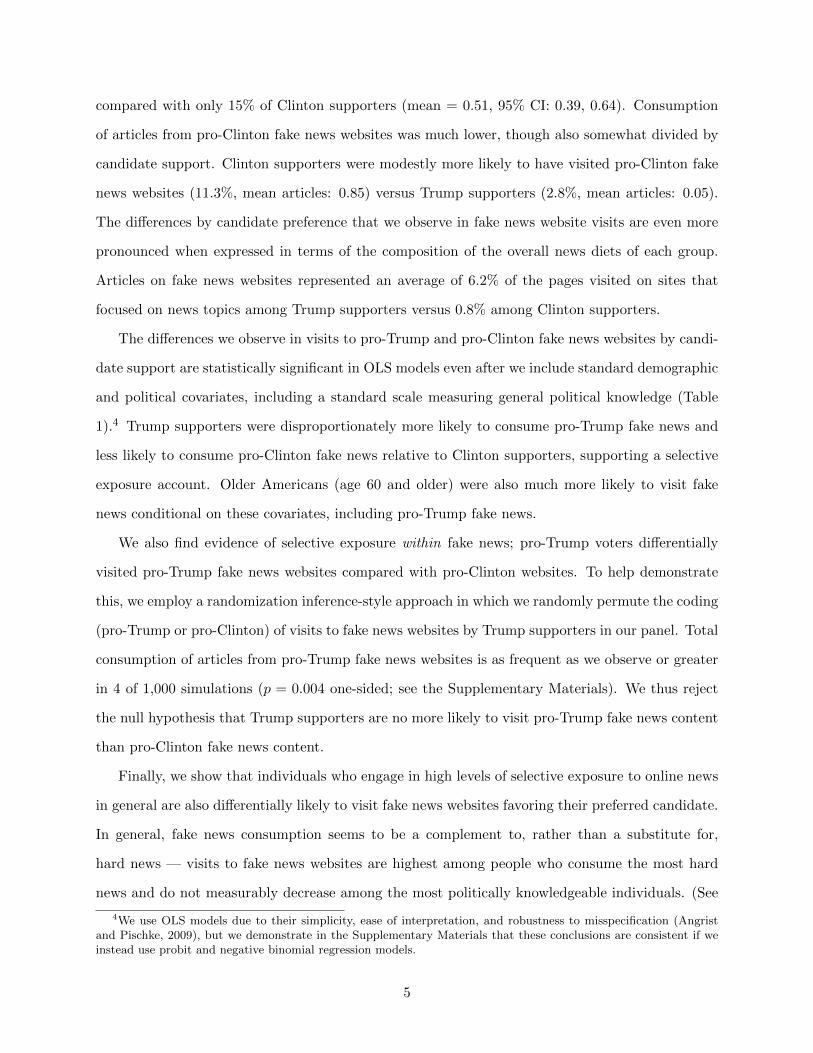
The di↵erences we observe in visits to pro-Trump and pro-Clinton fake news websites by candi-
date support are statistically significant in OLS models even after we include standard demographic
and political covariates, including a standard scale measuring general political knowledge (Table
1).4 Trump supporters were disproportionately more likely to consume pro-Trump fake news and
less likely to consume pro-Clinton fake news relative to Clinton supporters, supporting a selective
exposure account. Older Americans (age 60 and older) were also much more likely to visit fake
news conditional on these covariates, including pro-Trump fake news.
We also find evidence of selective exposure within fake news; pro-Trump voters di↵erentially
visited pro-Trump fake news websites compared with pro-Clinton websites. To help demonstrate
this, we employ a randomization inference-style approach in which we randomly permute the coding
(pro-Trump or pro-Clinton) of visits to fake news websites by Trump supporters in our panel. Total
consumption of articles from pro-Trump fake news websites is as frequent as we observe or greater
in 4 of 1,000 simulations (p = 0.004 one-sided; see the Supplementary Materials). We thus reject
the null hypothesis that Trump supporters are no more likely to visit pro-Trump fake news content
than pro-Clinton fake news content.
Finally, we show that individuals who engage in high levels of selective exposure to online news
in general are also di↵erentially likely to visit fake news websites favoring their preferred candidate.
In general, fake news consumption seems to be a complement to, rather than a substitute for,
hard news — visits to fake news websites are highest among people who consume the most hard
news and do not measurably decrease among the most politically knowledgeable individuals. (See
4We use OLS models due to their simplicity, ease of interpretation, and robustness to misspecification (Angristand Pischke, 2009), but we demonstrate in the Supplementary Materials that these conclusions are consistent if weinstead use probit and negative binomial regression models.
5
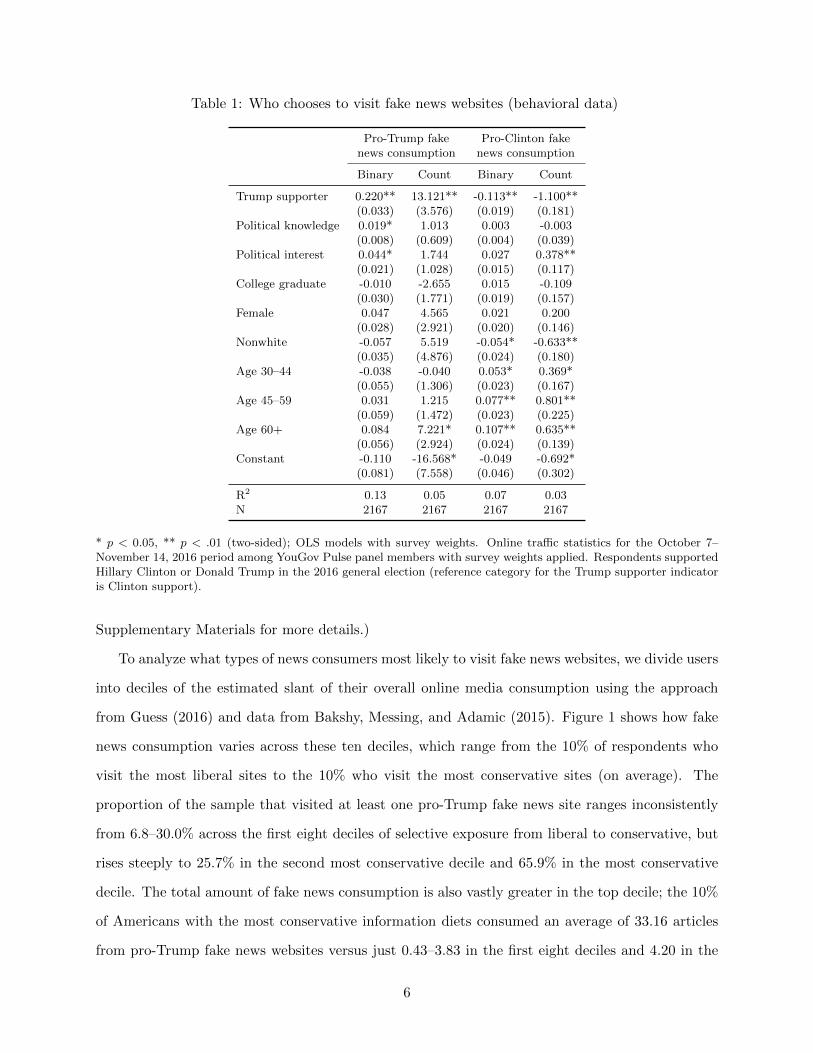
Table 1: Who chooses to visit fake news websites (behavioral data)
Pro-Trump fake Pro-Clinton fakenews consumption news consumption
Binary Count Binary Count
Trump supporter 0.220** 13.121** -0.113** -1.100**(0.033) (3.576) (0.019) (0.181)
Political knowledge 0.019* 1.013 0.003 -0.003(0.008) (0.609) (0.004) (0.039)
Political interest 0.044* 1.744 0.027 0.378**(0.021) (1.028) (0.015) (0.117)
College graduate -0.010 -2.655 0.015 -0.109(0.030) (1.771) (0.019) (0.157)
Female 0.047 4.565 0.021 0.200(0.028) (2.921) (0.020) (0.146)
Nonwhite -0.057 5.519 -0.054* -0.633**(0.035) (4.876) (0.024) (0.180)
Age 30–44 -0.038 -0.040 0.053* 0.369*(0.055) (1.306) (0.023) (0.167)
Age 45–59 0.031 1.215 0.077** 0.801**(0.059) (1.472) (0.023) (0.225)
Age 60+ 0.084 7.221* 0.107** 0.635**(0.056) (2.924) (0.024) (0.139)
Constant -0.110 -16.568* -0.049 -0.692*(0.081) (7.558) (0.046) (0.302)
R2 0.13 0.05 0.07 0.03N 2167 2167 2167 2167
* p < 0.05, ** p < .01 (two-sided); OLS models with survey weights. Online tra�c statistics for the October 7–November 14, 2016 period among YouGov Pulse panel members with survey weights applied. Respondents supportedHillary Clinton or Donald Trump in the 2016 general election (reference category for the Trump supporter indicatoris Clinton support).
Supplementary Materials for more details.)
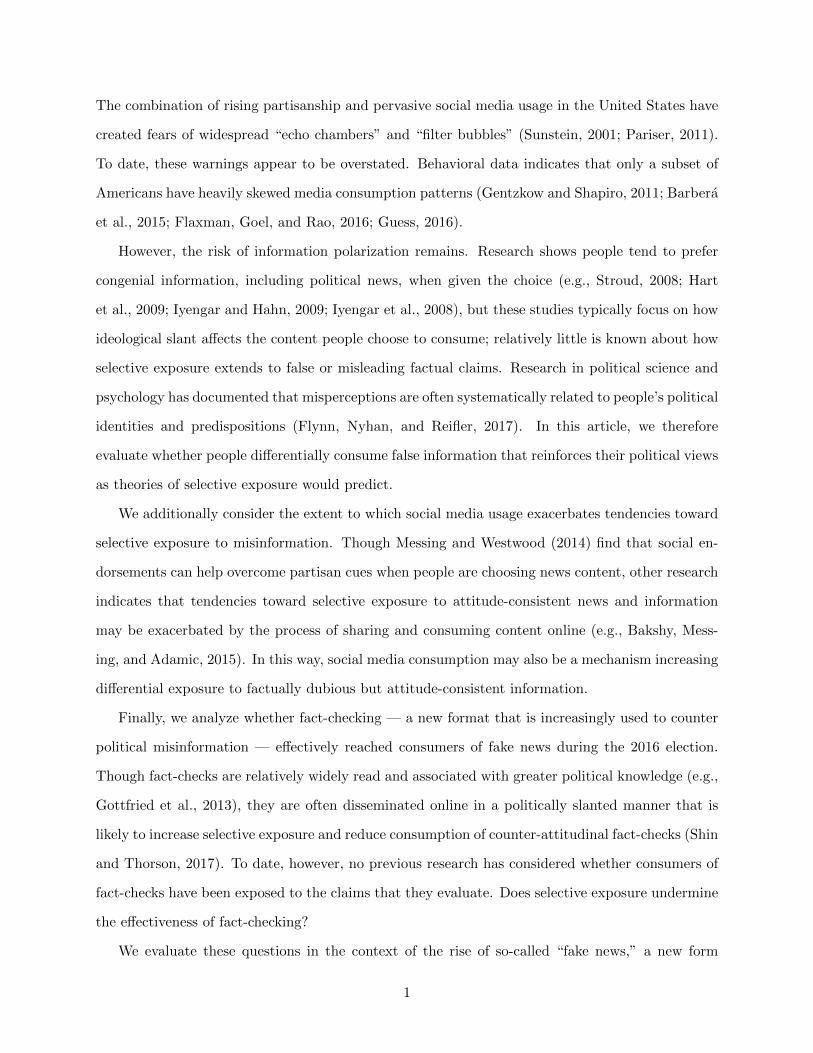
To analyze what types of news consumers most likely to visit fake news websites, we divide users
into deciles of the estimated slant of their overall online media consumption using the approach
from Guess (2016) and data from Bakshy, Messing, and Adamic (2015). Figure 1 shows how fake
news consumption varies across these ten deciles, which range from the 10% of respondents who
visit the most liberal sites to the 10% who visit the most conservative sites (on average). The
proportion of the sample that visited at least one pro-Trump fake news site ranges inconsistently
from 6.8–30.0% across the first eight deciles of selective exposure from liberal to conservative, but
rises steeply to 25.7% in the second most conservative decile and 65.9% in the most conservative
decile. The total amount of fake news consumption is also vastly greater in the top decile; the 10%
of Americans with the most conservative information diets consumed an average of 33.16 articles
from pro-Trump fake news websites versus just 0.43–3.83 in the first eight deciles and 4.20 in the
6
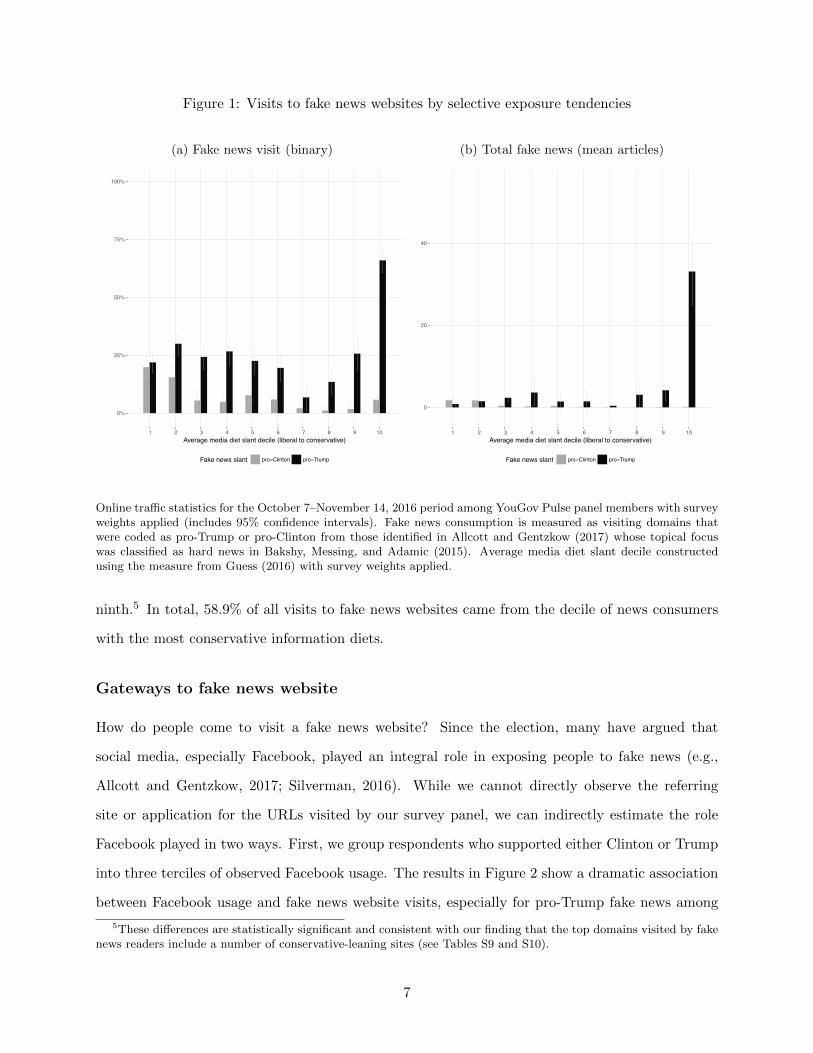
Figure 1: Visits to fake news websites by selective exposure tendencies
(a) Fake news visit (binary)
0%
25%
50%
75%
100%
1 2 3 4 5 6 7 8 9 10Average media diet slant decile (liberal to conservative)
Fake news slant pro−Clinton pro−Trump
(b) Total fake news (mean articles)
0
20
40
1 2 3 4 5 6 7 8 9 10Average media diet slant decile (liberal to conservative)
Fake news slant pro−Clinton pro−Trump
Online tra�c statistics for the October 7–November 14, 2016 period among YouGov Pulse panel members with surveyweights applied (includes 95% confidence intervals). Fake news consumption is measured as visiting domains thatwere coded as pro-Trump or pro-Clinton from those identified in Allcott and Gentzkow (2017) whose topical focuswas classified as hard news in Bakshy, Messing, and Adamic (2015). Average media diet slant decile constructedusing the measure from Guess (2016) with survey weights applied.
ninth.5 In total, 58.9% of all visits to fake news websites came from the decile of news consumers
with the most conservative information diets.
Gateways to fake news website
How do people come to visit a fake news website? Since the election, many have argued that
social media, especially Facebook, played an integral role in exposing people to fake news (e.g.,
Allcott and Gentzkow, 2017; Silverman, 2016). While we cannot directly observe the referring
site or application for the URLs visited by our survey panel, we can indirectly estimate the role
Facebook played in two ways. First, we group respondents who supported either Clinton or Trump
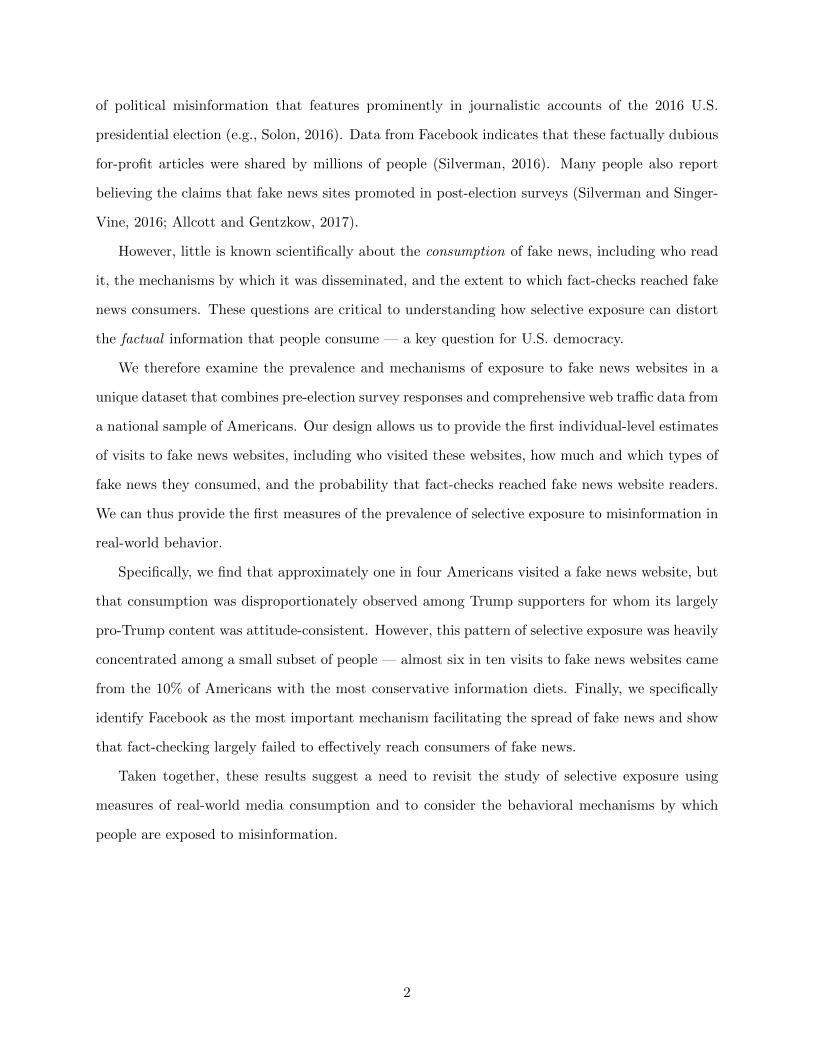
into three terciles of observed Facebook usage. The results in Figure 2 show a dramatic association
between Facebook usage and fake news website visits, especially for pro-Trump fake news among
5These di↵erences are statistically significant and consistent with our finding that the top domains visited by fakenews readers include a number of conservative-leaning sites (see Tables S9 and S10).
7
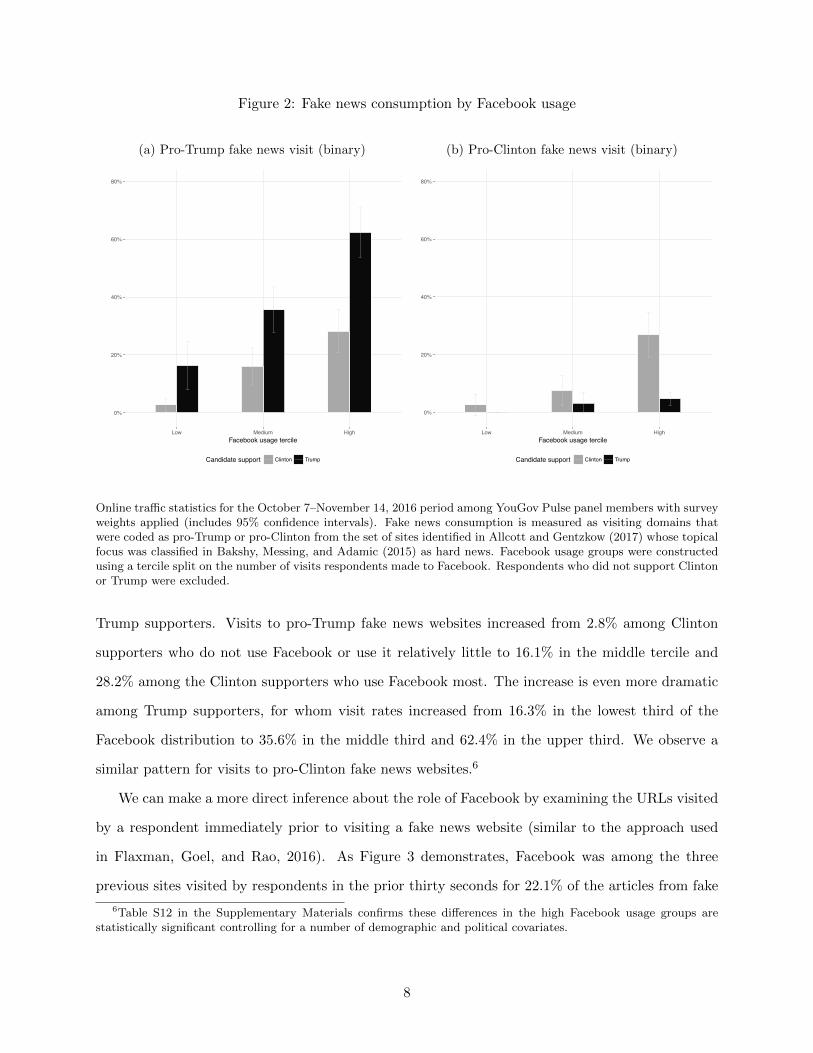
Figure 2: Fake news consumption by Facebook usage
(a) Pro-Trump fake news visit (binary)
0%
20%
40%
60%
80%
Low Medium HighFacebook usage tercile
Candidate support Clinton Trump
(b) Pro-Clinton fake news visit (binary)
0%
20%
40%
60%
80%
Low Medium HighFacebook usage tercile
Candidate support Clinton Trump
Online tra�c statistics for the October 7–November 14, 2016 period among YouGov Pulse panel members with surveyweights applied (includes 95% confidence intervals). Fake news consumption is measured as visiting domains thatwere coded as pro-Trump or pro-Clinton from the set of sites identified in Allcott and Gentzkow (2017) whose topicalfocus was classified in Bakshy, Messing, and Adamic (2015) as hard news. Facebook usage groups were constructedusing a tercile split on the number of visits respondents made to Facebook. Respondents who did not support Clintonor Trump were excluded.
Trump supporters. Visits to pro-Trump fake news websites increased from 2.8% among Clinton
supporters who do not use Facebook or use it relatively little to 16.1% in the middle tercile and
28.2% among the Clinton supporters who use Facebook most. The increase is even more dramatic
among Trump supporters, for whom visit rates increased from 16.3% in the lowest third of the
Facebook distribution to 35.6% in the middle third and 62.4% in the upper third. We observe a
similar pattern for visits to pro-Clinton fake news websites.6
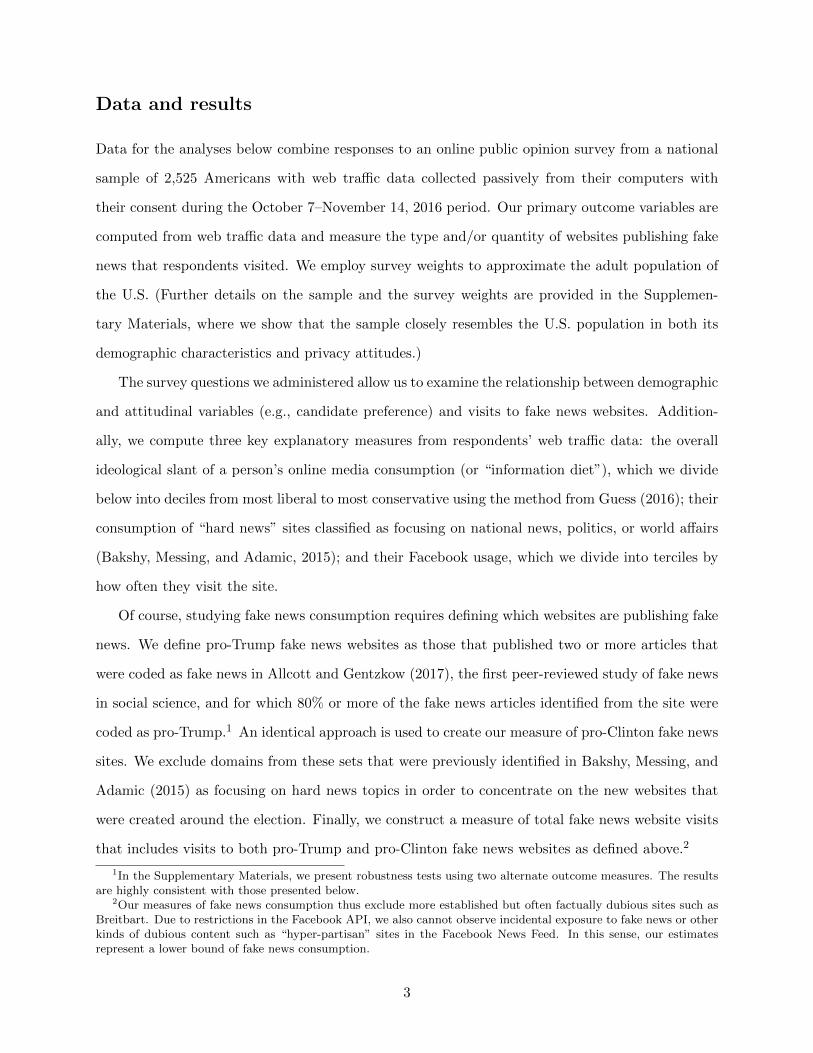
We can make a more direct inference about the role of Facebook by examining the URLs visited
by a respondent immediately prior to visiting a fake news website (similar to the approach used
in Flaxman, Goel, and Rao, 2016). As Figure 3 demonstrates, Facebook was among the three
previous sites visited by respondents in the prior thirty seconds for 22.1% of the articles from fake
6Table S12 in the Supplementary Materials confirms these di↵erences in the high Facebook usage groups arestatistically significant controlling for a number of demographic and political covariates.
8
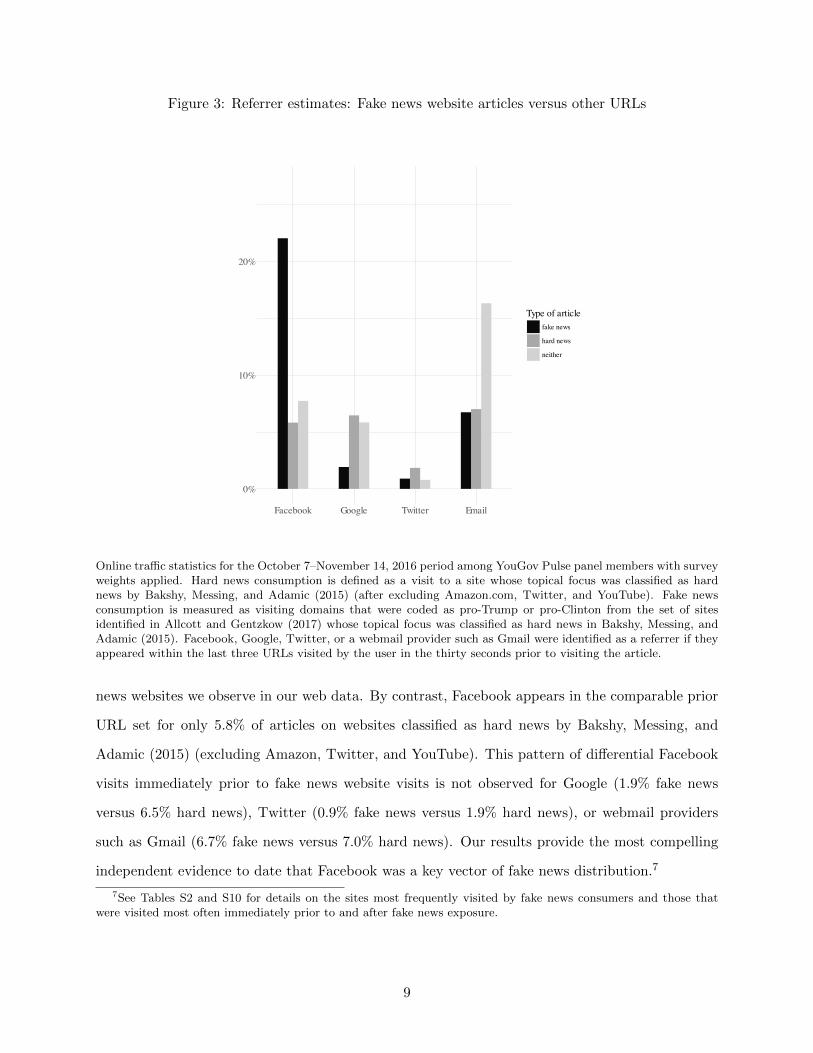
Figure 3: Referrer estimates: Fake news website articles versus other URLs
0%
10%
20%
Facebook Google Twitter Email
Type of articlefake news
hard news
neither
Online tra�c statistics for the October 7–November 14, 2016 period among YouGov Pulse panel members with surveyweights applied. Hard news consumption is defined as a visit to a site whose topical focus was classified as hardnews by Bakshy, Messing, and Adamic (2015) (after excluding Amazon.com, Twitter, and YouTube). Fake newsconsumption is measured as visiting domains that were coded as pro-Trump or pro-Clinton from the set of sitesidentified in Allcott and Gentzkow (2017) whose topical focus was classified as hard news in Bakshy, Messing, andAdamic (2015). Facebook, Google, Twitter, or a webmail provider such as Gmail were identified as a referrer if theyappeared within the last three URLs visited by the user in the thirty seconds prior to visiting the article.
news websites we observe in our web data. By contrast, Facebook appears in the comparable prior
URL set for only 5.8% of articles on websites classified as hard news by Bakshy, Messing, and
Adamic (2015) (excluding Amazon, Twitter, and YouTube). This pattern of di↵erential Facebook
visits immediately prior to fake news website visits is not observed for Google (1.9% fake news
versus 6.5% hard news), Twitter (0.9% fake news versus 1.9% hard news), or webmail providers
such as Gmail (6.7% fake news versus 7.0% hard news). Our results provide the most compelling
independent evidence to date that Facebook was a key vector of fake news distribution.7
7See Tables S2 and S10 for details on the sites most frequently visited by fake news consumers and those thatwere visited most often immediately prior to and after fake news exposure.
9
Fact-checking mismatch for fake news
The most prominent journalistic response to fake news and other forms of misleading or false
information is fact-checking, which has attracted a growing audience in recent years. We found
that one in four respondents (25.3%) read a fact-checking article from a dedicated national fact-
checking website at least once during the study period.
Recent evidence suggests that this new form of journalism can help inform voters (Flynn, Nyhan,
and Reifler, 2017). However, fact-checking may not e↵ectively reach people who have encountered
the false claims it debunks. Only 62% of respondents report being familiar with fact-checking.
Among those that are familiar with fact-checking, only 63% report having a “very” or “somewhat
favorable” view of fact-checking. Positive views of fact-checking are less common among fake news
consumers (48%), especially those who support Trump (24%).
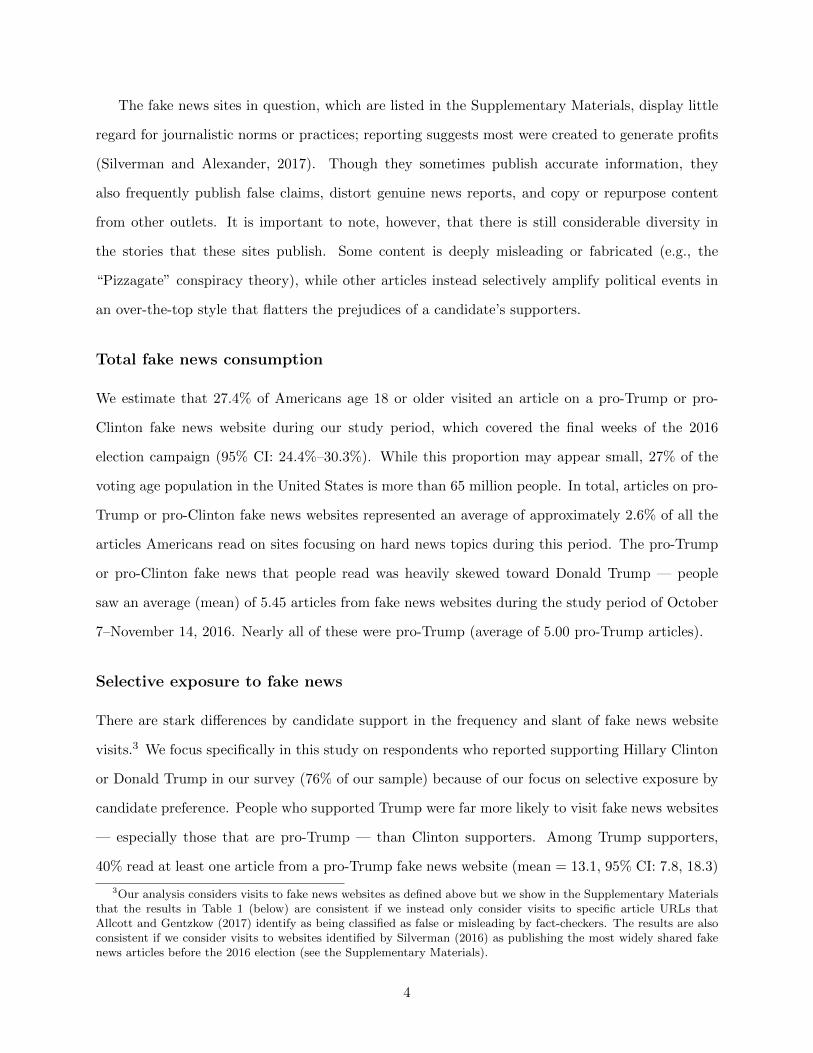
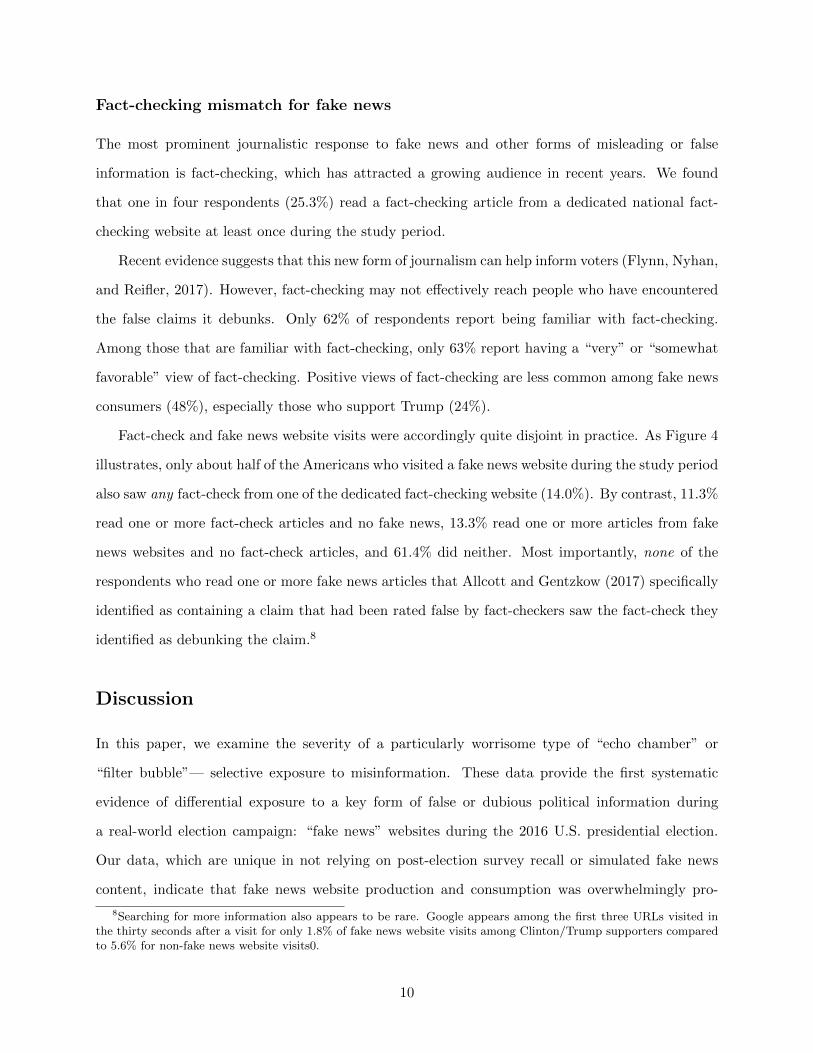
Fact-check and fake news website visits were accordingly quite disjoint in practice. As Figure 4
illustrates, only about half of the Americans who visited a fake news website during the study period
also saw any fact-check from one of the dedicated fact-checking website (14.0%). By contrast, 11.3%
read one or more fact-check articles and no fake news, 13.3% read one or more articles from fake
news websites and no fact-check articles, and 61.4% did neither. Most importantly, none of the
respondents who read one or more fake news articles that Allcott and Gentzkow (2017) specifically
identified as containing a claim that had been rated false by fact-checkers saw the fact-check they
identified as debunking the claim.8
Discussion
In this paper, we examine the severity of a particularly worrisome type of “echo chamber” or
“filter bubble”— selective exposure to misinformation. These data provide the first systematic
evidence of di↵erential exposure to a key form of false or dubious political information during
a real-world election campaign: “fake news” websites during the 2016 U.S. presidential election.
Our data, which are unique in not relying on post-election survey recall or simulated fake news
content, indicate that fake news website production and consumption was overwhelmingly pro-
8Searching for more information also appears to be rare. Google appears among the first three URLs visited inthe thirty seconds after a visit for only 1.8% of fake news website visits among Clinton/Trump supporters comparedto 5.6% for non-fake news website visits0.
10
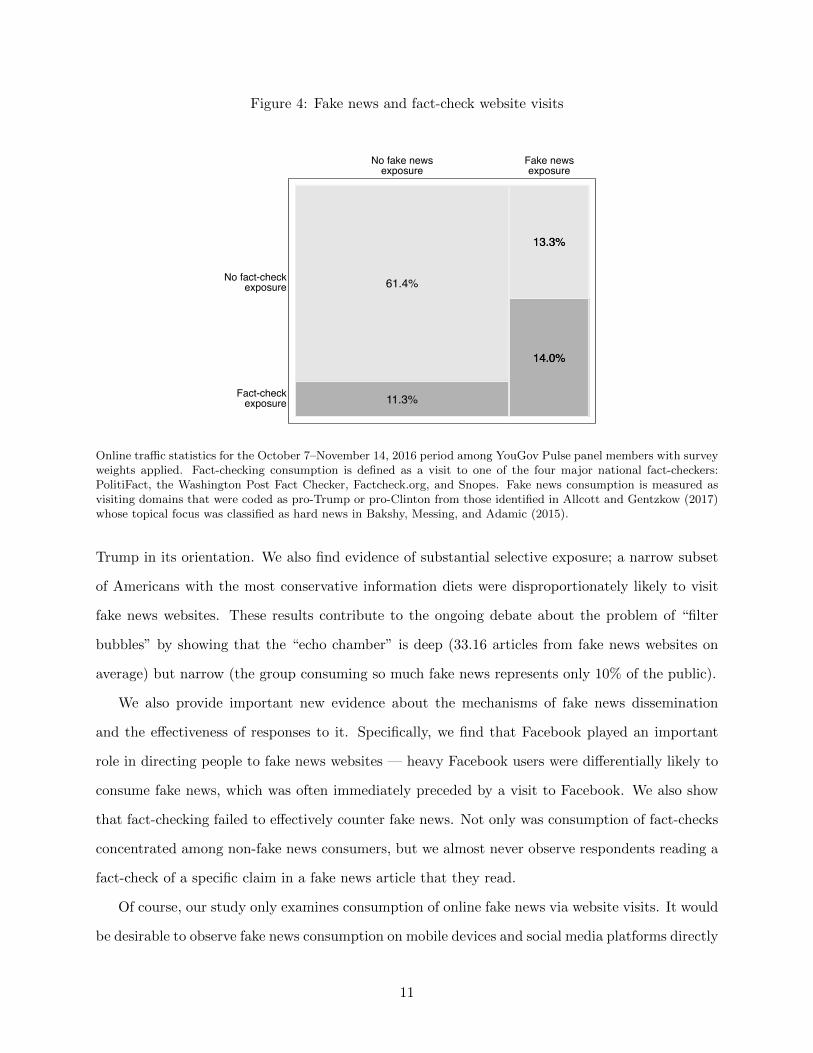
Figure 4: Fake news and fact-check website visits
11.3%
14.0%14.0%
61.4%
13.3%13.3%
No fact-checkexposure
Fact-checkexposure
No fake newsexposure
Fake newsexposure
Online tra�c statistics for the October 7–November 14, 2016 period among YouGov Pulse panel members with surveyweights applied. Fact-checking consumption is defined as a visit to one of the four major national fact-checkers:PolitiFact, the Washington Post Fact Checker, Factcheck.org, and Snopes. Fake news consumption is measured asvisiting domains that were coded as pro-Trump or pro-Clinton from those identified in Allcott and Gentzkow (2017)whose topical focus was classified as hard news in Bakshy, Messing, and Adamic (2015).
Trump in its orientation. We also find evidence of substantial selective exposure; a narrow subset
of Americans with the most conservative information diets were disproportionately likely to visit
fake news websites. These results contribute to the ongoing debate about the problem of “filter
bubbles” by showing that the “echo chamber” is deep (33.16 articles from fake news websites on
average) but narrow (the group consuming so much fake news represents only 10% of the public).
We also provide important new evidence about the mechanisms of fake news dissemination
and the e↵ectiveness of responses to it. Specifically, we find that Facebook played an important
role in directing people to fake news websites — heavy Facebook users were di↵erentially likely to
consume fake news, which was often immediately preceded by a visit to Facebook. We also show
that fact-checking failed to e↵ectively counter fake news. Not only was consumption of fact-checks
concentrated among non-fake news consumers, but we almost never observe respondents reading a
fact-check of a specific claim in a fake news article that they read.
Of course, our study only examines consumption of online fake news via website visits. It would
be desirable to observe fake news consumption on mobile devices and social media platforms directly
11
and to evaluate the e↵ects of exposure to misinformation on people’s factual beliefs and attitudes
toward candidates and parties. Future research should evaluate selective exposure to other forms
of hyper-politicized media including hyperpartisan Twitter feeds and Facebook groups, internet
forums such as Reddit, more established but often factually questionable websites like Breitbart,
and more traditional media like talk radio and cable news.
Future research should also seek to employ designs that allow us to assess the e↵ects of exposure
to fake news and other forms of misinformation, which may have pernicious consequences. While
fake news is unlikely to have changed the outcome of the 2016 election (Allcott and Gentzkow,
2017), exposure to it or similarly dubious and inflammatory content can still undermine the quality
of public debate, promote misperceptions, foster greater hostility toward political opponents, and
corrode trust in government and journalism. Nonetheless, these results underscore the importance
of directly studying selective exposure to fake news and other false and unsupported political con-
tent. Relatively few Americans are deeply interested in these extreme forms of misinformation, but
they are consumed in large quantities and disseminated widely on social media (see also Benkler
et al. 2017). These small groups can thus propel fabricated claims from their echo chambers to
widespread visibility, potentially intensifying polarization and negative a↵ect toward opposing can-
didates. This pattern represents an important development in political information consumption.
References
Allcott, Hunt, and Matthew Gentzkow. 2017. “Social Media and Fake News in the 2016 Election.” Journal
of Economic Perspectives 31 (2): 1–28.
Angrist, Joshua D., and Jorn-Ste↵en Pischke. 2009. Mostly Harmless Econometrics: An empiricist’s com-
panion. Princeton University Press.
Bakshy, Eytan, Solomon Messing, and Lada A. Adamic. 2015. “Exposure to ideologically diverse news and
opinion on Facebook.” Science 348 (6239): 1130–1132.
Barbera, Pablo, John T. Jost, Jonathan Nagler, Joshua A. Tucker, and Richard Bonneau. 2015. “Tweeting
From Left to Right: Is Online Political Communication More Than an Echo Chamber?” Psychological
Science 26 (10): 1531–1542.
Benkler, Yochai, Robert Faris, Hal Roberts, and Ethan Zuckerman. 2017. “Study: Breitbart-led right-wing
12
media ecosystem altered broader media agenda.” Columbia Journalism Review, March 3, 2017. Down-
loaded March 14, 2017 from http://www.cjr.org/analysis/breitbart-media-trump-harvard-study.
php.
Flaxman, Seth R., Sharad Goel, and Justin M. Rao. 2016. “Filter Bubbles, Echo Chambers, and Online
News Consumption.” Public Opinion Quarterly 80 (Special issue): 298–320.
Flynn, D.J., Brendan Nyhan, and Jason Reifler. 2017. “The Nature and Origins of Misperceptions: Un-
derstanding False and Unsupported Beliefs about Politics.” Advances in Political Psychology 38 (S1):
127–150.
Gentzkow, Matthew, and Jesse M. Shapiro. 2011. “Ideological segregation online and o✏ine.” Quarterly
Journal of Economics 126 (4): 1799–1839.
Gottfried, Je↵rey A., Bruce W. Hardy, Kenneth M. Winneg, and Kathleen Hall Jamieson. 2013. “Did Fact
Checking Matter in the 2012 Presidential Campaign?” American Behavioral Scientist 57 (11): 1558–1567.
Guess, Andrew M. 2016. “Media Choice and Moderation: Evidence from Online Tracking Data.” Un-
published manuscript. Downloaded May 26, 2017 from https://www.dropbox.com/s/uk005hhio3dysm8/
GuessJMP.pdf?dl=0.
Hart, William, Dolores Albarracın, Alice H. Eagly, Inge Brechan, Matthew J. Lindberg, and Lisa Merrill.
2009. “Feeling validated versus being correct: a meta-analysis of selective exposure to information.”
Psychological Bulletin 135 (4): 555.
Iyengar, Shanto, and Kyu S. Hahn. 2009. “Red media, blue media: Evidence of ideological selectivity in
media use.” Journal of Communication 59 (1): 19–39.
Iyengar, Shanto, Kyu S. Hahn, Jon A. Krosnick, and John Walker. 2008. “Selective exposure to campaign
communication: The role of anticipated agreement and issue public membership.” Journal of Politics
70 (01): 186–200.
Messing, Solomon, and Sean J. Westwood. 2014. “Selective exposure in the age of social media: Endorsements
trump partisan source a�liation when selecting news online.” Communication Research 41 (8): 1042–1063.
Pariser, Eli. 2011. The filter bubble: How the new personalized web is changing what we read and how we
think. Penguin.
Shin, Jieun, and Kjerstin Thorson. 2017. “Partisan Selective Sharing: The Biased Di↵usion of Fact-Checking
Messages on Social Media.” Journal of Communication.
13
Silverman, Craig. 2016. “This Analysis Shows How Fake Election News Stories Outperformed Real News On
Facebook.” Buzzfeed, November 16, 2016. Downloaded December 16, 2016 from https://www.buzzfeed.
com/craigsilverman/viral-fake-election-news-outperformed-real-news-on-facebook?utm_
term=.ohXvLeDzK#.cwwgb7EX0.
Silverman, Craig, and Jeremy Singer-Vine. 2016. “Most Americans Who See Fake News Believe It, New
Survey Says.” Buzzfeed, December 6, 2016. Downloaded December 16, 2016 from https://www.buzzfeed.
com/craigsilverman/fake-news-survey?utm_term=.lazQnopg3#.tbR2yvrL6.
Silverman, Craig, and Lawrence Alexander. 2017. “How Teens In The Balkans Are Duping Trump Sup-
porters With Fake News.” Buzzfeed, November 3, 2016. Downloaded April 1, 2017 from https://www.
buzzfeed.com/craigsilverman/how-macedonia-became-a-global-hub-for-pro-trump-misinfo?
utm_term=.uvYP3Eqzw#.prLdJqWP6.
Solon, Olivia. 2016. “Facebook’s failure: did fake news and polarized politics get Trump elected?”
The Guardian, November 10, 2016. Downloaded March 24, 2017 from https://www.theguardian.com/
technology/2016/nov/10/facebook-fake-news-election-conspiracy-theories.
Stroud, Natalie Jomini. 2008. “Media use and political predispositions: Revisiting the concept of selective
exposure.” Political Behavior 30 (3): 341–366.
Sunstein, Cass R. 2001. Republic.com. Princeton University Press.
14
Supplementary Materials
Materials and Methods
In this section, we provide more details about key elements of our coding and estimation procedures.
Sample and data collection details
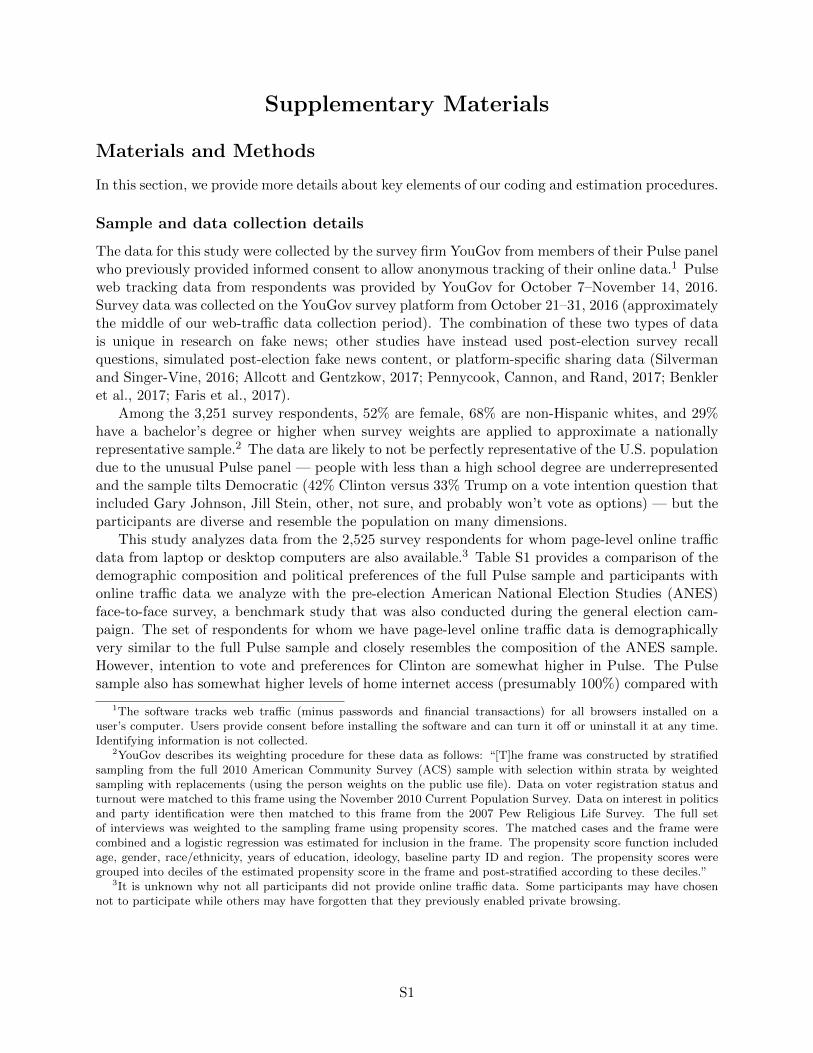
The data for this study were collected by the survey firm YouGov from members of their Pulse panelwho previously provided informed consent to allow anonymous tracking of their online data.1 Pulseweb tracking data from respondents was provided by YouGov for October 7–November 14, 2016.Survey data was collected on the YouGov survey platform from October 21–31, 2016 (approximatelythe middle of our web-tra�c data collection period). The combination of these two types of datais unique in research on fake news; other studies have instead used post-election survey recallquestions, simulated post-election fake news content, or platform-specific sharing data (Silvermanand Singer-Vine, 2016; Allcott and Gentzkow, 2017; Pennycook, Cannon, and Rand, 2017; Benkleret al., 2017; Faris et al., 2017).
Among the 3,251 survey respondents, 52% are female, 68% are non-Hispanic whites, and 29%have a bachelor’s degree or higher when survey weights are applied to approximate a nationallyrepresentative sample.2 The data are likely to not be perfectly representative of the U.S. populationdue to the unusual Pulse panel — people with less than a high school degree are underrepresentedand the sample tilts Democratic (42% Clinton versus 33% Trump on a vote intention question thatincluded Gary Johnson, Jill Stein, other, not sure, and probably won’t vote as options) — but theparticipants are diverse and resemble the population on many dimensions.
This study analyzes data from the 2,525 survey respondents for whom page-level online tra�cdata from laptop or desktop computers are also available.3 Table S1 provides a comparison of thedemographic composition and political preferences of the full Pulse sample and participants withonline tra�c data we analyze with the pre-election American National Election Studies (ANES)face-to-face survey, a benchmark study that was also conducted during the general election cam-paign. The set of respondents for whom we have page-level online tra�c data is demographicallyvery similar to the full Pulse sample and closely resembles the composition of the ANES sample.However, intention to vote and preferences for Clinton are somewhat higher in Pulse. The Pulsesample also has somewhat higher levels of home internet access (presumably 100%) compared with
1The software tracks web tra�c (minus passwords and financial transactions) for all browsers installed on auser’s computer. Users provide consent before installing the software and can turn it o↵ or uninstall it at any time.Identifying information is not collected.
2YouGov describes its weighting procedure for these data as follows: “[T]he frame was constructed by stratifiedsampling from the full 2010 American Community Survey (ACS) sample with selection within strata by weightedsampling with replacements (using the person weights on the public use file). Data on voter registration status andturnout were matched to this frame using the November 2010 Current Population Survey. Data on interest in politicsand party identification were then matched to this frame from the 2007 Pew Religious Life Survey. The full setof interviews was weighted to the sampling frame using propensity scores. The matched cases and the frame werecombined and a logistic regression was estimated for inclusion in the frame. The propensity score function includedage, gender, race/ethnicity, years of education, ideology, baseline party ID and region. The propensity scores weregrouped into deciles of the estimated propensity score in the frame and post-stratified according to these deciles.”
3It is unknown why not all participants did not provide online tra�c data. Some participants may have chosennot to participate while others may have forgotten that they previously enabled private browsing.
S1
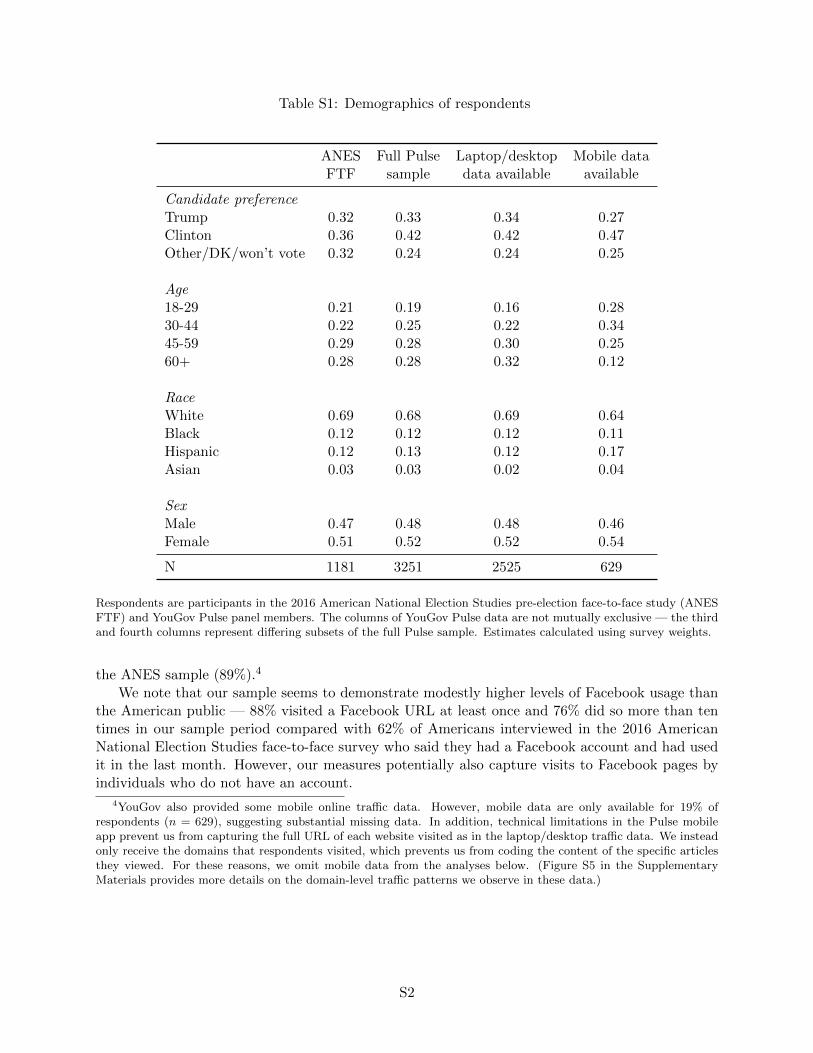
Table S1: Demographics of respondents
ANES Full Pulse Laptop/desktop Mobile dataFTF sample data available available
Candidate preferenceTrump 0.32 0.33 0.34 0.27Clinton 0.36 0.42 0.42 0.47Other/DK/won’t vote 0.32 0.24 0.24 0.25
Age18-29 0.21 0.19 0.16 0.2830-44 0.22 0.25 0.22 0.3445-59 0.29 0.28 0.30 0.2560+ 0.28 0.28 0.32 0.12
RaceWhite 0.69 0.68 0.69 0.64Black 0.12 0.12 0.12 0.11Hispanic 0.12 0.13 0.12 0.17Asian 0.03 0.03 0.02 0.04
SexMale 0.47 0.48 0.48 0.46Female 0.51 0.52 0.52 0.54
N 1181 3251 2525 629
Respondents are participants in the 2016 American National Election Studies pre-election face-to-face study (ANESFTF) and YouGov Pulse panel members. The columns of YouGov Pulse data are not mutually exclusive — the thirdand fourth columns represent di↵ering subsets of the full Pulse sample. Estimates calculated using survey weights.
the ANES sample (89%).4
We note that our sample seems to demonstrate modestly higher levels of Facebook usage thanthe American public — 88% visited a Facebook URL at least once and 76% did so more than tentimes in our sample period compared with 62% of Americans interviewed in the 2016 AmericanNational Election Studies face-to-face survey who said they had a Facebook account and had usedit in the last month. However, our measures potentially also capture visits to Facebook pages byindividuals who do not have an account.
4YouGov also provided some mobile online tra�c data. However, mobile data are only available for 19% ofrespondents (n = 629), suggesting substantial missing data. In addition, technical limitations in the Pulse mobileapp prevent us from capturing the full URL of each website visited as in the laptop/desktop tra�c data. We insteadonly receive the domains that respondents visited, which prevents us from coding the content of the specific articlesthey viewed. For these reasons, we omit mobile data from the analyses below. (Figure S5 in the SupplementaryMaterials provides more details on the domain-level tra�c patterns we observe in these data.)
S2
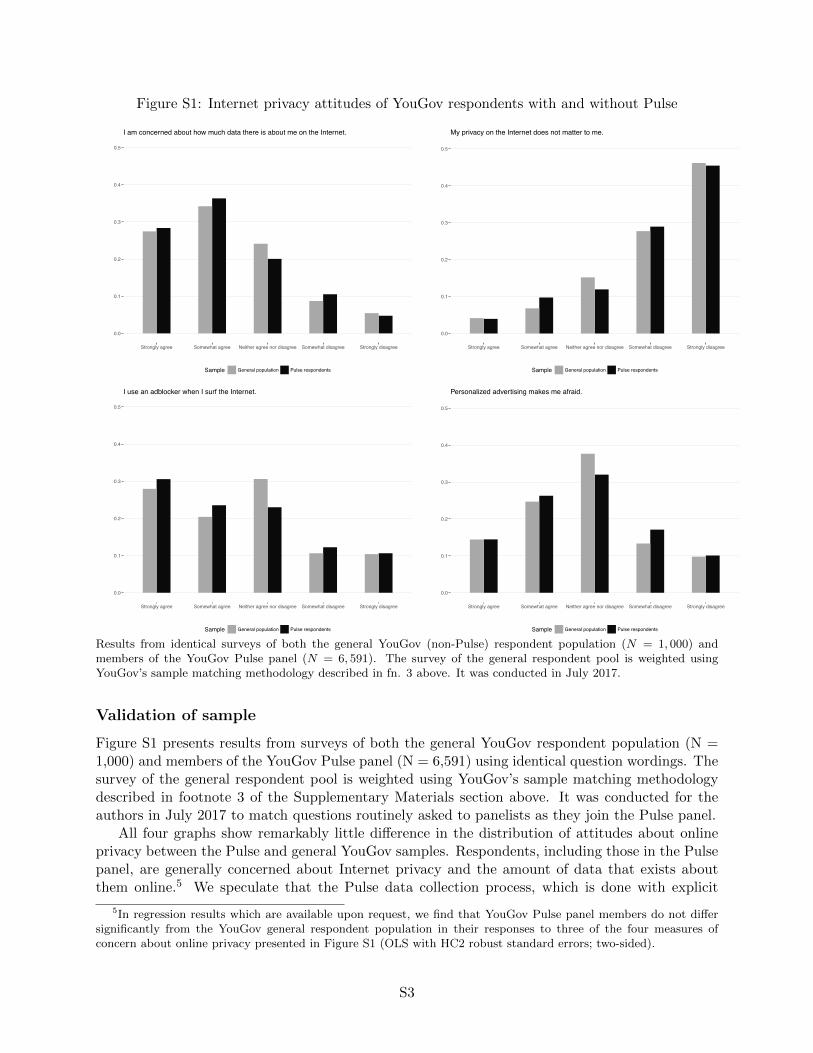
Figure S1: Internet privacy attitudes of YouGov respondents with and without Pulse
0.0
0.1
0.2
0.3
0.4
0.5
Strongly agree Somewhat agree Neither agree nor disagree Somewhat disagree Strongly disagree
Sample General population Pulse respondents
I am concerned about how much data there is about me on the Internet.
0.0
0.1
0.2
0.3
0.4
0.5
Strongly agree Somewhat agree Neither agree nor disagree Somewhat disagree Strongly disagree
Sample General population Pulse respondents
My privacy on the Internet does not matter to me.
0.0
0.1
0.2
0.3
0.4
0.5
Strongly agree Somewhat agree Neither agree nor disagree Somewhat disagree Strongly disagree
Sample General population Pulse respondents
I use an adblocker when I surf the Internet.
0.0
0.1
0.2
0.3
0.4
0.5
Strongly agree Somewhat agree Neither agree nor disagree Somewhat disagree Strongly disagree
Sample General population Pulse respondents
Personalized advertising makes me afraid.
Results from identical surveys of both the general YouGov (non-Pulse) respondent population (N = 1, 000) andmembers of the YouGov Pulse panel (N = 6, 591). The survey of the general respondent pool is weighted usingYouGov’s sample matching methodology described in fn. 3 above. It was conducted in July 2017.
Validation of sample
Figure S1 presents results from surveys of both the general YouGov respondent population (N =1,000) and members of the YouGov Pulse panel (N = 6,591) using identical question wordings. Thesurvey of the general respondent pool is weighted using YouGov’s sample matching methodologydescribed in footnote 3 of the Supplementary Materials section above. It was conducted for theauthors in July 2017 to match questions routinely asked to panelists as they join the Pulse panel.
All four graphs show remarkably little di↵erence in the distribution of attitudes about onlineprivacy between the Pulse and general YouGov samples. Respondents, including those in the Pulsepanel, are generally concerned about Internet privacy and the amount of data that exists aboutthem online.5 We speculate that the Pulse data collection process, which is done with explicit
5In regression results which are available upon request, we find that YouGov Pulse panel members do not di↵ersignificantly from the YouGov general respondent population in their responses to three of the four measures ofconcern about online privacy presented in Figure S1 (OLS with HC2 robust standard errors; two-sided).
S3
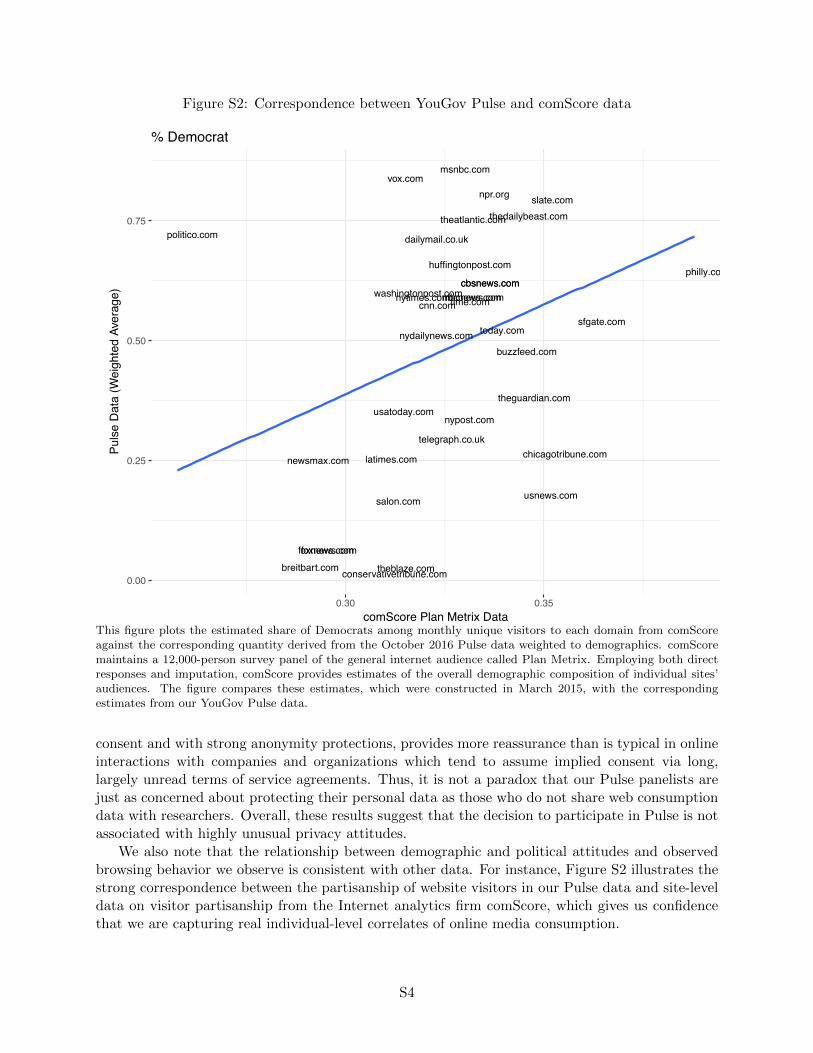
Figure S2: Correspondence between YouGov Pulse and comScore data
breitbart.com
buzzfeed.com
cbsnews.comcbsnews.com
chicagotribune.com
cnn.com
conservativetribune.com
dailymail.co.uk
foxnews.comfoxnews.com
huffingtonpost.com
latimes.com
msnbc.com
nbcnews.comnbcnews.com
newsmax.com
npr.org
nydailynews.com
nypost.com
nytimes.com
philly.com
politico.com
salon.com
sfgate.com
slate.com
telegraph.co.uk
theatlantic.com
theblaze.com
thedailybeast.com
theguardian.com
time.com
today.com
usatoday.com
usnews.com
vox.com
washingtonpost.com
0.00
0.25
0.50
0.75
0.30 0.35comScore Plan Metrix Data
Puls
e D
ata
(Wei
ghte
d Av
erag
e)
% Democrat
This figure plots the estimated share of Democrats among monthly unique visitors to each domain from comScoreagainst the corresponding quantity derived from the October 2016 Pulse data weighted to demographics. comScoremaintains a 12,000-person survey panel of the general internet audience called Plan Metrix. Employing both directresponses and imputation, comScore provides estimates of the overall demographic composition of individual sites’audiences. The figure compares these estimates, which were constructed in March 2015, with the correspondingestimates from our YouGov Pulse data.
consent and with strong anonymity protections, provides more reassurance than is typical in onlineinteractions with companies and organizations which tend to assume implied consent via long,largely unread terms of service agreements. Thus, it is not a paradox that our Pulse panelists arejust as concerned about protecting their personal data as those who do not share web consumptiondata with researchers. Overall, these results suggest that the decision to participate in Pulse is notassociated with highly unusual privacy attitudes.
We also note that the relationship between demographic and political attitudes and observedbrowsing behavior we observe is consistent with other data. For instance, Figure S2 illustrates thestrong correspondence between the partisanship of website visitors in our Pulse data and site-leveldata on visitor partisanship from the Internet analytics firm comScore, which gives us confidencethat we are capturing real individual-level correlates of online media consumption.
S4
Processing online tra�c data
We processed the online tra�c data using the following procedure. The URLs visited by Pulseparticipants were first purged of anchor links (part of a URL beginning with “#” and referring toa specific section within a page). Once pre-processing was completed, sequential duplicates (i.e.,visits to the same page by the same respondent on the same day that occurred immediately insequence) were removed. In this way, we ensured that automatic reloads (or clicks to certain partsof the same page) would not count as separate visits in any of our measures.
Estimating fake news consumption
We constructed our measures of fake news consumption using the following procedure:
– Begin with the list of fake news articles identified in Allcott and Gentzkow (2017) found bynonpartisan fact-checking organizations to be false.
– Filter out domains with only a single fact-checked article in the original list, leaving thosewith two or more identified fake news articles.
– Classify the resulting list of 289 domains as pro-Trump or pro-Clinton “fake news” websitesfor the purposes of this analysis. Code domains as pro-Trump (pro-Clinton) if Allcott andGentzkow (2017) coded 80% or more of the identified fake news articles from that domain aspro-Trump (pro-Clinton).
– Drop any domains that are not strictly “fake news.” To determine this, we remove those sitespreviously identified by Bakshy, Messing, and Adamic (2015) as focusing on hard news topicsvia machine learning classification.6
– The top 25 resulting “fake news” domains by tra�c in the Pulse data are as follows:7 ijr.com,bipartisanreport.com, angrypatriotmovement.com, redstatewatcher.com, endingthefed.com, conservativedailypost.com, usherald.com, chicksontheright.com, dailywire.com,truthfeed.com, tmn.today, libertywritersnews.com, yesimright.com, therealstrategy.com, donaldtrumpnews.co, worldnewspolitics.com, everynewshere.com, ipatriot.com,usapoliticstoday.com, usanewsflash.com, worldpoliticus.com, ihavethetruth.com,prntly.com, fury.news, ilovemyfreedom.org
– Create binary and count indicators for visits to pro-Clinton and pro-Trump fake news websites.
Coding any measure like this requires classifying di�cult cases. In Tables S5 and S6 below,we show that the conclusions in Table 1 are robust to excluding Independent Journal Review, aconspiracy-oriented site seeking mainstream credibility (Borchers, 2017) that is included in our fakenews measure, or to including Breitbart, a high-profile site that frequently tra�cs in conspiracytheories and inflammatory claims (Bellware, 2016) but is excluded from our fake news measure
6This designation is based on the topical content of these sites at the time of the Bakshy, Messing, andAdamic study, not the validity of the information on the sites in question (which is often dubious). The domainswe exclude from the list of fake news sites include YouTube (https://www.youtube.com), Empire News (http://empirenews.net), Breitbart (http://www.breitbart.com), Infowars (https://www.infowars.com), Daily Caller(http://dailycaller.com), D.C. Clothesline (http://www.dcclothesline.com), Twitchy (http://twitchy.com),Liberty News (http://libertynews.com), Sons of Liberty News (http://sonsoflibertymedia.com), and The Polit-ical Insider (http://thepoliticalinsider.com).
7See Table S2 for the full list of domains.
S5
because it was classified as an existing “hard news” site in its topical focus by Bakshy, Messing,and Adamic (2015).
Our estimates of fake news consumption are broadly consistent with two post-election surveysabout fake news (Silverman and Singer-Vine, 2016; Allcott and Gentzkow, 2017), which found thatapproximately 10–25% of Americans reported seeing various specific fake news headlines (manyof these would have been viewed on social media or other platforms that would not be recordedas a fake news visit in our online tra�c data). However, such retrospections are vulnerable toerrors in memory — people may claim to remember something they never saw or forget an articlethey actually did see. Our passive measurement approach o↵ers much more precise and accurateinformation about actual fake news exposure.
To further validate our results, we demonstrate below that the results in Table 1 are consis-tent using two alternate outcome measures. Table S7 presents results using visits to the websitesidentified by Silverman (2016) as publishing the most widely shared fake news stories prior to the2016 election (excluding those existing sites previously classified by Bakshy, Messing, and Adamic(2015) as hard news) and Table S8 presents results using only visits to the specific URLs of falsearticles identified by Allcott and Gentzkow (2017) rather than the website-level measure describedabove.
S6
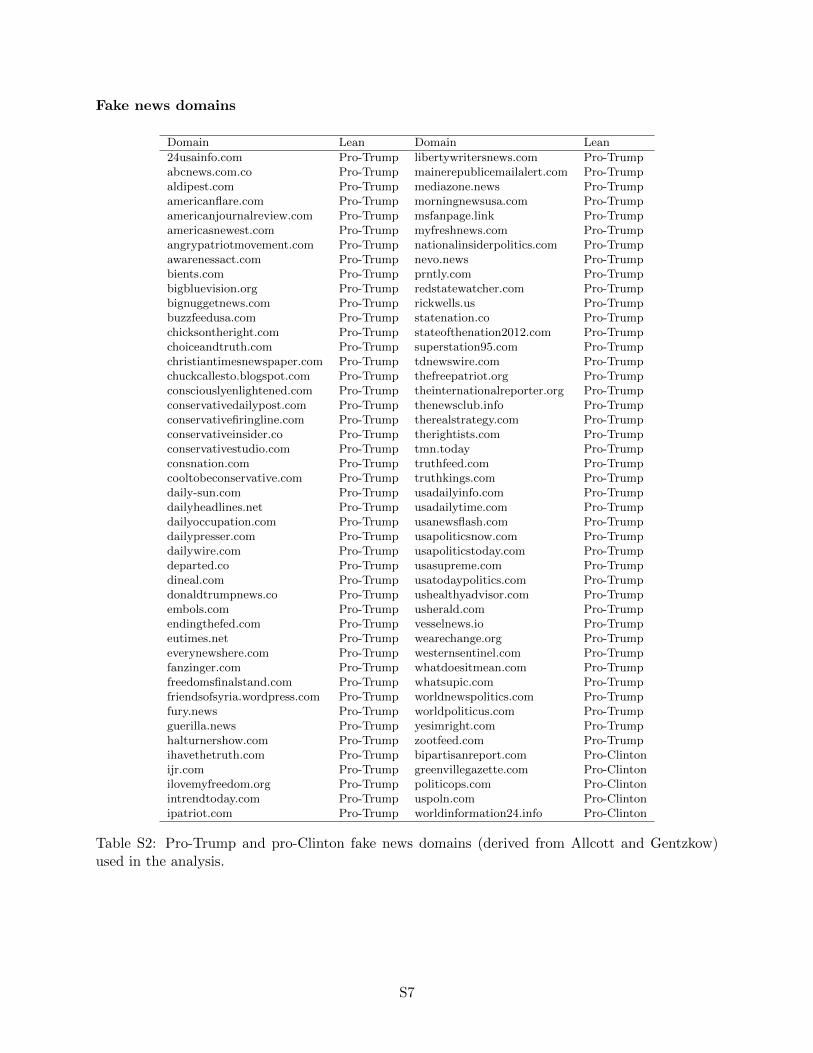
Fake news domains
Domain Lean Domain Lean24usainfo.com Pro-Trump libertywritersnews.com Pro-Trumpabcnews.com.co Pro-Trump mainerepublicemailalert.com Pro-Trumpaldipest.com Pro-Trump mediazone.news Pro-Trumpamericanflare.com Pro-Trump morningnewsusa.com Pro-Trumpamericanjournalreview.com Pro-Trump msfanpage.link Pro-Trumpamericasnewest.com Pro-Trump myfreshnews.com Pro-Trumpangrypatriotmovement.com Pro-Trump nationalinsiderpolitics.com Pro-Trumpawarenessact.com Pro-Trump nevo.news Pro-Trumpbients.com Pro-Trump prntly.com Pro-Trumpbigbluevision.org Pro-Trump redstatewatcher.com Pro-Trumpbignuggetnews.com Pro-Trump rickwells.us Pro-Trumpbuzzfeedusa.com Pro-Trump statenation.co Pro-Trumpchicksontheright.com Pro-Trump stateofthenation2012.com Pro-Trumpchoiceandtruth.com Pro-Trump superstation95.com Pro-Trumpchristiantimesnewspaper.com Pro-Trump tdnewswire.com Pro-Trumpchuckcallesto.blogspot.com Pro-Trump thefreepatriot.org Pro-Trumpconsciouslyenlightened.com Pro-Trump theinternationalreporter.org Pro-Trumpconservativedailypost.com Pro-Trump thenewsclub.info Pro-Trumpconservativefiringline.com Pro-Trump therealstrategy.com Pro-Trumpconservativeinsider.co Pro-Trump therightists.com Pro-Trumpconservativestudio.com Pro-Trump tmn.today Pro-Trumpconsnation.com Pro-Trump truthfeed.com Pro-Trumpcooltobeconservative.com Pro-Trump truthkings.com Pro-Trumpdaily-sun.com Pro-Trump usadailyinfo.com Pro-Trumpdailyheadlines.net Pro-Trump usadailytime.com Pro-Trumpdailyoccupation.com Pro-Trump usanewsflash.com Pro-Trumpdailypresser.com Pro-Trump usapoliticsnow.com Pro-Trumpdailywire.com Pro-Trump usapoliticstoday.com Pro-Trumpdeparted.co Pro-Trump usasupreme.com Pro-Trumpdineal.com Pro-Trump usatodaypolitics.com Pro-Trumpdonaldtrumpnews.co Pro-Trump ushealthyadvisor.com Pro-Trumpembols.com Pro-Trump usherald.com Pro-Trumpendingthefed.com Pro-Trump vesselnews.io Pro-Trumpeutimes.net Pro-Trump wearechange.org Pro-Trumpeverynewshere.com Pro-Trump westernsentinel.com Pro-Trumpfanzinger.com Pro-Trump whatdoesitmean.com Pro-Trumpfreedomsfinalstand.com Pro-Trump whatsupic.com Pro-Trumpfriendsofsyria.wordpress.com Pro-Trump worldnewspolitics.com Pro-Trumpfury.news Pro-Trump worldpoliticus.com Pro-Trumpguerilla.news Pro-Trump yesimright.com Pro-Trumphalturnershow.com Pro-Trump zootfeed.com Pro-Trumpihavethetruth.com Pro-Trump bipartisanreport.com Pro-Clintonijr.com Pro-Trump greenvillegazette.com Pro-Clintonilovemyfreedom.org Pro-Trump politicops.com Pro-Clintonintrendtoday.com Pro-Trump uspoln.com Pro-Clintonipatriot.com Pro-Trump worldinformation24.info Pro-Clinton
Table S2: Pro-Trump and pro-Clinton fake news domains (derived from Allcott and Gentzkow)used in the analysis.
S7
Estimating “hard news” consumption
We estimate “hard news” consumption using visits to websites classified as focusing on nationalnews, politics, world a↵airs, or similar by Bakshy, Messing, and Adamic (2015). (They define“soft” news as stories that focus on sports, entertainment, travel, or similar.) We further excludethe websites of Amazon, Twitter, and YouTube from their list of hard news sites. While thesesites may contain hard news content, they are not primarily news publishers and thus not the mainfocus of our analysis.
Total online news consumption is measured as the sum of the number of visits to hard news sites,fake news sites, and fact-checking websites (identified below). The proportion of visits to election-relevant fake news was then calculated by dividing total visits to pro-Clinton or pro-Trump fakenews by the total online news consumption measure.
Coding referral websites
Referrals to articles were estimated as follows. For each individual respondent, we tabulated thethree pages visited immediately prior to each web visit logged in the Pulse data. We additionallyidentified the pages seen within the previous 15, 30, and 45 seconds of each web visit. Usingthese measures, we coded a visit to one of our designated referring domains (Facebook, Google,Twitter, or a webmail provider [gmail.com, mail.google.com, mail.yahoo.com, mail.live.com, orhotmail.com]) within the previous three URLs in a given user’s clickstream and within the giventime interval (15–45 seconds depending on the variant reported) as a referral. We then comparedthe proportion of times these sites appeared as referrers to fake versus non-fake news URLs.
Estimating fact-checking consumption
Fact-checking consumption is measured using visits to the four major national fact-checkers: Politi-Fact (including state a�liates included on the main PolitiFact domain), the Washington Post FactChecker, Factcheck.org, and Snopes (which specializes in rumors and urban legends and is thusespecially relevant to the fake news phenomenon). We focus on visits to actual articles and thusdo not include visits to a fact-checking site’s homepage or to search pages within a site.
S8
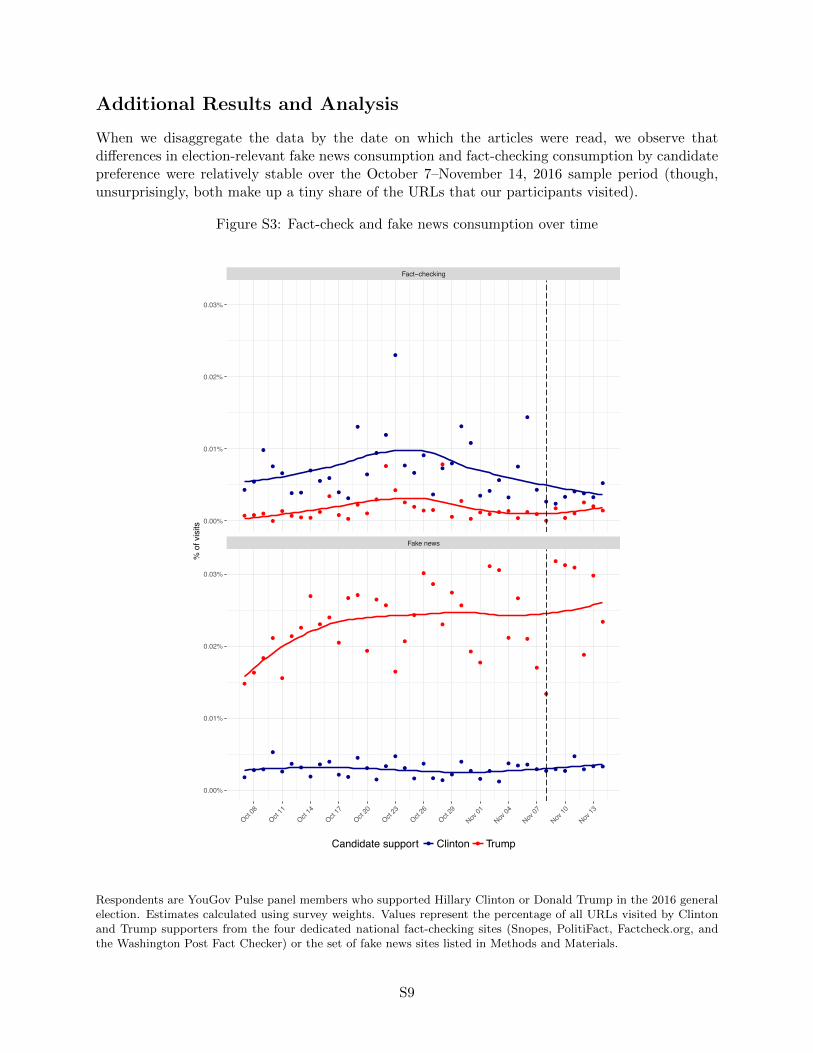
Additional Results and Analysis
When we disaggregate the data by the date on which the articles were read, we observe thatdi↵erences in election-relevant fake news consumption and fact-checking consumption by candidatepreference were relatively stable over the October 7–November 14, 2016 sample period (though,unsurprisingly, both make up a tiny share of the URLs that our participants visited).
Figure S3: Fact-check and fake news consumption over time
●
●
●
●
●
●
●
●
●
●
●
●
●
●
●
●
●
●
●
●●
●
●
●
●
●
●
●
●
●
●
●
●
●
●
●
●
●
●
●
●
●
●● ●
●
●
●
●
●
●
●
●
●
●
●
●
●
●
●
●
●
●
●
●
●
●●
●
●
●
●
●
●
●
●
●
●
●
●
●
●
●
●
●
●
●
●
●
●
●
●
●
●
●
●
●
●
●
●
●
●
●
●
●
●
●
●
●
●
●
●
●
●
●
●
●
●
●
●
●
●
●
●
●
●
●
●
●
●
●
●
●
●
●
●
●
●
●
●
●
●
●
●
●
●
●
●
●
●
●
●
●
●
●
●
Fake news
Fact−checking
Oct 08
Oct 11
Oct 14
Oct 17
Oct 20
Oct 23
Oct 26
Oct 29
Nov 01
Nov 04
Nov 07
Nov 10
Nov 13
0.00%
0.01%
0.02%
0.03%
0.00%
0.01%
0.02%
0.03%
% o
f vis
its
Candidate support ● ●Clinton Trump
Respondents are YouGov Pulse panel members who supported Hillary Clinton or Donald Trump in the 2016 generalelection. Estimates calculated using survey weights. Values represent the percentage of all URLs visited by Clintonand Trump supporters from the four dedicated national fact-checking sites (Snopes, PolitiFact, Factcheck.org, andthe Washington Post Fact Checker) or the set of fake news sites listed in Methods and Materials.
S9
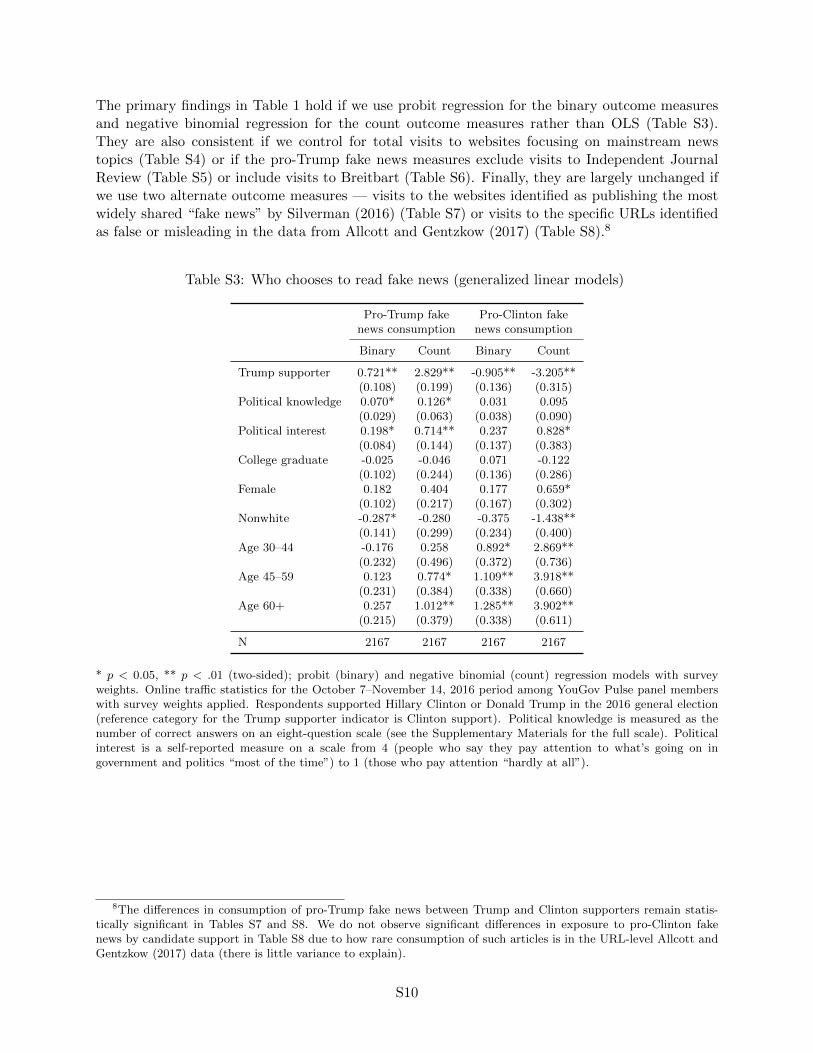
The primary findings in Table 1 hold if we use probit regression for the binary outcome measuresand negative binomial regression for the count outcome measures rather than OLS (Table S3).They are also consistent if we control for total visits to websites focusing on mainstream newstopics (Table S4) or if the pro-Trump fake news measures exclude visits to Independent JournalReview (Table S5) or include visits to Breitbart (Table S6). Finally, they are largely unchanged ifwe use two alternate outcome measures — visits to the websites identified as publishing the mostwidely shared “fake news” by Silverman (2016) (Table S7) or visits to the specific URLs identifiedas false or misleading in the data from Allcott and Gentzkow (2017) (Table S8).8
Table S3: Who chooses to read fake news (generalized linear models)
Pro-Trump fake Pro-Clinton fakenews consumption news consumption
Binary Count Binary Count
Trump supporter 0.721** 2.829** -0.905** -3.205**(0.108) (0.199) (0.136) (0.315)
Political knowledge 0.070* 0.126* 0.031 0.095(0.029) (0.063) (0.038) (0.090)
Political interest 0.198* 0.714** 0.237 0.828*(0.084) (0.144) (0.137) (0.383)
College graduate -0.025 -0.046 0.071 -0.122(0.102) (0.244) (0.136) (0.286)
Female 0.182 0.404 0.177 0.659*(0.102) (0.217) (0.167) (0.302)
Nonwhite -0.287* -0.280 -0.375 -1.438**(0.141) (0.299) (0.234) (0.400)
Age 30–44 -0.176 0.258 0.892* 2.869**(0.232) (0.496) (0.372) (0.736)
Age 45–59 0.123 0.774* 1.109** 3.918**(0.231) (0.384) (0.338) (0.660)
Age 60+ 0.257 1.012** 1.285** 3.902**(0.215) (0.379) (0.338) (0.611)
N 2167 2167 2167 2167
* p < 0.05, ** p < .01 (two-sided); probit (binary) and negative binomial (count) regression models with surveyweights. Online tra�c statistics for the October 7–November 14, 2016 period among YouGov Pulse panel memberswith survey weights applied. Respondents supported Hillary Clinton or Donald Trump in the 2016 general election(reference category for the Trump supporter indicator is Clinton support). Political knowledge is measured as thenumber of correct answers on an eight-question scale (see the Supplementary Materials for the full scale). Politicalinterest is a self-reported measure on a scale from 4 (people who say they pay attention to what’s going on ingovernment and politics “most of the time”) to 1 (those who pay attention “hardly at all”).
8The di↵erences in consumption of pro-Trump fake news between Trump and Clinton supporters remain statis-tically significant in Tables S7 and S8. We do not observe significant di↵erences in exposure to pro-Clinton fakenews by candidate support in Table S8 due to how rare consumption of such articles is in the URL-level Allcott andGentzkow (2017) data (there is little variance to explain).
S10
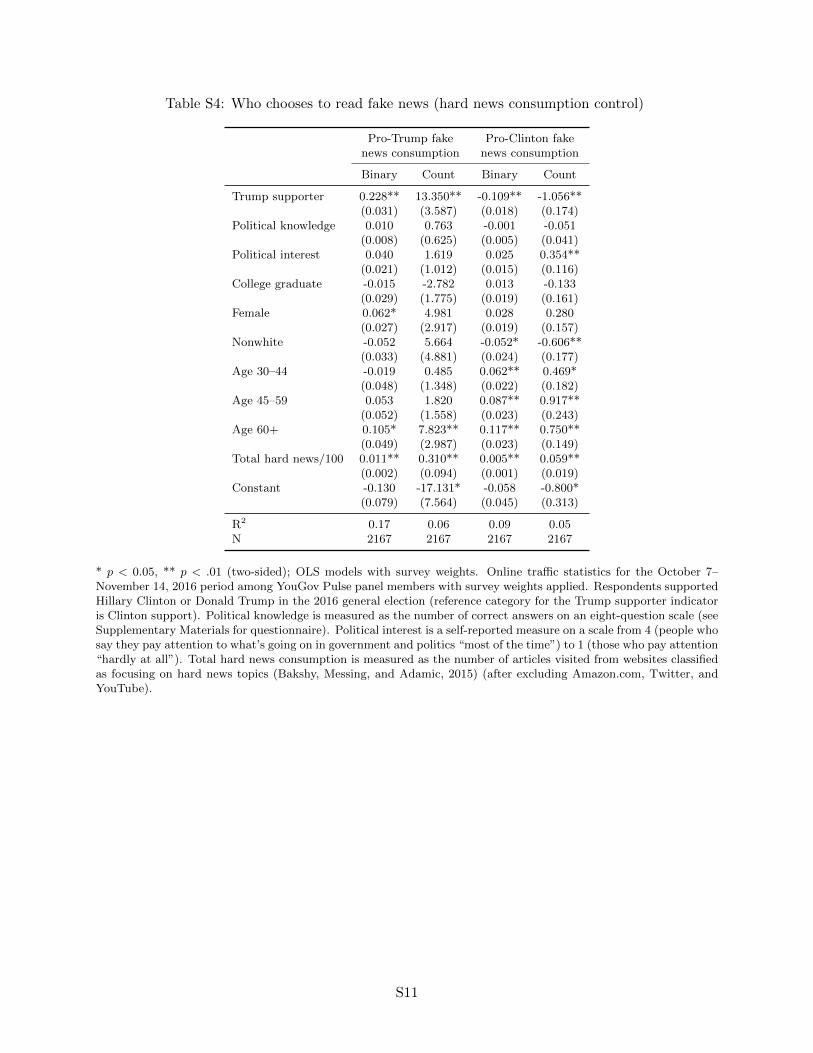
Table S4: Who chooses to read fake news (hard news consumption control)
Pro-Trump fake Pro-Clinton fakenews consumption news consumption
Binary Count Binary Count
Trump supporter 0.228** 13.350** -0.109** -1.056**(0.031) (3.587) (0.018) (0.174)
Political knowledge 0.010 0.763 -0.001 -0.051(0.008) (0.625) (0.005) (0.041)
Political interest 0.040 1.619 0.025 0.354**(0.021) (1.012) (0.015) (0.116)
College graduate -0.015 -2.782 0.013 -0.133(0.029) (1.775) (0.019) (0.161)
Female 0.062* 4.981 0.028 0.280(0.027) (2.917) (0.019) (0.157)
Nonwhite -0.052 5.664 -0.052* -0.606**(0.033) (4.881) (0.024) (0.177)
Age 30–44 -0.019 0.485 0.062** 0.469*(0.048) (1.348) (0.022) (0.182)
Age 45–59 0.053 1.820 0.087** 0.917**(0.052) (1.558) (0.023) (0.243)
Age 60+ 0.105* 7.823** 0.117** 0.750**(0.049) (2.987) (0.023) (0.149)
Total hard news/100 0.011** 0.310** 0.005** 0.059**(0.002) (0.094) (0.001) (0.019)
Constant -0.130 -17.131* -0.058 -0.800*(0.079) (7.564) (0.045) (0.313)
R2 0.17 0.06 0.09 0.05N 2167 2167 2167 2167
* p < 0.05, ** p < .01 (two-sided); OLS models with survey weights. Online tra�c statistics for the October 7–November 14, 2016 period among YouGov Pulse panel members with survey weights applied. Respondents supportedHillary Clinton or Donald Trump in the 2016 general election (reference category for the Trump supporter indicatoris Clinton support). Political knowledge is measured as the number of correct answers on an eight-question scale (seeSupplementary Materials for questionnaire). Political interest is a self-reported measure on a scale from 4 (people whosay they pay attention to what’s going on in government and politics “most of the time”) to 1 (those who pay attention“hardly at all”). Total hard news consumption is measured as the number of articles visited from websites classifiedas focusing on hard news topics (Bakshy, Messing, and Adamic, 2015) (after excluding Amazon.com, Twitter, andYouTube).
S11
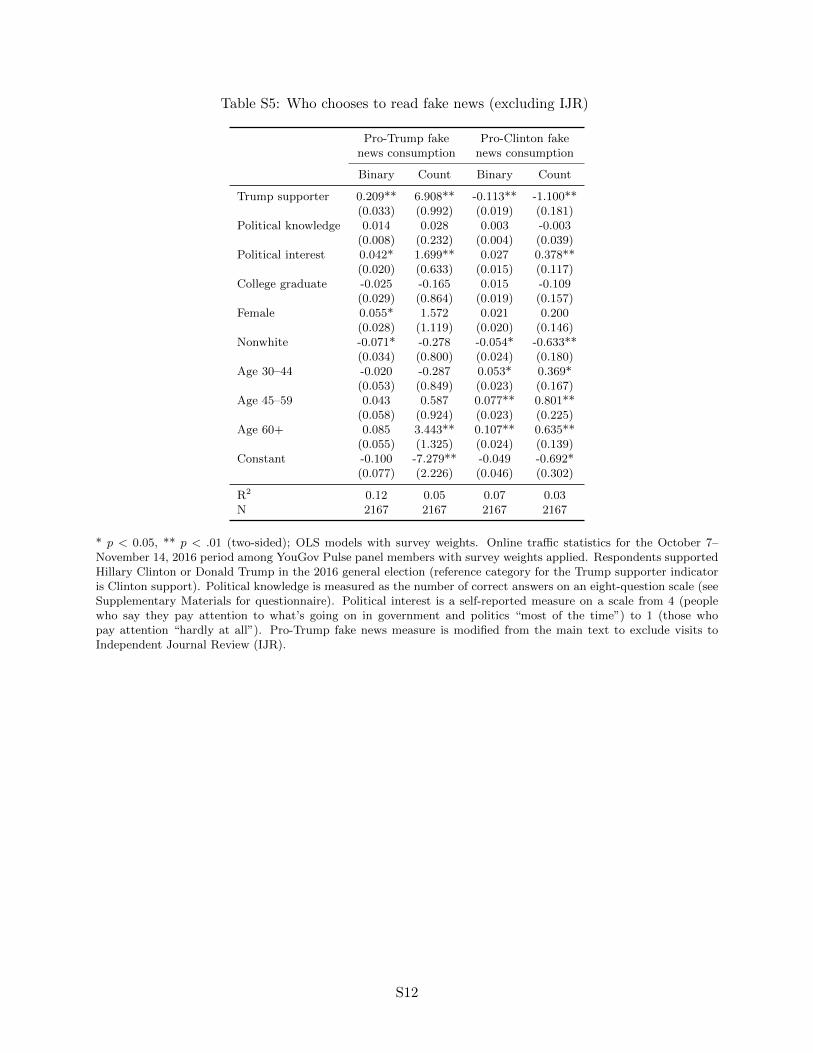
Table S5: Who chooses to read fake news (excluding IJR)
Pro-Trump fake Pro-Clinton fakenews consumption news consumption
Binary Count Binary Count
Trump supporter 0.209** 6.908** -0.113** -1.100**(0.033) (0.992) (0.019) (0.181)
Political knowledge 0.014 0.028 0.003 -0.003(0.008) (0.232) (0.004) (0.039)
Political interest 0.042* 1.699** 0.027 0.378**(0.020) (0.633) (0.015) (0.117)
College graduate -0.025 -0.165 0.015 -0.109(0.029) (0.864) (0.019) (0.157)
Female 0.055* 1.572 0.021 0.200(0.028) (1.119) (0.020) (0.146)
Nonwhite -0.071* -0.278 -0.054* -0.633**(0.034) (0.800) (0.024) (0.180)
Age 30–44 -0.020 -0.287 0.053* 0.369*(0.053) (0.849) (0.023) (0.167)
Age 45–59 0.043 0.587 0.077** 0.801**(0.058) (0.924) (0.023) (0.225)
Age 60+ 0.085 3.443** 0.107** 0.635**(0.055) (1.325) (0.024) (0.139)
Constant -0.100 -7.279** -0.049 -0.692*(0.077) (2.226) (0.046) (0.302)
R2 0.12 0.05 0.07 0.03N 2167 2167 2167 2167
* p < 0.05, ** p < .01 (two-sided); OLS models with survey weights. Online tra�c statistics for the October 7–November 14, 2016 period among YouGov Pulse panel members with survey weights applied. Respondents supportedHillary Clinton or Donald Trump in the 2016 general election (reference category for the Trump supporter indicatoris Clinton support). Political knowledge is measured as the number of correct answers on an eight-question scale (seeSupplementary Materials for questionnaire). Political interest is a self-reported measure on a scale from 4 (peoplewho say they pay attention to what’s going on in government and politics “most of the time”) to 1 (those whopay attention “hardly at all”). Pro-Trump fake news measure is modified from the main text to exclude visits toIndependent Journal Review (IJR).
S12
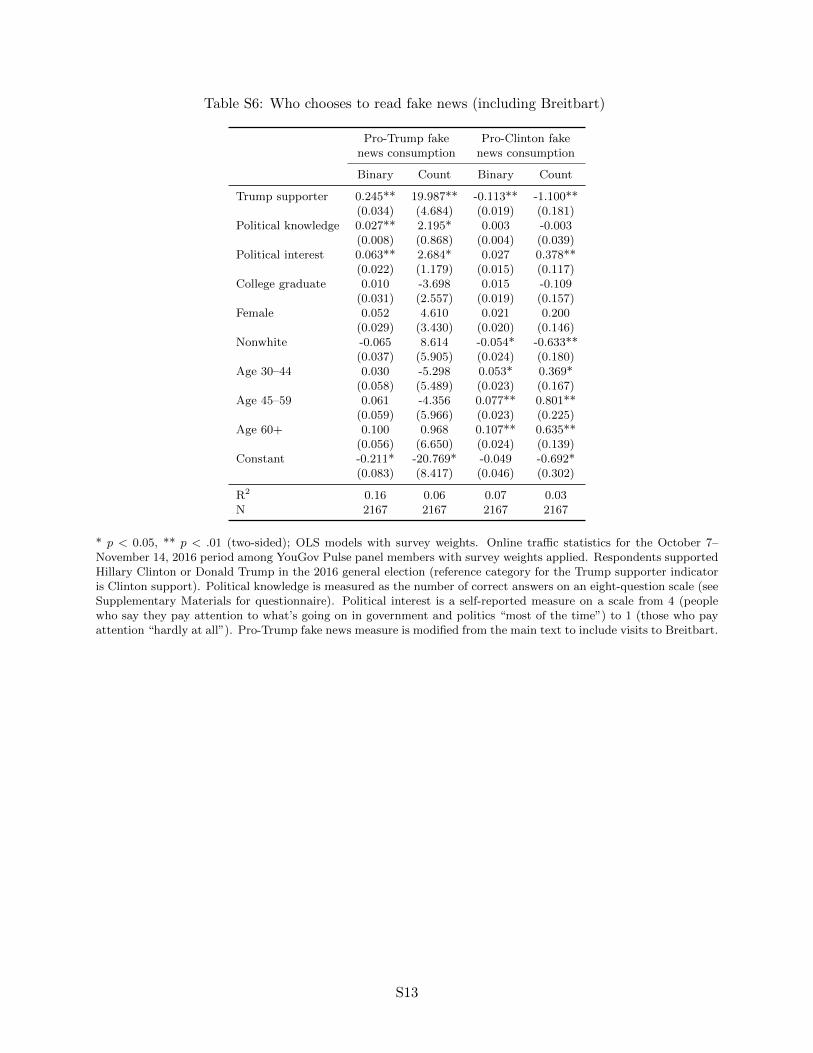
Table S6: Who chooses to read fake news (including Breitbart)
Pro-Trump fake Pro-Clinton fakenews consumption news consumption
Binary Count Binary Count
Trump supporter 0.245** 19.987** -0.113** -1.100**(0.034) (4.684) (0.019) (0.181)
Political knowledge 0.027** 2.195* 0.003 -0.003(0.008) (0.868) (0.004) (0.039)
Political interest 0.063** 2.684* 0.027 0.378**(0.022) (1.179) (0.015) (0.117)
College graduate 0.010 -3.698 0.015 -0.109(0.031) (2.557) (0.019) (0.157)
Female 0.052 4.610 0.021 0.200(0.029) (3.430) (0.020) (0.146)
Nonwhite -0.065 8.614 -0.054* -0.633**(0.037) (5.905) (0.024) (0.180)
Age 30–44 0.030 -5.298 0.053* 0.369*(0.058) (5.489) (0.023) (0.167)
Age 45–59 0.061 -4.356 0.077** 0.801**(0.059) (5.966) (0.023) (0.225)
Age 60+ 0.100 0.968 0.107** 0.635**(0.056) (6.650) (0.024) (0.139)
Constant -0.211* -20.769* -0.049 -0.692*(0.083) (8.417) (0.046) (0.302)
R2 0.16 0.06 0.07 0.03N 2167 2167 2167 2167
* p < 0.05, ** p < .01 (two-sided); OLS models with survey weights. Online tra�c statistics for the October 7–November 14, 2016 period among YouGov Pulse panel members with survey weights applied. Respondents supportedHillary Clinton or Donald Trump in the 2016 general election (reference category for the Trump supporter indicatoris Clinton support). Political knowledge is measured as the number of correct answers on an eight-question scale (seeSupplementary Materials for questionnaire). Political interest is a self-reported measure on a scale from 4 (peoplewho say they pay attention to what’s going on in government and politics “most of the time”) to 1 (those who payattention “hardly at all”). Pro-Trump fake news measure is modified from the main text to include visits to Breitbart.
S13
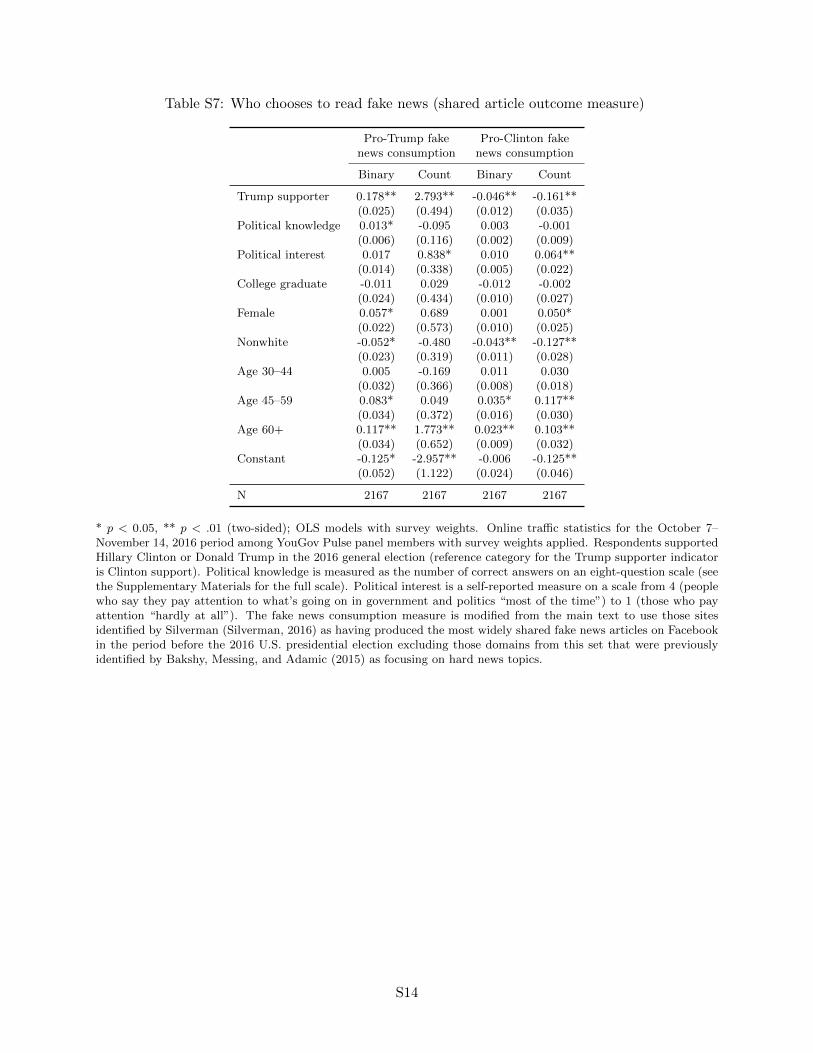
Table S7: Who chooses to read fake news (shared article outcome measure)
Pro-Trump fake Pro-Clinton fakenews consumption news consumption
Binary Count Binary Count
Trump supporter 0.178** 2.793** -0.046** -0.161**(0.025) (0.494) (0.012) (0.035)
Political knowledge 0.013* -0.095 0.003 -0.001(0.006) (0.116) (0.002) (0.009)
Political interest 0.017 0.838* 0.010 0.064**(0.014) (0.338) (0.005) (0.022)
College graduate -0.011 0.029 -0.012 -0.002(0.024) (0.434) (0.010) (0.027)
Female 0.057* 0.689 0.001 0.050*(0.022) (0.573) (0.010) (0.025)
Nonwhite -0.052* -0.480 -0.043** -0.127**(0.023) (0.319) (0.011) (0.028)
Age 30–44 0.005 -0.169 0.011 0.030(0.032) (0.366) (0.008) (0.018)
Age 45–59 0.083* 0.049 0.035* 0.117**(0.034) (0.372) (0.016) (0.030)
Age 60+ 0.117** 1.773** 0.023** 0.103**(0.034) (0.652) (0.009) (0.032)
Constant -0.125* -2.957** -0.006 -0.125**(0.052) (1.122) (0.024) (0.046)
N 2167 2167 2167 2167
* p < 0.05, ** p < .01 (two-sided); OLS models with survey weights. Online tra�c statistics for the October 7–November 14, 2016 period among YouGov Pulse panel members with survey weights applied. Respondents supportedHillary Clinton or Donald Trump in the 2016 general election (reference category for the Trump supporter indicatoris Clinton support). Political knowledge is measured as the number of correct answers on an eight-question scale (seethe Supplementary Materials for the full scale). Political interest is a self-reported measure on a scale from 4 (peoplewho say they pay attention to what’s going on in government and politics “most of the time”) to 1 (those who payattention “hardly at all”). The fake news consumption measure is modified from the main text to use those sitesidentified by Silverman (Silverman, 2016) as having produced the most widely shared fake news articles on Facebookin the period before the 2016 U.S. presidential election excluding those domains from this set that were previouslyidentified by Bakshy, Messing, and Adamic (2015) as focusing on hard news topics.
S14
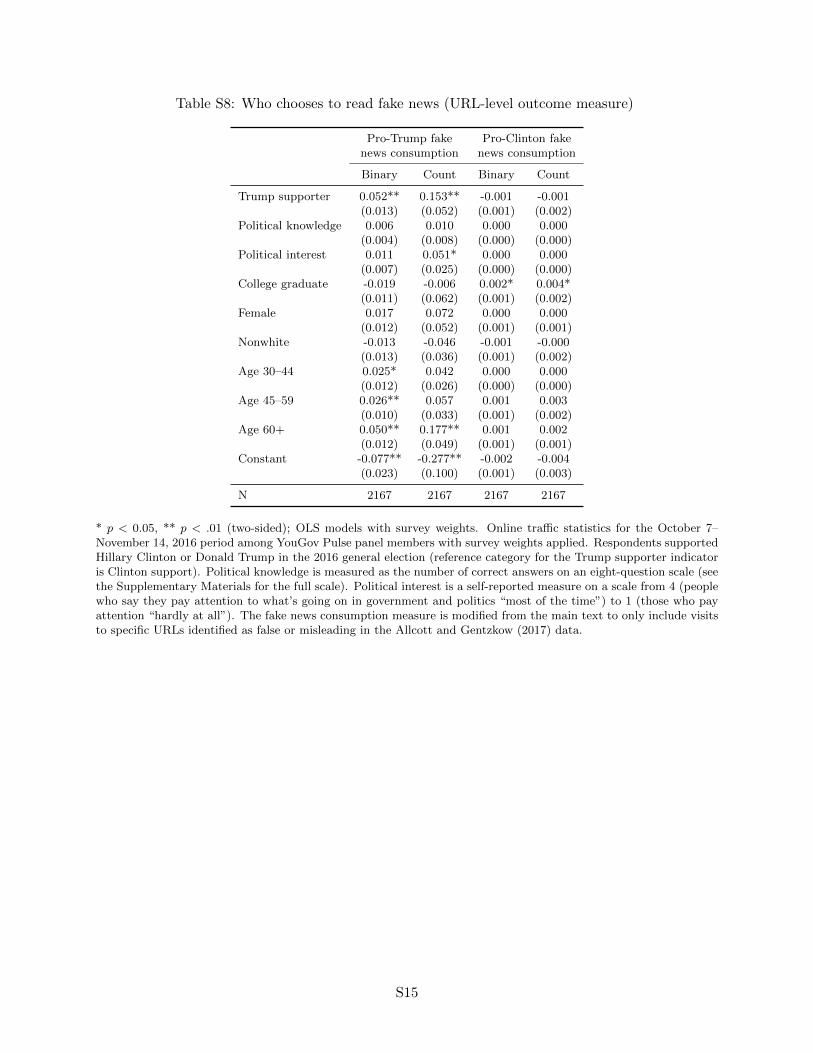
Table S8: Who chooses to read fake news (URL-level outcome measure)
Pro-Trump fake Pro-Clinton fakenews consumption news consumption
Binary Count Binary Count
Trump supporter 0.052** 0.153** -0.001 -0.001(0.013) (0.052) (0.001) (0.002)
Political knowledge 0.006 0.010 0.000 0.000(0.004) (0.008) (0.000) (0.000)
Political interest 0.011 0.051* 0.000 0.000(0.007) (0.025) (0.000) (0.000)
College graduate -0.019 -0.006 0.002* 0.004*(0.011) (0.062) (0.001) (0.002)
Female 0.017 0.072 0.000 0.000(0.012) (0.052) (0.001) (0.001)
Nonwhite -0.013 -0.046 -0.001 -0.000(0.013) (0.036) (0.001) (0.002)
Age 30–44 0.025* 0.042 0.000 0.000(0.012) (0.026) (0.000) (0.000)
Age 45–59 0.026** 0.057 0.001 0.003(0.010) (0.033) (0.001) (0.002)
Age 60+ 0.050** 0.177** 0.001 0.002(0.012) (0.049) (0.001) (0.001)
Constant -0.077** -0.277** -0.002 -0.004(0.023) (0.100) (0.001) (0.003)
N 2167 2167 2167 2167
* p < 0.05, ** p < .01 (two-sided); OLS models with survey weights. Online tra�c statistics for the October 7–November 14, 2016 period among YouGov Pulse panel members with survey weights applied. Respondents supportedHillary Clinton or Donald Trump in the 2016 general election (reference category for the Trump supporter indicatoris Clinton support). Political knowledge is measured as the number of correct answers on an eight-question scale (seethe Supplementary Materials for the full scale). Political interest is a self-reported measure on a scale from 4 (peoplewho say they pay attention to what’s going on in government and politics “most of the time”) to 1 (those who payattention “hardly at all”). The fake news consumption measure is modified from the main text to only include visitsto specific URLs identified as false or misleading in the Allcott and Gentzkow (2017) data.
S15
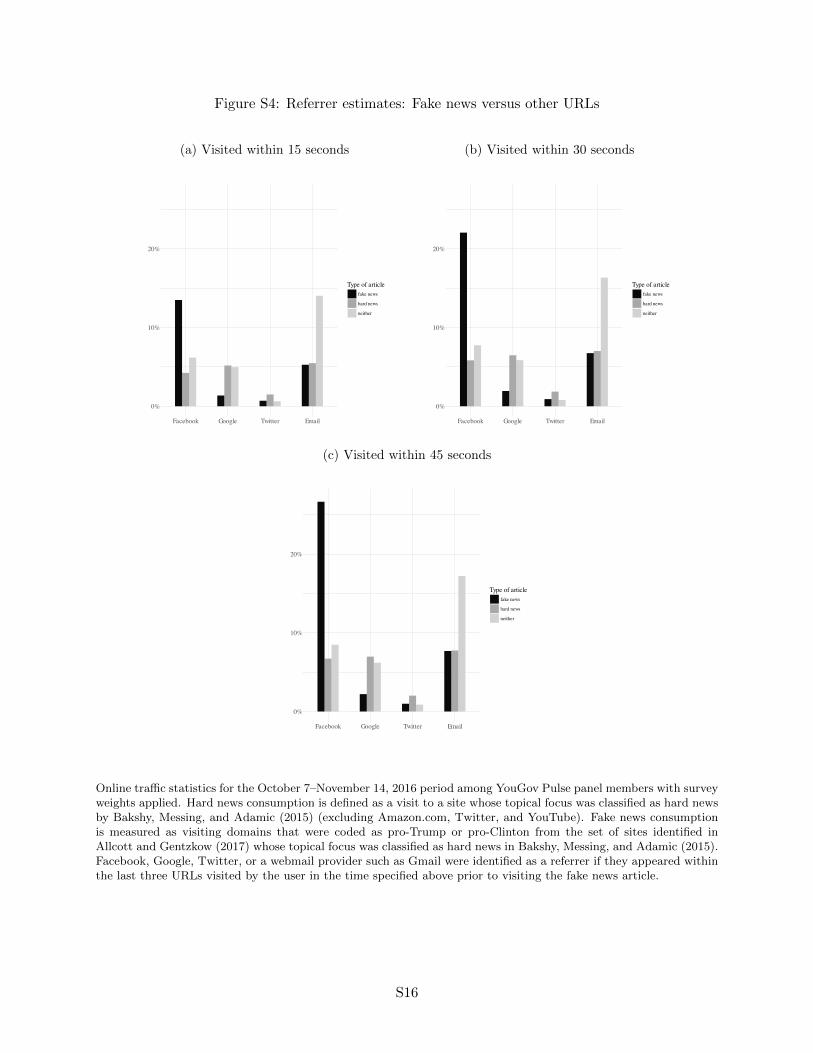
Figure S4: Referrer estimates: Fake news versus other URLs
(a) Visited within 15 seconds
0%
10%
20%
Facebook Google Twitter Email
Type of articlefake news
hard news
neither
(b) Visited within 30 seconds
0%
10%
20%
Facebook Google Twitter Email
Type of articlefake news
hard news
neither
(c) Visited within 45 seconds
0%
10%
20%
Facebook Google Twitter Email
Type of articlefake news
hard news
neither
Online tra�c statistics for the October 7–November 14, 2016 period among YouGov Pulse panel members with surveyweights applied. Hard news consumption is defined as a visit to a site whose topical focus was classified as hard newsby Bakshy, Messing, and Adamic (2015) (excluding Amazon.com, Twitter, and YouTube). Fake news consumptionis measured as visiting domains that were coded as pro-Trump or pro-Clinton from the set of sites identified inAllcott and Gentzkow (2017) whose topical focus was classified as hard news in Bakshy, Messing, and Adamic (2015).Facebook, Google, Twitter, or a webmail provider such as Gmail were identified as a referrer if they appeared withinthe last three URLs visited by the user in the time specified above prior to visiting the fake news article.
S16
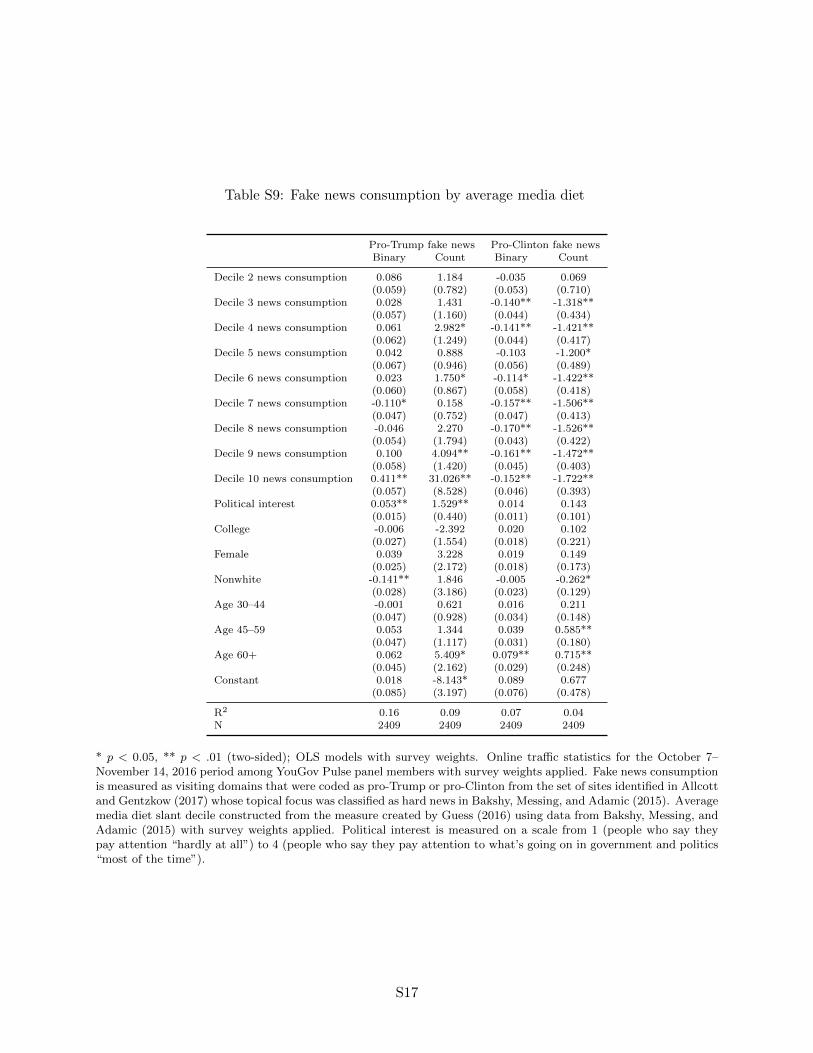
Table S9: Fake news consumption by average media diet
Pro-Trump fake news Pro-Clinton fake newsBinary Count Binary Count
Decile 2 news consumption 0.086 1.184 -0.035 0.069(0.059) (0.782) (0.053) (0.710)
Decile 3 news consumption 0.028 1.431 -0.140** -1.318**(0.057) (1.160) (0.044) (0.434)
Decile 4 news consumption 0.061 2.982* -0.141** -1.421**(0.062) (1.249) (0.044) (0.417)
Decile 5 news consumption 0.042 0.888 -0.103 -1.200*(0.067) (0.946) (0.056) (0.489)
Decile 6 news consumption 0.023 1.750* -0.114* -1.422**(0.060) (0.867) (0.058) (0.418)
Decile 7 news consumption -0.110* 0.158 -0.157** -1.506**(0.047) (0.752) (0.047) (0.413)
Decile 8 news consumption -0.046 2.270 -0.170** -1.526**(0.054) (1.794) (0.043) (0.422)
Decile 9 news consumption 0.100 4.094** -0.161** -1.472**(0.058) (1.420) (0.045) (0.403)
Decile 10 news consumption 0.411** 31.026** -0.152** -1.722**(0.057) (8.528) (0.046) (0.393)
Political interest 0.053** 1.529** 0.014 0.143(0.015) (0.440) (0.011) (0.101)
College -0.006 -2.392 0.020 0.102(0.027) (1.554) (0.018) (0.221)
Female 0.039 3.228 0.019 0.149(0.025) (2.172) (0.018) (0.173)
Nonwhite -0.141** 1.846 -0.005 -0.262*(0.028) (3.186) (0.023) (0.129)
Age 30–44 -0.001 0.621 0.016 0.211(0.047) (0.928) (0.034) (0.148)
Age 45–59 0.053 1.344 0.039 0.585**(0.047) (1.117) (0.031) (0.180)
Age 60+ 0.062 5.409* 0.079** 0.715**(0.045) (2.162) (0.029) (0.248)
Constant 0.018 -8.143* 0.089 0.677(0.085) (3.197) (0.076) (0.478)
R2 0.16 0.09 0.07 0.04N 2409 2409 2409 2409
* p < 0.05, ** p < .01 (two-sided); OLS models with survey weights. Online tra�c statistics for the October 7–November 14, 2016 period among YouGov Pulse panel members with survey weights applied. Fake news consumptionis measured as visiting domains that were coded as pro-Trump or pro-Clinton from the set of sites identified in Allcottand Gentzkow (2017) whose topical focus was classified as hard news in Bakshy, Messing, and Adamic (2015). Averagemedia diet slant decile constructed from the measure created by Guess (2016) using data from Bakshy, Messing, andAdamic (2015) with survey weights applied. Political interest is measured on a scale from 1 (people who say theypay attention “hardly at all”) to 4 (people who say they pay attention to what’s going on in government and politics“most of the time”).
S17
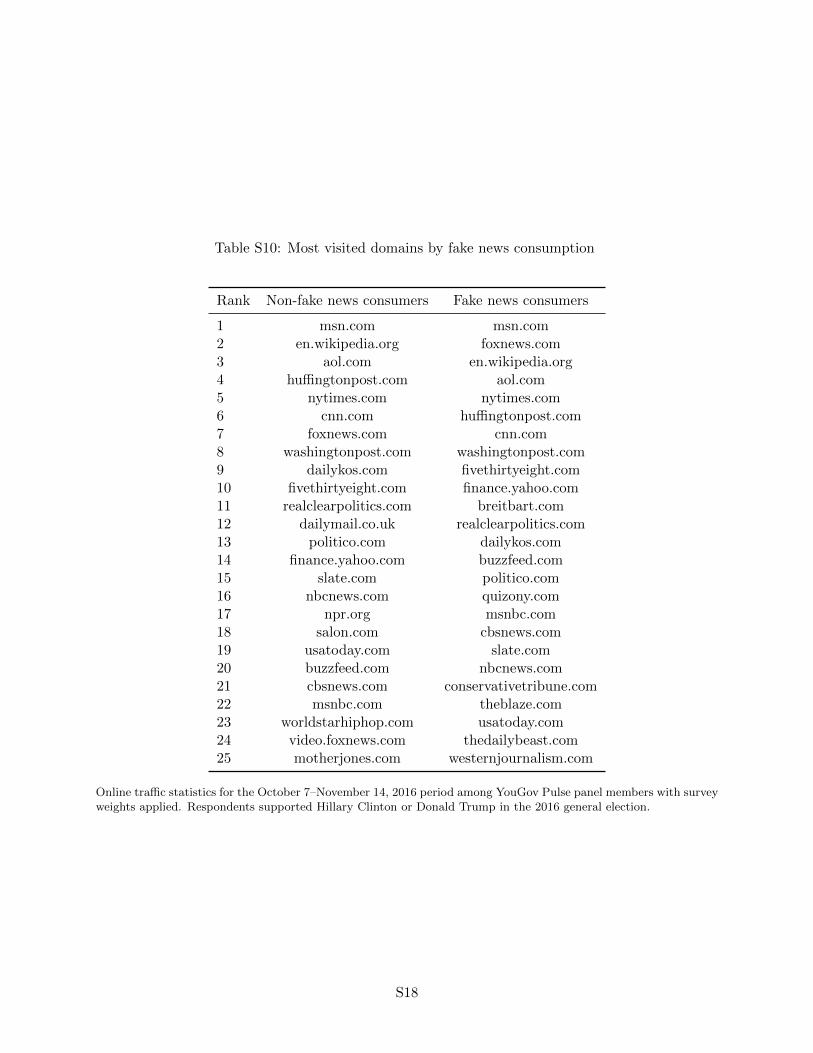
Table S10: Most visited domains by fake news consumption
Rank Non-fake news consumers Fake news consumers
1 msn.com msn.com2 en.wikipedia.org foxnews.com3 aol.com en.wikipedia.org4 hu�ngtonpost.com aol.com5 nytimes.com nytimes.com6 cnn.com hu�ngtonpost.com7 foxnews.com cnn.com8 washingtonpost.com washingtonpost.com9 dailykos.com fivethirtyeight.com10 fivethirtyeight.com finance.yahoo.com11 realclearpolitics.com breitbart.com12 dailymail.co.uk realclearpolitics.com13 politico.com dailykos.com14 finance.yahoo.com buzzfeed.com15 slate.com politico.com16 nbcnews.com quizony.com17 npr.org msnbc.com18 salon.com cbsnews.com19 usatoday.com slate.com20 buzzfeed.com nbcnews.com21 cbsnews.com conservativetribune.com22 msnbc.com theblaze.com23 worldstarhiphop.com usatoday.com24 video.foxnews.com thedailybeast.com25 motherjones.com westernjournalism.com
Online tra�c statistics for the October 7–November 14, 2016 period among YouGov Pulse panel members with surveyweights applied. Respondents supported Hillary Clinton or Donald Trump in the 2016 general election.
S18
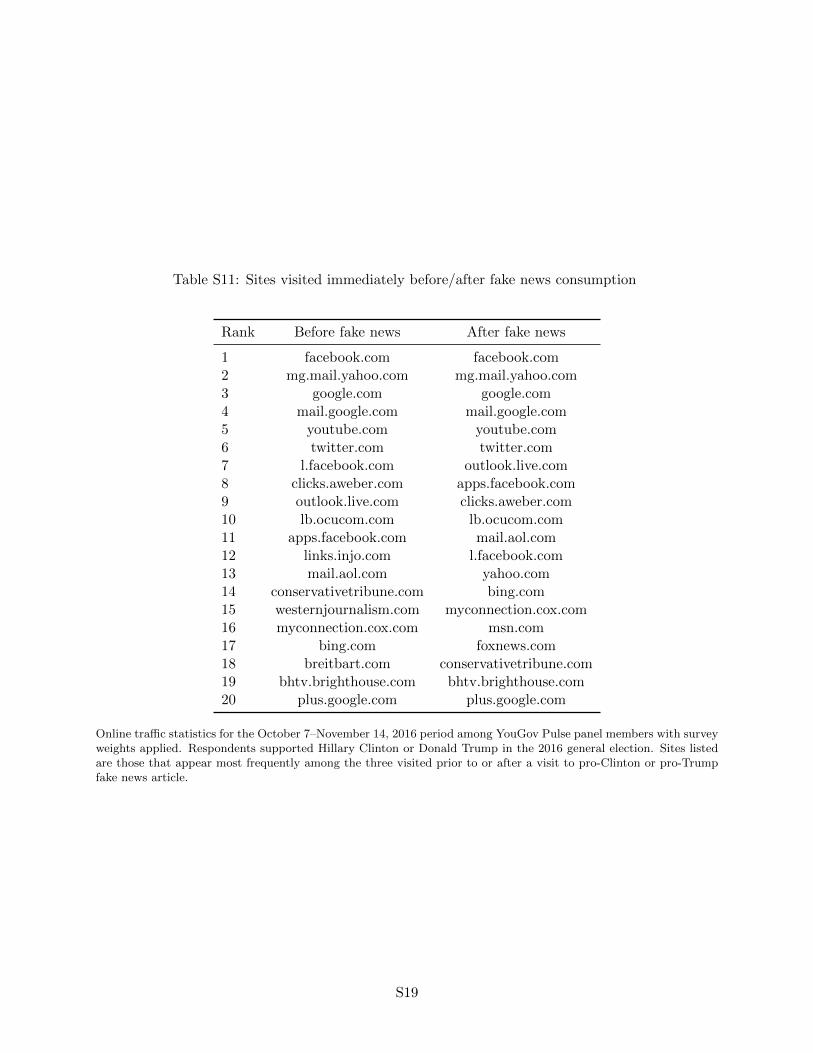
Table S11: Sites visited immediately before/after fake news consumption
Rank Before fake news After fake news
1 facebook.com facebook.com2 mg.mail.yahoo.com mg.mail.yahoo.com3 google.com google.com4 mail.google.com mail.google.com5 youtube.com youtube.com6 twitter.com twitter.com7 l.facebook.com outlook.live.com8 clicks.aweber.com apps.facebook.com9 outlook.live.com clicks.aweber.com10 lb.ocucom.com lb.ocucom.com11 apps.facebook.com mail.aol.com12 links.injo.com l.facebook.com13 mail.aol.com yahoo.com14 conservativetribune.com bing.com15 westernjournalism.com myconnection.cox.com16 myconnection.cox.com msn.com17 bing.com foxnews.com18 breitbart.com conservativetribune.com19 bhtv.brighthouse.com bhtv.brighthouse.com20 plus.google.com plus.google.com
Online tra�c statistics for the October 7–November 14, 2016 period among YouGov Pulse panel members with surveyweights applied. Respondents supported Hillary Clinton or Donald Trump in the 2016 general election. Sites listedare those that appear most frequently among the three visited prior to or after a visit to pro-Clinton or pro-Trumpfake news article.
S19
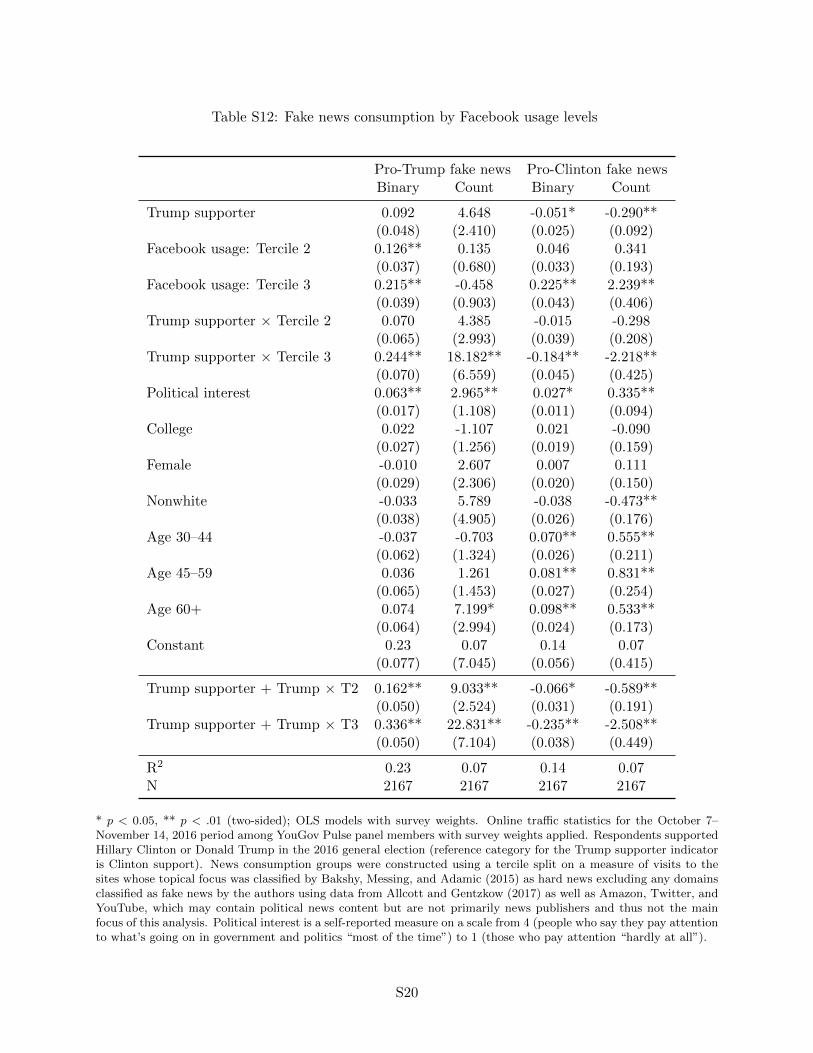
Table S12: Fake news consumption by Facebook usage levels
Pro-Trump fake news Pro-Clinton fake newsBinary Count Binary Count
Trump supporter 0.092 4.648 -0.051* -0.290**(0.048) (2.410) (0.025) (0.092)
Facebook usage: Tercile 2 0.126** 0.135 0.046 0.341(0.037) (0.680) (0.033) (0.193)
Facebook usage: Tercile 3 0.215** -0.458 0.225** 2.239**(0.039) (0.903) (0.043) (0.406)
Trump supporter ⇥ Tercile 2 0.070 4.385 -0.015 -0.298(0.065) (2.993) (0.039) (0.208)
Trump supporter ⇥ Tercile 3 0.244** 18.182** -0.184** -2.218**(0.070) (6.559) (0.045) (0.425)
Political interest 0.063** 2.965** 0.027* 0.335**(0.017) (1.108) (0.011) (0.094)
College 0.022 -1.107 0.021 -0.090(0.027) (1.256) (0.019) (0.159)
Female -0.010 2.607 0.007 0.111(0.029) (2.306) (0.020) (0.150)
Nonwhite -0.033 5.789 -0.038 -0.473**(0.038) (4.905) (0.026) (0.176)
Age 30–44 -0.037 -0.703 0.070** 0.555**(0.062) (1.324) (0.026) (0.211)
Age 45–59 0.036 1.261 0.081** 0.831**(0.065) (1.453) (0.027) (0.254)
Age 60+ 0.074 7.199* 0.098** 0.533**(0.064) (2.994) (0.024) (0.173)
Constant 0.23 0.07 0.14 0.07(0.077) (7.045) (0.056) (0.415)
Trump supporter + Trump ⇥ T2 0.162** 9.033** -0.066* -0.589**(0.050) (2.524) (0.031) (0.191)
Trump supporter + Trump ⇥ T3 0.336** 22.831** -0.235** -2.508**(0.050) (7.104) (0.038) (0.449)
R2 0.23 0.07 0.14 0.07N 2167 2167 2167 2167
* p < 0.05, ** p < .01 (two-sided); OLS models with survey weights. Online tra�c statistics for the October 7–November 14, 2016 period among YouGov Pulse panel members with survey weights applied. Respondents supportedHillary Clinton or Donald Trump in the 2016 general election (reference category for the Trump supporter indicatoris Clinton support). News consumption groups were constructed using a tercile split on a measure of visits to thesites whose topical focus was classified by Bakshy, Messing, and Adamic (2015) as hard news excluding any domainsclassified as fake news by the authors using data from Allcott and Gentzkow (2017) as well as Amazon, Twitter, andYouTube, which may contain political news content but are not primarily news publishers and thus not the mainfocus of this analysis. Political interest is a self-reported measure on a scale from 4 (people who say they pay attentionto what’s going on in government and politics “most of the time”) to 1 (those who pay attention “hardly at all”).
S20
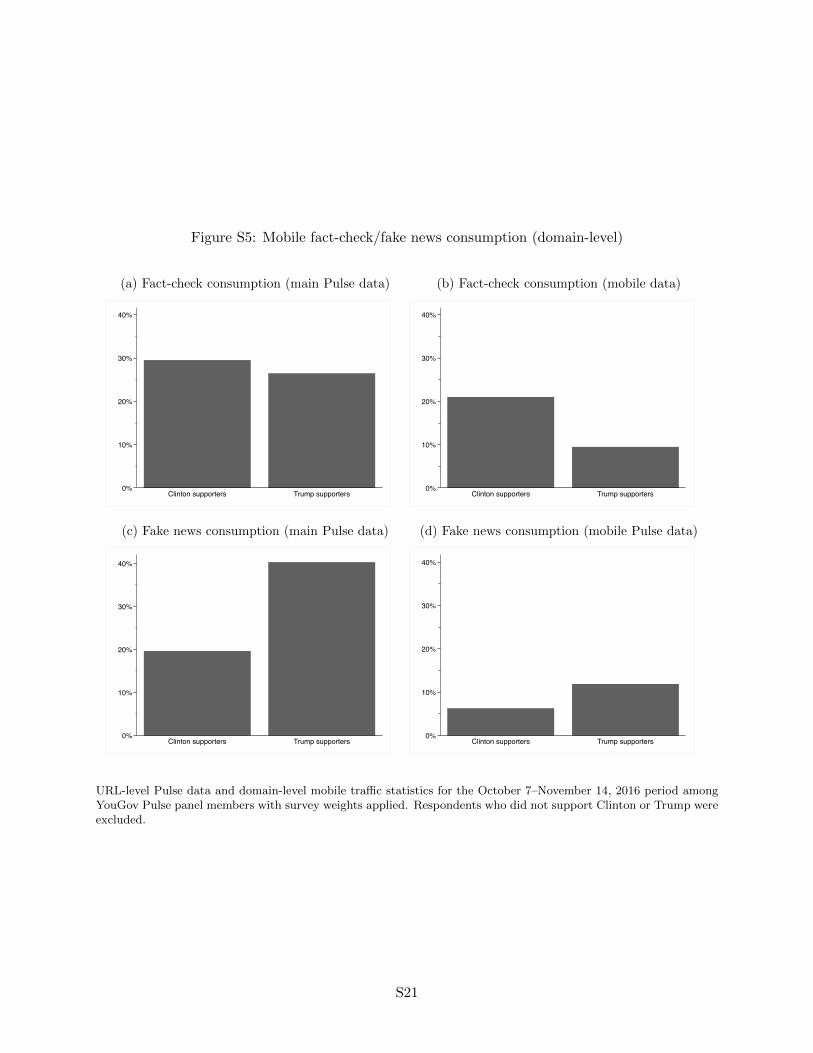
Figure S5: Mobile fact-check/fake news consumption (domain-level)
(a) Fact-check consumption (main Pulse data)
0%
10%
20%
30%
40%
Clinton supporters Trump supporters
(b) Fact-check consumption (mobile data)
0%
10%
20%
30%
40%
Clinton supporters Trump supporters
(c) Fake news consumption (main Pulse data)
0%
10%
20%
30%
40%
Clinton supporters Trump supporters
(d) Fake news consumption (mobile Pulse data)
0%
10%
20%
30%
40%
Clinton supporters Trump supporters
URL-level Pulse data and domain-level mobile tra�c statistics for the October 7–November 14, 2016 period amongYouGov Pulse panel members with survey weights applied. Respondents who did not support Clinton or Trump wereexcluded.
S21
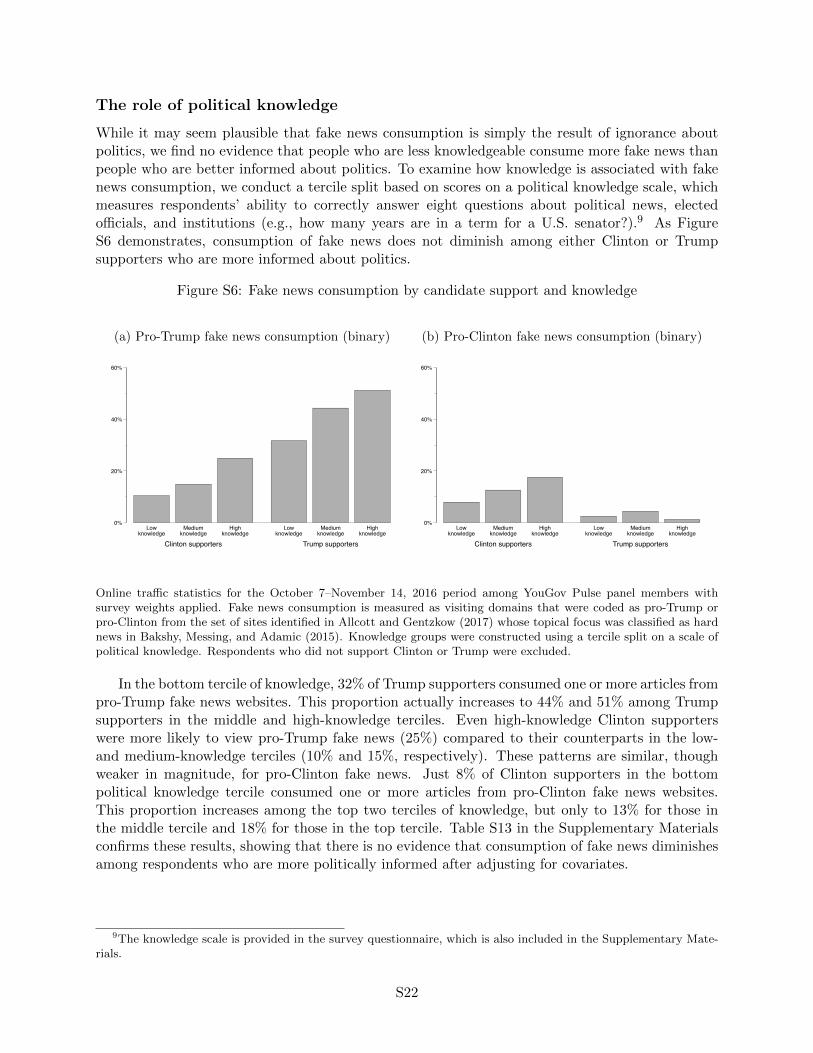
The role of political knowledge
While it may seem plausible that fake news consumption is simply the result of ignorance aboutpolitics, we find no evidence that people who are less knowledgeable consume more fake news thanpeople who are better informed about politics. To examine how knowledge is associated with fakenews consumption, we conduct a tercile split based on scores on a political knowledge scale, whichmeasures respondents’ ability to correctly answer eight questions about political news, electedo�cials, and institutions (e.g., how many years are in a term for a U.S. senator?).9 As FigureS6 demonstrates, consumption of fake news does not diminish among either Clinton or Trumpsupporters who are more informed about politics.
Figure S6: Fake news consumption by candidate support and knowledge
(a) Pro-Trump fake news consumption (binary)
0%
20%
40%
60%
Clinton supporters Trump supporters
Lowknowledge
Mediumknowledge
Highknowledge
Lowknowledge
Mediumknowledge
Highknowledge
(b) Pro-Clinton fake news consumption (binary)
0%
20%
40%
60%
Clinton supporters Trump supporters
Lowknowledge
Mediumknowledge
Highknowledge
Lowknowledge
Mediumknowledge
Highknowledge
Online tra�c statistics for the October 7–November 14, 2016 period among YouGov Pulse panel members withsurvey weights applied. Fake news consumption is measured as visiting domains that were coded as pro-Trump orpro-Clinton from the set of sites identified in Allcott and Gentzkow (2017) whose topical focus was classified as hardnews in Bakshy, Messing, and Adamic (2015). Knowledge groups were constructed using a tercile split on a scale ofpolitical knowledge. Respondents who did not support Clinton or Trump were excluded.
In the bottom tercile of knowledge, 32% of Trump supporters consumed one or more articles frompro-Trump fake news websites. This proportion actually increases to 44% and 51% among Trumpsupporters in the middle and high-knowledge terciles. Even high-knowledge Clinton supporterswere more likely to view pro-Trump fake news (25%) compared to their counterparts in the low-and medium-knowledge terciles (10% and 15%, respectively). These patterns are similar, thoughweaker in magnitude, for pro-Clinton fake news. Just 8% of Clinton supporters in the bottompolitical knowledge tercile consumed one or more articles from pro-Clinton fake news websites.This proportion increases among the top two terciles of knowledge, but only to 13% for those inthe middle tercile and 18% for those in the top tercile. Table S13 in the Supplementary Materialsconfirms these results, showing that there is no evidence that consumption of fake news diminishesamong respondents who are more politically informed after adjusting for covariates.
9The knowledge scale is provided in the survey questionnaire, which is also included in the Supplementary Mate-rials.
S22
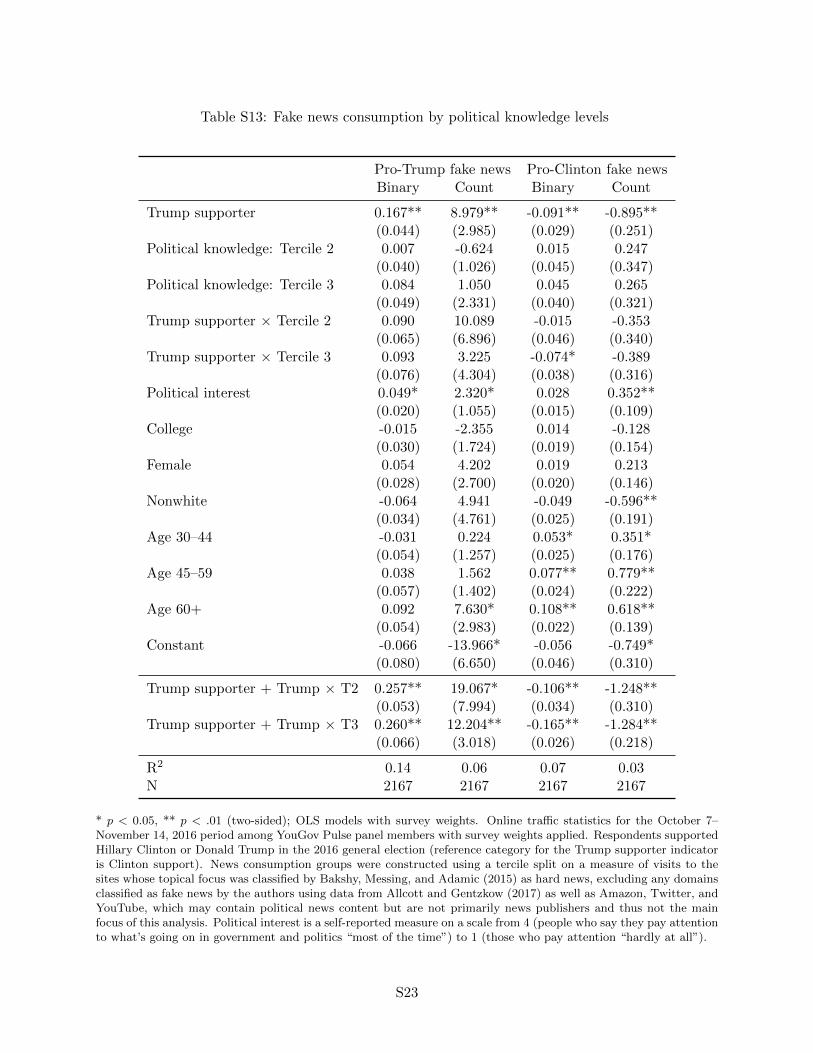
Table S13: Fake news consumption by political knowledge levels
Pro-Trump fake news Pro-Clinton fake newsBinary Count Binary Count
Trump supporter 0.167** 8.979** -0.091** -0.895**(0.044) (2.985) (0.029) (0.251)
Political knowledge: Tercile 2 0.007 -0.624 0.015 0.247(0.040) (1.026) (0.045) (0.347)
Political knowledge: Tercile 3 0.084 1.050 0.045 0.265(0.049) (2.331) (0.040) (0.321)
Trump supporter ⇥ Tercile 2 0.090 10.089 -0.015 -0.353(0.065) (6.896) (0.046) (0.340)
Trump supporter ⇥ Tercile 3 0.093 3.225 -0.074* -0.389(0.076) (4.304) (0.038) (0.316)
Political interest 0.049* 2.320* 0.028 0.352**(0.020) (1.055) (0.015) (0.109)
College -0.015 -2.355 0.014 -0.128(0.030) (1.724) (0.019) (0.154)
Female 0.054 4.202 0.019 0.213(0.028) (2.700) (0.020) (0.146)
Nonwhite -0.064 4.941 -0.049 -0.596**(0.034) (4.761) (0.025) (0.191)
Age 30–44 -0.031 0.224 0.053* 0.351*(0.054) (1.257) (0.025) (0.176)
Age 45–59 0.038 1.562 0.077** 0.779**(0.057) (1.402) (0.024) (0.222)
Age 60+ 0.092 7.630* 0.108** 0.618**(0.054) (2.983) (0.022) (0.139)
Constant -0.066 -13.966* -0.056 -0.749*(0.080) (6.650) (0.046) (0.310)
Trump supporter + Trump ⇥ T2 0.257** 19.067* -0.106** -1.248**(0.053) (7.994) (0.034) (0.310)
Trump supporter + Trump ⇥ T3 0.260** 12.204** -0.165** -1.284**(0.066) (3.018) (0.026) (0.218)
R2 0.14 0.06 0.07 0.03N 2167 2167 2167 2167
* p < 0.05, ** p < .01 (two-sided); OLS models with survey weights. Online tra�c statistics for the October 7–November 14, 2016 period among YouGov Pulse panel members with survey weights applied. Respondents supportedHillary Clinton or Donald Trump in the 2016 general election (reference category for the Trump supporter indicatoris Clinton support). News consumption groups were constructed using a tercile split on a measure of visits to thesites whose topical focus was classified by Bakshy, Messing, and Adamic (2015) as hard news, excluding any domainsclassified as fake news by the authors using data from Allcott and Gentzkow (2017) as well as Amazon, Twitter, andYouTube, which may contain political news content but are not primarily news publishers and thus not the mainfocus of this analysis. Political interest is a self-reported measure on a scale from 4 (people who say they pay attentionto what’s going on in government and politics “most of the time”) to 1 (those who pay attention “hardly at all”).
S23

Does fake news crowd out hard news?
We measure consumption of articles from websites classified as focusing on hard news topics (Bak-shy, Messing, and Adamic, 2015) and perform a tercile split.10 Figure S7 shows how fake newsconsumption changes as hard news consumption increases. In general, the data indicate that thepeople who consume the most hard news also consume the most fake news. For instance, visitsto pro-Clinton fake news websites among Clinton supporters increased from 0.1% in the low newsconsumption tercile to 19.8% in the high news consumption tercile. Most notably, however, visits topro-Trump fake news websites increased among Trump supporters from 13.7% in the low tercile to52.0% in the middle tercile and 61.2% in the high tercile. In general, the people who consumed themost real news also consumed the most fake news. Table S14 below shows that visits to attitude-consistent fake news websites was significantly higher among Clinton and Trump supporters whoconsume high levels of hard news conditional on numerous covariates.
Figure S7: Fake news consumption by hard news consumption
(a) Pro-Trump fake news consumption (binary)
0%
10%
20%
30%
40%
50%
60%
Clinton supporters Trump supporters
Lownews
Mediumnews
Highnews
Lownews
Mediumnews
Highnews
(b) Pro-Clinton fake news consumption (binary)
0%
10%
20%
30%
40%
50%
60%
Clinton supporters Trump supporters
Lownews
Mediumnews
Highnews
Lownews
Mediumnews
Highnews
Online tra�c statistics for the October 7–November 14, 2016 period among YouGov Pulse panel members withsurvey weights applied. Fake news consumption is measured as visiting domains that were coded as pro-Trump orpro-Clinton from the set of sites identified in Allcott and Gentzkow (2017) whose topical focus was classified as hardnews in Bakshy, Messing, and Adamic (2015). News consumption groups were constructed using a tercile split on ameasure of visits to the sites whose topical focus was classified by Bakshy, Messing, and Adamic (2015) as hard news(excluding Amazon, Twitter, and YouTube). Respondents who did not support Clinton or Trump were excluded.
These results suggest that fake news does not crowd out hard news consumption, which weseek to verify by combining our data from October/November 2016 with a di↵erent YouGov Pulsedataset from February/March 2015 (Guess, 2016). To protect respondent confidentiality, YouGovprovided us with a new set of respondent identifiers for each of the two datasets, allowing us toexamine the 265 respondents for whom online behavioral data is available in both datasets. We thenconducted an analysis using a variant of a di↵erence-in-di↵erences approach where we comparedthe change in hard news consumption from 2015 to 2016 among fake news consumers to the changeamong people who did not consume fake news. The data appear in Figure S8.
10We additionally exclude from the hard news category any domains classified as fake news by the authors usingdata from Allcott and Gentzkow (2017) as well as the websites of Amazon, Twitter, and YouTube, which may containpolitical news content but are not primarily news publishers and thus not the main focus of this analysis.
S24
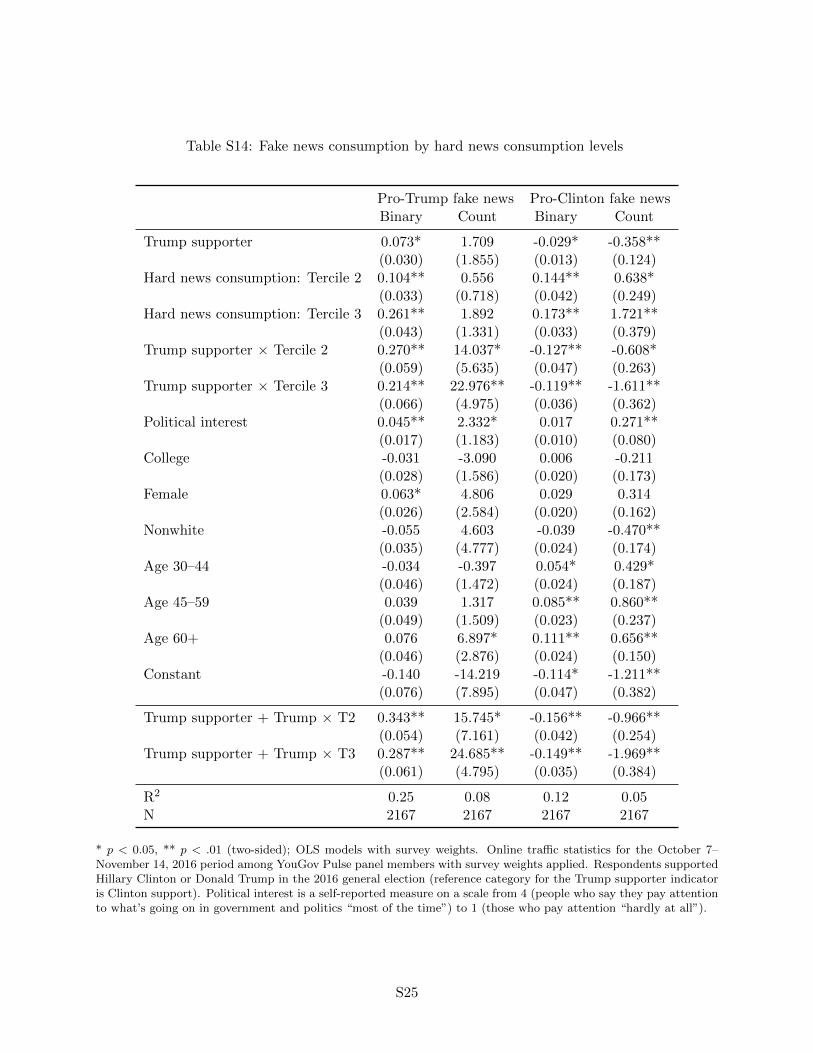
Table S14: Fake news consumption by hard news consumption levels
Pro-Trump fake news Pro-Clinton fake newsBinary Count Binary Count
Trump supporter 0.073* 1.709 -0.029* -0.358**(0.030) (1.855) (0.013) (0.124)
Hard news consumption: Tercile 2 0.104** 0.556 0.144** 0.638*(0.033) (0.718) (0.042) (0.249)
Hard news consumption: Tercile 3 0.261** 1.892 0.173** 1.721**(0.043) (1.331) (0.033) (0.379)
Trump supporter ⇥ Tercile 2 0.270** 14.037* -0.127** -0.608*(0.059) (5.635) (0.047) (0.263)
Trump supporter ⇥ Tercile 3 0.214** 22.976** -0.119** -1.611**(0.066) (4.975) (0.036) (0.362)
Political interest 0.045** 2.332* 0.017 0.271**(0.017) (1.183) (0.010) (0.080)
College -0.031 -3.090 0.006 -0.211(0.028) (1.586) (0.020) (0.173)
Female 0.063* 4.806 0.029 0.314(0.026) (2.584) (0.020) (0.162)
Nonwhite -0.055 4.603 -0.039 -0.470**(0.035) (4.777) (0.024) (0.174)
Age 30–44 -0.034 -0.397 0.054* 0.429*(0.046) (1.472) (0.024) (0.187)
Age 45–59 0.039 1.317 0.085** 0.860**(0.049) (1.509) (0.023) (0.237)
Age 60+ 0.076 6.897* 0.111** 0.656**(0.046) (2.876) (0.024) (0.150)
Constant -0.140 -14.219 -0.114* -1.211**(0.076) (7.895) (0.047) (0.382)
Trump supporter + Trump ⇥ T2 0.343** 15.745* -0.156** -0.966**(0.054) (7.161) (0.042) (0.254)
Trump supporter + Trump ⇥ T3 0.287** 24.685** -0.149** -1.969**(0.061) (4.795) (0.035) (0.384)
R2 0.25 0.08 0.12 0.05N 2167 2167 2167 2167
* p < 0.05, ** p < .01 (two-sided); OLS models with survey weights. Online tra�c statistics for the October 7–November 14, 2016 period among YouGov Pulse panel members with survey weights applied. Respondents supportedHillary Clinton or Donald Trump in the 2016 general election (reference category for the Trump supporter indicatoris Clinton support). Political interest is a self-reported measure on a scale from 4 (people who say they pay attentionto what’s going on in government and politics “most of the time”) to 1 (those who pay attention “hardly at all”).
S25
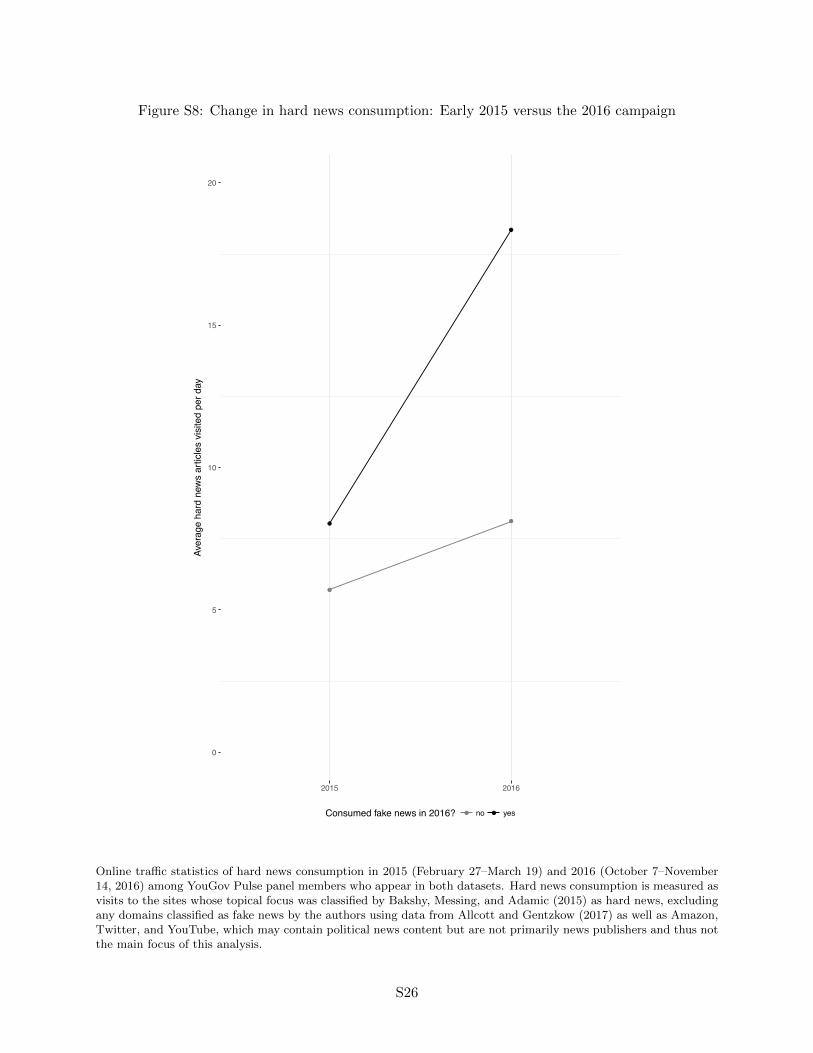
Figure S8: Change in hard news consumption: Early 2015 versus the 2016 campaign
●
●●
●
0
5
10
15
20
2015 2016
Aver
age
hard
new
s ar
ticle
s vi
site
d pe
r day
Consumed fake news in 2016? ● ●no yes
Online tra�c statistics of hard news consumption in 2015 (February 27–March 19) and 2016 (October 7–November14, 2016) among YouGov Pulse panel members who appear in both datasets. Hard news consumption is measured asvisits to the sites whose topical focus was classified by Bakshy, Messing, and Adamic (2015) as hard news, excludingany domains classified as fake news by the authors using data from Allcott and Gentzkow (2017) as well as Amazon,Twitter, and YouTube, which may contain political news content but are not primarily news publishers and thus notthe main focus of this analysis.
S26
We find that news consumption increased substantially among both groups as the 2016 electionapproached, but the pattern di↵ered between groups. Among respondents who did not visit anarticle from a fake news website in our 2016 sample period, hard news consumption increasedfrom an average of 5.7 articles per day to 8.1 per day. However, consumption increased even moreamong fake news consumers, going from 8.0 articles per day in 2015 to 18.3 per day in 2016. Thedi↵erential increase we observe in hard news consumption from 2015 to 2016 among fake newsconsumers is statistically significant in a di↵erence-in-di↵erences-style analysis that controls for anumber of demographic and political covariates, in addition to the total number of web page visits(see Table S15). We cannot establish that this relationship is causal, but our results are inconsistentwith a simple hypothesis that fake news crowds out hard news consumption.
S27
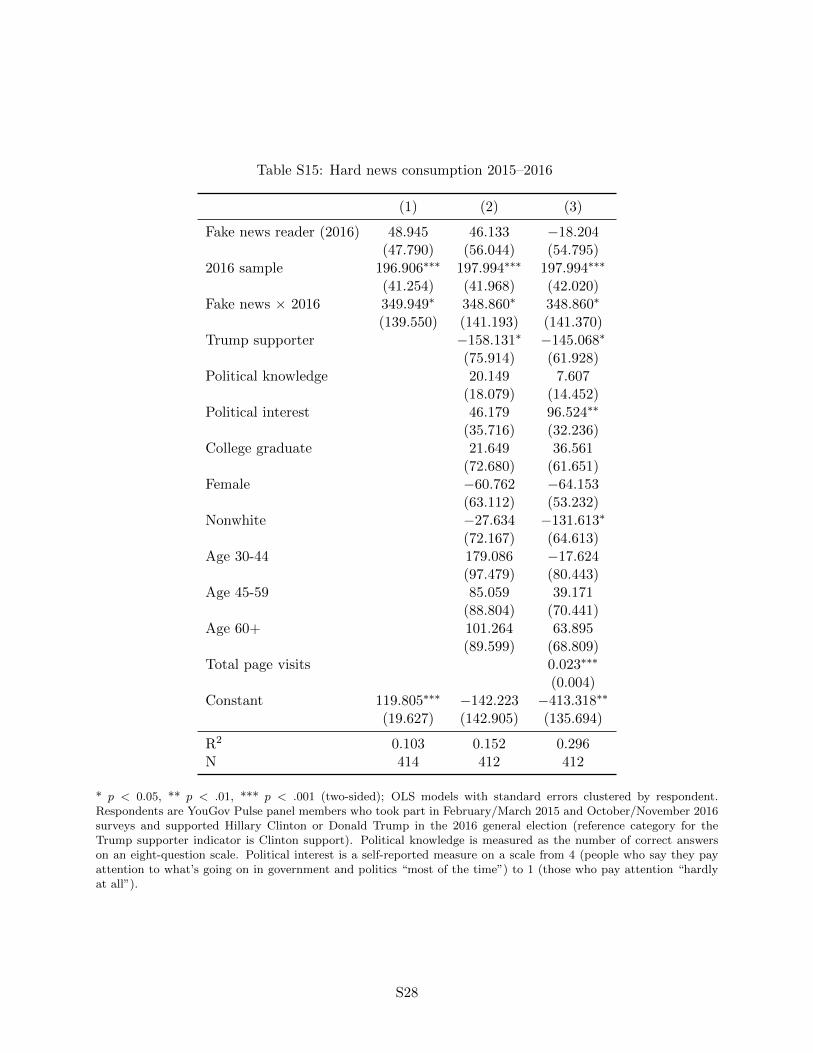
Table S15: Hard news consumption 2015–2016
(1) (2) (3)
Fake news reader (2016) 48.945 46.133 �18.204(47.790) (56.044) (54.795)
2016 sample 196.906⇤⇤⇤ 197.994⇤⇤⇤ 197.994⇤⇤⇤
(41.254) (41.968) (42.020)Fake news ⇥ 2016 349.949⇤ 348.860⇤ 348.860⇤
(139.550) (141.193) (141.370)Trump supporter �158.131⇤ �145.068⇤
(75.914) (61.928)Political knowledge 20.149 7.607
(18.079) (14.452)Political interest 46.179 96.524⇤⇤
(35.716) (32.236)College graduate 21.649 36.561
(72.680) (61.651)Female �60.762 �64.153
(63.112) (53.232)Nonwhite �27.634 �131.613⇤
(72.167) (64.613)Age 30-44 179.086 �17.624
(97.479) (80.443)Age 45-59 85.059 39.171
(88.804) (70.441)Age 60+ 101.264 63.895
(89.599) (68.809)Total page visits 0.023⇤⇤⇤
(0.004)Constant 119.805⇤⇤⇤ �142.223 �413.318⇤⇤
(19.627) (142.905) (135.694)
R2 0.103 0.152 0.296N 414 412 412
* p < 0.05, ** p < .01, *** p < .001 (two-sided); OLS models with standard errors clustered by respondent.Respondents are YouGov Pulse panel members who took part in February/March 2015 and October/November 2016surveys and supported Hillary Clinton or Donald Trump in the 2016 general election (reference category for theTrump supporter indicator is Clinton support). Political knowledge is measured as the number of correct answerson an eight-question scale. Political interest is a self-reported measure on a scale from 4 (people who say they payattention to what’s going on in government and politics “most of the time”) to 1 (those who pay attention “hardlyat all”).
S28
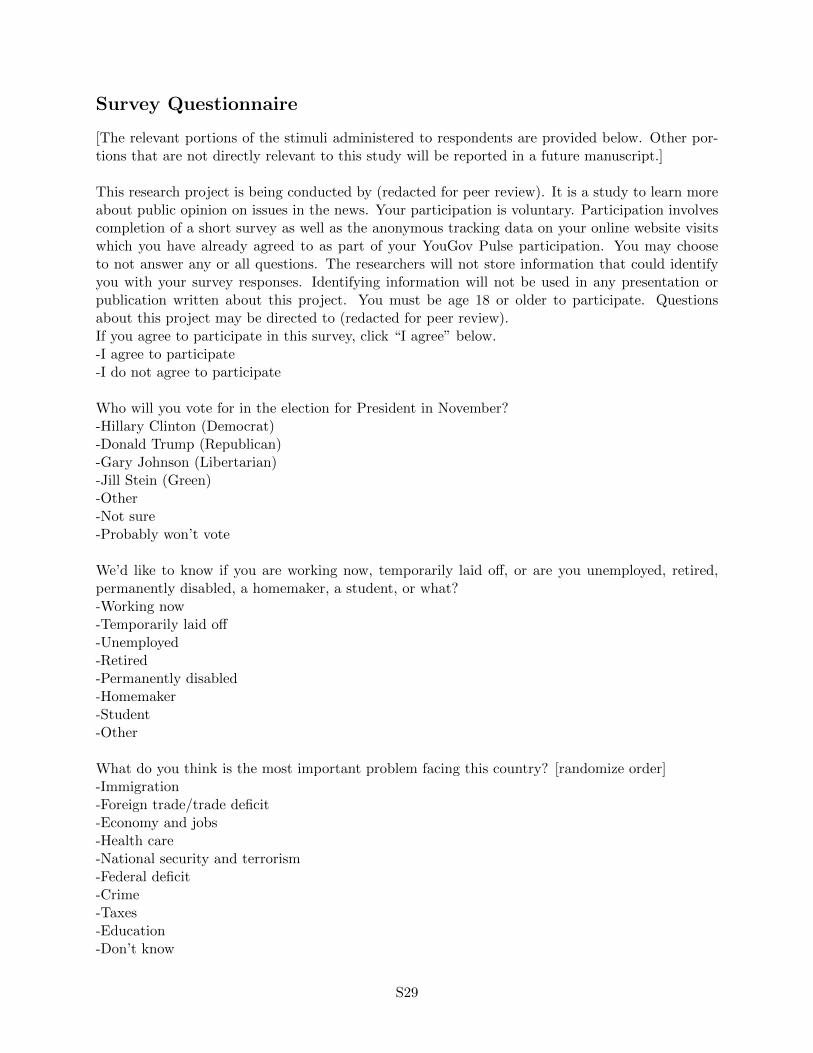
Survey Questionnaire
[The relevant portions of the stimuli administered to respondents are provided below. Other por-tions that are not directly relevant to this study will be reported in a future manuscript.]
This research project is being conducted by (redacted for peer review). It is a study to learn moreabout public opinion on issues in the news. Your participation is voluntary. Participation involvescompletion of a short survey as well as the anonymous tracking data on your online website visitswhich you have already agreed to as part of your YouGov Pulse participation. You may chooseto not answer any or all questions. The researchers will not store information that could identifyyou with your survey responses. Identifying information will not be used in any presentation orpublication written about this project. You must be age 18 or older to participate. Questionsabout this project may be directed to (redacted for peer review).If you agree to participate in this survey, click “I agree” below.-I agree to participate-I do not agree to participate
Who will you vote for in the election for President in November?-Hillary Clinton (Democrat)-Donald Trump (Republican)-Gary Johnson (Libertarian)-Jill Stein (Green)-Other-Not sure-Probably won’t vote
We’d like to know if you are working now, temporarily laid o↵, or are you unemployed, retired,permanently disabled, a homemaker, a student, or what?-Working now-Temporarily laid o↵-Unemployed-Retired-Permanently disabled-Homemaker-Student-Other
What do you think is the most important problem facing this country? [randomize order]-Immigration-Foreign trade/trade deficit-Economy and jobs-Health care-National security and terrorism-Federal deficit-Crime-Taxes-Education-Don’t know
S29
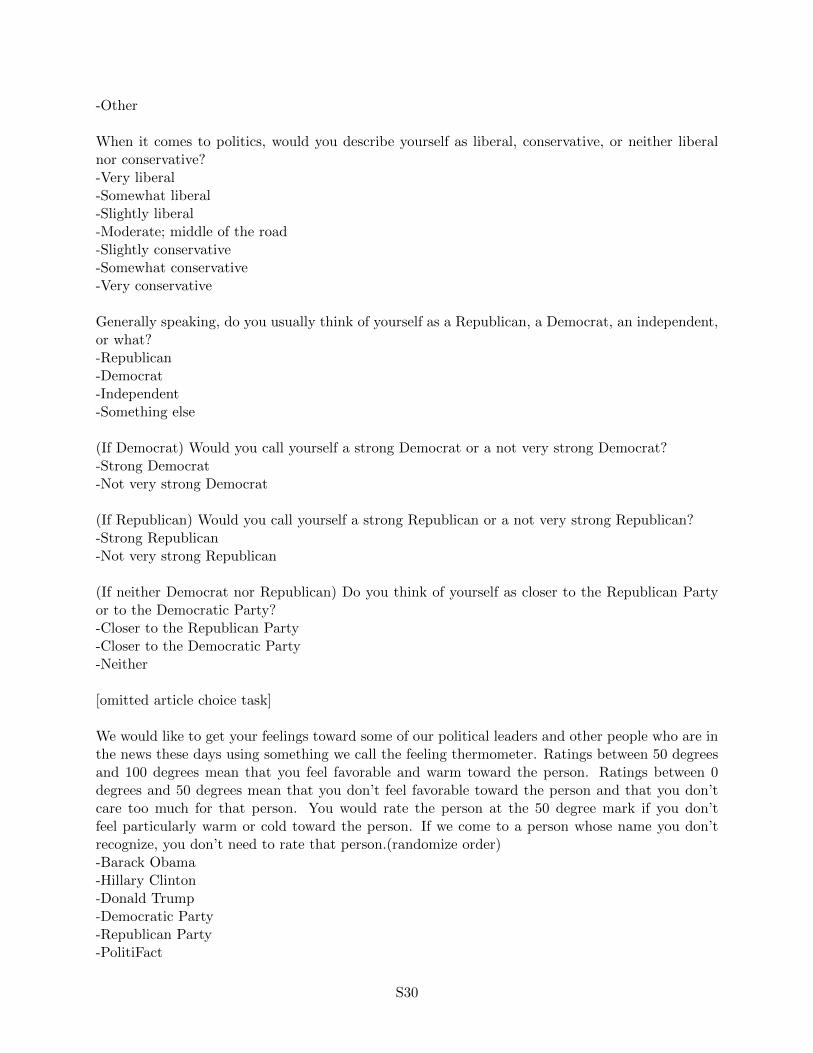
-Other
When it comes to politics, would you describe yourself as liberal, conservative, or neither liberalnor conservative?-Very liberal-Somewhat liberal-Slightly liberal-Moderate; middle of the road-Slightly conservative-Somewhat conservative-Very conservative
Generally speaking, do you usually think of yourself as a Republican, a Democrat, an independent,or what?-Republican-Democrat-Independent-Something else
(If Democrat) Would you call yourself a strong Democrat or a not very strong Democrat?-Strong Democrat-Not very strong Democrat
(If Republican) Would you call yourself a strong Republican or a not very strong Republican?-Strong Republican-Not very strong Republican
(If neither Democrat nor Republican) Do you think of yourself as closer to the Republican Partyor to the Democratic Party?-Closer to the Republican Party-Closer to the Democratic Party-Neither
[omitted article choice task]
We would like to get your feelings toward some of our political leaders and other people who are inthe news these days using something we call the feeling thermometer. Ratings between 50 degreesand 100 degrees mean that you feel favorable and warm toward the person. Ratings between 0degrees and 50 degrees mean that you don’t feel favorable toward the person and that you don’tcare too much for that person. You would rate the person at the 50 degree mark if you don’tfeel particularly warm or cold toward the person. If we come to a person whose name you don’trecognize, you don’t need to rate that person.(randomize order)-Barack Obama-Hillary Clinton-Donald Trump-Democratic Party-Republican Party-PolitiFact
S30

-FactCheck.org
There are many di↵erent activities related to the campaign and the elections that a person mightdo on the Internet. Below is a list of things you may or may not have done online in the monthsleading up to the November (2016) elections. Please indicate whether or not you have done eachof these activities [Yes/No].-Used the Internet to research or fact-check claims made during the campaign-Took part in an online discussion about political issues or the campaign-Looked for information online about candidates’ voting records or positions on the issues-Watched video online about the candidates or the election
(If yes to fact-checking item) Which of the following did you do to research or fact-check claimsmade during the campaign? Please indicate all that apply. [randomize order of options]-Visited a fact-checking website such as PolitiFact.com, FactCheck.org, or the Washington PostFact Checker-Visited a candidate website-Visited a blog or opinion website-Visited a news website
Are you familiar with the fact-checking movement in journalism, which includes websites such asPolitiFact, Factcheck.org, and the Washington Post Fact Checker? (Fact-checking is a new devel-opment in journalism that seeks to hold politicians accountable when they make false or misleadingstatements.)-Yes-No
(If Yes familiar with fact-checking) How familiar are you with fact-checking in journalism at web-sites such as PolitiFact?-Very familiar-Somewhat familiar-Slightly familiar-Slightly unfamiliar-Somewhat unfamiliar-Very unfamiliar
(If Yes familiar with fact-checking) In general, how favorable or unfavorable is your overall opinionof the fact-checking movement in journalism?-Very favorable-Somewhat favorable-Slightly favorable-Slightly unfavorable-Somewhat unfavorable-Very unfavorable
How often do you pay attention to what’s going on in government and politics?-Most of the time-Some of the time-Only now and then
S31

-Hardly at all-Don’t know
S32
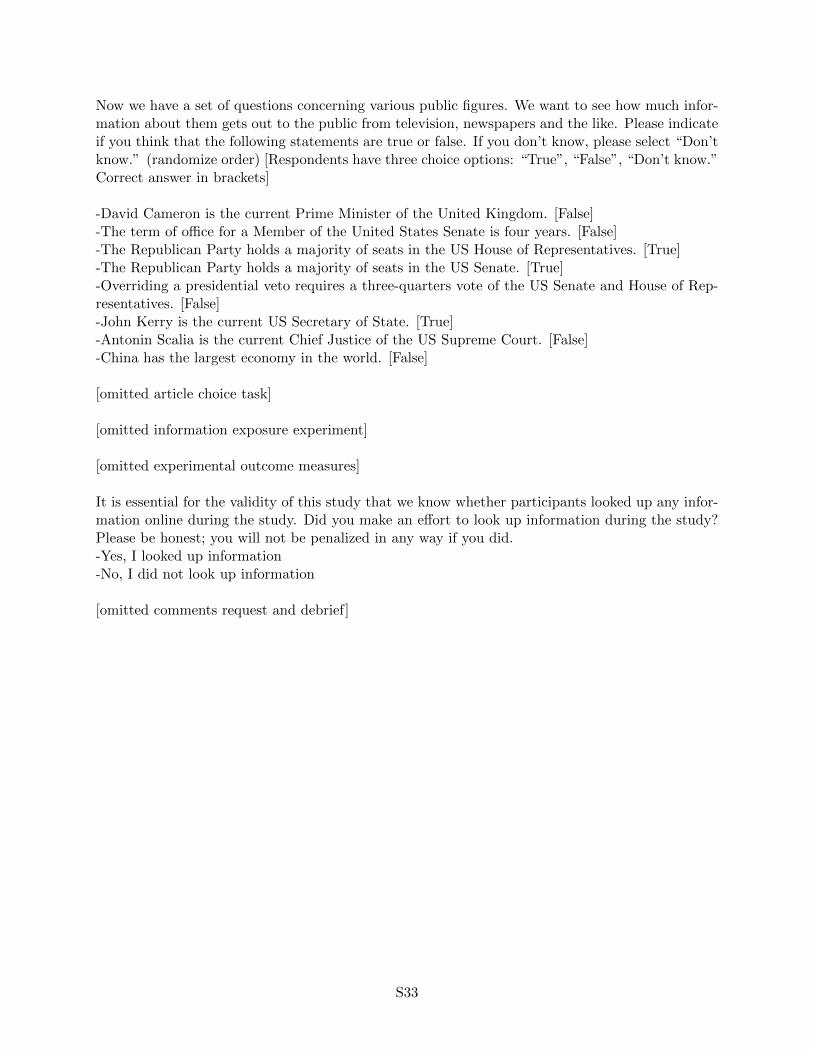
Now we have a set of questions concerning various public figures. We want to see how much infor-mation about them gets out to the public from television, newspapers and the like. Please indicateif you think that the following statements are true or false. If you don’t know, please select “Don’tknow.” (randomize order) [Respondents have three choice options: “True”, “False”, “Don’t know.”Correct answer in brackets]
-David Cameron is the current Prime Minister of the United Kingdom. [False]-The term of o�ce for a Member of the United States Senate is four years. [False]-The Republican Party holds a majority of seats in the US House of Representatives. [True]-The Republican Party holds a majority of seats in the US Senate. [True]-Overriding a presidential veto requires a three-quarters vote of the US Senate and House of Rep-resentatives. [False]-John Kerry is the current US Secretary of State. [True]-Antonin Scalia is the current Chief Justice of the US Supreme Court. [False]-China has the largest economy in the world. [False]
[omitted article choice task]
[omitted information exposure experiment]
[omitted experimental outcome measures]
It is essential for the validity of this study that we know whether participants looked up any infor-mation online during the study. Did you make an e↵ort to look up information during the study?Please be honest; you will not be penalized in any way if you did.-Yes, I looked up information-No, I did not look up information
[omitted comments request and debrief]
S33
References
Allcott, Hunt, and Matthew Gentzkow. 2017. “Social Media and Fake News in the 2016 Election.”Journal of Economic Perspectives 31 (2): 1–28.
Bakshy, Eytan, Solomon Messing, and Lada A. Adamic. 2015. “Exposure to ideologically diversenews and opinion on Facebook.” Science 348 (6239): 1130–1132.
Bellware, Kim. 2016. “A White Nationalist Is The New White House Chief Strategist.” Hu�ngtonPost, November 13, 2016. Downloaded September 6, 2017 from http://www.huffingtonpost.
com/entry/steve-bannon-chief-strategist_us_5828e1d4e4b0c4b63b0d33d7.
Benkler, Yochai, Robert Faris, Hal Roberts, and Ethan Zuckerman. 2017. “Study: Breitbart-led right-wing media ecosystem altered broader media agenda.” Columbia Journalism Re-view, March 3, 2017. Downloaded March 14, 2017 from http://www.cjr.org/analysis/
breitbart-media-trump-harvard-study.php.
Borchers, Callum. 2017. ““The Independent Journal Review wants to be taken seriously, soit suspended Benny Johnson”.” Washington Post, March 21, 2017. Downloaded Septem-ber 6, 2017 from https://www.washingtonpost.com/news/the-fix/wp/2017/03/21/
the-independent-journal-review-wants-to-be-taken-seriously-so-it-suspended-benny-johnson/
?utm_term=.9258aef434c1.
Faris, Robert M., Hal Roberts, Bruce Etling, Nikki Bourassa, Ethan Zuckerman, and Yochai Ben-kler. 2017. “Partisanship, Propaganda, and Disinformation: Online Media and the 2016 U.S.Presidential Election.” Berkman Klein Center for Internet & Society Research Paper, August 24,2017. Downloaded August 29, 2017 from https://cyber.harvard.edu/publications/2017/
08/mediacloud.
Guess, Andrew M. 2016. “Media Choice and Moderation: Evidence from Online TrackingData.” Unpublished manuscript. Downloaded May 26, 2017 from https://www.dropbox.com/
s/uk005hhio3dysm8/GuessJMP.pdf?dl=0.
Pennycook, Gordon, Tyrone D Cannon, and David G. Rand. 2017. “Prior Exposure IncreasesPerceived Accuracy of Fake News.” Unpublished manuscript. Downloaded May 5, 2017 fromhttps://papers.ssrn.com/sol3/papers.cfm?abstract_id=2958246.
Silverman, Craig. 2016. “This Analysis Shows How Fake Election News StoriesOutperformed Real News On Facebook.” Buzzfeed, November 16, 2016. Down-loaded December 16, 2016 from https://www.buzzfeed.com/craigsilverman/
viral-fake-election-news-outperformed-real-news-on-facebook?utm_term=
.ohXvLeDzK#.cwwgb7EX0.
Silverman, Craig, and Jeremy Singer-Vine. 2016. “Most Americans Who See Fake News Believe It,New Survey Says.” Buzzfeed, December 6, 2016. Downloaded December 16, 2016 from https://
www.buzzfeed.com/craigsilverman/fake-news-survey?utm_term=.lazQnopg3#.tbR2yvrL6.
S34