Selective Catalytic Reduction of NO x over Alumina...
50
THESIS FOR THE DEGREE OF LICENTIATE OF ENGINEERING Selective Catalytic Reduction of NO x over Alumina-Supported Silver and Indium during Lean Operation LINDA STR ¨ OM Department of Chemistry and Chemical Engineering CHALMERS UNIVERSITY OF TECHNOLOGY G¨ oteborg, Sweden 2016
Transcript of Selective Catalytic Reduction of NO x over Alumina...

THESIS FOR THE DEGREE OF LICENTIATE OF ENGINEERING
Selective Catalytic Reduction of NOx overAlumina-Supported Silver and Indium during Lean
Operation
LINDA STROM
Department of Chemistry and Chemical EngineeringCHALMERS UNIVERSITY OF TECHNOLOGY
Goteborg, Sweden 2016

Selective Catalytic Reduction of NOx over Alumina-SupportedSilver and Indium during Lean OperationLINDA STROM
© LINDA STROM, 2016.
Licentiatuppsatser vid instutitionen for kemi och kemiteknik. 2016:02ISSN: 1652-943X
Applied Surface ChemistryDepartment of Chemistry and Chemical EngineeringChalmers University of TechnologySE-412 96 GoteborgSweden
Telephone: +46 (0)31-772 1000
Chalmers ReproserviceGoteborg, Sweden 2016

Selective Catalytic Reduction of NOx over Alumina-Supported Silver andIndium during Lean Operation
Linda StromApplied Surface ChemistryDepartment of Chemistry and Chemical EngineeringChalmers University of Technology
ABSTRACT
Catalytic emission control for vehicles was first applied in the 1970’s.The first such catalysts were designed to oxidize unburned hydrocarbons(HC) and carbon monoxide (CO). A few years later, the oxidation catalystwas further developed into the three-way catalyst (TWC), which efficientlyremoves CO, HC and nitrogen oxides (NOx), under stoichiometric air-to-fuelratios. However, the awareness of climate changes, caused by anthropogenicemissions of carbon dioxide (CO2), is a major motivator for the developmentof fuel-efficient engines, operating in excess oxygen (lean) combustion. Atthese air-to-fuel ratios, the TWC is ineffective for NOx reduction, promotingthe development of lean NOx reduction techniques. Among the most promis-ing today is selective catalytic reduction (SCR), for which the silver-alumina(Ag/Al2O3) catalyst shows promising results, both with HC and ammonia(NH3), as the reducing agent.
The current work focuses on the nature of the active sites of the Ag/Al2O3
catalyst and the impact of the structure of the reductant on the selectivecatalytic reduction of NOx. For this purpose, five different hydrocarbonsand oxygenates, all containing two carbon atoms in the structure, as well asNH3, are investigated as reducing agents, with and without the presence ofhydrogen. Furthermore, the influence of the active phase is elucidated byexchanging silver for the equivalent molar amount of indium. The catalystsare prepared by incipient wetness impregnation, characterized with regardto specific surface area, crystalline structure, concentration and strength ofacidic sites, SCR activity and surface species. The latter are studied bydiffuse reflectance ultraviolet-visible (UV-vis) spectroscopy, where spectrafrom both the fresh samples and from samples subjected to various gas-phasepretreatments, mimicking conditions of the SCR reaction environment, arerecorded. The connection between the silver and indium species, and the gas-phase environment is discussed, and it is proposed that species important forthe activation of the reducing agent are essential for high SCR activity, bothduring HC- and NH3-SCR.

Furthermore, quantification of the NO reduction and NH3 slip over Ag/Al2O3
is performed for different locations of the reductant injection spray. Theprobability of a stoichiometric ammonia dose is higher when the spray ispositioned in the center of the exhaust pipe, compared to at the pipe wall.Moreover, the NO conversion increases rapidly with increasing ammonia dose,however, NH3 doses of several times the stoichiometric amount do not im-prove NO reduction significantly but increase the NH3 slip almost linearly.
Keywords: Lean NOx reduction, HC-SCR, NH3-SCR, silver, indium, alu-mina
iv

List of papers
I. Hydrogen-assisted SCR of NOx over alumina-supported silverand indium catalysts using C2-hydrocarbons and oxygenatesLinda Strom, Per-Anders Carlsson, Magnus Skoglundh & Hanna HarelindApplied Catalysis B: Environmental 181 (2016) 403-412
II. On the hydrogen effect in NH3-SCR of NOx over alumina-supported silver and indium catalystsLinda Strom, Per-Anders Carlsson, Magnus Skoglundh & Hanna HarelindIn manuscript
III. Quantification of urea-spray non-uniformity effects on the H2-assisted NO reduction and NH3 slip over an Ag/Al2O3 catalystLinda Strom, Henrik Strom, Andreas Darnell, Per-Anders Carlsson,Magnus Skoglundh & Hanna HarelindEnergy Procedia 75 (2015) 2317-2322
Contribution report
I. I prepared the catalysts, performed all experimental work, interpretedthe results together with my co-authors, wrote the first draft of themanuscript and was responsible for writing and submitting the manuscript.
II. I prepared the catalysts, performed all experimental work, interpretedthe results together with my co-authors and wrote the first draft of themanuscript.
III. I prepared the catalysts, performed all experimental work, interpretedthe results together with my co-authors, wrote the first draft of themanuscript and was responsible for writing and submitting the manuscript.
v

vi

List of abbreviations
Ag/Al2O3 Silver-aluminaBET Brunauer-Emmett-Teller, adsorption isotherm for determination
of surface areas of solidsCEM Controlled evaporator mixerCFD Computational fluid dynamicsC/N Ratio between the number of carbon and nitrogen atomsCO Carbon monoxideCO2 Carbon dioxideDME Dimethyl etherFTIR Fourier transform infrared spectroscopyHC Hydrocarbons
In/Al2O3 Indium-aluminaN2 Nitrogen
N2O Nitric oxideNH3 AmmoniaNOx Nitrogen oxides (NO and NO2)NSR NOx storage and reductionPGM Platinum group metalsPM Particulate matterSCR Selective catalytic reductionSOx Sulfur oxides (SO2 and SO3)TPD Temperature programmed desorptionTWC Three-way catalyst
UV-vis Ultraviolet and visibleXRD X-ray diffraction
vii

viii

Contents
1 Introduction 11.1 The development of emission control . . . . . . . . . . . . . . 11.2 Objectives . . . . . . . . . . . . . . . . . . . . . . . . . . . . . 4
2 Background 52.1 Challenges associated with lean NOx
reduction . . . . . . . . . . . . . . . . . . . . . . . . . . . . . 52.2 Methods for conversion of NOx . . . . . . . . . . . . . . . . . 6
2.2.1 NOx storage and reduction . . . . . . . . . . . . . . . . 62.2.2 Hydrocarbon-SCR . . . . . . . . . . . . . . . . . . . . 72.2.3 NH3-SCR . . . . . . . . . . . . . . . . . . . . . . . . . 8
2.3 Alumina-supported catalysts . . . . . . . . . . . . . . . . . . . 82.3.1 The Ag/Al2O3 catalyst . . . . . . . . . . . . . . . . . . 82.3.2 The In/Al2O3 catalyst . . . . . . . . . . . . . . . . . . 9
3 Scientific methods 113.1 Catalyst preparation and monolith
coating . . . . . . . . . . . . . . . . . . . . . . . . . . . . . . . 113.2 Characterization techniques . . . . . . . . . . . . . . . . . . . 12
3.2.1 Specific surface area according to the BET-method . . 123.2.2 X-ray diffraction – Crystal structure . . . . . . . . . . 133.2.3 NH3-TPD – Surface acidity . . . . . . . . . . . . . . . 133.2.4 UV-visible diffuse reflectance spectroscopy
– Surface species . . . . . . . . . . . . . . . . . . . . . 143.3 Flow reactor experiments . . . . . . . . . . . . . . . . . . . . . 15
4 Results and discussion 174.1 Influence of the reducing agent on lean NOx reduction over
Ag/Al2O3 . . . . . . . . . . . . . . . . . . . . . . . . . . . . . 174.1.1 Influence of the gas-phase environment on the Ag phase 184.1.2 Effect of the reductant dosage . . . . . . . . . . . . . . 20
ix

4.1.3 Influence of the active phase on the lean NOx reduction 24
5 Conclusions and future outlook 31
Acknowledgements 33
Bibliography 35
x
Chapter 1
Introduction
1.1 The development of emission control
Today, the transport sector is the most important source to air pollutionsin the western world. Among these emissions are carbon monoxide (CO),hydrocarbons (HC), particulate matter (PM), sulfur oxides (SOx) and nitro-gen oxides (NOx). The latter (almost exclusively NO) is, regardless of thechemical composition of the fuel, formed during combustion at high temper-atures and is oxidized into NO2 in the atmosphere. This suffocating gas islargely responsible for the brownish color of smog and plays a major rolein the formation of ground-level ozone. In the environment, this stronglyoxidizing agent reacts in the air to form nitric acid as well as toxic organiccompounds, which cause acidification and eutrophication [1]. Moreover, inthe human body, NOx can irritate the lungs and lower resistance to respira-tory infections, such as influenza. The effect of short-term exposure is stillunclear, however, long-term frequent exposure to concentrations higher thantypically found in the ambient air, may cause increased incidence of acuterespiratory illness [1]. On a global basis, it is estimated that 500.000 peopledie each year as a result of the air pollutions from the transport sector [2].In Europe, the average pollution of NOx was 16.2 kg per capita in 2013, ofwhich the largest source was road transportation (39.4%) [3], see Figure 1.1.
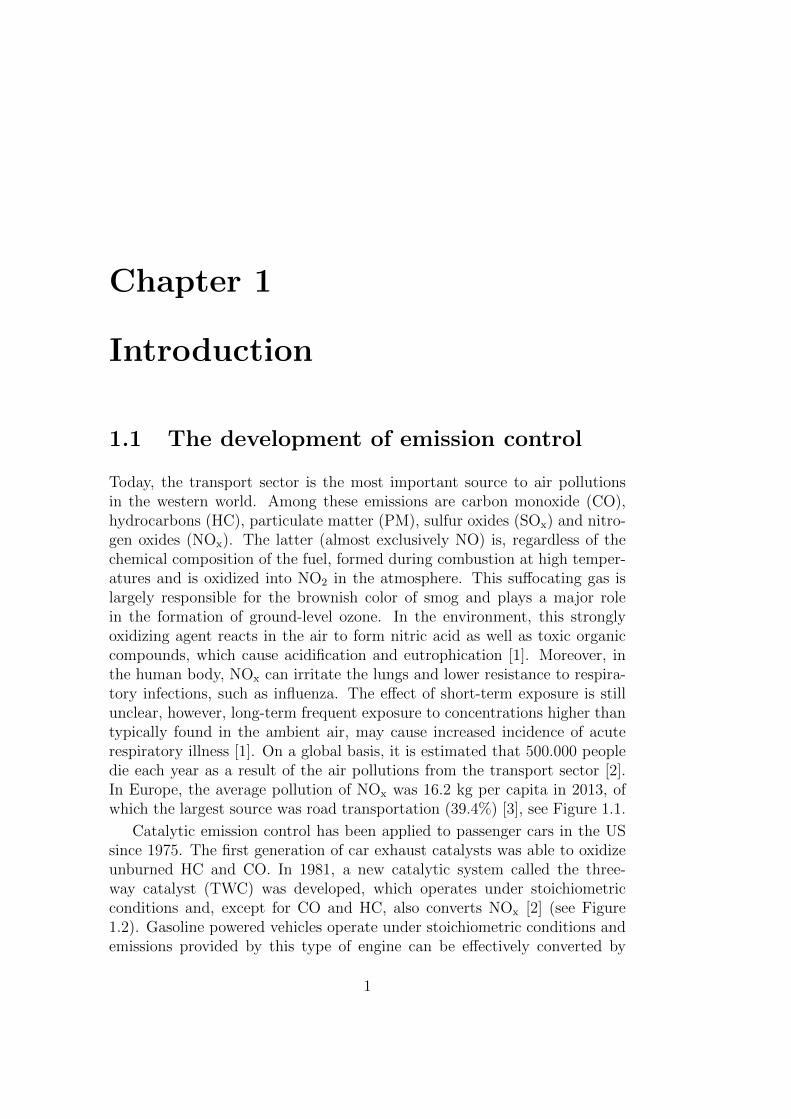
Catalytic emission control has been applied to passenger cars in the USsince 1975. The first generation of car exhaust catalysts was able to oxidizeunburned HC and CO. In 1981, a new catalytic system called the three-way catalyst (TWC) was developed, which operates under stoichiometricconditions and, except for CO and HC, also converts NOx [2] (see Figure1.2). Gasoline powered vehicles operate under stoichiometric conditions andemissions provided by this type of engine can be effectively converted by
1

Road transportation
Energy production and distribution
Commercial, institutional and
household
Energy use in industry
Other
Figure 1.1: NOx emissions divided by source sector in the EU in 2013 [3].
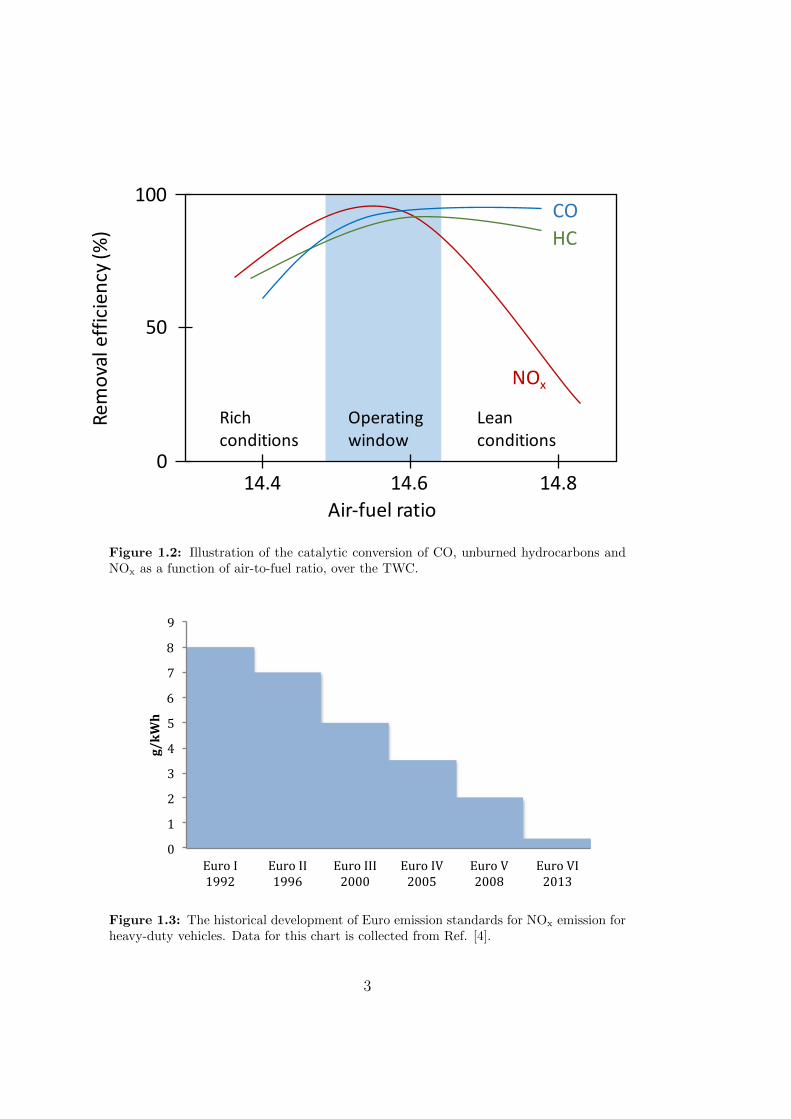
the TWC. However, the awareness of climate changes, caused by anthro-pogenic emissions of carbon dioxide (CO2), has gained increased concerns,motivating the development of more fuel-efficient engines, operating underlean conditions (excess oxygen) and in this way emitting less CO2 per drivenkm, compared to the ordinary gasoline engine. However, lean conditionscontradict the fundamentals of the TWC, hence another abatement tech-nique is required for reducing NOx under lean conditions. The legislationregarding NOx emissions was first applied in Europe 1992 by the Euro Istandards. Since then, the standards have been updated several times andEuro VI requires nowadays NOx emissions of no more than 0.4 g/kWh. Thedevelopment of Euro-standards of NOx emissions is shown in Figure 1.3.
Promising techniques for lean NOx reduction at present involves NOx
storage and reduction catalysts and selective catalytic reduction with hydro-carbons (HC-SCR) or ammonia (NH3-SCR). A promising catalyst for HC-SCR is silver-alumina (Ag/Al2O3) [5-9], which shows high stability underhydrothermal conditions [10].
2
HCCO
NOx
Operating window
Richconditions
Leanconditions
Air-‐fuel ratio
Removal efficien
cy (%
)
14.4 14.814.6
100
50
0
Figure 1.2: Illustration of the catalytic conversion of CO, unburned hydrocarbons andNOx as a function of air-to-fuel ratio, over the TWC.
0
1
2
3
4
5
6
7
8
9
Euro I 1992
Euro II 1996
Euro III 2000
Euro IV 2005
Euro V 2008
Euro VI 2013
g/kW
h
Figure 1.3: The historical development of Euro emission standards for NOx emission forheavy-duty vehicles. Data for this chart is collected from Ref. [4].
3
1.2 Objectives
The aim of this work is to study the nature of the active sites of the Ag/Al2O3
catalyst and the impact of the structure of the reductant on the lean NOx
reduction over alumina-based silver and indium catalysts. For this purpose, aAg/Al2O3 catalyst is compared to an In/Al2O3 catalyst containing the samemolar amount of active phase, using various C2-hydrocarbons and oxygenates(paper I), and H2-assisted NH3 (paper II), as reductants. The connectionsbetween the gas-phase environment, and type of silver and indium speciesin the samples are investigated using UV-vis spectroscopy (paper I & II).Furthermore, the impact of the location of the urea spray injection on NOreduction and ammonia slip in H2-assisted NH3-SCR is quantified (paperIII).
4

Chapter 2
Background
2.1 Challenges associated with lean NOx
reduction
Development of lean NOx reduction catalysts for usage in vehicles involvesseveral challenges. For example, the engine operates under transient loading,which results in variations in temperature and flow rate of the exhaust streamover time. Hence, a successful catalyst should be able to operate properlyover a wide temperature range and exhaust flow rate. During lean operationin energy-efficient engines, such as the diesel engine, the exhaust temperatureis considerably lower compared to the stoichiometric gasoline engine, around150-250°C in light-duty exhaust and 100-200°C in heavy-duty [11]. The leanNOx reduction catalyst must therefore be able to operate effectively at lowtemperatures. Furthermore, the catalyst is subjected to small amounts ofelectronegative elements such as sulfur and phosphorus, which tend to adsorbstrongly to the surface and poison the catalyst by physical or electronicblockage of active sites [12]. Another degradation mechanism is sintering,of the active phase, which leads to loss in surface area and increase in theaverage surface coordination. Formation of volatile compounds, containingthe active phase, also contributes to catalyst depletion, as well as foulingof pores. In addition to these demands on a successful lean NOx reductioncatalyst to provide high activity at low temperature and to avoid degradation,space limitations onboard a vehicle need to be considered. Some of today’spromising techniques are presented in Section 2.2.
5
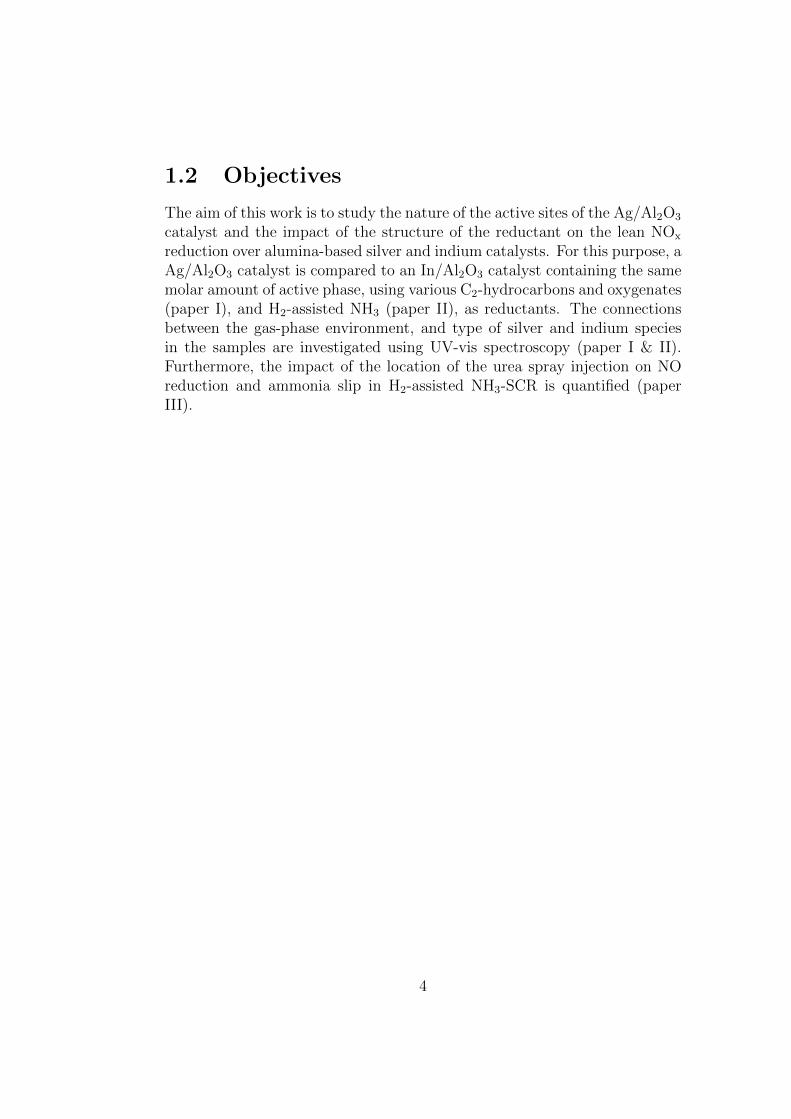
channel
washcoat
wall
Figure 2.1: A schematic illustration of a monolithic reactor with the entrance of fourindividual channels enlarged. The washcoat consists of the porous support material andthe catalytically active phase.
2.2 Methods for conversion of NOx
Today, the standard of vehicle emission control is monolithic reactors, typi-cally made of a porous ceramic substrate material such as cordierite, but canalso be metallic. The ceramic substrate consists of thousands of channelsand is coated with the catalytic material, which consists of a porous sup-port material, in order to provide a large surface area, and the active phase.Figure 2.1 shows a typical monolithic catalyst. In this section, some of thepromising techniques for lean NOx reduction is presented.
2.2.1 NOx storage and reduction
A promising technique for lean NOx reduction is NOx storage and reduction(NSR), where Pt and BaO supported by Al2O3 is the most commonly usedcatalytic material. In this approach, NO is first oxidized to NO2 over Ptand subsequently adsorbed as stable nitrite or nitrate species on the storagematerial BaO during a lean phase, which lasts for 1-2 minutes. During asubsequent rich (oxygen deficiency) period of 3-5 seconds, the trapped NOx
is released and reduced to N2 by unburned fuel and CO over Pt [13-15].Drawbacks of this technique include the complexity of the engine systemand fuel penalty during the rich periods [16]. Also, the formation of stable
6
sulfates with the NOx-storage material and the oxide support makes theNSR-catalyst degrade over time, and in requirement of regeneration, whichis usually performed under high temperatures (>600 °C) and during the richpart of the cycle [17].
2.2.2 Hydrocarbon-SCR
Another feasible solution for lean NOx reduction is selective catalytic re-duction using hydrocarbons (HC-SCR) [7, 18-23]. In this approach, thehydrocarbon-based fuel is injected into the exhaust system upstream theSCR catalyst and used as reducing agent for NOx over the catalyst. Anadvantage of using the fuel as the reductant is that there is no need for anadditional tank for reductant storage onboard the vehicle, and thereby beinga NOx reduction system that is not limited to heavy-duty vehicles. However,some of the challenges regarding this technique are to receive high conversionof NOx with high selectivity to N2 despite high oxygen concentration, lowtemperature, transient loadings and exposure to sulfur and water.
The exact reaction scheme of lean NOx reduction with hydrocarbons isstill under debate. However, some general differences have been detectedover different types of catalysts, based on noble metals, oxides or zeolites.The TWC is based on various combinations of noble metals such as Pt, Pdand Rh as the active phase and converts HC, CO and NOx effectively un-der stoichiometric conditions at 400-800°C. Since this catalyst proved to becompletely ineffective for NOx reduction during large excess of oxygen, theplatinum group metals (PGMs) were first assumed to be incapable of reduc-ing NOx in lean conditions. However, although PGM-based catalysts areineffective at moderate or high temperatures, they have showed to be activefor NOx reduction at low temperatures (typically below 300°C) [18]. Reactionmechanisms proposed for lean NOx reduction by short-chained alkene-typehydrocarbons over Pt are i) the intermediacy of cyanide or isocyanate surfacespecies, ii) the intermediacy of organo-nitro species and iii) decompositionof NO followed by oxygen removal by the HC [18].
NO adsorbs as strongly bound nitrite and nitrate species in excess oxygen(but adsorbs only weakly in absence of oxygen) on most catalyst surfaces [24].Over oxide catalysts, the first step in the reaction mechanism is proposed tobe the surface adsorption of NOx. Adsorbed oxidized hydrocarbon species,such as acetate [22, 25], are formed during SCR with various hydrocarbonsor oxygenates over alumina-based catalysts, and are believed to react withthe adsorbed NOx species, yielding organo-nitrogen species, which appearsto be the rate-determining step [18]. Via these species, reduced nitrogenspecies, such as –NCO and NH3 can be formed. It has been proposed that
7

the nitrogen coupling to form N2 could occur by a reaction between thesereduced species and NO(g) or adsorbed NOx [18, 26].
2.2.3 NH3-SCR
NH3-SCR is an already implemented technique for the reduction of NOx onheavy-duty vehicles such as buses and trucks [27]. Traditional active metaloxides used in NH3-SCR are V2O5, WO3 and MoO3 [15], where the vanadium-based catalyst is the most active for lean NOx removal. However, usage ofthis highly toxic catalyst poses some serious problems involving high vaporpressure of vanadium oxides that might form volatile vanadia species leadingto toxic emissions [28], which calls for new types of catalytic materials. Toavoid storage and handling issues of ammonia, the reductant is injected tothe exhaust system as a urea-water solution, which decomposes to ammoniaover the catalyst. Alumina has been shown to be especially suitable forthis decomposition [28]. However, there are some disadvantages regardingNH3-SCR, such as distribution of the urea solution and the possibility thatunreacted ammonia is emitted (so called ammonia slip) [29].
2.3 Alumina-supported catalysts
2.3.1 The Ag/Al2O3 catalyst
Alumina-supported catalysts have received much attention thanks to theirhigh stability under hydrothermal conditions. The alumina phase mostwidely used for this purpose is the porous and amorphous γ-Al2O3, whichprovides a high surface area (100-300 m2/g). This support material is pre-pared by calcination of Boehmite (AlO(OH)) or Bayerite/Gibbsite (Al(OH)3)at 500-850°C.
Miyadera was the first reporting on alumina-supported silver (Ag/Al2O3)catalysts in 1993 [30]. Ever since, a major interest has been directed towardsthis catalyst, which exhibits SCR activity both with ammonia [31-35] andhydrocarbons [21, 30, 36-38]. The optimal silver loading has been frequentlystudied and it has been found to be around 2 wt% for impregnated catalysts[8, 22, 26, 39, 40]. The reason for this has been suggested to involve theoptimal silver density, which should be close to 0.7 Ag/nm2 [41].
The species active for SCR of NOx has been suggested to be Ag+-ions[22, 42, 43] and small clusters of ionic silver (Agn
δ+, n ≤ 8) [32, 43], ora combination of these. Metallic silver particles are most likely active fortotal oxidation of the reductant by molecular oxygen [26]. Moreover, it has
8

also been suggested that active sites of Ag/Al2O3 vary as a function of thereductant type and reaction temperature [23]. Over Ag/Al2O3, the followingreactions are proposed to be involved: i) oxidation of NO to NO2 followedby the formation of surface nitrites and nitrates, ii) adsorption and partialoxidation of hydrocarbons, and iii) surface reactions between the adsorbednitrogen species and the partially oxidized hydrocarbons [14].
The ’hydrogen effect’
That the addition of small amounts of hydrogen to the gas feed majorlypromotes the NOx reduction activity over the Ag/Al2O3 catalyst was firstdiscovered by Satokawa [44], and has later been widely studied [7, 33, 41, 45].The effect is reversible so that addition/removal of hydrogen from the feedincreases/decreases the SCR activity instantly. Such cycles can be repeatedwithout loss in catalytic performance [7, 43]. Moreover, the mechanism(s) be-hind this promotion has been widely debated. Suggestions involve reductionof adsorbed nitrogen species [45-48], enhanced activation of the hydrocarbonin HC-SCR [32, 43, 48-50], modification of the Ag-species [32, 43, 48, 49], aswell as direct effects on the reaction mechanism [48, 51]. During NH3-SCR,Ag/Al2O3 lacks in activity without the presence of hydrogen in the feed whileNOx is completely converted at relatively low temperatures when hydrogen ispresent [31]. In/Al2O3 has shown a minor hydrogen effect during NH3-SCR[52].
2.3.2 The In/Al2O3 catalyst
Alumina-supported indium has been studied as an SCR catalyst, both withNH3 [52] and hydrocarbons [20, 53-55]. This catalyst has shown relativelyhigh activity in the presence of water, and a catalyst prepared by the sol-gel method shows higher activity than that by impregnation [56]. Park etal. [57] proposed that, during HC-SCR, well-dispersed indium oxide clustersprovide hydrocarbon activation that, with utilization of active alumina sites,selectively reduce NOx to N2.
9

10

Chapter 3
Scientific methods
3.1 Catalyst preparation and monolith
coating
The catalysts evaluated in this work have been prepared by incipient wetnessimpregnation of γ-Al2O3 (PURALOX® SBa 200, Sasol) using silver nitrate(≥ 99.0% Sigma-Aldrich) for the Ag/Al2O3 sample and indium nitrate hy-drate (99.99% Sigma Aldrich) for the In/Al2O3 sample. In this preparationmethod, the pore volume of the support material (in this case γ-Al2O3) is de-termined by slowly adding drops of water that migrate into the pores. Whenthe support is saturated the powder attains a creamy consistence. The ac-tive phase precursor is dissolved in a volume of water that corresponds to thepore volume of the support material and the precursor solution is added tothe support. The Ag loading was 2.0 wt% and the In loading correspondedto the equivalent molar amount, giving an In loading of 2.1 wt%. After theaddition of precursors, the powder samples were frozen by liquid nitrogensubsequent to the impregnation, then freeze-dried and finally calcined in airat 600°C for four hours.
Monoliths with 188 channels (400 CPSI, ∅ = 20 mm, L = 20 mm) were cutfrom a commercial cordierite honeycomb structure (Corning) and calcined inair at 600°C for one hour. Washcoat slurries were prepared, containing binderagent (DISPERAL® P2, Sasol) and one of the powder catalysts (ratio 1:4)in 1:1-ratio ethanol-water solutions. Monoliths were dipped into the slurries,gently shaken for removal of excess slurry, dried in a 90°C hot air streamand subsequently calcined at 500°C for 3 minutes. The coating procedurewas repeated until the washcoat mass corresponded to 20% of the coatedmonolith mass. Finally, the monoliths were calcined in air at 600°C for onehour. A coated monolith sample is shown in Figure 3.1.
11

Figure 3.1: A monolith coated with Ag/Al2O3.
3.2 Characterization techniques
3.2.1 Specific surface area according to the BET-method
The specific surface area of a solid material can be determined accordingto the method published in 1938 by Brunauer, Emmett and Teller [58] (theBET-method). The technique is based on physical adsorption of an inertgas (most often nitrogen) on the surface of the solid material. Generally,the method provides reliable values of the surface area, unless the sampleinvolves micropores, where the size of the pores in the adsorbent and theadsorbate is similar [59]. The method assumes that i) the heat of adsorptionof the first monolayer is constant, ii) the lateral interaction of the adsorbate isnegligible, iii) the adsorbed molecules can act as new adsorption surface andthe process can repeat itself and iv) the heat of adsorption of all monolayersbut the first is equal to the heat of condensation [60]. In practice, the sampleis first heated up under vacuum to remove moisture and subsequently cooleddown to 77 K by liquid nitrogen. At this temperature N2 is dosed in smallvolumes and the pressure is allowed to stabilize. The physisorbed volume ofN2 can now be calculated using the ideal gas law. Knowing the area of oneadsorbed N2-molecule, the specific surface area of a sample can be derivedfrom the following formula:
P
V (P0 − P )=
1
VmC+C − 1
VmC
P
P0
(3.1)
where P is the equilibrated partial pressure, V is the volume of absorbedgas, P0 is the saturation pressure and Vm is the inert gas monolayer volume.At low pressure, the relationship between P/V (P0 − P ) and P/P0 is linear,hence it follows that 1/VmC is where the straight line intercepts the y-axisand (C − 1)/(VmC) is the slope of the line.
In Paper I, II and III, N2 sorption according to the BET-method was
12

X-‐ray source Detector
θ 2θ
Sample
Figure 3.2: Illustration of an X-ray diffraction experiment.
used to determine the specific surface area of the powder catalyst samplesusing a Micrometrics TriStar® 3000 instrument.
3.2.2 X-ray diffraction – Crystal structure
The non-destructive technique X-ray diffraction (XRD) can be used to ex-amine the crystal phase of a sample. When irradiated by X-rays with thewavelength λ, electron clouds of the crystal-structured atoms scatter the X-rays, which are measured by a detector. The distance between the latticeplanes, d, can then be calculated by Bragg’s law:
nλ = 2d sin Θ (3.2)
Where n is any integer and Θ the incident angle.The crystal phases of the catalysts were investigated using XRD (Siemens
D5000 X-ray diffractometer scanning 2Θ from 5 to 65° in the scan mode 0.02°,1 s) with Ni-filtered Cu κα radiation. XRD was used in Paper I and II. Anillustration of the technique is presented in Figure 3.2.
3.2.3 NH3-TPD – Surface acidity
The density and strength of the acidic sites of a catalytic sample can becharacterized by temperature programmed desorption (TPD) of NH3. In thiswork, the flow reactor described in section 3.3 was used for this experiment.
13

111
SourceFilter
Monochromator
Tilting mirror
Sample
Reference
Recorder
Detector
Figure 3.3: A schematic diagram of a UV-vis spectrometer operating in the diffusereflectance mode. Adapted from Ref. [61].
Prior to the NH3 adsorption, the sample is pretreated to remove possiblecarbonaceous matter. By saturating the catalytic sites by this strong base atlow temperature (around 100°C) and then slowly increase the temperature,the amount of NH3 able to chemisorb to the sites at low temperature is des-orbed and can be measured. Weakly adsorbed NH3 is released first and morestrongly bound at somewhat higher temperatures, which gives the possibilityto distinguish between different kinds of acidic sites. NH3-TPD was used inpaper I, II and III.
3.2.4 UV-visible diffuse reflectance spectroscopy– Surface species
Electronic d-d transitions are observable in the ultraviolet and visible lightregion (200-2000 nm) when degenerated d orbitals are split by placing a tran-sition metal ion in a crystal field. Furthermore, the number of d-electrons,the effective charge on the ion and the distribution and charge of the sur-rounding anions are circumstances that affect the spread of the energy levels[61]. Consequently, the technique can be used for characterization of thetypes of species present in a solid sample. A typical beam path is visualizedin Figure 3.3.
In this study, UV-vis was used to characterize the oxidation states ofthe samples studied in Paper I and II, where spectra have been deconvolutedinto Gaussian peaks. Spectra in the range 200-1500 nm were recorded using aVarian Cary 5000 UV-vis-NIR spectrophotometer equipped with an externalDRA-2500 unit. The reflectance spectra were recorded and the spectrum ofthe Al2O3 support was subtracted as part of the background. To investigatethe influence of reaction conditions on the type of surface species, both freshcatalysts and samples exposed to various gas-phase pretreatments, using theflow reactor described below (3.3), were analyzed.
14

Competence Centre for Catalysis
Gas phase FTIR
Catalyst sample
Inflow
InsulationQuartz tube
Heating coil
Figure 3.4: Illustration of the flow reactor used in the NOx-reduction experiments, UV-vis pretreatments and for the NH3-TPD.
3.3 Flow reactor experiments
The catalytic activity for lean NOx reduction was evaluated during extinctionramps (500 to 100°C by 10°C/min), using a flow reactor illustrated in Figure3.4. The reactor chamber consists of an insulated horizontal quartz tube (L= 80 cm, ∅i = 22 mm) heated by a metal coil. The catalyst temperature ismeasured inside the sample and the reactor temperature is controlled 15 mmbefore the catalyst sample by K-type thermocouples. Uncoated monolithsplaced before and after the coated monolith shield the thermocouple fromheat radiation emitted by the heating coil as well as reduce axial radiationheat losses from the coated monolith sample [62]. The inlet feed gases areintroduced and regulated by mass-flow controllers (Bronkhorst Hi-Tech) andthe outlet gas flow is analyzed by a gas-phase FTIR spectrometer (MKS2030). Fluent hydrocarbons/oxygenates and water are introduced to thereactor via a controlled evaporator mixer system (CEM, Bronkhorst Low∆P Hi-Tech), carried by Ar.
The total gas flow was set to 3500 ml/min in all experiments, which corre-sponds to a space velocity (GHSV) of 33,400 h-1. Prior to each measurement,the sample was pretreated in O2 (10%, Ar balance) at 500°C for 30 min. Inthe HC-SCR study, the gas feed composition was 500 ppm NO, 1500 ppmC2-hydrocarbon (C/N ratio of 6, in line with previous experience [35, 37]),10% O2 and 5% H2O, in the presence or absence of 1000 ppm H2. The C2-
15
H3C CH3
EthaneH2C CH2
Ethene
H3C
C
OH
O
Acetic acid
H3C C OHH2
Ethanol
Dimethyl ether (DME)H3C
O
CH3
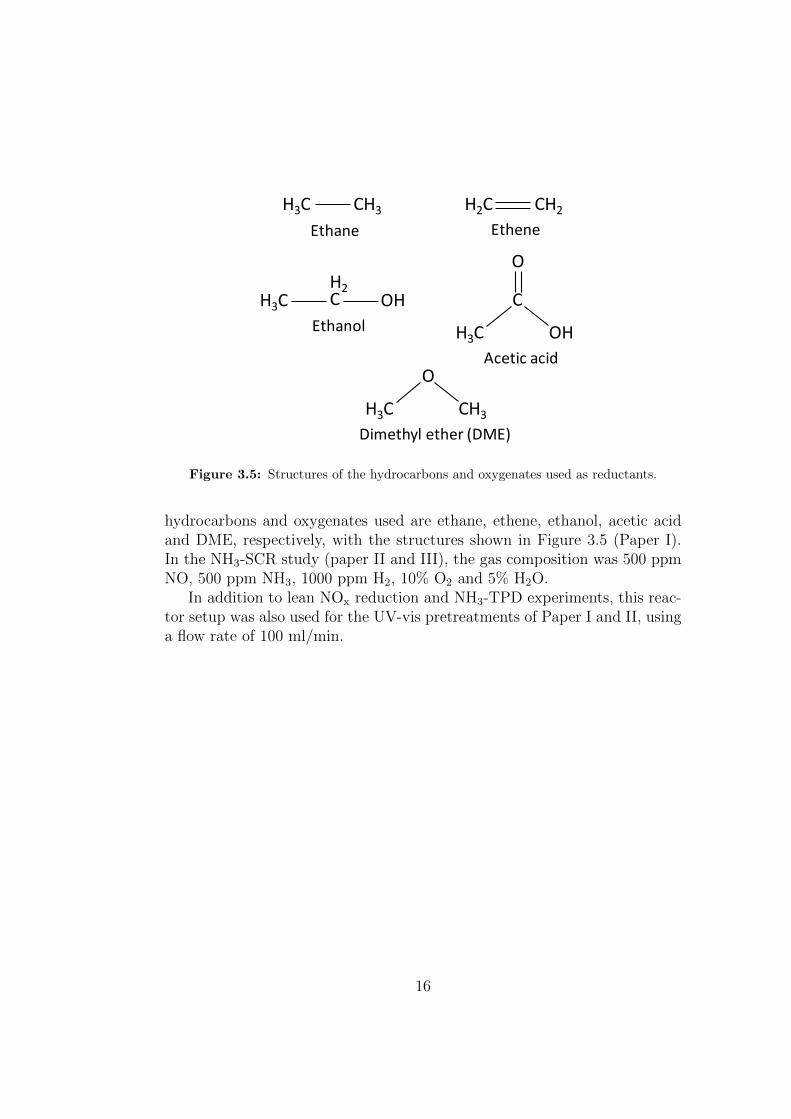
Figure 3.5: Structures of the hydrocarbons and oxygenates used as reductants.
hydrocarbons and oxygenates used are ethane, ethene, ethanol, acetic acidand DME, respectively, with the structures shown in Figure 3.5 (Paper I).In the NH3-SCR study (paper II and III), the gas composition was 500 ppmNO, 500 ppm NH3, 1000 ppm H2, 10% O2 and 5% H2O.
In addition to lean NOx reduction and NH3-TPD experiments, this reac-tor setup was also used for the UV-vis pretreatments of Paper I and II, usinga flow rate of 100 ml/min.
16
Chapter 4
Results and discussion
In the present work, Ag/Al2O3 has been evaluated as an SCR catalyst withhydrocarbons and oxygenates, as well as ammonia, as reductants. Duringthese experiments, the gas feed contained 500 ppm NO, 1500 ppm HC or500 ppm NH3, 10% O2 and 5% H2O. The experiments were performed inthe presence or absence of 1000 ppm H2 (Ar-balance). Furthermore, diffusereflectance UV-vis spectra have been recorded after various pretreatments,elucidating the effect of the reaction environment on the catalyst surfacespecies. In order to highlight the influence of the catalytic material on theNOx-reduction activity, Ag/Al2O3 has been compared to an In/Al2O3 cata-lyst, holding the equivalent molar amount of active phase. The results andrelating discussion of this work are presented in this section.
4.1 Influence of the reducing agent on lean
NOx reduction over Ag/Al2O3
The influence of the nature of the reducing agent on the lean NOx reduc-tion over Ag/Al2O3 was investigated using C2-hydrocarbons and oxygenates(paper I), and NH3 (paper II), with the results shown in Figure 4.1. The high-est activity is achieved using hydrogen-assisted ethane as reductant. How-ever, the other non-oxygenated hydrocarbon, ethene, starts reducing NOx
at somewhat lower temperature, compared to ethane, when hydrogen is ab-sent. Among the oxygenated hydrocarbons, ethanol shows the highest NOx
reduction followed by acetic acid. With these reductants, the addition of hy-drogen provides a shift in the activity window towards lower temperatures.Furthermore, DME lacks in activity both with and without hydrogen overthis catalyst. Similarly, ammonia is totally inactive as reducing agent overAg/Al2O3 when hydrogen is absent. However, in presence of hydrogen, am-
17

monia shows high activity already at low temperatures. The diversity inactivity among these reductants demonstrates that the nature of the reduc-ing agent is very important when designing a successful catalytic system.During HC-SCR, the current work demonstrates that NOx reduction variesas a function of the structure of the reductant, since despite that all HCreductants are based on two carbon atoms, the activity for NOx reductiondiffers significantly over the same catalyst. Parameters such as activation(i.e. partial oxidation) ability of the hydrocarbon, which in turn depends onthe nature of the C-H (or C-C) bonds, accessibility of π-electrons, molecularorientation (steric effects) and sticking probability of the reductant have beenidentified as critical factors [38, 55, 56, 63, 64].
4.1.1 Influence of the gas-phase environment on theAg phase
In order to investigate how the surface species of the Ag/Al2O3 catalystare affected by the gas-phase environment, UV-vis spectra were recorded af-ter various pretreatments. The Al2O3-subtracted UV-vis spectrum of theAg/Al2O3 sample is shown in Figure 4.2. The spectrum has been deconvo-luted using Gaussian peaks for identification purposes. Peaks in the range200-260 nm are attributed to the 4d10 to 4d9s1 transition of dispersed Ag+
ions [42, 65-70]. However, it should also be noted that isolated Ag+ ionsexhibit peaks just below 200 nm [32, 71], which could not be detected due toinstrument limitations. Furthermore, peaks in the range 238-370 are assignedto small Agn
δ+ clusters (n ≤ 8) [22, 67, 68, 72], and peaks above 390 nm areattributed to Ag0 particles [22, 42, 68, 70, 73]. Hence, the UV-vis spectrumof the fresh Ag/Al2O3 sample shows that the sample contains a mixture ofions, clusters and metallic silver. Shimizu and Satsuma [23] demonstratedthat the sites active for hydrocarbon activation varies as a function of thereaction conditions, especially with reductant type and temperature. Duringalkene-SCR, Ag+-ions or Ag+-containing species have been shown to pro-vide hydrocarbon-activating sites. Alkanes exhibit lower activity comparedto alkenes, and alkane-SCR therefore proceeds at higher temperatures, whereAgn
δ+ clusters provide active sites for hydrocarbon activation [23]. Further-more, XRD diffractograms confirm that no particles larger than 3-5 nm ofother crystalline phases than γ-Al2O3 are present in the sample [61]. Figure4.3 shows that the impregnated silver sample is similar to the bare γ-Al2O3
sample, and that all peaks are characteristic for γ-Al2O3 [54, 74]. Moreover,the specific surface area, measured by N2-sorption according to the BETmethod, shows that the surface area of the catalyst samples remains high
18
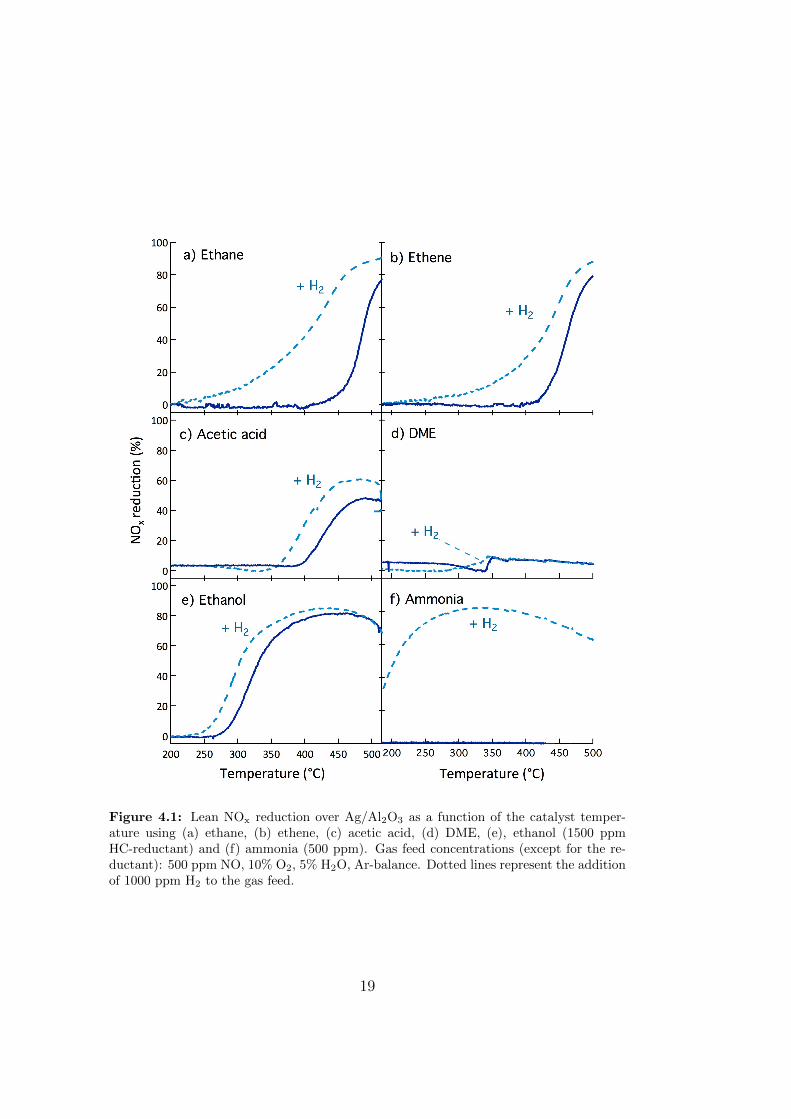
Figure 4.1: Lean NOx reduction over Ag/Al2O3 as a function of the catalyst temper-ature using (a) ethane, (b) ethene, (c) acetic acid, (d) DME, (e), ethanol (1500 ppmHC-reductant) and (f) ammonia (500 ppm). Gas feed concentrations (except for the re-ductant): 500 ppm NO, 10% O2, 5% H2O, Ar-balance. Dotted lines represent the additionof 1000 ppm H2 to the gas feed.
19

after impregnation (185, compared to 197 m2/g of bare Al2O3).As shown in the lean NOx reduction experiments presented in Figure
4.1, the Ag/Al2O3 sample exhibits in general higher NOx conversion whenhydrogen is present in the feed gas mixture. UV-vis spectra recorded afterhydrogen pretreatments at 200 and 300°C are shown in Figure 4.4, and clar-ifies that hydrogen exposure results in a change of surface species. Peaksat higher wavelengths (>260 nm) increase significantly, corresponding to in-creased concentration of silver clusters (Agn
δ+) and metallic silver nanopar-ticles (Ag0). The degree of reduction seems to increase with temperaturesince the pretreatment at 300°C results in a higher degree of totally reducedsilver, compared to the pretreatment at 200°C. Moreover, during HC-SCR,an important reaction step has been identified as activation of the reductantby partial oxidation [14]. Agn
δ+ clusters have been pointed out as sites ac-tive for this reaction step [43]. Hence, the concentration of sites identified asactive for hydrocarbon activation increase with small amounts of hydrogenin the surrounding gas phase, which could be an origin to the ‘hydrogen ef-fect’ during HC-SCR. Also in NH3-SCR, Agn
δ+ clusters have been identifiedas key sites in the SCR reaction [32, 34]. Moreover, Figure 4.5 shows thedeconvoluted spectra of the Ag/Al2O3 sample pretreated in an SCR mixtureof NO, NH3 and O2 (Ar-bal). It is clear that peaks in the region assignedto isolated Ag+ ions (200-260 nm) increase in this oxidizing environment.Comparing the spectra, it can be seen that peaks in the wavelength rangeassigned to Agn
δ+ clusters that still are present after the treatment at 200°C,have disappeared after the exposure at 300°C. This implies that when hy-drogen is present in the gas-phase environment, silver clusters are conservedat higher temperatures, which might be an important function of hydrogenin NH3-SCR. This is in accordance with the reaction mechanism suggestedfor NH3-SCR by Shimizu and Satsuma [32]: i) dissociation of H2 on the Agsite, ii) spillover of the H atom to form a proton on Al2O3, iii) aggregationof isolated Ag+ ions to Agn
δ+-clusters (n ≤ 8), iv) reduction of O2 underthe cooperation of Agn
δ+-clusters and H+ to O2-, H2O and Agn
δ+ or Ag+,v) N-H activation by O2
- to yield NHx (x ≤ 2) vi) oxidation of NO by O2-
forming NO2 and vii) reaction between NHx and NO to yield N2 and H2O. Astudy by Tamm et al. [75], confirms that silver is needed for the dissociationof H2 which directly participates in the mechanism and also that the NO toNO2 oxidation is part of the reaction mechanism.
4.1.2 Effect of the reductant dosage
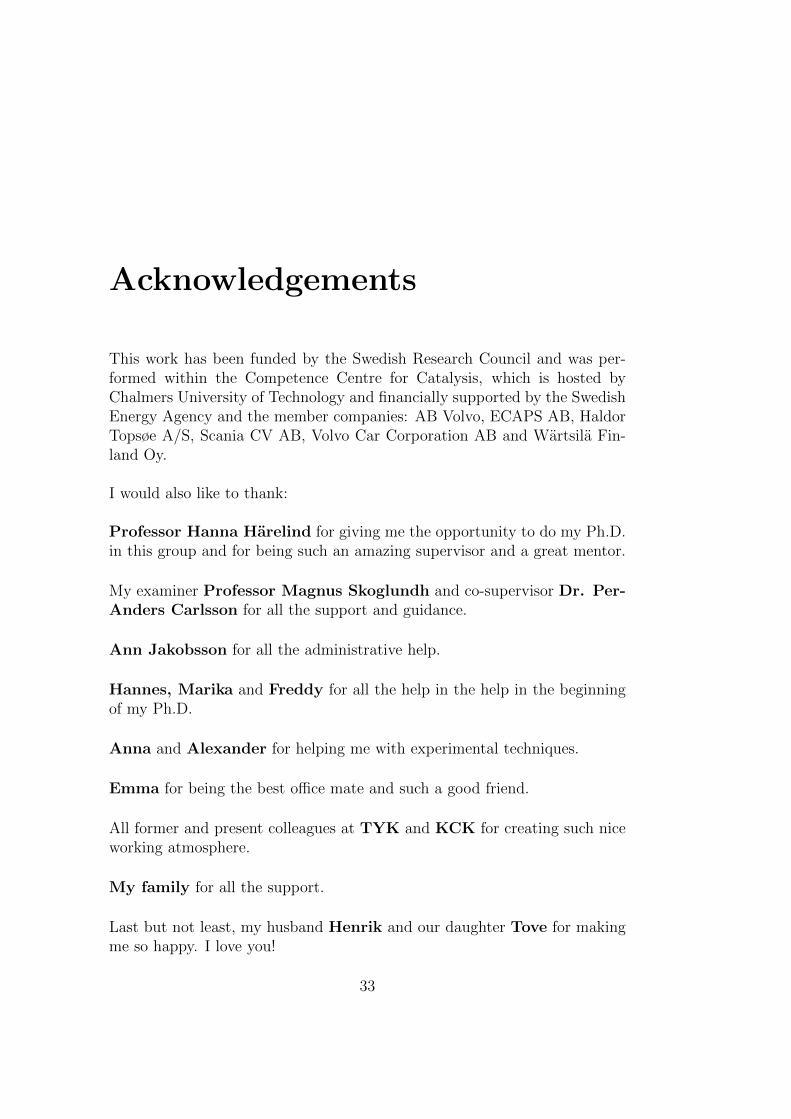
The reductant in NH3-SCR is typically supplied from urea, which decomposesto ammonia over the catalyst, see Figure 4.6 for a schematic illustration of a
20

Absorbance,
alum
ina subtracted
(a.u.)
200 300 400 500 600
Ag+
Agnδ+Ag0
Wavelength (nm)
Figure 4.2: Alumina-subtracted UV-vis spectrum of the fresh Ag/Al2O3 sample withpeak intervals assigned to isolated Ag+-ions, Agn
δ+-clusters and Ag0.
Inte
nsity
(a.
u.)
6050403020102θ (º)
Ag/Al2O3
Al2O3
Figure 4.3: XRD patterns of the Ag/Al2O3 and γ-Al2O3 samples. The solid line repre-sents the floating median of the intensity in the diffractograms.
21

Absorbance,
alum
ina subtracted
(a.u.)
Wavelength (nm)
a b
200 300 400 500 600200 300 400 500 600
Silver H2
Figure 4.4: Alumina-subtracted UV-vis spectra of the Ag/Al2O3 sample pretreated inH2 at a) 200°C and b) 300°C.
Absorbance,
alum
ina subtracted
(a.u.)
Wavelength (nm)
a b
200 300 400 500 600200 300 400 500 600
Silver scr
Figure 4.5: Alumina-subtracted UV-vis spectra of the Ag/Al2O3 sample pretreated inan SCR mixture of NO, NH3 and O2 at a) 200°C and b) 300°C.
22

urea-SCR system. However, optimizing the spray setup is difficult and mayresult in uneven ammonia distribution, causing inefficient NOx conversionand ammonia slip. A quantification and analysis of this issue is addressed inPaper III.
The degree of uneven distribution of ammonia to each individual catalystchannel in a hydrogen-assisted NH3-SCR Ag/Al2O3 catalyst is evaluated fortwo different cases; with the injection spray situated in the center of theexhaust pipe or at the pipe wall. In this study, the results of the computa-tional fluid dynamics (CFD) simulation by Lundstrom and Strom [76] werecombined with a kinetic model developed by Tamm et al. [33], adapted tonew experimental data. Gaussian probability distribution functions for thetwo cases of ammonia dosage are shown in Figure 4.7, where the probabilitythat a catalyst channel receives a certain ammonia dose is plotted versus therange of doses seen in the raw data. The ammonia dose is here normalized bythe average dose, so that an ammonia dose of two indicates that the channelin question receives twice the amount of ammonia that the average channeldoes. It is clear that the arrangement with the spray positioned in the centerof the exhaust pipe produces more evenly distributed ammonia to the inletof the catalyst than the arrangement with the spray originating from theexhaust pipe wall. However, both arrangements produce a large spread inthe dose to the individual channel.
Figure 4.8 shows the NO conversion and the ammonia slip as functions ofthe normalized ammonia dose. These are calculated with the kinetic modelusing the input parameters of the Ag/Al2O3 catalyst described previously. Itis assumed that an average dose implies dosing 500 ppm NH3 (and 1000 ppmH2) to reduce the 500 ppm NO, which is consistent with the fact that theglobal stoichiometry between NO:NH3:H2 is 1:1:2 during the SCR reactions[31]. The NO conversion increases rapidly with increasing dose from zeroto unity, and then it increases another 10 percentage points up to a dose ofapproximately four times the average, after which no further improvementin NO conversion is observed with increasing ammonia dosage. However,the ammonia slip increases almost linearly above an ammonia dose equal tounity and reaches more than 4500 ppm for a channel that receives 10 timesthe average ammonia dose. For doses lower than unity, the ammonia slip isinsignificant.
The average NO conversions and ammonia slips for the two spray ar-rangements depicted in Figure 4.7 are shown in Table 4.1. These values arecalculated with the micro-kinetic model for the distribution of channel in-let conditions seen in the raw CFD data. It is shown that the global NOconversion is higher with the more evenly distributed ammonia concentra-tion obtained for the centered spray arrangement. The largest differences are
23
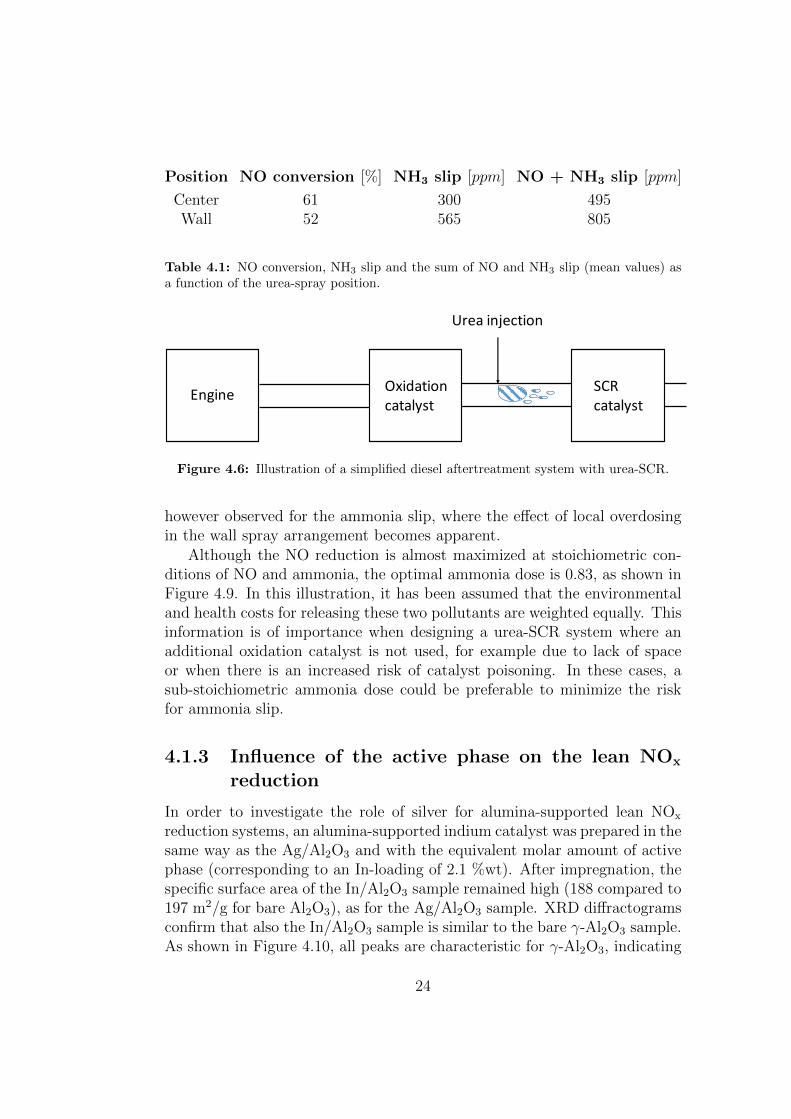
Position NO conversion [%] NH3 slip [ppm] NO + NH3 slip [ppm]
Center 61 300 495Wall 52 565 805
Table 4.1: NO conversion, NH3 slip and the sum of NO and NH3 slip (mean values) asa function of the urea-spray position.
EngineEngine Oxidation catalyst
SCR catalyst
Urea injection
Figure 4.6: Illustration of a simplified diesel aftertreatment system with urea-SCR.
however observed for the ammonia slip, where the effect of local overdosingin the wall spray arrangement becomes apparent.
Although the NO reduction is almost maximized at stoichiometric con-ditions of NO and ammonia, the optimal ammonia dose is 0.83, as shown inFigure 4.9. In this illustration, it has been assumed that the environmentaland health costs for releasing these two pollutants are weighted equally. Thisinformation is of importance when designing a urea-SCR system where anadditional oxidation catalyst is not used, for example due to lack of spaceor when there is an increased risk of catalyst poisoning. In these cases, asub-stoichiometric ammonia dose could be preferable to minimize the riskfor ammonia slip.
4.1.3 Influence of the active phase on the lean NOx
reduction
In order to investigate the role of silver for alumina-supported lean NOx
reduction systems, an alumina-supported indium catalyst was prepared in thesame way as the Ag/Al2O3 and with the equivalent molar amount of activephase (corresponding to an In-loading of 2.1 %wt). After impregnation, thespecific surface area of the In/Al2O3 sample remained high (188 compared to197 m2/g for bare Al2O3), as for the Ag/Al2O3 sample. XRD diffractogramsconfirm that also the In/Al2O3 sample is similar to the bare γ-Al2O3 sample.As shown in Figure 4.10, all peaks are characteristic for γ-Al2O3, indicating
24

0 2 4 6 8 10 12 140
0.1
0.2
0.3
0.4
NH3 dose
prob
abilit
y
centeredat the wall
Figure 4.7: Probability distribution function of the NH3 dose, where a NH3 dose equalto 1 represents the stoichiometric dose.
0 1 2 3 4 5 6 7 8 9 100
20
40
60
80
100
NO
con
vers
ion
[%]
0 1 2 3 4 5 6 7 8 9 100
1000
2000
3000
4000
5000
NH
3 slip
[ppm
]
NH3 dose
Figure 4.8: NO conversion (left axis) and NH3 slip (right axis) as a function of the NH3
dose in an individual catalyst channel at 300°C.
25

0 0.5 1 1.5 2100
200
300
400
500
600
700
NH3 dose
NO +
NH 3 o
ut [p
pm]
Figure 4.9: The sum of NO and ammonia slip as a function of the normalized ammoniadose to each channel.
that no particles larger than 3-5 nm of other crystalline phases than γ-Al2O3
are present in the sample. This catalyst is compared to the Ag/Al2O3 catalystfor HC-SCR in Paper I and NH3-SCR in Paper II.
The activity of In/Al2O3 as an SCR catalyst is shown in Figure 4.11.Compared to Ag/Al2O3, this catalyst exhibits in general a lower degree ofNOx reduction. However, In/Al2O3 reduces NOx significantly much moreefficient with DME compared to the Ag/Al2O3 sample, which was totallyinactive for this reduction, as shown in Figure 4.2. It has been reported byTamm et al. [77] that DME undergoes gas-phase radical reactions with NO,O2 and H2O, which changes the gas-phase composition considerably beforereaching the catalyst. A catalyst suited for DME-SCR should therefore holdother properties than HC-SCR catalysts for non-oxygenated hydrocarbons.One reason that Ag/Al2O3 is not suitable as DME-SCR catalyst, could beits oxidizing properties, which may totally oxidize DME. Moreover, the NH3-TPD experiment shown in Figure 4.12 demonstrates that the In/Al2O3 sam-ple holds a higher concentration of acidic sites, compared to the Ag/Al2O3
sample. It has been reported that catalysts that exhibit a high concentra-tion of weak acidic sites are more efficient in DME-SCR [78]. The experimentalso shows that bare Al2O3 exhibits an even higher number of acidic sitesthan In/Al2O3. However, Erkfeldt et al. [74] demonstrated that In/Al2O3
shows higher activity for NOx reduction with DME, compared to In2O3 orAl2O3 alone. The authors suggest that this is owing to that In2O3 consumes
26

Inte
nsity
(a.
u.)
6050403020102θ (º)
In/Al2O3
Al2O3
Figure 4.10: XRD patterns of the In/Al2O3 and γ-Al2O3 samples. The solid line repre-sents the floating median of the intensity in the diffractograms.
a species that otherwise inhibits the reaction, resulting in a more efficientreaction path, or perhaps the formation of additional or more active reactionsites for the combined In/Al2O3 compared to the bare oxide.
In addition to Ag/Al2O3, In/Al2O3 also exhibits a promoting effect whenadding hydrogen. This is especially obvious with ethane and ammonia as re-ductants, as shown in Figure 4.11. The UV-vis spectra of fresh and hydrogen-pretreated In/Al2O3 are shown in Figure 4.13. Peaks in the range 200-450nm are attributed to In2O3, according to Refs. [79-84]. After pretreatmentin hydrogen, peaks increase at longer wavelengths, i.e. >450 nm, especiallyafter the pretreatment at 200°C. This indicates that the exposure of In/Al2O3
to hydrogen results in increased concentrations of species that are more re-duced than In2O3, which could explain the promoting effect of hydrogenduring NH3-SCR. However, the spectra also experience redshift and broad-ening of absorbance edges, especially after the pretreatment at 300°C, inthe wavelength range 200-300 nm. This indicates increased concentration ofIn2O3 [79]. Park et al. [57] propose that dispersed In2O2 clusters promote ac-tivation (i.e. partial oxidation) of HC that, with utilization of active aluminasites, selectively reduce NOx to N2. Hence, the promoting effect of hydrogenin HC-SCR could originate in increased formation of dispersed In2O3 clustersthat, in turn, enable HC activation.
27

50
40
30
20
10
0
NOx redu
c0on
(%)
Temperature (°C)
50
40
30
20
10
0
500400300200Temperature (°C)
500400300200
a) Ethane
d) Ammoniac) DME
b) Ethanol
+ H2
+ H2
+ H2
+ H2
Figure 4.11: Lean NOx reduction over In/Al2O3 as a function of the catalyst temperatureusing (a) ethane, (b) ethanol, (c) DME (1500 ppm HC-reductant) and (d) ammonia (500ppm), as the reductant. Gas feed concentrations (except for the reductant): 500 ppm NO,10% O2, 5% H2O, Ar-balance. Dotted lines represent the addition of 1000 ppm H2 to thegas feed.
28

300
250
200
150
100
50
0
NH3
(ppm
)
500400300200100Temperature (°C)
Ag/Al2O3
In/Al2O3
Al2O3
Figure 4.12: NH3-TPD profiles for the Ag/Al2O3, In/Al2O3 and bare γ-Al2O3 samples.
Absorbance,
alum
ina subtracted
(a.u.)
Wavelength (nm)200 300 400 500 600
a b
200 300 400 500 600
c
200 300 400 500 600
In2O3
Figure 4.13: Alumina-subtracted UV-vis spectra of In/Al2O3 showing a) fresh sample,b) pretreated in H2 at 200 °C and c) in 300°C.
29

30

Chapter 5
Conclusions and future outlook
Ag/Al2O3 has been evaluated as SCR catalyst with C2-hydrocarbons andoxygenates, as well as ammonia, in order to investigate the active sites andthe influence of the structure of the reducing agent during lean NOx reduc-tion. Furthermore, this catalyst was compared to an In/Al2O3 catalyst, con-taining the equivalent molar amount of active phase in order to elucidate therole of the active phase. The connections between the gas-phase environmentand type of silver and indium species in the samples were investigated usingUV-vis spectroscopy after various gas-phase pretreatments. Furthermore,the consequence of the reductant dosage over Ag/Al2O3 was investigated bycombining CFD simulations, kinetic modeling and experiments.
The results from the SCR experiments show that the Ag/Al2O3 cata-lyst in general exhibits superior activity for NOx reduction compared toIn/Al2O3. However, In/Al2O3 shows significantly higher activity with DMEas the reductant, which may be explained by gas-phase radical formation thatDME experiences together with the more pronounced ability of HC activa-tion (i.e. partial oxidation) that Ag/Al2O3 exhibits. The ‘hydrogen effect’observed over the Ag/Al2O3 sample may be explained by modification ofsurface species acquired after hydrogen exposure, resulting in increased con-centration of Agn
δ+-clusters. Such clusters have previously been identified askey components in the reaction mechanisms, both during HC- and NH3-SCR.Furthermore, the results show that in addition to Ag/Al2O3, In/Al2O3 alsoexhibits a ‘hydrogen effect’ during both HC- and NH3-SCR. Hydrogen expo-sure of In/Al2O3 results in an increased number of In2O3 species, which hasbeen identified as an active component for HC activation during HC-SCR.However, more reduced species are also formed during hydrogen exposure,which may be an explanation of the promoting effect of hydrogen duringNH3-SCR over this catalyst. Moreover, the hydrogen effect has been shownto be rapidly reversible when the hydrogen is removed from the gas feed. It
31

is likely that the origin of this phenomenon is dual and a direct participationof hydrogen in the NOx reduction reaction mechanism is feasible.
Quantification of the NO reduction and ammonia slip in different lo-cations of the reductant injection spray shows that the probability of anammonia dose equal to unity is higher when the spray is positioned in thecenter of the exhaust pipe, compared to at the pipe wall. However, botharrangements produce a large spread in the ammonia dose to the individualcatalyst channels. Furthermore, the NO conversion increases rapidly withincreasing ammonia dose from zero to unity, and then it increases another 10percentage points up to a dose of approximately four times the average, afterwhich no further improvement in NO conversion is observed with increas-ing ammonia dosage. However, the ammonia slip increases almost linearlyabove an ammonia dose equal to unity and reaches more than 4500 ppm fora channel that receives 10 times the average ammonia dose. For doses lowerthan unity, the ammonia slip is insignificant.
As a next step, a better understanding of the catalytic sites during reac-tion conditions could be achieved by studying the construction of nitrogen-and hydrocarbon species on the catalyst surface. A technique useful for thisis in-situ FTIR spectroscopy. Also, in-situ diffuse reflectance UV-vis spec-troscopy could contribute to a deeper understanding of the surface speciesinterplay during reaction conditions.
32
Acknowledgements
This work has been funded by the Swedish Research Council and was per-formed within the Competence Centre for Catalysis, which is hosted byChalmers University of Technology and financially supported by the SwedishEnergy Agency and the member companies: AB Volvo, ECAPS AB, HaldorTopsøe A/S, Scania CV AB, Volvo Car Corporation AB and Wartsila Fin-land Oy.
I would also like to thank:
Professor Hanna Harelind for giving me the opportunity to do my Ph.D.in this group and for being such an amazing supervisor and a great mentor.
My examiner Professor Magnus Skoglundh and co-supervisor Dr. Per-Anders Carlsson for all the support and guidance.
Ann Jakobsson for all the administrative help.
Hannes, Marika and Freddy for all the help in the help in the beginningof my Ph.D.
Anna and Alexander for helping me with experimental techniques.
Emma for being the best office mate and such a good friend.
All former and present colleagues at TYK and KCK for creating such niceworking atmosphere.
My family for all the support.
Last but not least, my husband Henrik and our daughter Tove for makingme so happy. I love you!
33

34
Bibliography
[1] U.S.E.P. Agency, Clean air act requirements and history, http://www.epa.gov, re-cieved 2015-08-13.
[2] I. Chorkendorff, J.W. Niemantsverdriet, Concepts of modern catalysis and kinetics,WILEY-VCH Verlag GmbH & Co. KGaA, Weinheim, 2007.
[3] Eurostat Emissions of nitrogen oxides by source sector, ec.europa.eu/eurostat Ac-cessed 2015-08-13.
[4] Dieselnet, http://www.dieselnet.com, Accessed 2015-12-03
[5] K. Arve, L. Capek, F. Klingstedt, K. Eranen, L.E. Lindfors, D.Y. Murzin, J. Dedecek,Z. Sobalik, B. Wichterlova, Top. Catal. 30-1 (2004) 91-95.
[6] J.P. Breen, R. Burch, C. Hardacre, C.J. Hill, J. Phys. Chem. B 109 (2005) 4805-4807.
[7] J.P. Breen, R. Burch, Top. Catal. 39 (2006) 53-58.
[8] H. Kannisto, H.H. Ingelsten, M. Skoglundh, J. Mol. Catal. A: Chem. 302 (2009).
[9] T. Miyadera, Appl. Catal., B. 16 (1998) 155-164.
[10] T. Nakatsuji, R. Yasukawa, K. Tabata, K. Ueda, M. Niwa, Appl. Catal., B. 17 (1998)333-345.
[11] P. Granger, V.I. Parvulescu, Chem. Rev. 111 (2011) 3155-3207.
[12] M. Bowker, The Basis and Applications of Heterogeneous Catalysis, Oxford SciencePublications, 1998.
[13] M.V. Twigg, Catal. Today 163 (2011) 33-41.
[14] R. Burch, Catal. Rev. -Sci. Eng. 46 (2004) 271-333.
[15] Z.M. Liu, S.I. Woo, Catal. Rev. -Sci Eng 48 (2006) 43-89.
[16] W.S. Epling, L.E. Campbell, A. Yezerets, N.W. Currier, J.E. Parks, Catal. Rev. -Sci.Eng. 46 (2004) 163-245.
[17] S. Matsumoto, Y. Ikeda, H. Suzuki, M. Ogai, N. Miyoshi, Appl. Catal., B. 25 (2000)115-124.
35

[18] R. Burch, J.P. Breen, F.C. Meunier, Appl. Catal., B. 39 (2002) 283-303.
[19] R. Brosius, K. Arve, M.H. Groothaert, J.A. Martens, J. Catal. 231 (2005) 344-353.
[20] T. Maunula, Y. Kintaichi, M. Inaba, M. Haneda, K. Sato, H. Hamada, Appl. Catal.,B. 15 (1998).
[21] K. Eranen, F. Klingstedt, K. Arve, L.E. Lindfors, D.Y. Murzin, J. Catal. 227 (2004)328-343.
[22] K. Shimizu, J. Shibata, H. Yoshida, A. Satsuma, T. Hattori, Appl. Catal., B. 30(2001).
[23] K. Shimizu, A. Satsuma, Phys. Chem. Chem. Phys. 8 (2006) 2677-2695.
[24] V.A. Sadykov, S.L. Baron, V.A. Matyshak, G.M. Alikina, R.V. Bunina, A.Y. Ro-zovskii, V.V. Lunin, E.V. Lunina, A.N. Kharlanov, A.S. Ivanova, S.A.
[25] K. Shimizu, M. Takamatsu, K. Nishi, H. Yoshida, A. Satsuma, T. Tanaka, S. Yoshida,T. Hattori, J. Phys. Chem. B 103 (1999).
[26] F.C. Meunier, J.P. Breen, V. Zuzaniuk, M. Olsson, J.R.H. Ross, J. Catal. 187 (1999)493-505.
[27] C. Ciardelli, I. Nova, E. Tronconi, D. Chatterjee, T. Burkhardt, M. Weibel, Chem.Eng. Sci. 62 (2007) 5001-5006.
[28] K.-i. Shimizu, A. Satsuma, Appl. Catal., B. 77 (2007) 202-205.
[29] F. Klingstedt, K. Arve, K. Eranen, D.Y. Murzin, Acc. Chem. Res. 39 (2006).
[30] T. Miyadera, Appl. Catal., B. 2 (1993) 199-205.
[31] S. Tamm, S. Fogel, P. Gabrielsson, M. Skoglundh, L. Olsson, Appl. Catal., B. 136(2013) 168-176.
[32] K.-i. Shimizu, A. Satsuma, J. Phys. Chem. C 111 (2007) 2259-2264.
[33] S. Tamm, L. Olsson, S. Fogel, P. Gabrielsson, M. Skoglundh, AIChE J. 59 (2013)4325-4333.
[34] L. Yu, Q. Zhong, S. Zhang, Phys. Chem. Chem. Phys. 16 (2014) 12560-12566.
[35] L. Zhang, C. Zhang, H. He, J. Catal. 261 (2009) 101-109.
[36] K. Masuda, K. Tsujimura, K. Shinoda, T. Kato, Appl. Catal., B. 8 (1996).
[37] T. Miyadera, Appl. Catal., B. 13 (1997) 157-165.
[38] H. Harelind, F. Gunnarsson, S.M.S. Vaghefi, M. Skoglundh, P.-A. Carlsson, ACSCatal 2 (2012) 1615-1623.
36
[39] T.E. Hoost, R.J. Kudla, K.M. Collins, M.S. Chattha, Appl. Catal., B. 13 (1997)59-67.
[40] L.E. Lindfors, K. Eranen, F. Klingstedt, D.Y. Murzin, Top. Catal. 28 (2004) 185-189.
[41] T. Chaieb, L. Delannoy, G. Costentin, C. Louis, S. Casale, R.L. Chantry, Z.Y. Li, C.Thomas, Appl. Catal., B. 156 (2014) 192-201.
[42] N. Bogdanchikova, F.C. Meunier, M. Avalos-Borja, J.P. Breen, A. Pestryakov, Appl.Catal., B. 36 (2002) 287-297.
[43] J. Shibata, Y. Takada, A. Shichi, S. Satokawa, A. Satsuma, T. Hattori, J. Catal. 222(2004) 368-376.
[44] S. Satokawa, Chem. Lett. (2000) 294-295.
[45] S. Tamm, N. Vallim, M. Skoglundh, L. Olsson, J. Catal. 307 (2013) 153-161.
[46] H. Kannisto, H.H. Ingelsten, M. Skoglundh, Top. Catal. 52 (2009).
[47] N.A. Sadokhina, D.E. Doronkin, G.N. Baeva, S. Dahl, A.Y. Stakheev, Top. Catal. 56(2013) 737-744.
[48] C. Thomas, Appl. Catal., B. 162 (2015) 454-462.
[49] P.S. Kim, M.K. Kim, B.K. Cho, I.-S. Nam, S.H. Oh, J. Catal. 301 (2013) 65-76.
[50] S. Satokawa, J. Shibata, K. Shimizu, S. Atsushi, T. Hattori, Appl. Catal., B. 42(2003) 179-186.
[51] R. Burch, J.P. Breen, C.J. Hill, B. Krutzsch, B. Konrad, E. Jobson, L. Cider, K.Eranen, F. Klingstedt, L.E. Lindfors, Top. Catal. 30-1 (2004) 19-25.
[52] D.E. Doronkin, S. Fogel, S. Tamm, L. Olsson, T.S. Khan, T. Bligaard, P. Gabrielsson,S. Dahl, Appl. Catal., B. 113 (2012) 228-236.
[53] J.H. Li, J.M. Hao, X.Y. Cui, L.X. Fu, Catal. Lett. 103 (2005).
[54] M. Boutros, J. Starck, B. de Tymowski, J.-M. Trichard, P. Da Costa, Top. Catal. 52(2009).
[55] T. Maunula, Y. Kintaichi, M. Haneda, H. Hamada, Catal. Lett. 61 (1999).
[56] M. Haneda, Y. Kintaichi, N. Bion, H. Hamada, Appl. Catal., B. 42 (2003).
[57] P.W. Park, C.S. Ragle, C.L. Boyer, M.L. Balmer, M. Engelhard, D. McCready, J.Catal. 210 (2002) 97-105.
[58] S. Brunauer, P.H. Emmett, E. Teller, J. Am. Chem. Soc. 60 (1938) 309-319.
[59] K.S.W. Sing, Adv. Colloid Interface Sci. 76 (1998) 3-11.
[60] G. Leofanti, M. Padovan, G. Tozzola, B. Venturelli, Catal. Today 41 (1998) 207-219.
37

[61] J.R. Anderson, K.C. Pratt, Introduction to characterization and testing of catalysts,Academic Press Inc., University of Melbourne, Australia, 1985.
[62] C. Wang-Hansen, C.J. Kamp, M. Skoglundh, B. Andersson, P.-A. Carlsson, J. Phys.Chem. C 115 (2011) 16098-16108.
[63] M. Haneda, E. Joubert, J.C. Menezo, D. Duprez, J. Barbier, N. Bion, M. Daturi, J.Saussey, J.C. Lavalley, H. Hamada, J. Mol. Catal. A: Chem. 175 (2001).
[64] J.A. Perdigon-Melon, A. Gervasini, A. Auroux, J. Catal. 234 (2005).
[65] C. Shi, M.J. Cheng, Z.P. Qu, X.H. Bao, Appl. Catal., B. 51 (2004) 171-181.
[66] S.J. Miao, Y. Wang, D. Ma, Q.J. Zhu, S.T. Zhou, L.L. Su, D.L. Tan, X.H. Bao, J.Phys. Chem. B 108 (2004) 17866-17871.
[67] V.A. Kondratenko, U. Bentrup, M. Richter, T.W. Hansen, E.V. Kondratenko, Appl.Catal., B. 84 (2008) 497-504.
[68] M. Mannikko, M. Skoglundh, H.H. Ingelsten, Appl. Catal., B. 119 (2012).
[69] A. Musi, P. Massiani, D. Brouri, J.-M. Trichard, P. Da Costa, Catal. Lett. 128 (2009)25-30.
[70] A.N. Pestryakov, A.A. Davydov, J. Electron Spectrosc. Relat. Phenom. 74 (1995)195-199.
[71] M. Richter, R. Fricke, R. Eckelt, Catal. Lett. 94 (2004) 115-118.
[72] K. Sato, T. Yoshinari, Y. Kintaichi, M. Haneda, H. Hamada, Appl. Catal., B. 44(2003) 67-78.
[73] X. She, M. Flytzani-Stephanopoulos, J. Catal. 237 (2006).
[74] S. Erkfeldt, M. Petersson, A. Palmqvist, Appl. Catal., B. 117 (2012) 369-383.
[75] S. Tamm, Catal. Lett. 143 (2013) 957-965.
[76] A. Lundstrom, H. Strom, In:Sprays: Types, Technology and Modeling Vella, M.C.,Nova Science Publishers (ISBN: 978-161324345-9), 2011.
[77] S. Tamm, H.H. Ingelsten, M. Skoglundh, A.E.C. Palmqvist, Appl. Catal., B. 91(2009).
[78] S.G. Masters, D. Chadwick, Appl. Catal., B. 23 (1999) 235-246.
[79] J. Lv, T. Kako, Z. Li, Z. Zou, J. Ye, J. Phys. Chem. C 114 (2010) 6157-6162.
[80] X. Yang, J. Xu, T. Wong, Q. Yang, C.-S. Lee, Phys. Chem. Chem. Phys. 15 (2013)12688-12693.
[81] G. Zhu, L. Guo, X. Shen, Z. Ji, K. Chen, H. Zhou, Sens. Actuators B 220 (2015)977-985.
38

[82] F. Zhang, X. Li, Q. Zhao, Q. Zhang, M. Tade, S. Liu, J. Colloid Interface Sci. 457(2015) 18-26.
[83] J.Z. Yin, S.B. Huang, Z.C. Jian, M.L. Pan, Y.Q. Zhang, Z.B. Fei, X.R. Xu, Appl.Phys. A 120 (2015) 1529-1535.
[84] Q. Liu, W. Zhang, R. Liu, G. Mao, Eur. J. Inorg. Chem. (2015) 845-851.
39

40