Selection of the appropriate data source for Agriculture ... · Selection of the appropriate data...
24
Selection of the appropriate data source for Agriculture Risk Modelling Mozambique Agro Risk - Barue District Presented By: Pushpendra Johari
Transcript of Selection of the appropriate data source for Agriculture ... · Selection of the appropriate data...
Selection of the appropriate data source
for Agriculture Risk Modelling
Mozambique Agro Risk - Barue District
Presented By: Pushpendra Johari

www.rmsi.comwww.rmsi.com
Agri. Risk Model Components
Hazard Module – Hazard related information
Vulnerability Module – Crop wise and region specific curves
Exposure Module – Crop production and acreage data
Insurance Module – Policy Information, Indices – by policy, by
Geographic areas, Perform accumulation control, Portfolio
analysis ,Cession limits, Liability limits
# 2

www.rmsi.comwww.rmsi.com
Hazard Module – Hazard related information
Primary parameters - Rainfall and Temperature
Available from local Met Agencies
Available from local Agriculture departments
Satellite based
– TRMM (Tropical Radar
– NOAA
Synthetic – Santa Clara University
? WHICH ONE TO USE
# 3

www.rmsi.comwww.rmsi.com
Case Study
Mozambique Agro Risk - Barue District
# 4
www.rmsi.com
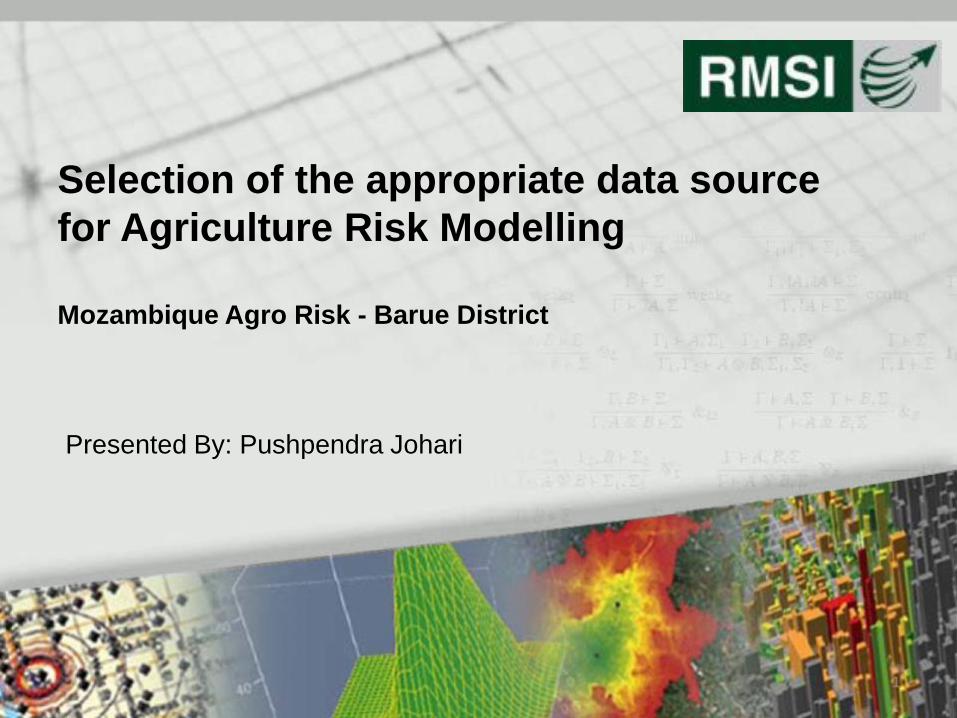
General Information about Barue
Area:
– 5,800 km^2 (equivalent to
160km * 40km)
– 0.73% of country area
– 60% of districts are smaller
Maize production:
Year 2009
Season 2008-09
Planted area Barue 18,825
Ha Country total 1,613,405
Percentage 1.2%
Production Barue 28,237
Tons Country total 1,842,993
Percentage 1.5%
Yield Barue 1.50
Ton/ha Country range 0.4 to 2.0
# 5

www.rmsi.comwww.rmsi.com
Rainfall Stations
No rainfall stations located in the
district
Two stations (Luenha II, and
Mazoi I) located north
Two stations (Sussundenga, and
Chimoio) located south.
Luenha II has about 17% missing
data and Mazoi I has about 51 %
missing. These two stations are
from DNA. Ignored.
Sussundenga and Chimoio (From
INAM/IAM) have continuous data
for nearly 40 years. Used in this
study.
# 6

www.rmsi.com
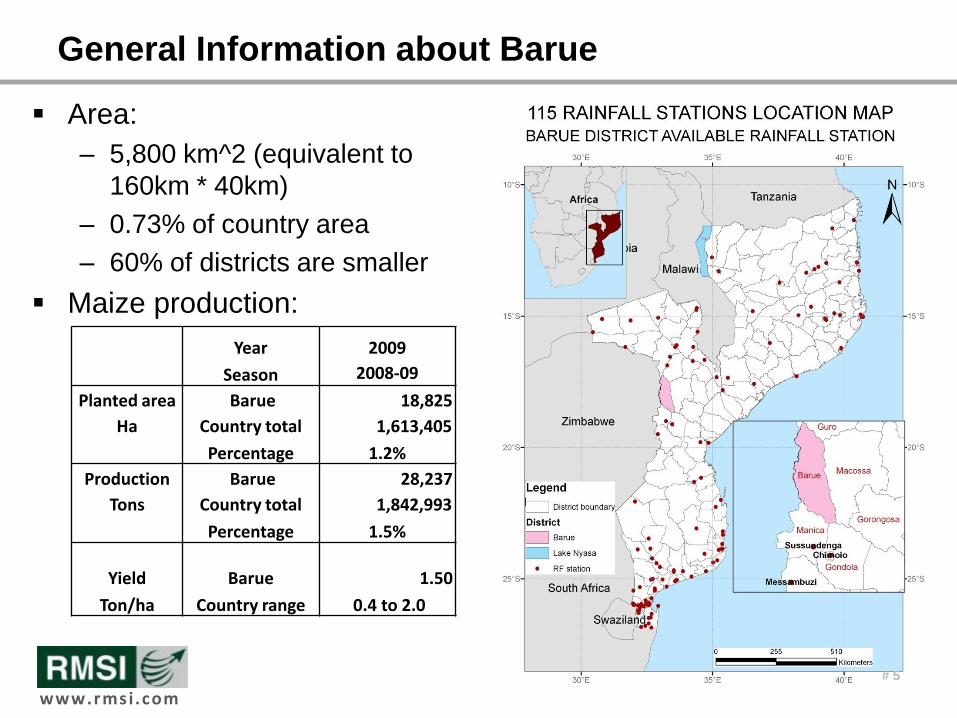
Stations Sussundenga and Chimoio
41 years of daily rainfall (1969-2009)
– Chimoio (1960-2009)
Distance from Barue centroid
– Sussundenga: 111.3 km
– Chimoio: 127.3 km
– Weighted by the inverse of distance^2
– They are essentially averaged.
Seasonal rainfall: sum of November to April (6 months)
# 7
www.rmsi.com
Seasonal Rainfall Comparison
0.0
500.0
1000.0
1500.0
2000.0
2500.0
1965 1970 1975 1980 1985 1990 1995 2000 2005 2010
Seasonal total rainfall (mm)
Chimoio
Sussandenga
Centroid of Barue
# 8

www.rmsi.comwww.rmsi.com
SPI- Index
The standard normal distribution has a mean of zero and a standard deviation of one. SPI is a representation of the number of standard deviations from the mean at which an event occurs. The unit of the SPI can thus be considered to be standard deviation or a Z score.
# 9

www.rmsi.comwww.rmsi.com
GeoWRSI
is a geo-spatial, stand-alone
application for estimation of WRSI
(Water Requirements Satisfaction
Index )
is implemented by the USGS for the
FEWSNET Activity.
runs a crop-specific water balance
model for a selected region in the
world, using raster data inputs
Includes satellite based Dekadal
rainfall from 1995 onwards.
produces a range of outputs which can
either be used qualitatively to assess
and monitor crop conditions during the
crop growing season, or can be
regressed with yields to produce yield
estimation models and yield estimates.
(http://hollywood.geog.ucsb.edu/wb/geowrsi.php)
# 10

www.rmsi.com
Year Classification: Normal, Dry & Wet
Deviation from Normal
– + 25 % from - Wet year,
– - 25% from Normal - Dry Year
– SPI greater than 0.5 - Wet year
– SPI less than - 0.5 - Dry Year
Summary rainfall (mm per season)
Mean 1032.6
75%Mean 774.5
125%Mean 1290.8
# 11

www.rmsi.com
Year Classification
Season
Barue
Seasonal RF
Barue
Seasonal
SPI
Classificaion
Deviation
Classification
SPI
1969/1970 911.1 -0.21 N N
1970/1971 795.3 -0.56 N D
1971/1972 1175.6 0.48 N N
1972/1973 510.5 -1.60 D D
1973/1974 1677.2 1.56 W W
1974/1975 1202.1 0.55 N W
1975/1976 1403.8 1.01 W W
1976/1977 1138.0 0.39 N N
1977/1978 1113.1 0.33 N N
1978/1979 801.6 -0.54 N D
1979/1980 923.3 -0.18 N N
1980/1981 1381.4 0.96 W W
1981/1982 1158.3 0.44 N N
1982/1983 709.4 -0.84 D D
1983/1984 787.7 -0.59 N D
1984/1985 1438.7 1.08 W W
1985/1986 1300.9 0.78 W W
1986/1987 766.3 -0.65 D D
1987/1988 1404.9 1.01 W W
1988/1989 1391.8 0.98 W W
Season
Barue
Seasonal
RF
Barue
Seasonal
SPI
Classificaio
n Deviation
Classification
SPI
1989/1990 1041.3 0.14 N N
1990/1991 562.8 -1.38 D D
1991/1992 389.7 -2.17 D D
1992/1993 950.0 -0.10 N N
1993/1994 852.3 -0.39 N N
1994/1995 921.9 -0.18 N N
1995/1996 502.2 -1.64 D D
1996/1997 1486.5 1.18 W W
1997/1998 382.2 -2.21 D D
1998/1999 1380.7 0.96 W W
1999/2000 1239.4 0.64 N W
2000/2001 1504.1 1.22 W W
2001/2002 1135.2 0.38 N N
2002/2003 685.1 -0.93 D D
2003/2004 1038.7 0.14 N N
2004/2005 516.1 -1.58 D D
2005/2006 1015.1 0.08 N N
2006/2007 681.3 -0.94 D D
2007/2008 1664.1 1.54 W W
2008/2009 1365.9 0.92 W W
# 12
www.rmsi.com
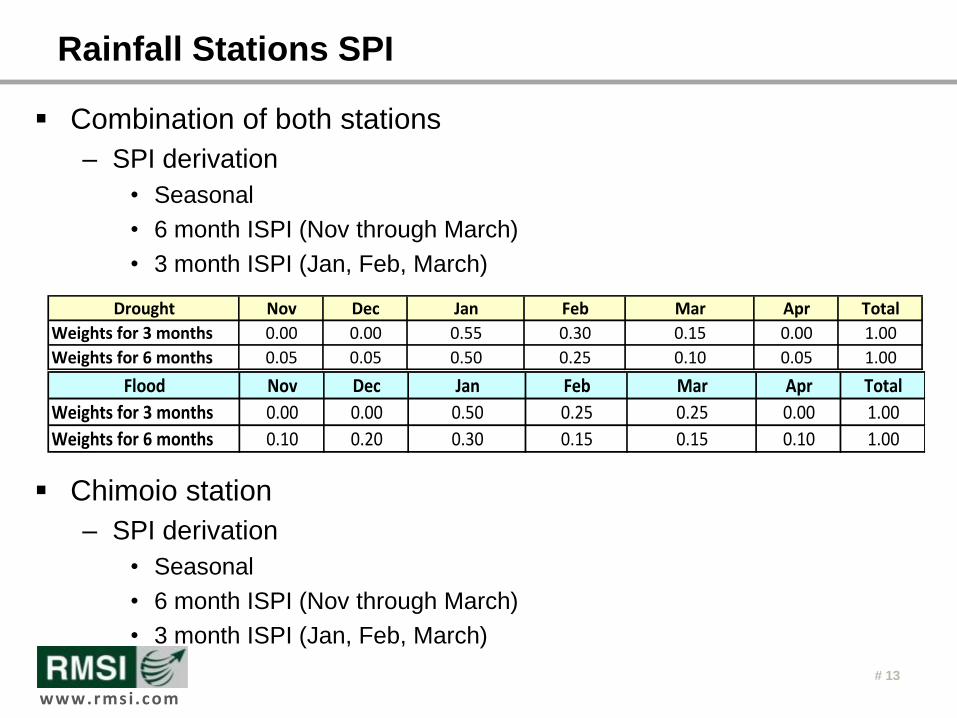
Rainfall Stations SPI
Combination of both stations
– SPI derivation
• Seasonal
• 6 month ISPI (Nov through March)
• 3 month ISPI (Jan, Feb, March)
Chimoio station
– SPI derivation
• Seasonal
• 6 month ISPI (Nov through March)
• 3 month ISPI (Jan, Feb, March)
Drought Nov Dec Jan Feb Mar Apr Total
Weights for 3 months 0.00 0.00 0.55 0.30 0.15 0.00 1.00
Weights for 6 months 0.05 0.05 0.50 0.25 0.10 0.05 1.00
Flood Nov Dec Jan Feb Mar Apr Total
Weights for 3 months 0.00 0.00 0.50 0.25 0.25 0.00 1.00
Weights for 6 months 0.10 0.20 0.30 0.15 0.15 0.10 1.00
# 13

www.rmsi.com
Water Requirement Satisfaction Index
Dekadal (10 days) rainfall at 10km grid (1995-2011) (WRSI)
– SPI derivation
• Seasonal
• 6 month ISPI (Nov through March)
• 3 month ISPI (Jan, Feb, March)
WRSI analysis
– Dekadal values
– 16th Dekad after planting WRSI values correlate best with
production
# 14

www.rmsi.com
Planted Area and Production
Nine years of Maize crop data
-
5,000
10,000
15,000
20,000
25,000
30,000
-
5,000
10,000
15,000
20,000
25,000
30,000
2000 2002 2004 2006 2008 2010
Pla
nte
d a
rea
(ha)
Pro
du
ctio
n (
ton
)Production
Planted Area
Season
Barue
Production(t)
Barue Planted Area
(ha)
2000/2001 13,618 14,487
2001/2002 13,969 13,969
2002/2003 17,421 14,517
2003/2004 21,326 15,233
2004/2005 9,212 12,877
2005/2006 20,452 15,732
2006/2007 20,689 15,915
2007/2008 24,134 16,090
2008/2009 28,237 18,825
# 15

www.rmsi.com
Maize Yield (Ton/ha)
0.60
0.70
0.80
0.90
1.00
1.10
1.20
1.30
1.40
1.50
1.60
2000 2002 2004 2006 2008 2010
Barue Maize Yield (Ton/HA)
Season
Barue Yield
(t/ha) Pot Yield
85% Pot
Yield
2000/2001 0.94 1.50 1.28
2001/2002 1.00 1.50 1.28
2002/2003 1.20 1.50 1.28
2003/2004 1.40 1.50 1.28
2004/2005 0.72 1.50 1.28
2005/2006 1.30 1.50 1.28
2006/2007 1.30 1.50 1.28
2007/2008 1.50 1.50 1.28
2008/2009 1.50 1.50 1.28
Barue Seasonal_SPI
1.22
0.38
-0.93
0.14
-1.58
0.08
-0.94
1.54
0.92
# 16

www.rmsi.com
Chimoio Potential Yield vs. 85% Potential
# 17

www.rmsi.com
Seasonal SPI vs. ISPI (6 months)
y = 0.305x - 0.048R² = 0.167
-60%
-50%
-40%
-30%
-20%
-10%
0%
10%
20%
30%
-3.00 -2.00 -1.00 0.00 1.00 2.00 3.00
MD
R (
85
%P
otY
ield
)
Barue ISPI (7)
Barue ISPI (7) Vs MDR (85%Potential Yield)
y = -0.194x2 - 0.055x + 0.030R² = 0.699
-60%
-50%
-40%
-30%
-20%
-10%
0%
10%
20%
-3.00 -2.00 -1.00 0.00 1.00 2.00 3.00
MD
R (
85
%P
otY
ield
)
Barue Seasonal SPI
Barue Seasonal SPI Vs MDR (85%Potential Yield)
y = -0.450x - 0.095R² = 0.408
-60%
-50%
-40%
-30%
-20%
-10%
0%
10%
20%
30%
-3.00 -2.00 -1.00 0.00 1.00 2.00 3.00
MD
R (
85
%P
otY
ield
)
Seasonal SPI
Chimoio ISPI Vs MDR (85% Potential Yield)
# 18

www.rmsi.com
SPI WRSI PPT – Seasonal & ISPI (6)
y = -0.272x2 - 0.120x + 0.127R² = 0.485
-60%
-50%
-40%
-30%
-20%
-10%
0%
10%
20%
30%
-3.00 -2.00 -1.00 0.00 1.00 2.00 3.00
MD
R (
85
%P
otY
ield
)
Seasonal SPI
Barue WRSI Seasonal SPI Vs MDR 85% Potential Yield)
y = 0.590x2 + 1.077x - 0.050R² = 0.444
y = 0.994x - 0.040R² = 0.441
-60%
-50%
-40%
-30%
-20%
-10%
0%
10%
20%
30%
-1.00 -0.50 0.00 0.50 1.00
MD
R (
85
%P
otY
ield
)
Seasonal SPI
Barue WRSI IISPI (ONJFM) Vs MDR (85% Potential Yield)
y = 0.447x - 0.096R² = 0.386
-60%
-50%
-40%
-30%
-20%
-10%
0%
-1.00 -0.50 0.00 0.50 1.00
MD
R
ISPI(JFM))
Drought - ISPI(JFM) Vs MDR (Potential Yield)
y = 0.853x - 0.484R² = 0.333
-60%
-50%
-40%
-30%
-20%
-10%
0%
-1.00 -0.50 0.00 0.50 1.00
MD
R
ISPI(NDJFMA))
Flood - ISPI(NDJFMA) Vs MDR (Potential Yield)
# 19

www.rmsi.com
WRSI Variation from 2nd to 19th Dekad
y = -0.028x + 2.522R² = 0.295
-60%
-50%
-40%
-30%
-20%
-10%
0%
10%
60 70 80 90 100
MD
R (
Po
t Y
ield
)
WRSI
Yield MDR Vs WRSI 2nd Dekad After Planting
y = -0.011x + 0.835R² = 0.358
-60%
-50%
-40%
-30%
-20%
-10%
0%
60 70 80 90 100
MD
R (
Po
t Y
ield
)
WRSI
Yield MDR Vs WRSI 8th Dekad After Planting
y = 0.003x - 0.571R² = 0.058
-60%
-50%
-40%
-30%
-20%
-10%
0%
60 70 80 90 100
MD
R (
Po
t Y
ield
)
WRSI
Yield MDR Vs WRSI 13th Dekad After Planting
y = 0.012x - 1.106R² = 0.511
-50%
-40%
-30%
-20%
-10%
0%
10%
20%
60 70 80 90 100
MD
R (P
ot Y
ield
)
WRSI
Yield (85%)MDR Vs WRSI 16th Dekad After Planting
# 20

www.rmsi.com
Reconstruction of Historical Events (Expected mode)
AAL Historical: 1,926 tons
AAL = 4,982 AAL = 1,803
-
2,000
4,000
6,000
8,000
10,000
12,000
- 5,000 10,000 15,000 20,000
HIS
TOR
ICA
L
2 stations SPI
SPI Seasonal 2 Stations
Series1
Series2
-
2,000
4,000
6,000
8,000
10,000
12,000
- 5,000 10,000 15,000
HIS
TORI
CAL
2 stations SPI
ISPI 6 month 2 Stations
Series1
Series2
AAL = 2,423 AAL = 2,545
-
2,000
4,000
6,000
8,000
10,000
12,000
0 5000 10000 15000
HIS
TOR
ICA
L
Chimoio SPI
SPI Seasonal Chimoio
Series1
Series2
-
2,000
4,000
6,000
8,000
10,000
12,000
0 5000 10000 15000
HIS
TORI
CAL
Chimoio SPI
ISPI 6 month Chimoio
Series1
Series2
# 21

www.rmsi.com
Reconstruction of Historical Events (Expected mode)
AAL Historical: 1,926
AAL = 2,364 AAL = 2,177
AAL = 3,284 AAL = 1,518
0.0
2,000.0
4,000.0
6,000.0
8,000.0
10,000.0
12,000.0
- 2,000 4,000 6,000 8,000 10,000 12,000
HIS
TORI
CAL
MODELED PPT
WRSI 2001-2009
0.0
2,000.0
4,000.0
6,000.0
8,000.0
10,000.0
12,000.0
- 2,000 4,000 6,000 8,000 10,000 12,000
HIS
TORI
CAL
MODELED PPT
WRSI Removing wet and normal years
-
2,000
4,000
6,000
8,000
10,000
12,000
- 2,000 4,000 6,000 8,000 10,000 12,000
HIS
TORI
CAL
MODELED PPT
ISPI Seasonal based on PPT (WRSI)
Series1
Series2
-
2,000
4,000
6,000
8,000
10,000
12,000
- 2,000 4,000 6,000 8,000 10,000 12,000
HIS
TORI
CAL
MODELED PPT
ISPI 6 month based on PPT (WRSI)
Series1
Series2
# 22

www.rmsi.com
Conclusions
A significant amount of uncertainty is associated with the
correlation weather parameter-MDR
– The seasonal parameters behave better than the weighted
parameters – counter intuitive
– Seasonal SPI based on WRSI PPT and Seasonal SPI based on
station Chimoio reconstruct best the last 9 years of production
The overall risk can be estimated with a reasonable of confidence
The loss in a specific year may be significantly miscalculated
Pursue WRSI and WRSI PPT
# 23

www.rmsi.com
Thank you !
24