Selected Acquisition Report (SAR) - GlobalSecurity.org · Selected Acquisition Report (SAR) ......
36
Selected Acquisition Report (SAR) RCS: DD-A&T(Q&A)823-333 LHA 6 America Class Amphibious Assault Ship (LHA 6) As of December 31, 2012 Defense Acquisition Management Information Retrieval (DAMIR) May 21, 2013 16:15:37 UNCLASSIFIED
Transcript of Selected Acquisition Report (SAR) - GlobalSecurity.org · Selected Acquisition Report (SAR) ......
Selected Acquisition Report (SAR)
RCS: DD-A&T(Q&A)823-333
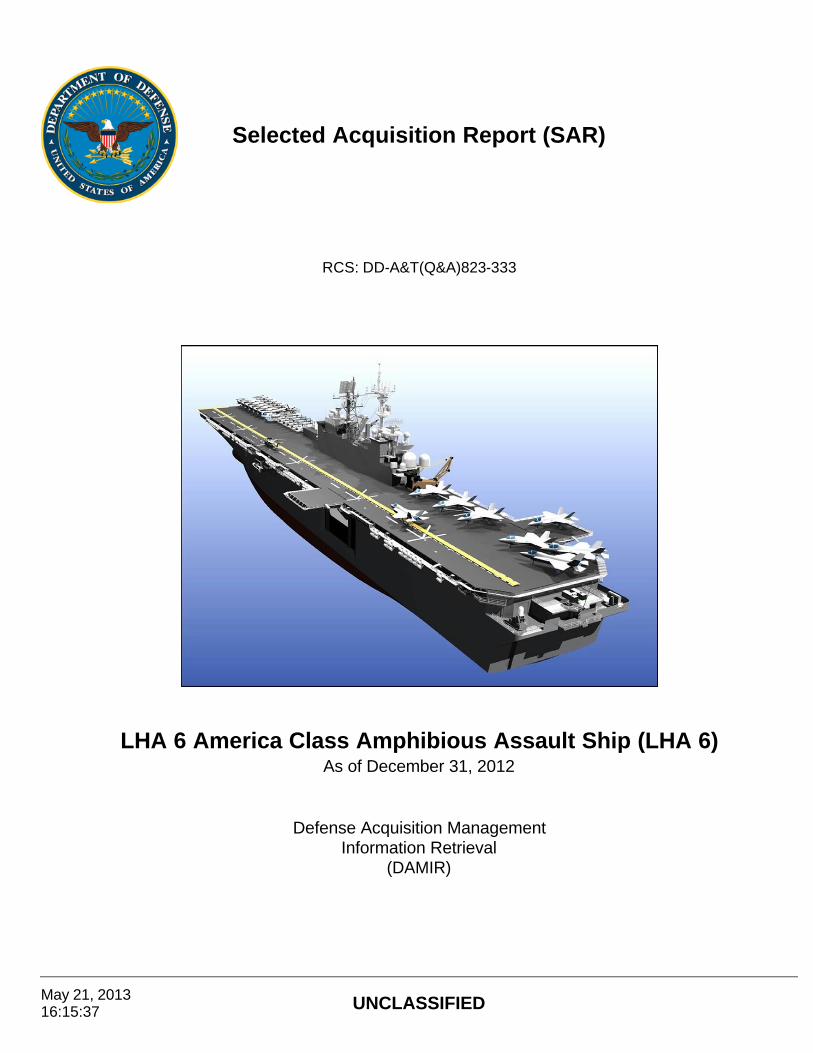
LHA 6 America Class Amphibious Assault Ship (LHA 6)As of December 31, 2012
Defense Acquisition Management Information Retrieval
(DAMIR)
May 21, 2013 16:15:37 UNCLASSIFIED
LHA 6 December 31, 2012 SAR
May 21, 2013 16:15:37 UNCLASSIFIED 2
Table of Contents
Program Information 3Responsible Office 3References 3Mission and Description 4Executive Summary 5Threshold Breaches 6Schedule 7Performance 9Track To Budget 12Cost and Funding 13Low Rate Initial Production 23Foreign Military Sales 24Nuclear Cost 24Unit Cost 25Cost Variance 28Contracts 31Deliveries and Expenditures 33Operating and Support Cost 34
Program Information
Responsible Office
References
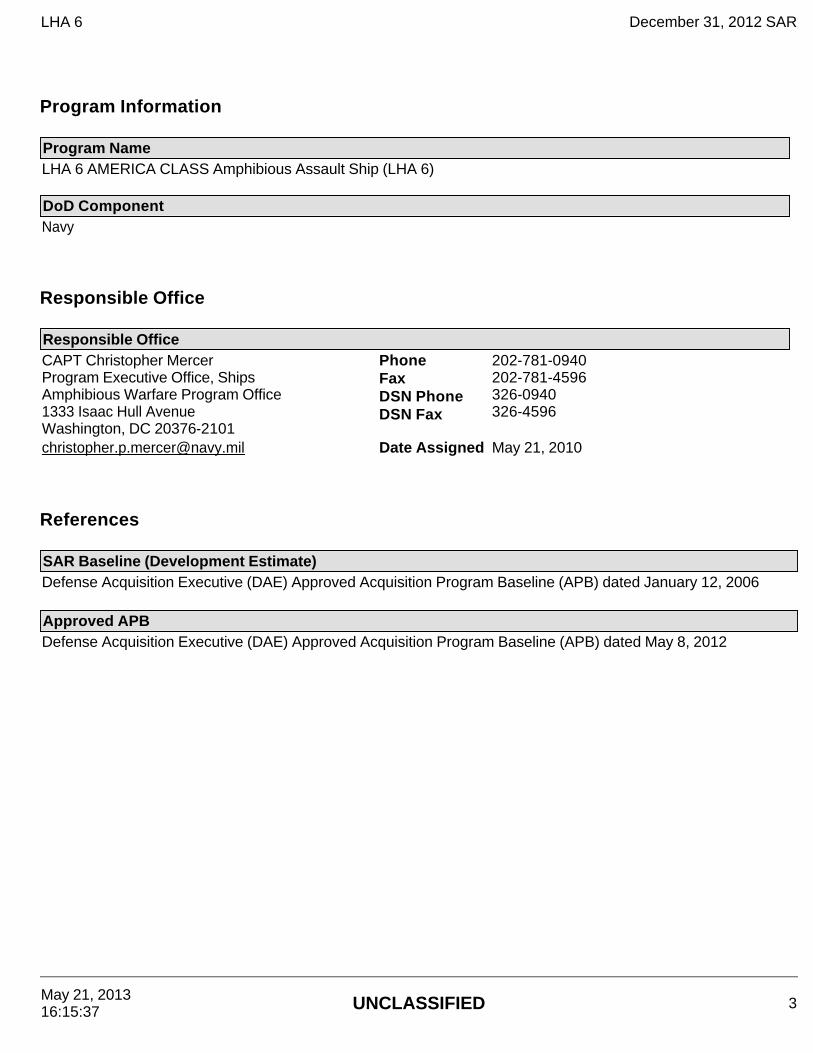
Program Name LHA 6 AMERICA CLASS Amphibious Assault Ship (LHA 6)
DoD Component Navy
Responsible OfficeCAPT Christopher Mercer Program Executive Office, Ships Amphibious Warfare Program Office 1333 Isaac Hull Avenue Washington, DC 20376-2101
Phone Fax DSN Phone DSN Fax
202-781-0940 202-781-4596 326-0940 326-4596
[email protected] Date Assigned May 21, 2010
SAR Baseline (Development Estimate)Defense Acquisition Executive (DAE) Approved Acquisition Program Baseline (APB) dated January 12, 2006 Approved APBDefense Acquisition Executive (DAE) Approved Acquisition Program Baseline (APB) dated May 8, 2012
LHA 6 December 31, 2012 SAR
May 21, 2013 16:15:37 UNCLASSIFIED 3

Mission and Description The LHA Replacement (LHA(R)) Program is planned to replace existing LHA 1 Class Amphibious Assault Ships, which reach the end of their extended service lives between 2011 and 2015.
The LHA(R) will be the key platform in the Expeditionary Strike Group (ESG)/Amphibious Ready Group (ARG) of the future and will provide the Joint Force Commander options to project expeditionary power. The LHA 6 America Class, the first ship of the LHA(R) Program, will embark and support all of the Short Take-off Vertical Landing (STOVL) and Vertical Take-off Landing (VTOL) Marine expeditionary aviation assets in the ESG/ARG, including the MV-22 and the F-35B, the STOVL model of the Joint Strike Fighter (JSF). The ship will embark over 1600 Marines and transport them and their equipment ashore by rotary-wing aircraft when the situation requires.
The LHA 6 America Class is an LHD 8 gas turbine variant with enhanced aviation capability.
LHA 6 December 31, 2012 SAR
May 21, 2013 16:15:37 UNCLASSIFIED 4
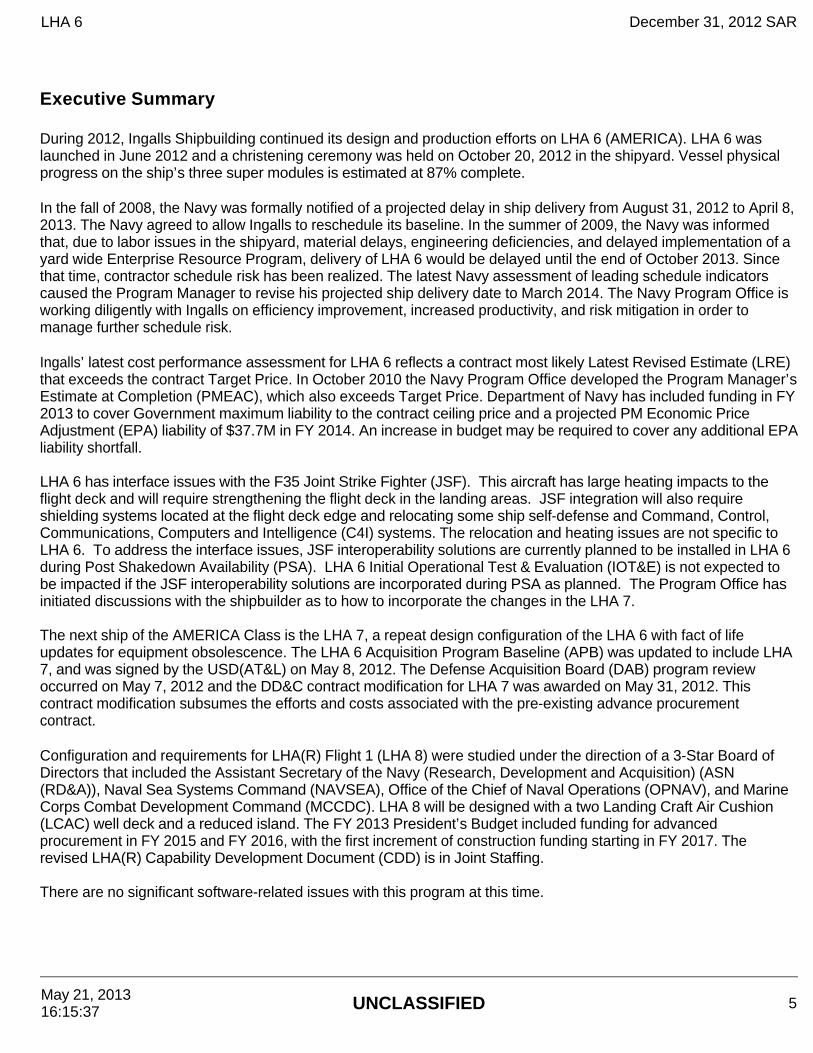
Executive Summary During 2012, Ingalls Shipbuilding continued its design and production efforts on LHA 6 (AMERICA). LHA 6 was launched in June 2012 and a christening ceremony was held on October 20, 2012 in the shipyard. Vessel physical progress on the ship’s three super modules is estimated at 87% complete.
In the fall of 2008, the Navy was formally notified of a projected delay in ship delivery from August 31, 2012 to April 8, 2013. The Navy agreed to allow Ingalls to reschedule its baseline. In the summer of 2009, the Navy was informed that, due to labor issues in the shipyard, material delays, engineering deficiencies, and delayed implementation of a yard wide Enterprise Resource Program, delivery of LHA 6 would be delayed until the end of October 2013. Since that time, contractor schedule risk has been realized. The latest Navy assessment of leading schedule indicators caused the Program Manager to revise his projected ship delivery date to March 2014. The Navy Program Office is working diligently with Ingalls on efficiency improvement, increased productivity, and risk mitigation in order to manage further schedule risk.
Ingalls’ latest cost performance assessment for LHA 6 reflects a contract most likely Latest Revised Estimate (LRE) that exceeds the contract Target Price. In October 2010 the Navy Program Office developed the Program Manager’s Estimate at Completion (PMEAC), which also exceeds Target Price. Department of Navy has included funding in FY 2013 to cover Government maximum liability to the contract ceiling price and a projected PM Economic Price Adjustment (EPA) liability of $37.7M in FY 2014. An increase in budget may be required to cover any additional EPA liability shortfall. LHA 6 has interface issues with the F35 Joint Strike Fighter (JSF). This aircraft has large heating impacts to the flight deck and will require strengthening the flight deck in the landing areas. JSF integration will also require shielding systems located at the flight deck edge and relocating some ship self-defense and Command, Control, Communications, Computers and Intelligence (C4I) systems. The relocation and heating issues are not specific to LHA 6. To address the interface issues, JSF interoperability solutions are currently planned to be installed in LHA 6 during Post Shakedown Availability (PSA). LHA 6 Initial Operational Test & Evaluation (IOT&E) is not expected to be impacted if the JSF interoperability solutions are incorporated during PSA as planned. The Program Office has initiated discussions with the shipbuilder as to how to incorporate the changes in the LHA 7. The next ship of the AMERICA Class is the LHA 7, a repeat design configuration of the LHA 6 with fact of life updates for equipment obsolescence. The LHA 6 Acquisition Program Baseline (APB) was updated to include LHA 7, and was signed by the USD(AT&L) on May 8, 2012. The Defense Acquisition Board (DAB) program review occurred on May 7, 2012 and the DD&C contract modification for LHA 7 was awarded on May 31, 2012. This contract modification subsumes the efforts and costs associated with the pre-existing advance procurement contract.
Configuration and requirements for LHA(R) Flight 1 (LHA 8) were studied under the direction of a 3-Star Board of Directors that included the Assistant Secretary of the Navy (Research, Development and Acquisition) (ASN (RD&A)), Naval Sea Systems Command (NAVSEA), Office of the Chief of Naval Operations (OPNAV), and Marine Corps Combat Development Command (MCCDC). LHA 8 will be designed with a two Landing Craft Air Cushion (LCAC) well deck and a reduced island. The FY 2013 President’s Budget included funding for advanced procurement in FY 2015 and FY 2016, with the first increment of construction funding starting in FY 2017. The revised LHA(R) Capability Development Document (CDD) is in Joint Staffing. There are no significant software-related issues with this program at this time.
LHA 6 December 31, 2012 SAR
May 21, 2013 16:15:37 UNCLASSIFIED 5

Threshold Breaches
APB Breaches Schedule Performance Cost RDT&E
Procurement MILCON Acq O&M
O&S CostUnit Cost PAUC
APUC Nunn-McCurdy Breaches
Current UCR Baseline PAUC NoneAPUC None
Original UCR Baseline PAUC NoneAPUC None
Explanation of Breach Cost breaches previously reported in the December 2009, December 2010 and December 2011 SAR.
LHA 6 December 31, 2012 SAR
May 21, 2013 16:15:37 UNCLASSIFIED 6

Schedule
LHA 6 December 31, 2012 SAR
May 21, 2013 16:15:37 UNCLASSIFIED 7
Milestones SAR Baseline Dev Est
Current APB Development
Objective/Threshold
Current Estimate
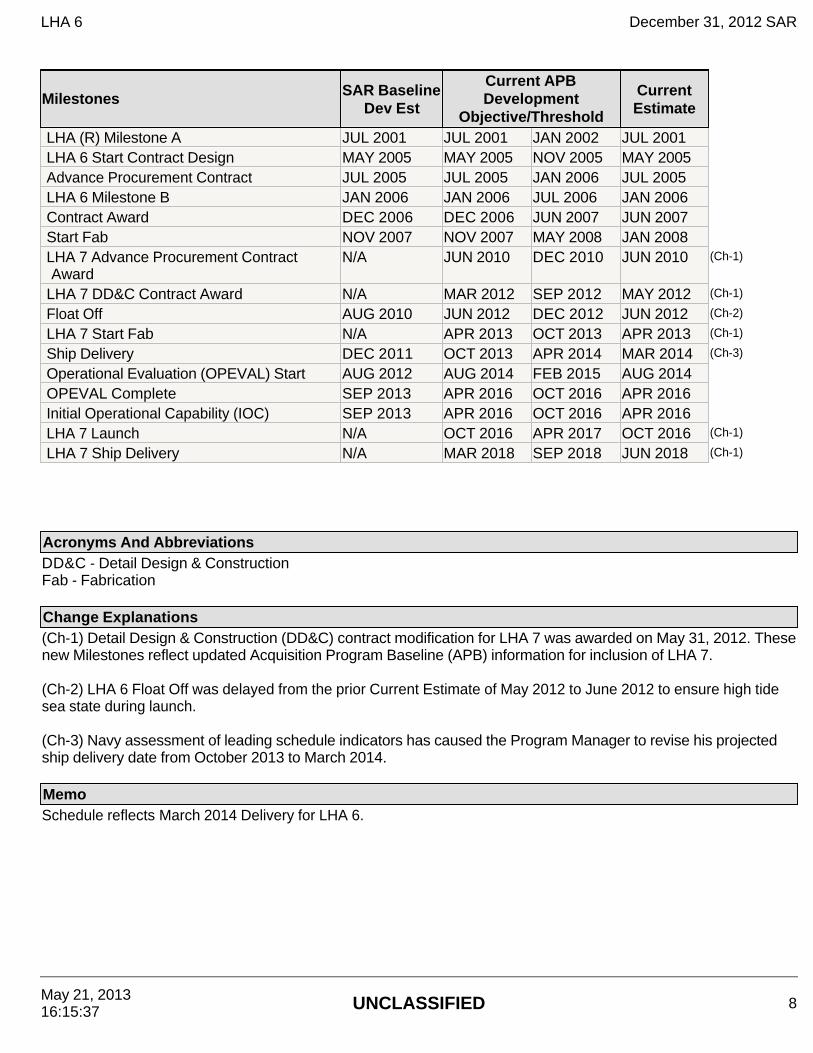
LHA (R) Milestone A JUL 2001 JUL 2001 JAN 2002 JUL 2001LHA 6 Start Contract Design MAY 2005 MAY 2005 NOV 2005 MAY 2005Advance Procurement Contract JUL 2005 JUL 2005 JAN 2006 JUL 2005LHA 6 Milestone B JAN 2006 JAN 2006 JUL 2006 JAN 2006Contract Award DEC 2006 DEC 2006 JUN 2007 JUN 2007Start Fab NOV 2007 NOV 2007 MAY 2008 JAN 2008LHA 7 Advance Procurement Contract Award
N/A JUN 2010 DEC 2010 JUN 2010 (Ch-1)
LHA 7 DD&C Contract Award N/A MAR 2012 SEP 2012 MAY 2012 (Ch-1)
Float Off AUG 2010 JUN 2012 DEC 2012 JUN 2012 (Ch-2)
LHA 7 Start Fab N/A APR 2013 OCT 2013 APR 2013 (Ch-1)
Ship Delivery DEC 2011 OCT 2013 APR 2014 MAR 2014 (Ch-3)
Operational Evaluation (OPEVAL) Start AUG 2012 AUG 2014 FEB 2015 AUG 2014OPEVAL Complete SEP 2013 APR 2016 OCT 2016 APR 2016Initial Operational Capability (IOC) SEP 2013 APR 2016 OCT 2016 APR 2016LHA 7 Launch N/A OCT 2016 APR 2017 OCT 2016 (Ch-1)
LHA 7 Ship Delivery N/A MAR 2018 SEP 2018 JUN 2018 (Ch-1)
Acronyms And Abbreviations DD&C - Detail Design & Construction Fab - Fabrication
Change Explanations (Ch-1) Detail Design & Construction (DD&C) contract modification for LHA 7 was awarded on May 31, 2012. These new Milestones reflect updated Acquisition Program Baseline (APB) information for inclusion of LHA 7. (Ch-2) LHA 6 Float Off was delayed from the prior Current Estimate of May 2012 to June 2012 to ensure high tide sea state during launch. (Ch-3) Navy assessment of leading schedule indicators has caused the Program Manager to revise his projected ship delivery date from October 2013 to March 2014. Memo Schedule reflects March 2014 Delivery for LHA 6.
LHA 6 December 31, 2012 SAR
May 21, 2013 16:15:37 UNCLASSIFIED 8

Performance
Characteristics SAR Baseline Dev Est
Current APB Development
Objective/Threshold
Demonstrated Performance
Current Estimate
Net Ready 100% of interfaces; services; policy-enforcement controls; and data correctness, availability and processing requirementsin the joint integrated architecture
100% of interfaces; services; policy-enforcement controls; and data correctness, availability and processing requirementsin the joint integrated architecture
100% of interfaces; services; policy-enforcement controls; and data correctness, availability and processing requirementsdesignated as enterprise level or critical in the joint integrated architecture
TBD 100% of interfaces; services; policy-enforcement controls; and data correctness, availability and processing requirementsdesignated as enterprise level or critical in the joint integrated architecture
Vertical Take Off and Landing land/launch spots
9 CH-53E/MV-22
9 CH-53E/MV-22
9 CH-53E/MV-22
TBD 9 CH-53E/MV-22
F-35B capacity 23 Aircraft 23 Aircraft 20 Aircraft TBD 23 AircraftAviation operations 6 Spots 12
hrs/day(Sustained) 6 Spots 24 hrs/day for six consecutive days (Surge)
6 Spots 12 hrs/day(Sustained) 6 Spots 24 hrs/day for six consecutive days (Surge)
6 Spots 12 hrs/day(Sustained) 6 Spots 24 hrs/day for six consecutive days (Surge)
TBD 6 Spots 12 hrs/day(Sustained) 6 Spots 24 hrs/day for six consecutive days (Surge)
Vehicle space 12,000 sq. ft. 12,000 sq. ft. 10,000 sq. ft. TBD 11,760 sq. ft.Total manpower (includes ship's force and all embarked elements such as troops, staffs, detachments, etc.)
2,891 Persons
2,891 Persons
2,891 Persons
TBD 2,891 Persons
Cargo space 160,000 cu. ft.
160,000 cu. ft.
130,000 cu. ft.
TBD 160,000 cu. ft.
Troop accomodations 1,686 Persons
1,686 Persons
1,626 Persons
TBD 1,686 Persons
LHA 6 December 31, 2012 SAR
May 21, 2013 16:15:37 UNCLASSIFIED 9

Survivability: Navy Survivability Policy for Surface Ships
Equals threshold, implement recommendat-ions of the NAVSEA USS COLE Survivability Review Group Phase II Analysis Report of Amphibious Ships, April 2003
Equals threshold, implement recommendat-ions of the NAVSEA COLE Survivability Review Group Phase II Analysis Report of Amphibious Ships, April 2003
Level II per OPNAV-INST 9070.1 of September 23, 1988 (LHA(R) cargo magazine protection as stated in para. 6.b.17 of the CDD
TBD Equals threshold, implement recommendations of the NAVSEA COLE Survivability Review Group Phase II Analysis Report of Amphibious Ships, April 2003
Force Protection: Collective Protection System (CPS)
Expanded CBR protection that provides a toxic-free environment (where it is not necessary to wear protective clothing or masks) for 40% of crew in berthing, messing, sanitary, and battle dressing facilities as well as key operational spaces that can be affordably integrated into ship design
Expanded CBR protection that provides a toxic-free environment (where it is not necessary to wear protective clothing or masks) for 40% of crew in berthing, messing, sanitary, and battle dressing facilities as well as key operational spaces that can be affordably integrated into ship design
CBR protection that provides a toxic-free environment (where it is not necessary to wear protective clothing or masks) for 40% of crew in berthing, messing, sanitary, and battle dressing facilities
TBD CBR protection that provides a toxic-free environment (where it is not necessary to wear protective clothing or masks) for 40% of crew in berthing, messing, sanitary, and battle dressing facilities
Force Protection: Decontamination Stations
Four decontaminat-ion stations (two CPS, one casualty, and one conventional)
Four decontaminat-ion stations (two CPS, one casualty, and one conventional)
Four decontaminat-ion stations (two CPS, one casualty, and one conventional)
TBD Four decontamin-ation stations (two CPS, one casualty, and one
LHA 6 December 31, 2012 SAR
May 21, 2013 16:15:37 UNCLASSIFIED 10

Requirements Source: Capability Development Document (CDD) dated December 17, 2009
Classified Performance information is provided in the classified annex to this submission.
providing a capability of decontamination an avg of ten people per hr per station
providing a capability of decontamination an avg of ten people per hr per station
providing a capability of decontamination an avg of ten people per hr per station
conventional)providing a capability of decontamin-ation an avg of ten people per hr per station
Acronyms And Abbreviations avg - average CBR - Chemical, Biological, and Radiological CDD - Capability Development Document cu. - cubic etc. - Etcetera ft. - feet hrs - hours INST. - Instruction NAVSEA - Naval Sea Systems Command OPNAV - Office of the Chief of Naval Operations sq. - Square TBD - To be determined
Change Explanations None
LHA 6 December 31, 2012 SAR
May 21, 2013 16:15:37 UNCLASSIFIED 11
Track To Budget
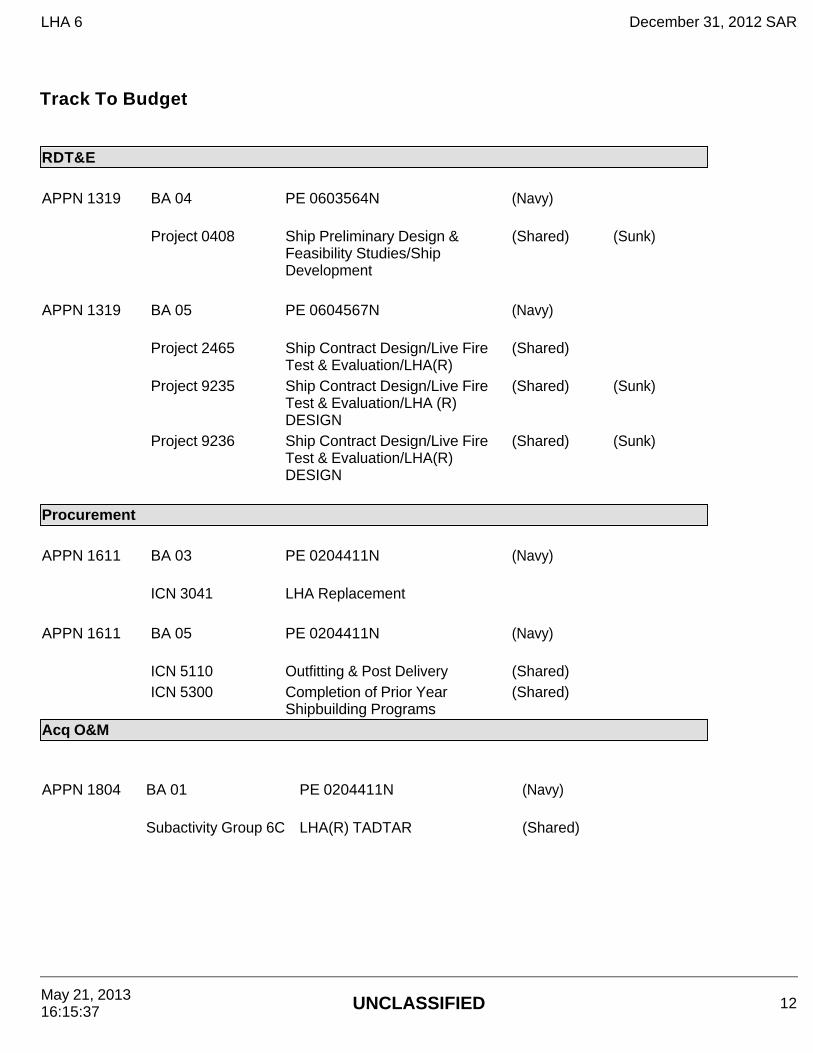
RDT&E APPN 1319 BA 04 PE 0603564N (Navy)
Project 0408 Ship Preliminary Design &
Feasibility Studies/Ship Development
(Shared) (Sunk)
APPN 1319 BA 05 PE 0604567N (Navy)
Project 2465 Ship Contract Design/Live Fire Test & Evaluation/LHA(R)
(Shared)
Project 9235 Ship Contract Design/Live Fire
Test & Evaluation/LHA (R) DESIGN
(Shared) (Sunk)
Project 9236 Ship Contract Design/Live Fire
Test & Evaluation/LHA(R) DESIGN
(Shared) (Sunk)
Procurement APPN 1611 BA 03 PE 0204411N (Navy) ICN 3041 LHA Replacement APPN 1611 BA 05 PE 0204411N (Navy) ICN 5110 Outfitting & Post Delivery (Shared)
ICN 5300 Completion of Prior Year Shipbuilding Programs
(Shared)
Acq O&M APPN 1804 BA 01 PE 0204411N (Navy) Subactivity Group 6C LHA(R) TADTAR (Shared)
LHA 6 December 31, 2012 SAR
May 21, 2013 16:15:37 UNCLASSIFIED 12
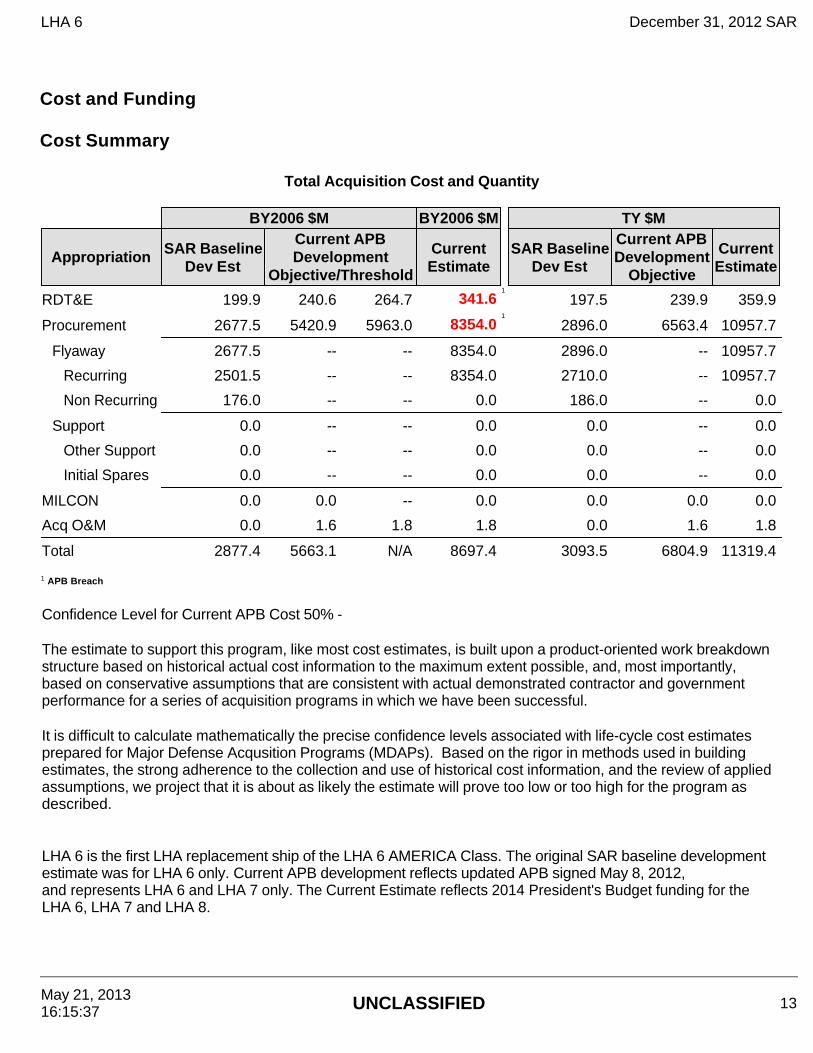
Cost and Funding Cost Summary
Total Acquisition Cost and Quantity
BY2006 $M BY2006 $M TY $M
Appropriation SAR Baseline Dev Est
Current APB Development
Objective/Threshold
Current Estimate
SAR Baseline Dev Est
Current APB Development
Objective
Current Estimate
RDT&E 199.9 240.6 264.7 341.61
197.5 239.9 359.9
Procurement 2677.5 5420.9 5963.0 8354.01
2896.0 6563.4 10957.7
Flyaway 2677.5 -- -- 8354.0 2896.0 -- 10957.7
Recurring 2501.5 -- -- 8354.0 2710.0 -- 10957.7
Non Recurring 176.0 -- -- 0.0 186.0 -- 0.0
Support 0.0 -- -- 0.0 0.0 -- 0.0
Other Support 0.0 -- -- 0.0 0.0 -- 0.0
Initial Spares 0.0 -- -- 0.0 0.0 -- 0.0
MILCON 0.0 0.0 -- 0.0 0.0 0.0 0.0
Acq O&M 0.0 1.6 1.8 1.8 0.0 1.6 1.8
Total 2877.4 5663.1 N/A 8697.4 3093.5 6804.9 11319.4 1 APB Breach
Confidence Level for Current APB Cost 50% -
The estimate to support this program, like most cost estimates, is built upon a product-oriented work breakdown structure based on historical actual cost information to the maximum extent possible, and, most importantly, based on conservative assumptions that are consistent with actual demonstrated contractor and government performance for a series of acquisition programs in which we have been successful.
It is difficult to calculate mathematically the precise confidence levels associated with life-cycle cost estimates prepared for Major Defense Acqusition Programs (MDAPs). Based on the rigor in methods used in building estimates, the strong adherence to the collection and use of historical cost information, and the review of applied assumptions, we project that it is about as likely the estimate will prove too low or too high for the program as described.
LHA 6 is the first LHA replacement ship of the LHA 6 AMERICA Class. The original SAR baseline development estimate was for LHA 6 only. Current APB development reflects updated APB signed May 8, 2012, and represents LHA 6 and LHA 7 only. The Current Estimate reflects 2014 President's Budget funding for the LHA 6, LHA 7 and LHA 8.
LHA 6 December 31, 2012 SAR
May 21, 2013 16:15:37 UNCLASSIFIED 13
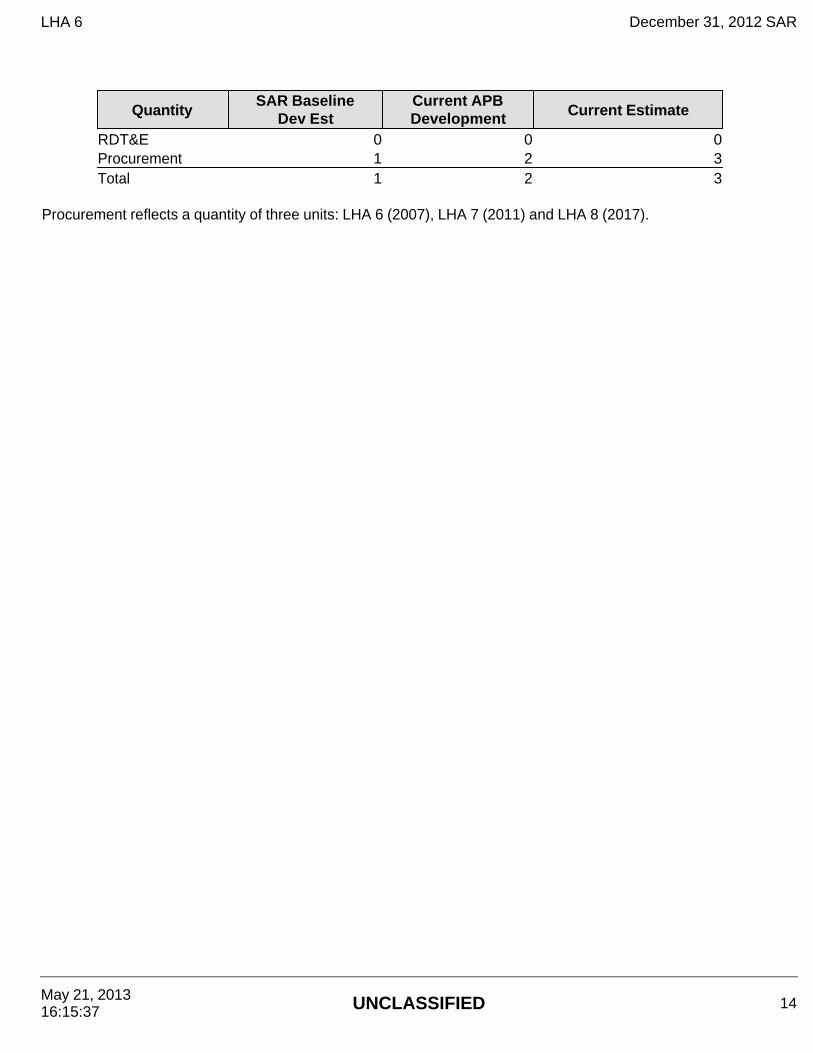
QuantitySAR Baseline
Dev EstCurrent APB Development Current Estimate
RDT&E 0 0 0Procurement 1 2 3Total 1 2 3
Procurement reflects a quantity of three units: LHA 6 (2007), LHA 7 (2011) and LHA 8 (2017).
LHA 6 December 31, 2012 SAR
May 21, 2013 16:15:37 UNCLASSIFIED 14
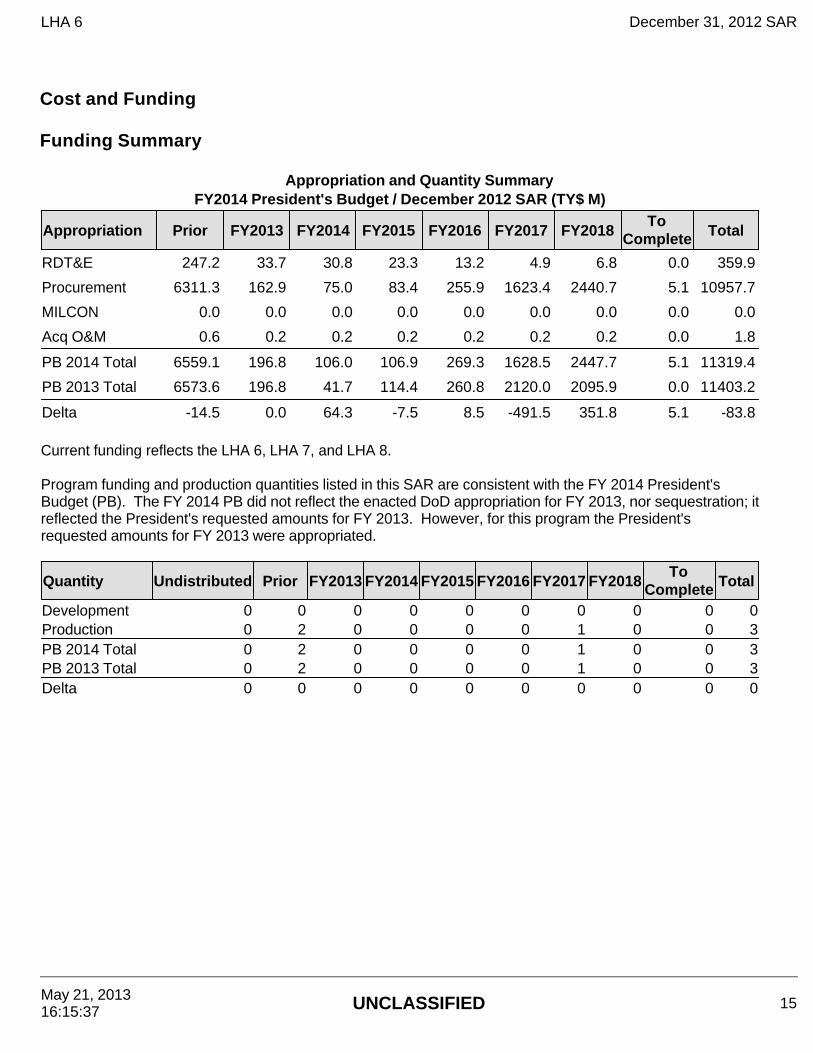
Cost and Funding Funding Summary
Appropriation and Quantity Summary FY2014 President's Budget / December 2012 SAR (TY$ M)
Current funding reflects the LHA 6, LHA 7, and LHA 8. Program funding and production quantities listed in this SAR are consistent with the FY 2014 President's Budget (PB). The FY 2014 PB did not reflect the enacted DoD appropriation for FY 2013, nor sequestration; it reflected the President's requested amounts for FY 2013. However, for this program the President's requested amounts for FY 2013 were appropriated.
Appropriation Prior FY2013 FY2014 FY2015 FY2016 FY2017 FY2018To
Complete Total
RDT&E 247.2 33.7 30.8 23.3 13.2 4.9 6.8 0.0 359.9
Procurement 6311.3 162.9 75.0 83.4 255.9 1623.4 2440.7 5.1 10957.7
MILCON 0.0 0.0 0.0 0.0 0.0 0.0 0.0 0.0 0.0
Acq O&M 0.6 0.2 0.2 0.2 0.2 0.2 0.2 0.0 1.8
PB 2014 Total 6559.1 196.8 106.0 106.9 269.3 1628.5 2447.7 5.1 11319.4
PB 2013 Total 6573.6 196.8 41.7 114.4 260.8 2120.0 2095.9 0.0 11403.2
Delta -14.5 0.0 64.3 -7.5 8.5 -491.5 351.8 5.1 -83.8
Quantity Undistributed Prior FY2013 FY2014 FY2015 FY2016 FY2017 FY2018To
Complete Total
Development 0 0 0 0 0 0 0 0 0 0Production 0 2 0 0 0 0 1 0 0 3PB 2014 Total 0 2 0 0 0 0 1 0 0 3PB 2013 Total 0 2 0 0 0 0 1 0 0 3Delta 0 0 0 0 0 0 0 0 0 0
LHA 6 December 31, 2012 SAR
May 21, 2013 16:15:37 UNCLASSIFIED 15

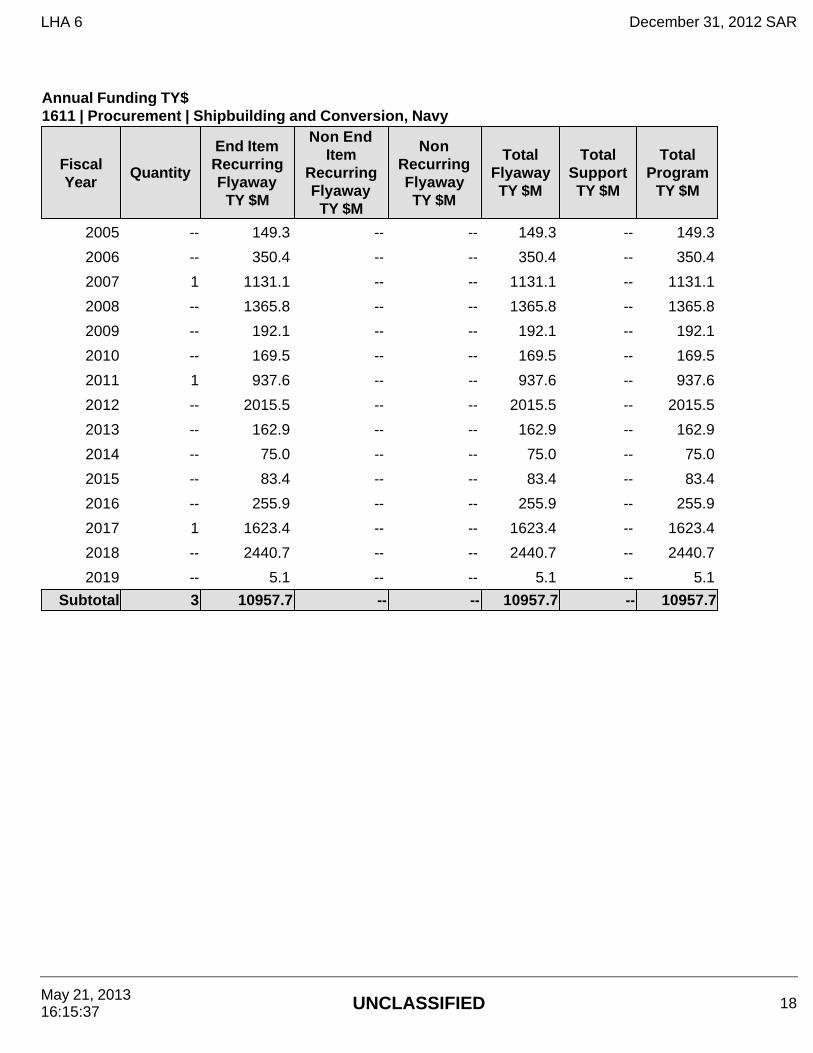
Cost and Funding Annual Funding By Appropriation
Annual Funding TY$ 1319 | RDT&E | Research, Development, Test, and Evaluation, Navy
Fiscal Year
Quantity
End Item Recurring Flyaway
TY $M
Non End Item
Recurring Flyaway
TY $M
Non Recurring Flyaway TY $M
Total Flyaway TY $M
Total Support TY $M
Total Program
TY $M
2001 -- -- -- -- -- -- 15.2
2002 -- -- -- -- -- -- 4.9
2003 -- -- -- -- -- -- 38.1
2004 -- -- -- -- -- -- 52.9
2005 -- -- -- -- -- -- 43.0
2006 -- -- -- -- -- -- 21.6
2007 -- -- -- -- -- -- 12.9
2008 -- -- -- -- -- -- 10.9
2009 -- -- -- -- -- -- 7.6
2010 -- -- -- -- -- -- 8.7
2011 -- -- -- -- -- -- 10.0
2012 -- -- -- -- -- -- 21.4
2013 -- -- -- -- -- -- 33.7
2014 -- -- -- -- -- -- 30.8
2015 -- -- -- -- -- -- 23.3
2016 -- -- -- -- -- -- 13.2
2017 -- -- -- -- -- -- 4.9
2018 -- -- -- -- -- -- 6.8
Subtotal -- -- -- -- -- -- 359.9
LHA 6 December 31, 2012 SAR
May 21, 2013 16:15:37 UNCLASSIFIED 16

Annual Funding BY$ 1319 | RDT&E | Research, Development, Test, and Evaluation, Navy
Fiscal Year
Quantity
End Item Recurring Flyaway
BY 2006 $M
Non End Item
Recurring Flyaway
BY 2006 $M
Non Recurring Flyaway
BY 2006 $M
Total Flyaway
BY 2006 $M
Total Support
BY 2006 $M
Total Program
BY 2006 $M
2001 -- -- -- -- -- -- 16.6
2002 -- -- -- -- -- -- 5.3
2003 -- -- -- -- -- -- 40.7
2004 -- -- -- -- -- -- 55.0
2005 -- -- -- -- -- -- 43.5
2006 -- -- -- -- -- -- 21.2
2007 -- -- -- -- -- -- 12.4
2008 -- -- -- -- -- -- 10.3
2009 -- -- -- -- -- -- 7.1
2010 -- -- -- -- -- -- 8.0
2011 -- -- -- -- -- -- 8.9
2012 -- -- -- -- -- -- 18.7
2013 -- -- -- -- -- -- 28.9
2014 -- -- -- -- -- -- 25.9
2015 -- -- -- -- -- -- 19.2
2016 -- -- -- -- -- -- 10.7
2017 -- -- -- -- -- -- 3.9
2018 -- -- -- -- -- -- 5.3
Subtotal -- -- -- -- -- -- 341.6
LHA 6 December 31, 2012 SAR
May 21, 2013 16:15:37 UNCLASSIFIED 17
Annual Funding TY$ 1611 | Procurement | Shipbuilding and Conversion, Navy
Fiscal Year
Quantity
End Item Recurring Flyaway
TY $M
Non End Item
Recurring Flyaway
TY $M
Non Recurring Flyaway TY $M
Total Flyaway TY $M
Total Support TY $M
Total Program
TY $M
2005 -- 149.3 -- -- 149.3 -- 149.3
2006 -- 350.4 -- -- 350.4 -- 350.4
2007 1 1131.1 -- -- 1131.1 -- 1131.1
2008 -- 1365.8 -- -- 1365.8 -- 1365.8
2009 -- 192.1 -- -- 192.1 -- 192.1
2010 -- 169.5 -- -- 169.5 -- 169.5
2011 1 937.6 -- -- 937.6 -- 937.6
2012 -- 2015.5 -- -- 2015.5 -- 2015.5
2013 -- 162.9 -- -- 162.9 -- 162.9
2014 -- 75.0 -- -- 75.0 -- 75.0
2015 -- 83.4 -- -- 83.4 -- 83.4
2016 -- 255.9 -- -- 255.9 -- 255.9
2017 1 1623.4 -- -- 1623.4 -- 1623.4
2018 -- 2440.7 -- -- 2440.7 -- 2440.7
2019 -- 5.1 -- -- 5.1 -- 5.1
Subtotal 3 10957.7 -- -- 10957.7 -- 10957.7
LHA 6 December 31, 2012 SAR
May 21, 2013 16:15:37 UNCLASSIFIED 18

Annual Funding BY$ 1611 | Procurement | Shipbuilding and Conversion, Navy
Fiscal Year
Quantity
End Item Recurring Flyaway
BY 2006 $M
Non End Item
Recurring Flyaway
BY 2006 $M
Non Recurring Flyaway
BY 2006 $M
Total Flyaway
BY 2006 $M
Total Support
BY 2006 $M
Total Program
BY 2006 $M
2005 -- 141.7 -- -- 141.7 -- 141.7
2006 -- 321.3 -- -- 321.3 -- 321.3
2007 1 991.7 -- -- 991.7 -- 991.7
2008 -- 1158.8 -- -- 1158.8 -- 1158.8
2009 -- 158.3 -- -- 158.3 -- 158.3
2010 -- 135.2 -- -- 135.2 -- 135.2
2011 1 725.5 -- -- 725.5 -- 725.5
2012 -- 1528.6 -- -- 1528.6 -- 1528.6
2013 -- 121.2 -- -- 121.2 -- 121.2
2014 -- 54.8 -- -- 54.8 -- 54.8
2015 -- 59.8 -- -- 59.8 -- 59.8
2016 -- 180.0 -- -- 180.0 -- 180.0
2017 1 1120.5 -- -- 1120.5 -- 1120.5
2018 -- 1653.2 -- -- 1653.2 -- 1653.2
2019 -- 3.4 -- -- 3.4 -- 3.4
Subtotal 3 8354.0 -- -- 8354.0 -- 8354.0
LHA 6 December 31, 2012 SAR
May 21, 2013 16:15:37 UNCLASSIFIED 19
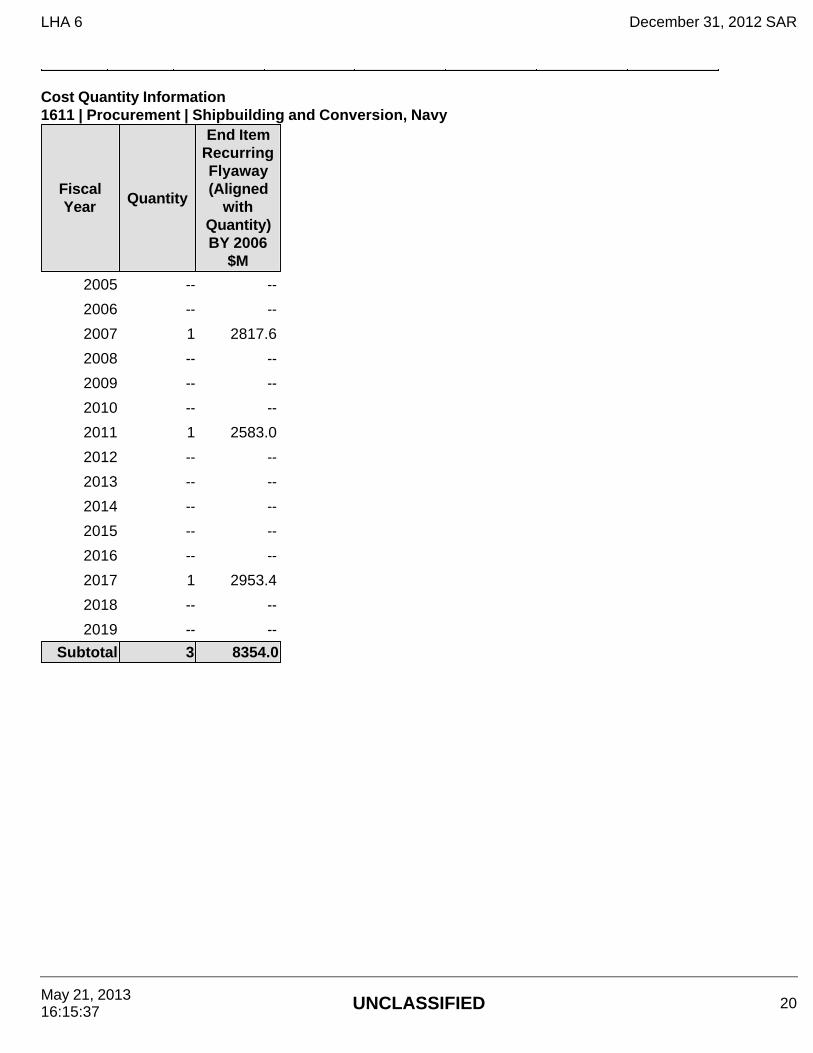
Cost Quantity Information 1611 | Procurement | Shipbuilding and Conversion, Navy
Fiscal Year Quantity
End Item Recurring Flyaway (Aligned
with Quantity) BY 2006
$M
2005 -- --
2006 -- --
2007 1 2817.6
2008 -- --
2009 -- --
2010 -- --
2011 1 2583.0
2012 -- --
2013 -- --
2014 -- --
2015 -- --
2016 -- --
2017 1 2953.4
2018 -- --
2019 -- --
Subtotal 3 8354.0
LHA 6 December 31, 2012 SAR
May 21, 2013 16:15:37 UNCLASSIFIED 20

Annual Funding TY$ 1804 | Acq O&M | Operation and Maintenance, Navy
Fiscal Year
Total Program
TY $M
2010 0.2
2011 0.2
2012 0.2
2013 0.2
2014 0.2
2015 0.2
2016 0.2
2017 0.2
2018 0.2
Subtotal 1.8
LHA 6 December 31, 2012 SAR
May 21, 2013 16:15:37 UNCLASSIFIED 21
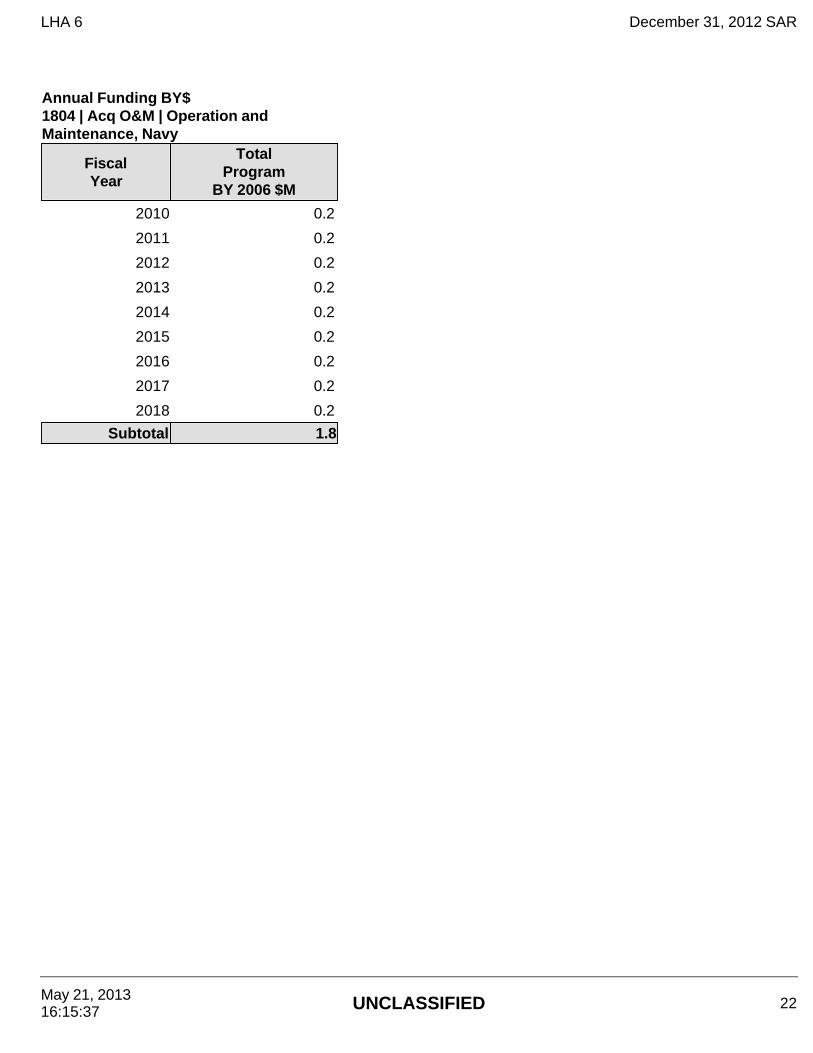
Annual Funding BY$ 1804 | Acq O&M | Operation and Maintenance, Navy
Fiscal Year
Total Program
BY 2006 $M
2010 0.2
2011 0.2
2012 0.2
2013 0.2
2014 0.2
2015 0.2
2016 0.2
2017 0.2
2018 0.2
Subtotal 1.8
LHA 6 December 31, 2012 SAR
May 21, 2013 16:15:37 UNCLASSIFIED 22

Low Rate Initial Production
The Current Total LRIP Quantity is more than 10% of the total production quantity due to the Acquisition Decision Memorandum (ADM) dated February 14, 2006, which approved 1 ship, which is standard for shipbuilding programs. An additional ADM authorized a second ship on May 8, 2012.
Initial LRIP Decision Current Total LRIP Approval Date 2/14/2006 5/8/2012 Approved Quantity 1 2 Reference LHA(R)/LHA-6 ADM
LHA(R)/LHA-6 ADM/LHA 7 ADM
Start Year 2007 2007 End Year 2013 2018
LHA 6 December 31, 2012 SAR
May 21, 2013 16:15:37 UNCLASSIFIED 23
Nuclear Cost
Foreign Military Sales
None
None
LHA 6 December 31, 2012 SAR
May 21, 2013 16:15:37 UNCLASSIFIED 24
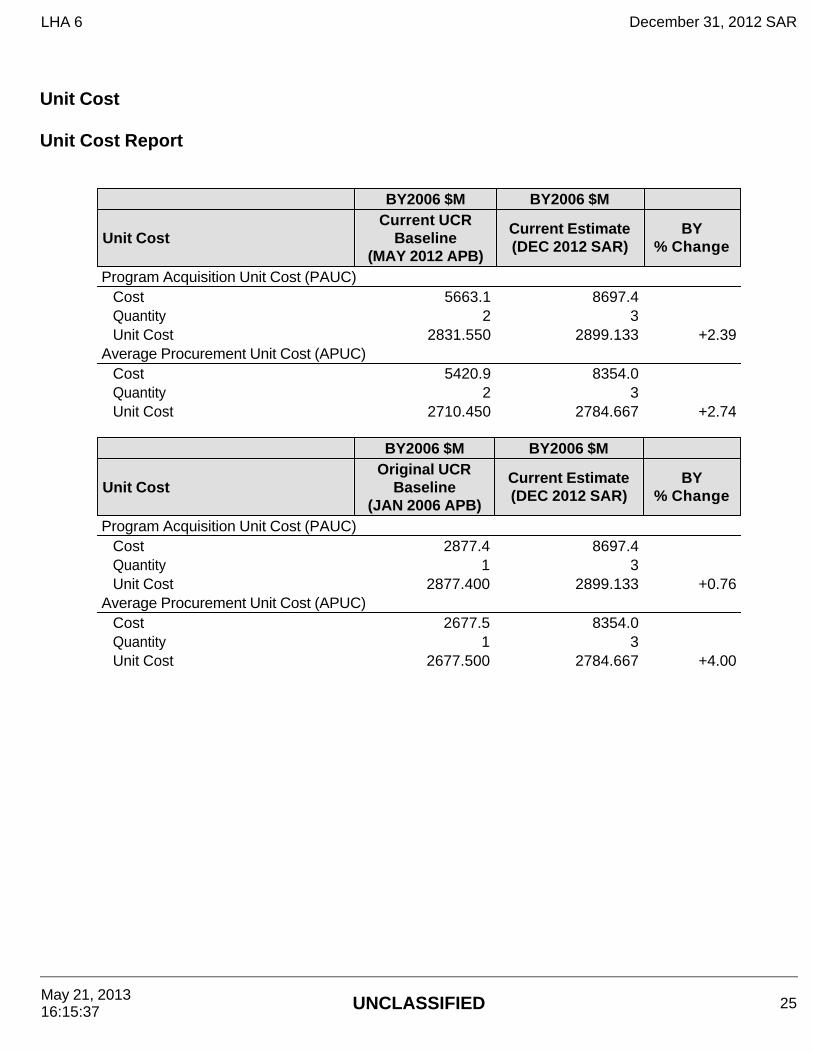
Unit Cost Unit Cost Report
BY2006 $M BY2006 $M
Unit Cost Current UCR
Baseline (MAY 2012 APB)
Current Estimate (DEC 2012 SAR)
BY % Change
Program Acquisition Unit Cost (PAUC) Cost 5663.1 8697.4Quantity 2 3Unit Cost 2831.550 2899.133 +2.39
Average Procurement Unit Cost (APUC) Cost 5420.9 8354.0Quantity 2 3Unit Cost 2710.450 2784.667 +2.74
BY2006 $M BY2006 $M
Unit Cost Original UCR
Baseline (JAN 2006 APB)
Current Estimate (DEC 2012 SAR)
BY % Change
Program Acquisition Unit Cost (PAUC) Cost 2877.4 8697.4Quantity 1 3Unit Cost 2877.400 2899.133 +0.76
Average Procurement Unit Cost (APUC) Cost 2677.5 8354.0Quantity 1 3Unit Cost 2677.500 2784.667 +4.00
LHA 6 December 31, 2012 SAR
May 21, 2013 16:15:37 UNCLASSIFIED 25
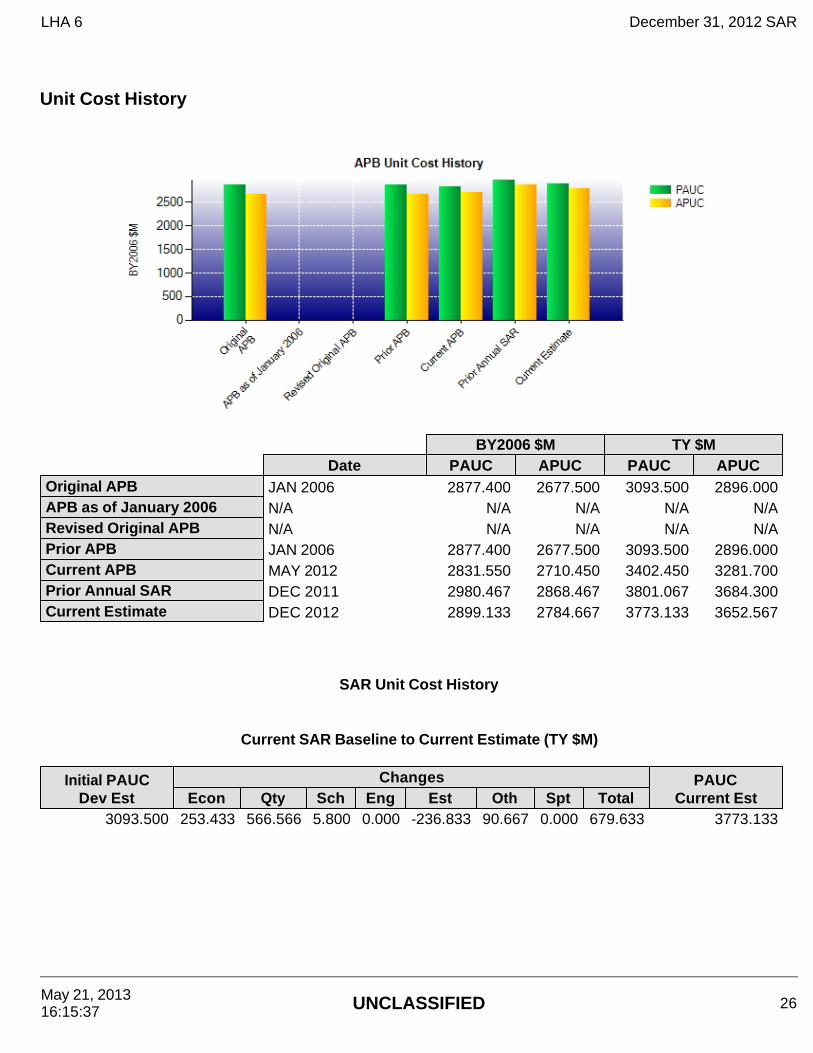
Unit Cost History
BY2006 $M TY $MDate PAUC APUC PAUC APUC
Original APB JAN 2006 2877.400 2677.500 3093.500 2896.000APB as of January 2006 N/A N/A N/A N/A N/ARevised Original APB N/A N/A N/A N/A N/APrior APB JAN 2006 2877.400 2677.500 3093.500 2896.000Current APB MAY 2012 2831.550 2710.450 3402.450 3281.700Prior Annual SAR DEC 2011 2980.467 2868.467 3801.067 3684.300Current Estimate DEC 2012 2899.133 2784.667 3773.133 3652.567
SAR Unit Cost History
Current SAR Baseline to Current Estimate (TY $M)
Initial PAUC Dev Est
Changes PAUC Current Est Econ Qty Sch Eng Est Oth Spt Total
3093.500 253.433 566.566 5.800 0.000 -236.833 90.667 0.000 679.633 3773.133
LHA 6 December 31, 2012 SAR
May 21, 2013 16:15:37 UNCLASSIFIED 26

Current SAR Baseline to Current Estimate (TY $M)
Initial APUC Dev Est
Changes APUC Current Est Econ Qty Sch Eng Est Oth Spt Total
2896.000 253.000 698.233 5.800 0.000 -291.133 90.667 0.000 756.567 3652.567
SAR Baseline History
Item/Event SAR
Planning Estimate (PE)
SAR Development Estimate (DE)
SAR Production
Estimate (PdE)
Current Estimate
Milestone A N/A JUL 2001 N/A JUL 2001Milestone B N/A JAN 2006 N/A JAN 2006Milestone C N/A N/A N/A N/AIOC N/A SEP 2013 N/A APR 2016Total Cost (TY $M) N/A 3093.5 N/A 11319.4Total Quantity N/A 1 N/A 3Prog. Acq. Unit Cost (PAUC) N/A 3093.500 N/A 3773.133
LHA 6 December 31, 2012 SAR
May 21, 2013 16:15:37 UNCLASSIFIED 27
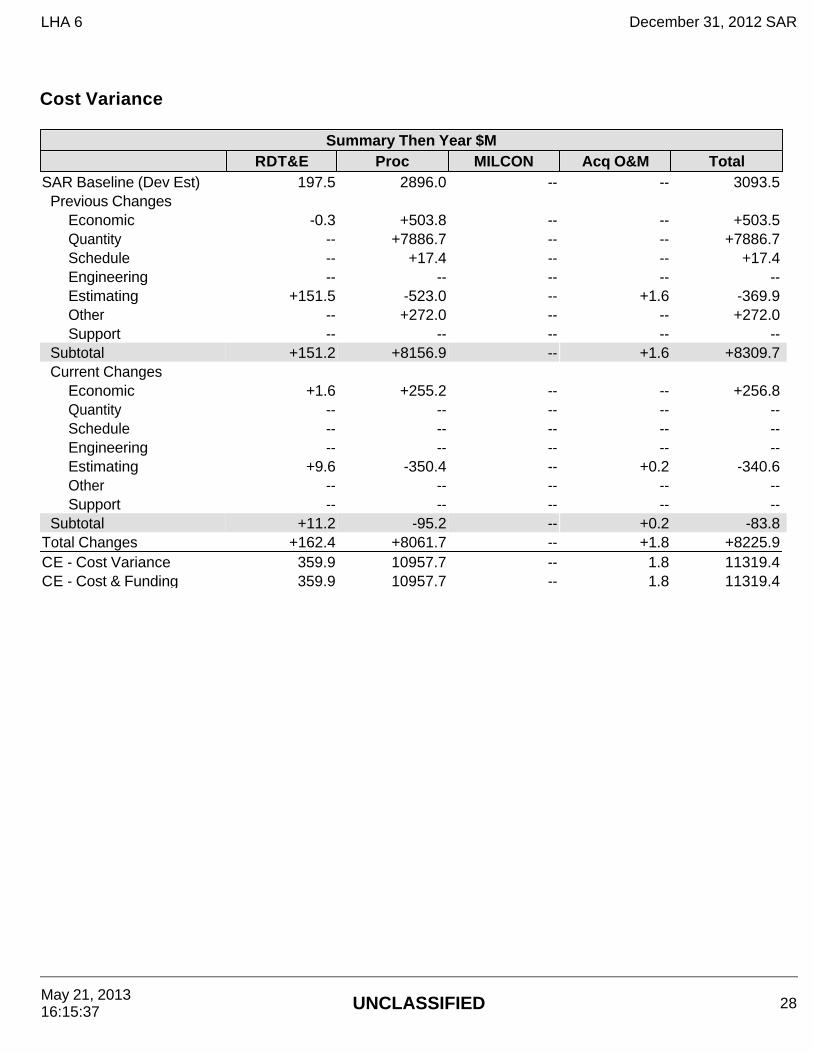
Cost Variance
Summary Then Year $MRDT&E Proc MILCON Acq O&M Total
SAR Baseline (Dev Est) 197.5 2896.0 -- -- 3093.5Previous Changes
Economic -0.3 +503.8 -- -- +503.5Quantity -- +7886.7 -- -- +7886.7Schedule -- +17.4 -- -- +17.4Engineering -- -- -- -- --Estimating +151.5 -523.0 -- +1.6 -369.9Other -- +272.0 -- -- +272.0Support -- -- -- -- --
Subtotal +151.2 +8156.9 -- +1.6 +8309.7Current Changes
Economic +1.6 +255.2 -- -- +256.8Quantity -- -- -- -- --Schedule -- -- -- -- --Engineering -- -- -- -- --Estimating +9.6 -350.4 -- +0.2 -340.6Other -- -- -- -- --Support -- -- -- -- --
Subtotal +11.2 -95.2 -- +0.2 -83.8Total Changes +162.4 +8061.7 -- +1.8 +8225.9CE - Cost Variance 359.9 10957.7 -- 1.8 11319.4CE - Cost & Funding 359.9 10957.7 -- 1.8 11319.4
LHA 6 December 31, 2012 SAR
May 21, 2013 16:15:37 UNCLASSIFIED 28
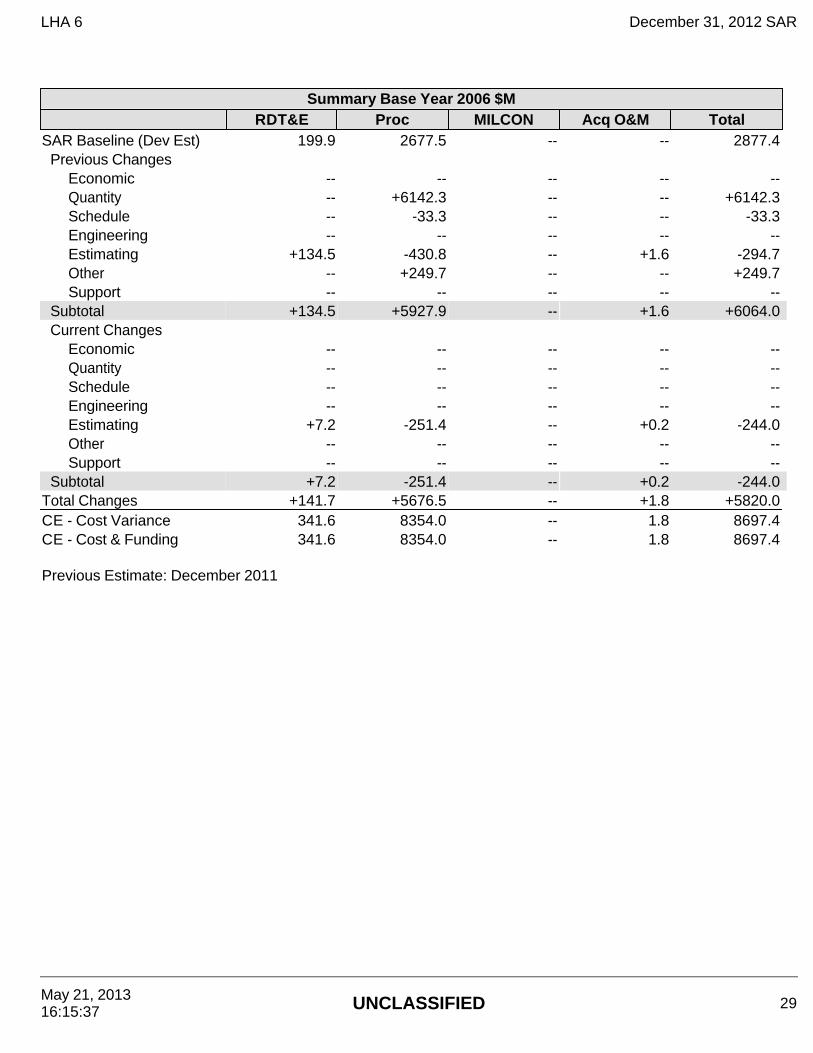
Summary Base Year 2006 $MRDT&E Proc MILCON Acq O&M Total
SAR Baseline (Dev Est) 199.9 2677.5 -- -- 2877.4Previous Changes
Economic -- -- -- -- --Quantity -- +6142.3 -- -- +6142.3Schedule -- -33.3 -- -- -33.3Engineering -- -- -- -- --Estimating +134.5 -430.8 -- +1.6 -294.7Other -- +249.7 -- -- +249.7Support -- -- -- -- --
Subtotal +134.5 +5927.9 -- +1.6 +6064.0Current Changes
Economic -- -- -- -- --Quantity -- -- -- -- --Schedule -- -- -- -- --Engineering -- -- -- -- --Estimating +7.2 -251.4 -- +0.2 -244.0Other -- -- -- -- --Support -- -- -- -- --
Subtotal +7.2 -251.4 -- +0.2 -244.0Total Changes +141.7 +5676.5 -- +1.8 +5820.0CE - Cost Variance 341.6 8354.0 -- 1.8 8697.4CE - Cost & Funding 341.6 8354.0 -- 1.8 8697.4
Previous Estimate: December 2011
LHA 6 December 31, 2012 SAR
May 21, 2013 16:15:37 UNCLASSIFIED 29

RDT&E $M
Current Change ExplanationsBase Year
Then Year
Revised escalation indices. (Economic) N/A +1.6Reduced funding for Below Threshold Reprogramming (BTR) and Small Business
Innovative Research (SBIR) Assessment. (Estimating) -3.2 -3.7
Increased funding for Navy/Marine Air-Ground Task Force (MAGTF) Ship Integration Center (NMSIC). (Estimating) +8.2 +10.0
Adjustment for current and prior escalation. (Estimating) -0.7 -0.7Increased funding for Test & Evaluation (T&E) requirements in accordance with 10
United States Code 2399. (Estimating) +1.5 +1.9
Revised estimate to reflect application of new outyear escalation indices. (Estimating) +1.4 +2.1RDT&E Subtotal +7.2 +11.2
Procurement $M
Current Change ExplanationsBase Year
Then Year
Revised escalation indices. (Economic) N/A +255.2Adjustment for current and prior escalation. (Estimating) -73.7 -95.8Decreased Outfitting and Post Delivery funding for LHA 8. (Estimating) -19.5 -30.9Increased funding for LHA 6 Economic Price Adjustment (EPA) associated with cost to
complete. (Estimating) +27.5 +37.7
Decreased funding for rate adjustments (eg Navy Working Capital Fund). (Estimating) -0.9 -1.3Revised estimate for LHA 8 and realignment of two year incremental funding.
(Estimating) -184.8 -260.1
Procurement Subtotal -251.4 -95.2
Acq O&M $M
Current Change ExplanationsBase Year
Then Year
Refined estimate for LHA 7 and LHA 8. (Estimating) +0.2 +0.2Acq O&M Subtotal +0.2 +0.2
LHA 6 December 31, 2012 SAR
May 21, 2013 16:15:37 UNCLASSIFIED 30
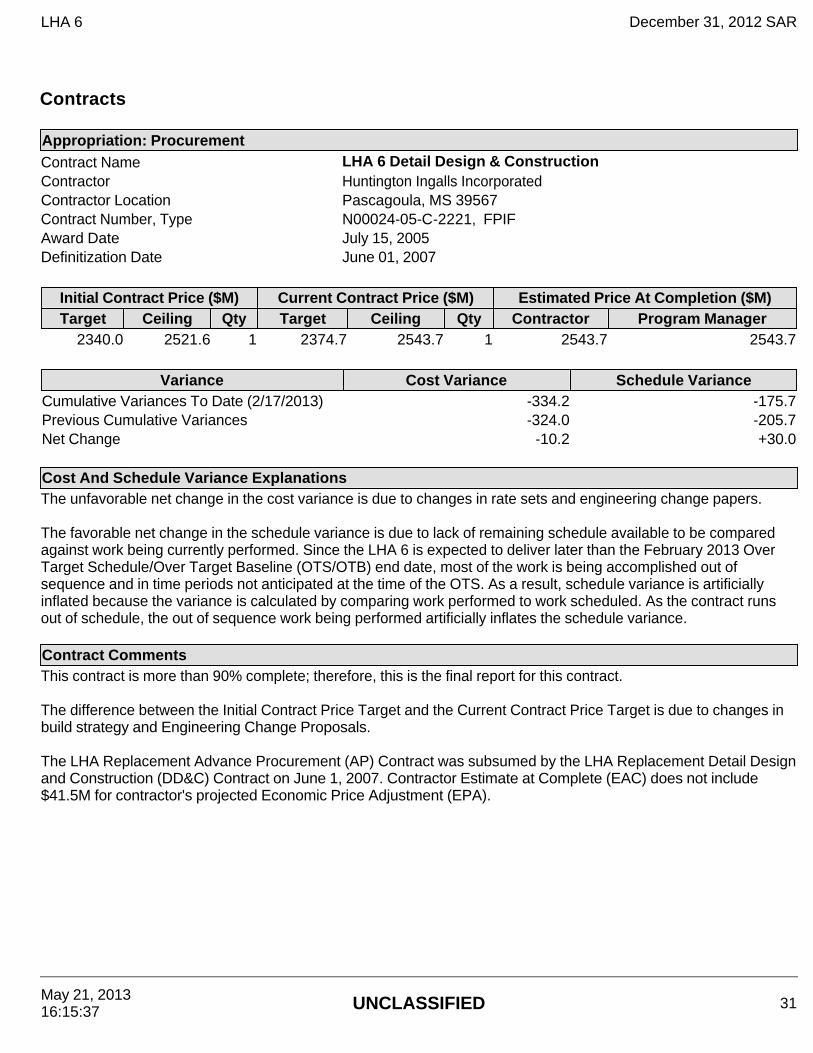
Contracts
Appropriation: Procurement Contract Name LHA 6 Detail Design & Construction Contractor Huntington Ingalls Incorporated Contractor Location Pascagoula, MS 39567 Contract Number, Type N00024-05-C-2221, FPIF Award Date July 15, 2005 Definitization Date June 01, 2007
Initial Contract Price ($M) Current Contract Price ($M) Estimated Price At Completion ($M) Target Ceiling Qty Target Ceiling Qty Contractor Program Manager
2340.0 2521.6 1 2374.7 2543.7 1 2543.7 2543.7
Variance Cost Variance Schedule Variance Cumulative Variances To Date (2/17/2013) -334.2 -175.7 Previous Cumulative Variances -324.0 -205.7 Net Change -10.2 +30.0
Cost And Schedule Variance Explanations The unfavorable net change in the cost variance is due to changes in rate sets and engineering change papers. The favorable net change in the schedule variance is due to lack of remaining schedule available to be compared against work being currently performed. Since the LHA 6 is expected to deliver later than the February 2013 Over Target Schedule/Over Target Baseline (OTS/OTB) end date, most of the work is being accomplished out of sequence and in time periods not anticipated at the time of the OTS. As a result, schedule variance is artificially inflated because the variance is calculated by comparing work performed to work scheduled. As the contract runs out of schedule, the out of sequence work being performed artificially inflates the schedule variance.
Contract Comments This contract is more than 90% complete; therefore, this is the final report for this contract. The difference between the Initial Contract Price Target and the Current Contract Price Target is due to changes in build strategy and Engineering Change Proposals. The LHA Replacement Advance Procurement (AP) Contract was subsumed by the LHA Replacement Detail Design and Construction (DD&C) Contract on June 1, 2007. Contractor Estimate at Complete (EAC) does not include $41.5M for contractor's projected Economic Price Adjustment (EPA).
LHA 6 December 31, 2012 SAR
May 21, 2013 16:15:37 UNCLASSIFIED 31
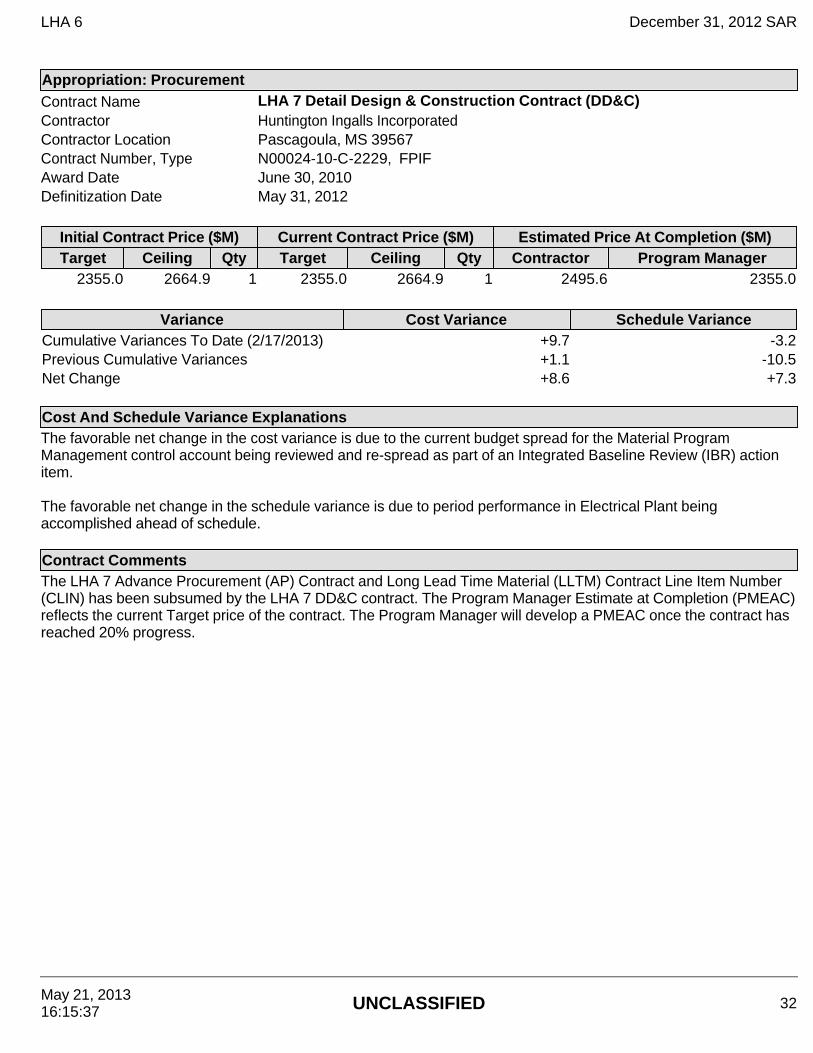
Appropriation: Procurement Contract Name LHA 7 Detail Design & Construction Contract (DD&C) Contractor Huntington Ingalls Incorporated Contractor Location Pascagoula, MS 39567 Contract Number, Type N00024-10-C-2229, FPIF Award Date June 30, 2010 Definitization Date May 31, 2012
Initial Contract Price ($M) Current Contract Price ($M) Estimated Price At Completion ($M) Target Ceiling Qty Target Ceiling Qty Contractor Program Manager
2355.0 2664.9 1 2355.0 2664.9 1 2495.6 2355.0
Variance Cost Variance Schedule Variance Cumulative Variances To Date (2/17/2013) +9.7 -3.2 Previous Cumulative Variances +1.1 -10.5 Net Change +8.6 +7.3
Cost And Schedule Variance Explanations The favorable net change in the cost variance is due to the current budget spread for the Material Program Management control account being reviewed and re-spread as part of an Integrated Baseline Review (IBR) action item. The favorable net change in the schedule variance is due to period performance in Electrical Plant being accomplished ahead of schedule.
Contract Comments The LHA 7 Advance Procurement (AP) Contract and Long Lead Time Material (LLTM) Contract Line Item Number (CLIN) has been subsumed by the LHA 7 DD&C contract. The Program Manager Estimate at Completion (PMEAC) reflects the current Target price of the contract. The Program Manager will develop a PMEAC once the contract has reached 20% progress.
LHA 6 December 31, 2012 SAR
May 21, 2013 16:15:37 UNCLASSIFIED 32
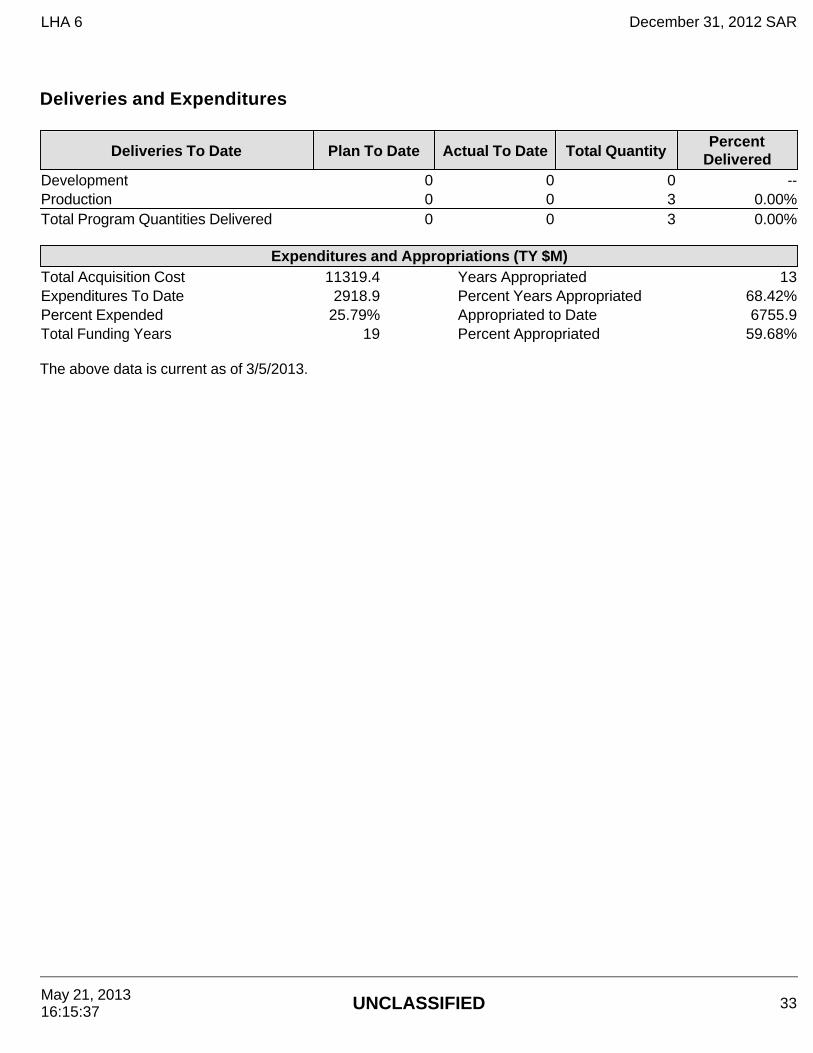
Deliveries and Expenditures
The above data is current as of 3/5/2013.
Deliveries To Date Plan To Date Actual To Date Total Quantity Percent
Delivered Development 0 0 0 -- Production 0 0 3 0.00% Total Program Quantities Delivered 0 0 3 0.00%
Expenditures and Appropriations (TY $M) Total Acquisition Cost 11319.4 Years Appropriated 13 Expenditures To Date 2918.9 Percent Years Appropriated 68.42% Percent Expended 25.79% Appropriated to Date 6755.9 Total Funding Years 19 Percent Appropriated 59.68%
LHA 6 December 31, 2012 SAR
May 21, 2013 16:15:37 UNCLASSIFIED 33
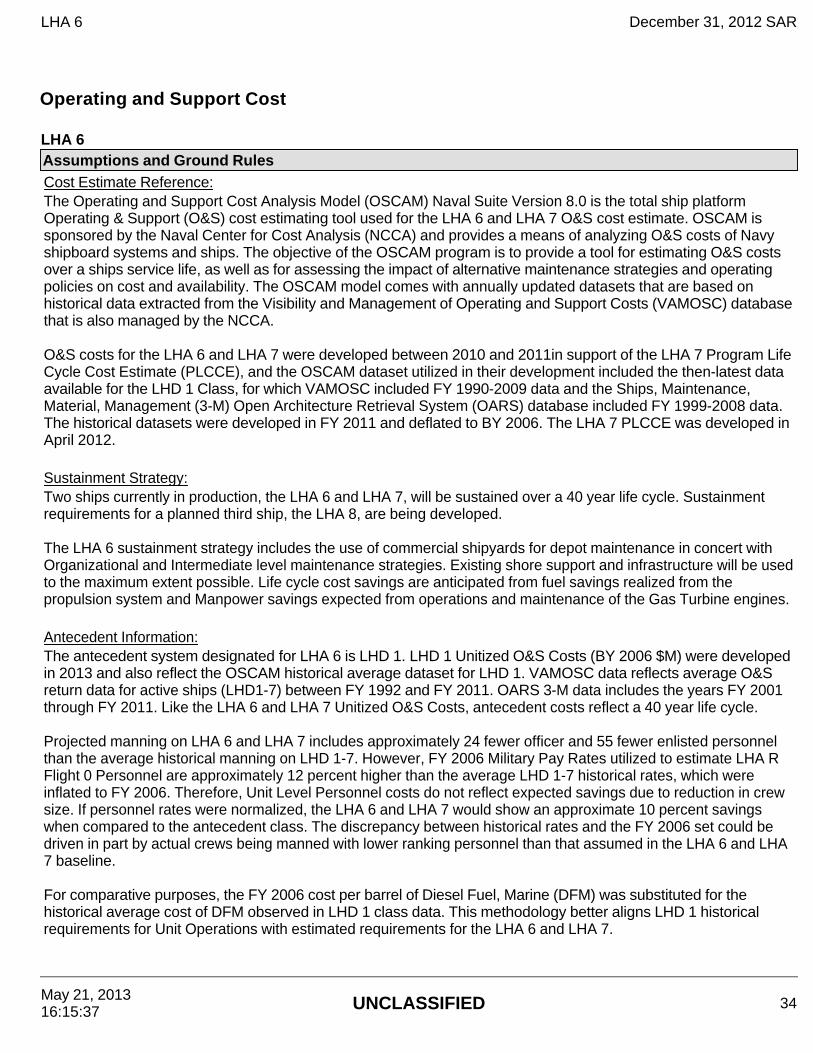
Operating and Support Cost LHA 6 Assumptions and Ground RulesCost Estimate Reference: The Operating and Support Cost Analysis Model (OSCAM) Naval Suite Version 8.0 is the total ship platform Operating & Support (O&S) cost estimating tool used for the LHA 6 and LHA 7 O&S cost estimate. OSCAM is sponsored by the Naval Center for Cost Analysis (NCCA) and provides a means of analyzing O&S costs of Navy shipboard systems and ships. The objective of the OSCAM program is to provide a tool for estimating O&S costs over a ships service life, as well as for assessing the impact of alternative maintenance strategies and operating policies on cost and availability. The OSCAM model comes with annually updated datasets that are based on historical data extracted from the Visibility and Management of Operating and Support Costs (VAMOSC) database that is also managed by the NCCA. O&S costs for the LHA 6 and LHA 7 were developed between 2010 and 2011in support of the LHA 7 Program Life Cycle Cost Estimate (PLCCE), and the OSCAM dataset utilized in their development included the then-latest data available for the LHD 1 Class, for which VAMOSC included FY 1990-2009 data and the Ships, Maintenance, Material, Management (3-M) Open Architecture Retrieval System (OARS) database included FY 1999-2008 data. The historical datasets were developed in FY 2011 and deflated to BY 2006. The LHA 7 PLCCE was developed in April 2012. Sustainment Strategy: Two ships currently in production, the LHA 6 and LHA 7, will be sustained over a 40 year life cycle. Sustainment requirements for a planned third ship, the LHA 8, are being developed. The LHA 6 sustainment strategy includes the use of commercial shipyards for depot maintenance in concert with Organizational and Intermediate level maintenance strategies. Existing shore support and infrastructure will be used to the maximum extent possible. Life cycle cost savings are anticipated from fuel savings realized from the propulsion system and Manpower savings expected from operations and maintenance of the Gas Turbine engines. Antecedent Information: The antecedent system designated for LHA 6 is LHD 1. LHD 1 Unitized O&S Costs (BY 2006 $M) were developed in 2013 and also reflect the OSCAM historical average dataset for LHD 1. VAMOSC data reflects average O&S return data for active ships (LHD1-7) between FY 1992 and FY 2011. OARS 3-M data includes the years FY 2001 through FY 2011. Like the LHA 6 and LHA 7 Unitized O&S Costs, antecedent costs reflect a 40 year life cycle. Projected manning on LHA 6 and LHA 7 includes approximately 24 fewer officer and 55 fewer enlisted personnel than the average historical manning on LHD 1-7. However, FY 2006 Military Pay Rates utilized to estimate LHA R Flight 0 Personnel are approximately 12 percent higher than the average LHD 1-7 historical rates, which were inflated to FY 2006. Therefore, Unit Level Personnel costs do not reflect expected savings due to reduction in crew size. If personnel rates were normalized, the LHA 6 and LHA 7 would show an approximate 10 percent savings when compared to the antecedent class. The discrepancy between historical rates and the FY 2006 set could be driven in part by actual crews being manned with lower ranking personnel than that assumed in the LHA 6 and LHA 7 baseline. For comparative purposes, the FY 2006 cost per barrel of Diesel Fuel, Marine (DFM) was substituted for the historical average cost of DFM observed in LHD 1 class data. This methodology better aligns LHD 1 historical requirements for Unit Operations with estimated requirements for the LHA 6 and LHA 7.
LHA 6 December 31, 2012 SAR
May 21, 2013 16:15:37 UNCLASSIFIED 34
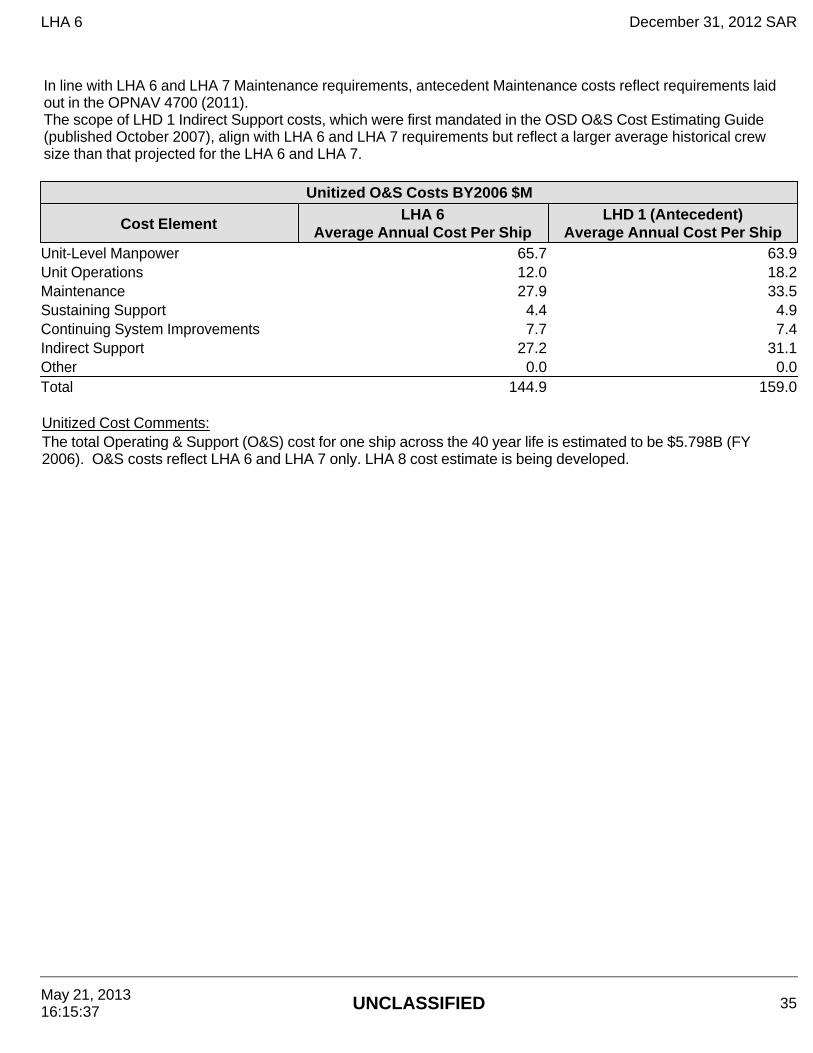
In line with LHA 6 and LHA 7 Maintenance requirements, antecedent Maintenance costs reflect requirements laid out in the OPNAV 4700 (2011). The scope of LHD 1 Indirect Support costs, which were first mandated in the OSD O&S Cost Estimating Guide (published October 2007), align with LHA 6 and LHA 7 requirements but reflect a larger average historical crew size than that projected for the LHA 6 and LHA 7.
Unitized O&S Costs BY2006 $M
Cost ElementLHA 6
Average Annual Cost Per ShipLHD 1 (Antecedent)
Average Annual Cost Per ShipUnit-Level Manpower 65.7 63.9Unit Operations 12.0 18.2Maintenance 27.9 33.5Sustaining Support 4.4 4.9Continuing System Improvements 7.7 7.4Indirect Support 27.2 31.1Other 0.0 0.0Total 144.9 159.0
Unitized Cost Comments: The total Operating & Support (O&S) cost for one ship across the 40 year life is estimated to be $5.798B (FY 2006). O&S costs reflect LHA 6 and LHA 7 only. LHA 8 cost estimate is being developed.
LHA 6 December 31, 2012 SAR
May 21, 2013 16:15:37 UNCLASSIFIED 35
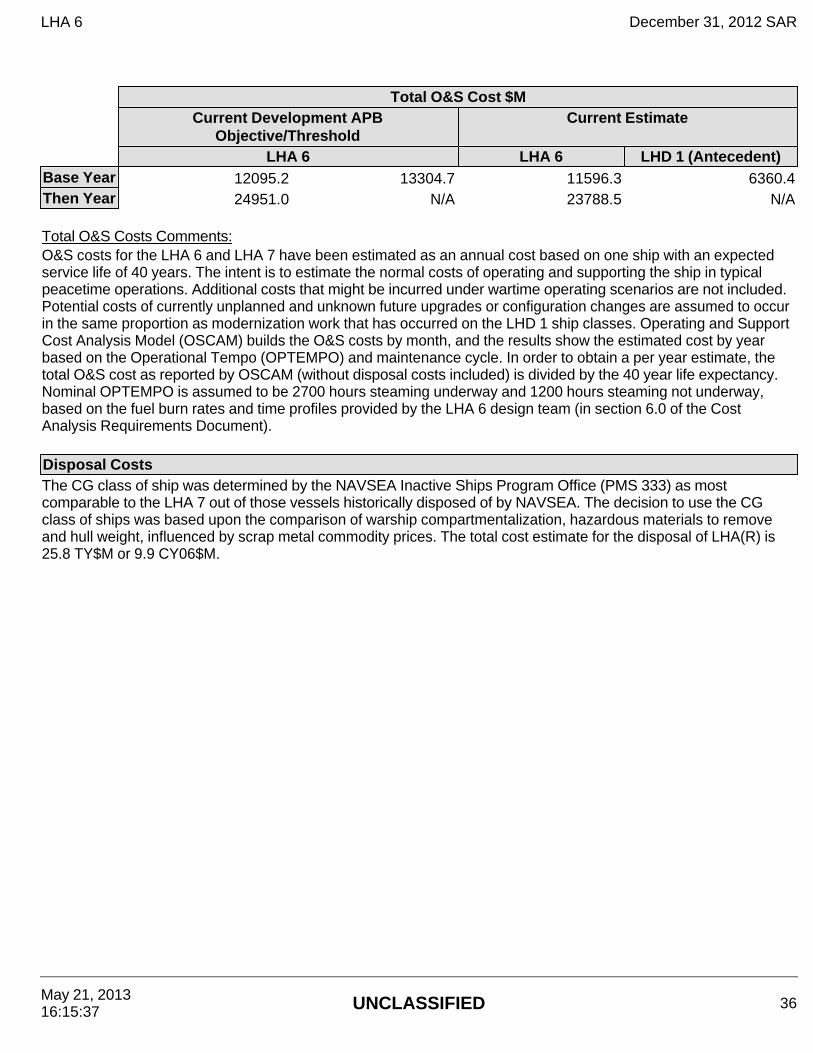
Total O&S Cost $M
Current Development APB
Objective/ThresholdCurrent Estimate
LHA 6 LHA 6 LHD 1 (Antecedent)Base Year 12095.2 13304.7 11596.3 6360.4Then Year 24951.0 N/A 23788.5 N/A
Total O&S Costs Comments: O&S costs for the LHA 6 and LHA 7 have been estimated as an annual cost based on one ship with an expected service life of 40 years. The intent is to estimate the normal costs of operating and supporting the ship in typical peacetime operations. Additional costs that might be incurred under wartime operating scenarios are not included. Potential costs of currently unplanned and unknown future upgrades or configuration changes are assumed to occur in the same proportion as modernization work that has occurred on the LHD 1 ship classes. Operating and Support Cost Analysis Model (OSCAM) builds the O&S costs by month, and the results show the estimated cost by year based on the Operational Tempo (OPTEMPO) and maintenance cycle. In order to obtain a per year estimate, the total O&S cost as reported by OSCAM (without disposal costs included) is divided by the 40 year life expectancy. Nominal OPTEMPO is assumed to be 2700 hours steaming underway and 1200 hours steaming not underway, based on the fuel burn rates and time profiles provided by the LHA 6 design team (in section 6.0 of the Cost Analysis Requirements Document). Disposal Costs The CG class of ship was determined by the NAVSEA Inactive Ships Program Office (PMS 333) as most comparable to the LHA 7 out of those vessels historically disposed of by NAVSEA. The decision to use the CG class of ships was based upon the comparison of warship compartmentalization, hazardous materials to remove and hull weight, influenced by scrap metal commodity prices. The total cost estimate for the disposal of LHA(R) is 25.8 TY$M or 9.9 CY06$M.
LHA 6 December 31, 2012 SAR
May 21, 2013 16:15:37 UNCLASSIFIED 36