SELECT MARKETS 2016: HOTEL VALUATION INDEX · currency fluctuation, ... however, assume a constant...
16
APRIL 2016 HVS Singapore Office | 6 Temasek Boulevard, #23-01A Suntec City Tower Four, Singapore HVS New Delhi Office | 2 nd Floor, Paras Downtown Centre, Golf Course Road, Sector 53, Gurgaon, India HVS.com ASIA PACIFIC – SELECT MARKETS 2016: HOTEL VALUATION INDEX Yashaas Rajan Senior Associate, HVS Singapore Anirudh Katre Director, HVS New Delhi Achin Khanna Managing Director, HVS New Delhi Chee Hok Yean Managing Partner, HVS Singapore
Transcript of SELECT MARKETS 2016: HOTEL VALUATION INDEX · currency fluctuation, ... however, assume a constant...

APRIL 2016
HVS Singapore Office | 6 Temasek Boulevard, #23-01A Suntec City Tower Four, Singapore HVS New Delhi Office | 2nd Floor, Paras Downtown Centre, Golf Course Road, Sector 53, Gurgaon, India
HVS.com
ASIA PACIFIC – SELECT MARKETS
2016: HOTEL VALUATION INDEX
Yashaas Rajan Senior Associate, HVS Singapore Anirudh Katre Director, HVS New Delhi Achin Khanna Managing Director, HVS New Delhi Chee Hok Yean Managing Partner, HVS Singapore

2016: HOTEL VALUATION INDEX: ASIA PACIFIC | PAGE 1
The 2016 edition of the Hospitality Valuation Index (HVI) – APAC comes to light amidst a backdrop of global uncertainty, social restructuring and economic rebalancing. While skeptics might dismiss the moderate tone in favor of something harsher, we at HVS endeavor to capture and reflect fundamental and inherent changes rather than relying on hearsay that more often than not amplifies exuberance as well as paranoia. Without doubt, the economic environment in Asia Pacific has indeed been short of being in the pink. With China, the region’s largest economy slowing down, on account of a decline in consumption levels, commodity prices have taken a hit, which in turn has adversely affected export driven countries such as Indonesia and Malaysia as well as economic sentiments at large. Regional pressures have been exacerbated by the decline in oil prices, which hit the lowest in decades triggering a dramatic reduction in exploratory activity by most oil companies, resulting in slowdown of capital inflow to the region. Adding to this was the rate hike by the Federal Reserve in the last quarter of 2015, which further led to capital outflow from emerging markets. Not only manufacturing-centric countries, but also Singapore, one of the most developed and service-centric economies in the region, got exposed to the residual ill-effects of economic turbulence, witnessing a decline in business activity. Looking beyond ‘China and its side effects’, the region’s second-largest economy (and the world’s third largest), Japan, struggled with sluggish domestic growth of its own, amidst a deflationary environment. Even though the Japanese government launched a slew of policy measures to reflate the economy, its pace and effectiveness remains to be seen. India, on the other hand, was fairly resilient to economic vulnerability in the region. Even though the country’s stock market remains in bear territory, its economic fundamentals have shown improvement on account of the fiscal cushion provided by the reduction in oil subsidies, prudent monetary policy by the Reserve Bank, and an uptick in domestic consumption demand. Similarly, the Australian economy has been relatively decoupled, and has remained stable on account of an increase in production-related activities.
What is the HVI?
The Hospitality Valuation Index (HVI) combines the various factors affecting the economy and region at large with hotel-market specific demand and supply dynamics to derive indicative values and future growth trends. For this edition of the HVI, we analyzed 32 top hotel markets in 13 countries with a total inventory of approximately 332,000 rooms in the mid-market and higher space (four star plus).
Hotel Markets Covered
Australia Melbourne,
Sydney
Bangladesh Dhaka
Cambodia Phnom Penh,
Siem Reap
India Agra,
Ahmedabad, Bengaluru,
Chennai, Delhi, NOIDA, Goa,
Gurgaon, Hyderabad,
Jaipur, Kolkata,
Mumbai, Pune
Indonesia Bali, Jakarta
Japan Osaka, Tokyo
Malaysia Kuala Lumpur,
Langkawi
Maldives
Philippines Manila
Singapore
Sri Lanka Colombo
Thailand Bangkok, Phuket
Vietnam Hanoi, Ho Chi
Minh City

Understanding the HVI
Due diligence pertaining to demand and supply dynamics was carried out while analyzing each market for its existing performance and forecasting future potential. For the analysis, we not only utilized our extensive in-house database, but also intellectual capital that our associates have developed over the years. Having covered these markets for well over a decade, we have keenly observed and analyzed various cycles (economic and industry specific), which puts us in a position to understand fundamental changes better than most.
We have assumed a notional 200-key hotel and benchmarked its performance to marketwide occupancy and average rate levels (Historical and Forecasted). We then used actual operating P&Ls (marketwide average) to further comment on its performance, deriving the net operating profit. Post this, the Income Capitalization Approach was used to calculate the economic value of the hotel.
HVI assumes a date of 31st December for each calendar year. Capitalization rate reflects trends in performance, competitive environment, and cost of debt and equity. The parameters adopted also assume reasonable level of debt and rational equity expectations (investor sentiment). The indicative values, therefore, would not bear comparison to actual transactions. However, this is the best approach to retain the integrity of HVI as a rolling index.
The Index: We chose the year 2000 as our base year with intent to create a starting point for our Hotel Valuation Index. The average value for a notional 200-room hotel across the 32 markets, covered in the report, given their market specific performance parameters in that year was about USD181,000. This value was assigned an index of 1. The Per Available Room (PAR) value (historical & forecasted) for each market was then divided by the average base year value to arrive at the index number. For e.g. Singapore’s value per room in 2015 derived to be US$653,000, when divided by the base year value (US$653,000/181,000) gives an index number of 3.6. This simply means that the value of Singapore in 2015 was approximately 3.6 times that of the average base year value (reflective of 32 markets) in 2000.
2016: HOTEL VALUATION INDEX: ASIA PACIFIC | PAGE 2
*While to facilitate comparison we have calculated the index in USD, in order to understand the inherent growth in a market, sans currency fluctuation, we have also presented growth in values in terms local currency for the historical years. The forecasted numbers, however, assume a constant relationship between the local currency and USD.
What Not To Take Out Of It !
•The HVI intends to create a platform where trends in hotel values are captured on an ongoing basis. We understand and appreciate the individual characteristics pertaining to each hotel asset. Therefore, it would be misrepresentative to look at a trend from the HVI and apply it to a specific asset. While this might give an indication of directional movement, for an investor or an owner, it is critical to capture hotel specific trends and factors in order to comment on its open market value. •Also, the HVI does not take into account appreciation or depreciation of real estate in a particular market neither does it account for changes in construction prices/indices. We work off a premise that a hotel asset’s value is derived from the income it can generate.
Valuation Trends
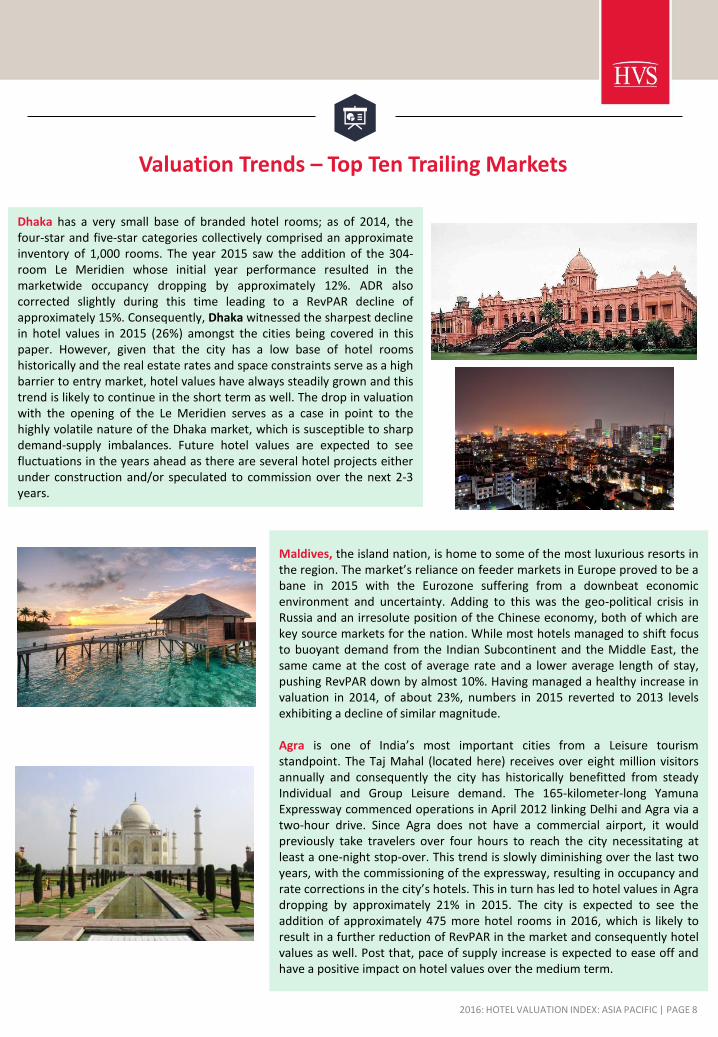
Notes •Valuation trends for a country are reflective of the markets covered in it, details of which are shown in the next figure. •USD|Local Currency Estimates – Economist Intelligence Unit (EIU) •Sri Lanka and Maldives – % change reported only in USD terms.
% Change % Change % Change % Change
Country 2014 2015 2014 2015
Australia -3% -9% 5% 9%
Bangladesh 8% -26% 7% -26%
Cambodia 1% -17% 1% -16%
India -6% 2% -3% 8%
Indonesia 8% -10% 23% 1%
Japan 9% 20% 18% 37%
Malaysia 14% -12% 19% 5%
Maldives 23% -22% 23% -22%
Philippines 25% 30% 31% 32%
Singapore -4% -17% -2% -9%
Sri Lanka -17% 14% -17% 14%
Thailand -38% 56% -34% 64%
Vietnam -11% -4% -10% -1%
Average -2.4% -3.0%
USD Local Currency
FIGURE 1: VALUATION TRENDS - BY COUNTRY*
2016: HOTEL VALUATION INDEX: ASIA PACIFIC | PAGE 3

Valuation Trends FIGURE 2: VALUATION TRENDS BY CITY
% Change % Change % Change % Change
City 2013 2014 2015 2014 2015 2014 2015
Bangkok 1.0 0.6 1.0 -40.0% 68.5% -36.2% 77.4%
Bengaluru 1.0 0.8 1.0 -18.0% 31.2% -15.0% 38.5%
Phuket 1.1 0.7 0.9 -32.6% 30.8% -28.7% 37.7%
Manila 0.8 1.0 1.3 25.3% 29.8% 31.1% 32.4%
Hyderabad 0.4 0.6 0.8 43.2% 23.3% 47.8% 30.5%
Tokyo 2.3 2.4 2.9 6.3% 21.6% 15.0% 38.7%
Hanoi 0.8 0.7 0.9 -11.3% 17.2% -10.5% 20.5%
Jaipur 0.6 0.6 0.7 -4.5% 16.8% -0.5% 23.2%
Osaka 1.6 2.0 2.3 19.1% 16.3% 28.8% 32.7%
Pune 0.5 0.6 0.7 7.2% 14.4% 11.0% 20.3%
Colombo 1.0 0.8 0.9 -17.1% 13.8% -17.1% 13.8%
Langkawi 1.9 2.2 2.3 16.4% 5.1% 21.0% 25.6%
Ahmedabad 0.5 0.6 0.6 11.8% 3.8% 16.0% 9.7%
Chennai 0.6 0.7 0.6 6.3% -0.8% 11.2% 3.7%
Mumbai 1.5 1.6 1.6 6.7% -1.4% 11.0% 3.9%
Delhi 1.4 1.1 1.1 -21.0% -1.5% -17.7% 3.7%
Kolkata 1.1 0.9 0.9 -18.4% -1.8% -15.0% 3.3%
Average 1.92 1.87 1.81 -2.4% -3.0%
Sydney 2.0 2.0 1.9 -3.0% -4.5% 4.5% 14.6%
Bali 1.8 2.2 2.0 18.2% -6.4% 33.9% 5.1%
NOIDA 1.1 0.6 0.6 -41.0% -7.0% -38.5% -1.9%
Goa 1.4 1.4 1.3 -2.4% -8.8% 1.6% -3.8%
Phnom Penh 0.7 0.7 0.6 0.0% -10.0% 0.2% -8.9%
Gurgaon 1.3 1.1 1.0 -15.2% -11.1% -11.3% -6.5%
Jakarta 1.3 1.3 1.1 -3.4% -13.6% 9.8% -3.0%
Melbourne 1.9 1.9 1.6 -2.3% -14.6% 5.3% 2.6%
Singapore 4.5 4.3 3.6 -3.7% -16.6% -2.2% -9.4%
Kuala Lumpur 1.0 1.1 0.9 13.8% -16.7% 18.3% -0.3%
Siem Reap 0.8 0.8 0.7 1.3% -20.5% 1.5% -19.7%
Ho Chi Minh City 1.2 1.1 0.8 -8.1% -20.7% -7.0% -18.1%
Agra 0.8 0.9 0.7 16.1% -21.1% 21.2% -17.3%
Maldives 6.9 8.5 6.6 22.8% -21.8% 22.8% -21.8%
Dhaka 1.8 2.0 1.4 8.0% -26.3% 7.2% -26.0%
USD Local Currency
INDEX
2016: HOTEL VALUATION INDEX: ASIA PACIFIC | PAGE 4
Notes •Values presented by % change in 2015 over 2014 in USD terms, highest to lowest. •Sri Lanka and Maldives – % change reported only in USD terms

Valuation Trends
FIGURE 3: TOP TEN LEADING AND TRAILING MARKETS (% CHANGE IN USD IN 2015 OVER 2014)
-40.0%
-20.0%
0.0%
20.0%
40.0%
60.0%
80.0%
% C
han
ge in
20
15
ove
r 2
01
4 (
USD
te
rms)
Figure 2 (on previous page) presents the index for each market relative to the base year and the respective changes in 2014 and 2015. While relative percentage gains/losses have been based in USD to facilitate comparison between markets, we have also presented the same in local currency to gauge changes without the effect of currency fluctuation. What is clearly visible is that almost all currencies have depreciated vis–à–vis the USD during 2013–15, as a result of which gains (in USD) remain understated, and losses, accentuated. In fact, various major cities such as Mumbai, Chennai, Delhi, Sydney, Melbourne and Bali witnessed a gain in valuation in their respective local currency on account of a favorable demand and supply characteristic. However, since the depreciation of their local currency was higher than the valuation gain, the resultant changes in USD terms ended up being negative. The average index value, in USD, depreciated by approximately 2.4% and 3.0% in 2014 and 2015, respectively. Figure 3 below highlights the top ten leading and trailing markets based on percentage change in 2015 over 2014 (USD terms)
Top Ten Leading Markets Bangkok tops the list in terms of relative gain in valuation having witnessed an approximate 69% increase in 2015 over that the previous year. An increase of this magnitude was a result of the market bouncing back after being suppressed in 2014 owing to the political crisis that led to social disruption in the capital city during the first half of the year. In 2014, the valuation in Bangkok dropped by almost 40% as the market lost 18% in occupancy due to the many postponements and cancellations of trips after issuance of travel warnings /advisories. The decline in rooms revenue, as the case is typically, was further magnified by a drop in profitability. In 2015, not only did Bangkok regain its 2013 level of occupancy but hotels managed to increase average rates by 2%. Omitting 2013 as an aberration, Bangkok has shown a year-on-year increase in valuation to the tune of 1% since 2013. On the transactions front, the city saw limited number of deals in 2015 as sellers were waiting for the market to realize its full potential after the setback in 2014. For reasons stated above, the Phuket market also rebounded in 2015, exhibiting 31% increase in value.
2016: HOTEL VALUATION INDEX: ASIA PACIFIC | PAGE 5

Valuation Trends – Top Ten Leading Markets
Bengaluru, witnessed a growth of 31% in hotel values in 2015 over that in 2014 and ranked highest amongst the cities of India. The year 2014 saw the introduction of approximately 1,200 hotel rooms in the four-star and five-star category resulting in pressures on both occupancy and ADR leading to a decline of 18% in hotel values over those the previous year. Healthy growth in room night demand in 2015, upwards of 20%, successfully helped absorb the new supply, and significantly push up marketwide RevPAR. This trend is anticipated to continue with minimal new supply expected to enter the market over the next couple of years. Hotel values are, therefore, expected to continue improving for this city over the next few years. Since Typhoon Haiyan struck the Philippines in 2013, hotel performance in the capital city of Manila has shown a healthy year-on-year increase. Demand during this period has grown at a strong pace of approximately 9% annually, a large portion of which was induced by the City of Dreams development, an integrated resort and casino complex. A strong growth in demand coupled with nominal growth in supply led to strong growth in RevPAR translating into approximately 30% increase in valuation in 2015 over that in 2014.
Hotel values in Hyderabad have seen significant improvement over the last two years. The overall growth in the city, which had been plagued by political turmoil in the years leading to the formation of the state of Telangana in 2014 witnessed a complete turnaround leading to annual increases in hotel values of 43% and 23% in 2014 and 2015, respectively. The city’s lodging market has strong growth fundamentals with a world class meeting facility in the form of Hyderabad International Convention Centre (HICC) that is slowly reaching peak performance and strong overall infrastructure that promotes commercial development. While the pace of ramp up of this city over the last two years has been significant, one must note that it has been off a low base. Therefore, while we still forecast improvement in hotel values for Hyderabad over the next couple of years, it is expected to be at a slower pace than that earlier. Tourist arrivals into Japan seem to be defying sluggish growth of its economy having achieved record levels in 2014 and 2015. Given its best-in class infrastructure, connectivity and a weakening Yen against major global currencies has made Japan one of the preferred tourist destinations around the globe. The capital city, and port of entry for majority of the tourists, Tokyo, has benefitted most due to the uptrend in passenger movements. The high cost of real estate that acts as a substantial barrier to entry coupled with surging demand has put Tokyo in the spotlight for hotel investors. This was clearly evident as the city saw a noticeable increase in hotel transactions and overall value in 2015 compared to previous years. As per HVI, in local currency, the city saw an increase of almost 39% in valuation in 2015 over that in 2014; however, the return in USD was reduced to almost half after factoring in the depreciation of the Yen.
2016: HOTEL VALUATION INDEX: ASIA PACIFIC | PAGE 6

In 2014, Hanoi’s hotel market weathered a period of particularly low demand as a result of a significant decline in Chinese visitors arising from political tensions and conflict over Vietnam’s maritime borders. However, in 2015, the market recovered on the back of strong demand from Korea and a partial recovery in demand from China and other European feeder markets. Coupled with negligible supply, the capital city, exhibited a healthy increase in valuation to the effect of 17.2% in USD terms. Hotel values in the Indian heritage city of Jaipur grew by approximately 17% in 2015 over those in the previous year. The slowing pace of new hotel supply entering the market in the past year and strong growth in domestic demand has resulted in RevPAR improvement for the market. Additionally, the introduction of the Jaipur Exhibition and Convention Centre (JECC) is further expected to augment growth in hotel performance for the city. Also worth mentioning is that the big-ticket weddings in hotels, helped drive overall hotel performance when room yields were low during the shoulder months of the year. These trends are expected to continue help improve hotel values for Jaipur over the next 2-3 years.
Osaka, the second-largest metropolitan area in Japan, also saw record numbers of visitor arrivals, pushing marketwide occupancies by over 10% from 2013 levels. Average rate during this period (2013 to 2015) saw a staggering 35% increase in Yen terms and a 10% in USD terms. Mirroring the trend in Tokyo, transactions picked up momentum in Osaka as well. As per the HVI, Osaka exhibited an approximate 33% increase in valuation in local currency and 16% in USD terms. After witnessing a supply increase of approximately 4.5 times its base since 2007, Pune can easily be coined the ‘come-back’ city of India. After going through a cycle of severe occupancy and rate pressure from 2010 to 2012, hotel values in the city have grown annually by 7% and 14%, respectively in 2014 and 2015 with both years witnessing double-digit growths in room night demand. The city’s five-star hotels boast of some of the best meetings and events venues in western India and have been successful in significantly boosting demand in this segment in the city. Additionally in 2015, ADRs in the four-star and five-star segment also witnessed nominal growth and consequently led to a healthy increase in RevPAR. Hotel values in Pune are forecast to continually improve over the next couple of years with a slowdown in the pace of new supply entering the market alongwith continued robust demand.
2016: HOTEL VALUATION INDEX: ASIA PACIFIC | PAGE 7
Valuation Trends – Top Ten Leading Markets
Valuation Trends – Top Ten Trailing Markets
Dhaka has a very small base of branded hotel rooms; as of 2014, the four-star and five-star categories collectively comprised an approximate inventory of 1,000 rooms. The year 2015 saw the addition of the 304-room Le Meridien whose initial year performance resulted in the marketwide occupancy dropping by approximately 12%. ADR also corrected slightly during this time leading to a RevPAR decline of approximately 15%. Consequently, Dhaka witnessed the sharpest decline in hotel values in 2015 (26%) amongst the cities being covered in this paper. However, given that the city has a low base of hotel rooms historically and the real estate rates and space constraints serve as a high barrier to entry market, hotel values have always steadily grown and this trend is likely to continue in the short term as well. The drop in valuation with the opening of the Le Meridien serves as a case in point to the highly volatile nature of the Dhaka market, which is susceptible to sharp demand-supply imbalances. Future hotel values are expected to see fluctuations in the years ahead as there are several hotel projects either under construction and/or speculated to commission over the next 2-3 years.
Maldives, the island nation, is home to some of the most luxurious resorts in the region. The market’s reliance on feeder markets in Europe proved to be a bane in 2015 with the Eurozone suffering from a downbeat economic environment and uncertainty. Adding to this was the geo-political crisis in Russia and an irresolute position of the Chinese economy, both of which are key source markets for the nation. While most hotels managed to shift focus to buoyant demand from the Indian Subcontinent and the Middle East, the same came at the cost of average rate and a lower average length of stay, pushing RevPAR down by almost 10%. Having managed a healthy increase in valuation in 2014, of about 23%, numbers in 2015 reverted to 2013 levels exhibiting a decline of similar magnitude. Agra is one of India’s most important cities from a Leisure tourism standpoint. The Taj Mahal (located here) receives over eight million visitors annually and consequently the city has historically benefitted from steady Individual and Group Leisure demand. The 165-kilometer-long Yamuna Expressway commenced operations in April 2012 linking Delhi and Agra via a two-hour drive. Since Agra does not have a commercial airport, it would previously take travelers over four hours to reach the city necessitating at least a one-night stop-over. This trend is slowly diminishing over the last two years, with the commissioning of the expressway, resulting in occupancy and rate corrections in the city’s hotels. This in turn has led to hotel values in Agra dropping by approximately 21% in 2015. The city is expected to see the addition of approximately 475 more hotel rooms in 2016, which is likely to result in a further reduction of RevPAR in the market and consequently hotel values as well. Post that, pace of supply increase is expected to ease off and have a positive impact on hotel values over the medium term.
2016: HOTEL VALUATION INDEX: ASIA PACIFIC | PAGE 8
Hotels in Ho Chi Minh City (HCMC), Vietnam’s commercial hub, experienced pressure in 2014 on account of a decline in Chinese visitors to the country. However, unlike Hanoi – the capital city, HCMC could not recover as a result of supply pressure in 2015. With the opening of hotels with large inventory such as the 350-key Le Meridien Saigon, RevPAR remained soft. The HVI estimated a 21% decline in valuation in USD terms for the city during that period. Siem Reap, gateway to the temples of Angkor Archaeological Park and a World Heritage Site, experiences strong seasonality in demand correlating with the country’s climate. Demand peaks during the cool, dry months of December and January while the pronounced heat from March to July as well as the rainy season in September reduces demand. The strong seasonality prevalent in the market limits it ability to achieve high occupancies, thus, they are usually in the 45-50% range. As Siem Reap is a leisure destination with the temples of Angkor the only major attraction, the demand is largely international in nature, which makes the market more susceptible to turbulence in its source markets. In 2014 and 2015, owing to the generally mellow economic sentiments in the neighboring region directly impacting personal discretionary travel spending (at least on branded hotels), most hotels in Siem Reap saw a drop in occupancy as well as average rate resulting in a drop of 20% in hotel value. What is noteworthy is that the decline in USD is similar to the decline in local currency, indicating the domination of the Dollar in the market, which makes the world currency more stable with respect to the local one.
Not accounting for currency fluctuations, 2015 valuations in Kuala Lumpur (KL) and Melbourne remained stable and exhibited marginal growth, respectively. The Malaysian capital, receives one of the highest inbound travelers in the region. The Golden Triangle in the city, bounded by Jalan Imbi, Jalan Sultan Ismail and Jalan Raja Chulan, attracts a healthy mix of business as well as leisure travelers. While the government plans to build world class commercial hubs such as the Tun Razak Exchange to create a vibrant financial district and further improve infrastructure in the city to enable Malaysia become a high-income economy by 2020, political scandals have raised concerns regarding its efficacy. In 2015, demand and supply grew in tandem resulting in marketwide parameters remaining stable. However, during the same period the Malaysian Ringgit depreciated with respect to the USD resulting in a decline of 16.7% in valuation. On the other hand, Victoria’s coastal capital, Melbourne, exhibited a steady growth of 2% in RevPAR in AUD terms. However, growth in AUD, which many regard as a proxy for the health of the Chinese economy, given Australia’s dependence on Chinese manufacturing, remained weak. The moderate growth was overshadowed by AUD|USD dynamics, which transcribed to an approximate 15% de-growth in valuation. In light of weak global cues, transaction activity remained subdued in KL and Melbourne.
2016: HOTEL VALUATION INDEX: ASIA PACIFIC | PAGE 9
Valuation Trends – Top Ten Trailing Markets
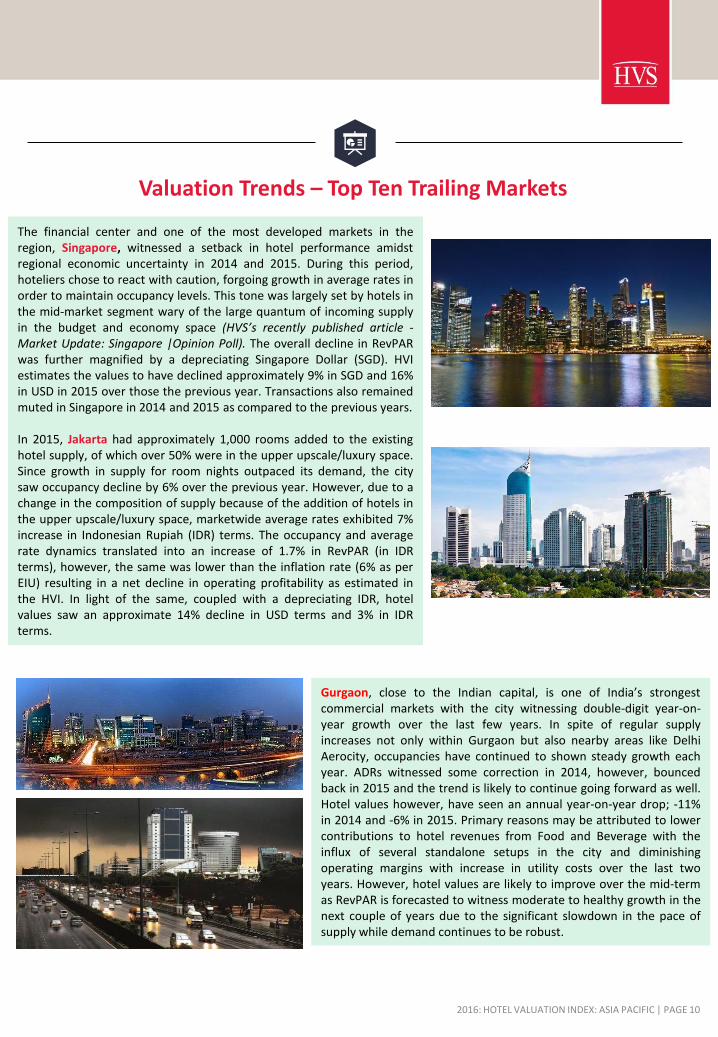
The financial center and one of the most developed markets in the region, Singapore, witnessed a setback in hotel performance amidst regional economic uncertainty in 2014 and 2015. During this period, hoteliers chose to react with caution, forgoing growth in average rates in order to maintain occupancy levels. This tone was largely set by hotels in the mid-market segment wary of the large quantum of incoming supply in the budget and economy space (HVS’s recently published article - Market Update: Singapore |Opinion Poll). The overall decline in RevPAR was further magnified by a depreciating Singapore Dollar (SGD). HVI estimates the values to have declined approximately 9% in SGD and 16% in USD in 2015 over those the previous year. Transactions also remained muted in Singapore in 2014 and 2015 as compared to the previous years. In 2015, Jakarta had approximately 1,000 rooms added to the existing hotel supply, of which over 50% were in the upper upscale/luxury space. Since growth in supply for room nights outpaced its demand, the city saw occupancy decline by 6% over the previous year. However, due to a change in the composition of supply because of the addition of hotels in the upper upscale/luxury space, marketwide average rates exhibited 7% increase in Indonesian Rupiah (IDR) terms. The occupancy and average rate dynamics translated into an increase of 1.7% in RevPAR (in IDR terms), however, the same was lower than the inflation rate (6% as per EIU) resulting in a net decline in operating profitability as estimated in the HVI. In light of the same, coupled with a depreciating IDR, hotel values saw an approximate 14% decline in USD terms and 3% in IDR terms.
Gurgaon, close to the Indian capital, is one of India’s strongest commercial markets with the city witnessing double-digit year-on-year growth over the last few years. In spite of regular supply increases not only within Gurgaon but also nearby areas like Delhi Aerocity, occupancies have continued to shown steady growth each year. ADRs witnessed some correction in 2014, however, bounced back in 2015 and the trend is likely to continue going forward as well. Hotel values however, have seen an annual year-on-year drop; -11% in 2014 and -6% in 2015. Primary reasons may be attributed to lower contributions to hotel revenues from Food and Beverage with the influx of several standalone setups in the city and diminishing operating margins with increase in utility costs over the last two years. However, hotel values are likely to improve over the mid-term as RevPAR is forecasted to witness moderate to healthy growth in the next couple of years due to the significant slowdown in the pace of supply while demand continues to be robust.
2016: HOTEL VALUATION INDEX: ASIA PACIFIC | PAGE 10
Valuation Trends – Top Ten Trailing Markets

Hotel Valuation Index - 2016 FIGURE 4: HOTEL VALUATION INDEX 2016 (USD)
City 2013 2014 2015 2016 2017 2018
Maldives 6.9 8.5 6.6 6.8 6.9 8.1 9.4%
Singapore 4.5 4.3 3.6 3.4 3.4 3.7 4.0%
Tokyo 2.3 2.4 2.9 3.4 3.9 4.5 14.8%
Osaka 1.6 2.0 2.3 2.7 3.0 3.0 6.1%
Langkawi 1.9 2.2 2.3 2.5 2.4 2.5 0.3%
Bali 1.8 2.2 2.0 2.1 2.1 2.2 2.6%
Sydney 2.0 2.0 1.9 2.0 2.0 2.1 2.8%
Melbourne 1.9 1.9 1.6 1.8 1.8 1.9 3.0%
Mumbai 1.5 1.6 1.6 1.9 2.3 2.8 23.2%
Dhaka 1.8 2.0 1.4 1.6 1.4 1.5 -2.3%
Manila 0.8 1.0 1.3 1.4 1.2 1.1 -10.6%
Goa 1.4 1.4 1.3 1.4 1.6 1.7 9.8%
Jakarta 1.3 1.3 1.1 1.1 1.1 1.2 0.5%
Delhi 1.4 1.1 1.1 1.3 1.6 1.8 18.6%
Bangkok 1.0 0.6 1.0 1.2 1.2 1.2 2.3%
Bengaluru 1.0 0.8 1.0 1.2 1.5 1.8 19.8%
Gurgaon 1.3 1.1 1.0 1.2 1.3 1.6 18.9%
Phuket 1.1 0.7 0.9 1.0 1.0 1.0 1.4%
Colombo 1.0 0.8 0.9 1.0 1.2 1.2 8.0%
Kuala Lumpur 1.0 1.1 0.9 0.9 0.9 0.9 -0.3%
Kolkata 1.1 0.9 0.9 0.8 0.8 0.8 -5.4%
Hanoi 0.8 0.7 0.9 0.9 0.9 0.9 -0.6%
Ho Chi Minh City 1.2 1.1 0.8 0.8 0.8 0.9 3.3%
Hyderabad 0.4 0.6 0.8 1.0 1.2 1.4 17.1%
Agra 0.8 0.9 0.7 0.6 0.8 0.9 20.4%
Jaipur 0.6 0.6 0.7 0.8 1.0 1.0 10.5%
Siem Reap 0.8 0.8 0.7 0.7 0.7 0.7 1.5%
Pune 0.5 0.6 0.7 0.8 1.0 1.2 25.6%
Chennai 0.6 0.7 0.6 0.7 0.7 0.9 8.0%
Ahmedabad 0.5 0.6 0.6 0.7 0.8 0.9 12.6%
Phnom Penh 0.7 0.7 0.6 0.6 0.6 0.6 2.7%
NOIDA 1.1 0.6 0.6 0.5 0.4 0.4 -10.7%
Historical Forecast 3 - Year Forecasted
Compounded Growth
(2016 - 2018)
2016: HOTEL VALUATION INDEX: ASIA PACIFIC | PAGE 11
Note •Values presented by index number in 2015, highest to lowest.

Potential vs Returns Grid
Figure 4 captures the entire index (2013-2018) along with the three-year forecasted compounded growth assuming a constant USD|Local Currency relationship. In addition to the index, we have also developed a future potential vs returns grid (Figure 5 –next page). The goal seek was to compare forecasted returns (three-year CAGR) to potential, while accounting for inherent variance, for markets covered in the report. Potential was measured by calculating coefficient of variance, a standardized metric to gauge dispersion from the mean. We have classified the results into the following categories and have highlighted major characteristics for the same.
2016: HOTEL VALUATION INDEX: ASIA PACIFIC | PAGE 12
Parameter Outperformers Value Performers Stable Performers Low Performers
Forecasted Return Range 15-25% 6-14% 2-6% >2%
2018/2015 (value multiple)
1.40 1.20 1.07 0.95
Supply–Side Dynamics Weak Moderate Moderate Strong
Demand–Side Dynamics Strong Strong-Moderate Moderate Moderate
RevPAR Growth Strong Strong-Moderate Moderate Weak
Average Variation High Moderate Low Moderate
Estimated Average Capitalization Rate
8.2% 8.5% 7.8% 9.2%
Key Cities Agra, Bengaluru, Delhi, Gurgaon,
Hyderabad, Mumbai, Pune,
Tokyo
Ahmedabad, Chennai, Colombo, Goa, Jaipur,
Maldives, Osaka
Bali, Bangkok, Ho Chi Minh City,
Melbourne, Phnom Penh, Singapore,
Sydney, Phuket, Siem Reap
Dhaka, Hanoi, Jakarta, Kolkata, Kuala
Lumpur, Langkawi, Manila, NOIDA
Investment Call Strong Buy Buy Hold Sell

2016: HOTEL VALUATION INDEX: ASIA PACIFIC | PAGE 13
FIG
UR
E 5
: PO
TEN
TIA
L V
S R
ETU
RN
S
•No
te
Size
of
the
bu
bb
le r
epre
sen
ts t
he
ave
rag
e in
ven
tory
fro
m 2
01
5 t
o 2
01
8 fo
r a
pa
rtic
ula
r m
ark
et

Concluding Remarks
The HVI has surely brought out mixed results. While some were the ‘Usual Suspects’, few challenged status quo. We saw the revival of Indian hospitality, convincingly strong growth in Japan, cautious optimism in Singapore, Melbourne, Sydney and Bangkok and downward momentum in Kuala Lumpur and Jakarta. The idea of combining 32 markets, with different maturities into one index, was not to pit them against one other, but to bring out individual characteristics and differentiators. In today’s day and age, while each market has its unique dynamics, opportunities and challenges, the effects of global environment cannot be undermined. Hotel assets tend to be complex in nature and HVS supports the various techniques of valuation. However, from an investor’s viewpoint it is absolutely critical to understand the fundamental value of your income generating asset. We conclude with an ubiquitous quote by Oracle of Omaha: “Price is what you pay. Value is what you get.”
2016: HOTEL VALUATION INDEX: ASIA PACIFIC | PAGE 14

HVS Singapore Office | 6 Temasek Boulevard, #23-01A Suntec City Tower Four, Singapore HVS New Delhi Office | 2nd Floor, Paras Downtown Centre, Golf Course Road, Sector 53, Gurgaon, India
HVS.com
About HVS HVS, the world’s leading consulting and services organization focused on the hotel, mixed-use, shared ownership, gaming, and leisure industries, celebrated its 35th anniversary in 2015. Established in 1980, the company performs 4,500+ assignments each year for hotel and real estate owners, operators, and developers worldwide. HVS principals are regarded as the leading experts in their respective regions of the globe. Through a network of more than 35 offices and more than 500 professionals, HVS provides an unparalleled range of complementary services for the hospitality industry. HVS.com
Superior Results through Unrivalled Hospitality
Intelligence. Everywhere. HVS SINGAPORE and HVS NEW DELHI Consulting and Valuations teams comprise highly experienced industry professionals offering the utmost level of expertise and credibility. Our consultants understand the hotel business and have received qualifications from leading hospitality schools across the world, while also possessing actual hotel operating experience. The teams have worked on a broad array of projects that include economic studies, hotel valuations, operator search and management contract negotiations, development strategies for new brands, asset management, research reports and investment advisory for hotels, resorts, serviced residences and branded residential development projects. Both offices are the market leaders in their respective geographies with a wide range of consulting services geared to enhance economic returns and asset value for our clients.
About the Authors Yashaas Rajan, Senior Associate at HVS’ Singapore office, has five years of consulting and valuation experience having covered over 30 markets in eight countries in Asia Pacific. He has managed and executed several engagements including portfolio
valuations, feasibility studies of mixed-use developments and investment and strategic advisory for various stakeholders in the industry. [email protected]
Anirudh Katre, is a Director at HVS’ New Delhi office. With over 16 years of industry experience, he has worked on several feasibility studies, valuations, market area analyses, and investment opportunity assessments for hotels, serviced apartments and
mixed-use developments. He has also been actively involved in several Asset Management and Internal Operations Audit assignments for various hotels. [email protected]
Achin Khanna, is the Managing Director at HVS’ New Delhi office and a Member of the Royal Institution of Chartered Surveyors (MRICS). With over 18 years of experience in the hospitality industry , Achin has directed several large portfolio valuations, feasibility
studies, market area analyses and management contract negotiations in the Asia Pacific region. [email protected]
Hok Yean CHEE is the Managing Partner of HVS Singapore. She has 30 years of experience in more than 30 markets across 19 countries in Asia Pacific, providing real estate investment advisory services for a wide spectrum of property assets. Her forte
lies in providing investment advisory on hotels and serviced apartments including brokerage, strategic analyses, operator search, market feasibility studies, valuations and litigation support. [email protected]
![Gateway Documentation - Currency Service Oracle … Documentation - Currency Service Oracle FLEXCUBE Universal Banking Release FCUBS_12.0.3.0.0 [April] [2014]](https://static.fdocuments.us/doc/165x107/5b0392487f8b9a3c378c6cdb/gateway-documentation-currency-service-oracle-documentation-currency-service.jpg)