
Selamat Sempurna, Tbk Target Price - smsm.co.id · Selamat Sempurna, Tbk Target Price Primary...
13
Page 1 of 13 Contact: Equity & Index Valuation Division Phone: (6221) 7278 2380 [email protected] “Disclaimer statement in the last page is an integral part of this report” www.PEFINDO.com Selamat Sempurna, Tbk Primary Report Equity Valuation December 27, 2013 Target Price Low High 3,500 3,800 Automotive and Components Stock Performance Source: Bloomberg, PEFINDO Equity & Index Valuation Division Stock Information IDR Ticker code SMSM Market price as of December 24, 2013 3,400 Market price – 52 week high 3,900 Market price – 52 week low 2,325 Market cap – 52 week high (bn) 5,615 Market cap – 52 week low (bn) 3,347 Market Value Added & Market Risk Source:PT Selamat Sempurna Tbk, PEFINDO Equity & Index Valuation Division Shareholders (%) PT Adrindo Intiperkasa 58.13 Public (below 5%) 41.87 The Future is Promising Beside the largest filter manufacturer in Indonesia, PT Selamat Sempurna Tbk (SMSM) also manufactures a wide range of other automotive component products including radiators, oil coolers, condensers, brake pipes, fuel pipes, fuel tanks, exhaust systems, press parts, dump bodies, tanks, boxes, trailers, dump hoists, steel slitting equipment, shearing equipment, molding and dies. It started its bright business journey since 1976 and now SMSM exports its products to, and has registered its trademarks in, more than 100 countries worldwide. SMSM has an extensive range of product that involves 5,000 stock keeping units (SKUs). SMSM’s products market is mainly in the after-market. Its flagship brands are Sakura, ADR-Radiator, ADR-Brake Parts, ADR-Dump Hoist, and ADR- Coolant. Being part of respected ADR Group, towards a 40-year of business journey, SMSM now becoming a more integrated automotive components company. Its financial performance has been astonishing with a sound balance sheet condition.
Transcript of Selamat Sempurna, Tbk Target Price - smsm.co.id · Selamat Sempurna, Tbk Target Price Primary...
Page 1 of 13
Contact: Equity & Index Valuation Division Phone: (6221) 7278 2380 [email protected]
“Disclaimer statement in the last page is an
integral part of this report”
www.PEFINDO.com
Selamat Sempurna, Tbk Primary Report
Equity Valuation
December 27, 2013
Target Price
Low High 3,500 3,800
Automotive and Components
Stock Performance
Source: Bloomberg, PEFINDO Equity & Index Valuation Division
Stock Information IDR
Ticker code SMSM
Market price as of December 24, 2013 3,400
Market price – 52 week high 3,900 Market price – 52 week low 2,325 Market cap – 52 week high (bn) 5,615 Market cap – 52 week low (bn) 3,347
Market Value Added & Market Risk
Source:PT Selamat Sempurna Tbk, PEFINDO Equity & Index
Valuation Division
Shareholders (%)
PT Adrindo Intiperkasa 58.13
Public (below 5%) 41.87
The Future is Promising
Beside the largest filter manufacturer in Indonesia, PT Selamat Sempurna
Tbk (SMSM) also manufactures a wide range of other automotive component products including radiators, oil coolers, condensers, brake pipes, fuel pipes, fuel tanks, exhaust systems, press parts, dump bodies, tanks, boxes, trailers, dump hoists, steel slitting equipment, shearing equipment, molding and dies. It started its bright business journey since 1976 and now SMSM exports its products to, and has registered its trademarks in, more than 100 countries worldwide. SMSM has an extensive range of product that involves 5,000 stock keeping units (SKUs). SMSM’s products market is mainly in the after-market. Its flagship brands are Sakura, ADR-Radiator, ADR-Brake Parts, ADR-Dump Hoist, and ADR-Coolant. Being part of respected ADR Group, towards a 40-year of business
journey, SMSM now becoming a more integrated automotive components company. Its financial performance has been astonishing with a sound balance sheet condition.
“Disclaimer statement in the last page
is an integral part of this report”
www.PEFINDO.com
Selamat Sempurna, Tbk
December 27, 2013 Page 2 of 13
Global Auto Sales is Improving, Stable in Domestic
Global economy is projected to build up its momentum to grow gradually. Global auto sales is also back its enthusiasm as in October it booked a 9% up compared to the same period year before. The growth drivers are coming from China (jumped 33%), Japan, and U.S. (grew double digit). Moreover, in November, U.S. car sales volume climbed to record a highest level since February 2007. Meanwhile, as domestic economic growth is estimated to dip below 6% in relation with some major issues like current account deficit, high inflation and the steep rupiah depreciation, the car sales volume is expected to record 1.2 million units and would stay up to next year. The low cost green car (LCGC) program is expected to boost car sales volume, as in November already sold almost 37 thousand units. Investments and Business Integration: Preparing for the Future
Since 2012 SMSM investment activities are likely to increase. The Company invests around IDR237 billion from 2012 to 2013. After acquiring PT Hydraxle Perkasa (HP, a carosserie manufacturer), its affiliate, in 2012, this year SMSM then acquired another affiliates, PT Selamat Sempana Perkasa (SSP, a supplier of rubber compound and other rubber components) and PT Prapat Tunggal Cipta (PTC, SMSM’s sole distributor for local market) to create a more vertically integrated business value chain. Based on pro forma financial report published by its independent auditor, SSP and PTC acquisition contribute about 5% additional at the top line while 8% for the bottom line in for financial performance in 2012. SMSM is also plans to expand to construction market segment in cooperation with Sueyoshi Kogyo Co., Ltd. to produce fuel tank and hydraulic tank for construction segment.
Keeping the Positive Performance We expect SMSM should continue its consecutive revenue growth despite this year growth is particularly coming from inorganic. With the moderate improving of global economy, especially from US and Asian developing countries, we estimate export sales to pick up 8% in 2014. While in domestic market we expect the fervor of LCGC projects should leverage SMSM’s auto parts sales in 2014 despite political temperature is heater. In terms of profitability, we believe SMSM will be able to keep the margins in the favorable level as the Company has been showing its ability to put the margins in the ascending trends for the last several years. As its revenue consitently grew positively and its profit margins are stable, SMSM booked thick ROE of 36% in 2012 and 23% in 9M13. The Company’s gearing ratio is also decreasing
while it cash and equity are climbing up. Business Prospects We are of the view that global economy is in the transition to be a smoother and less volatile period, and each regional economy will support the global growth acceleration. Automotive sector has increased its capex by double digit despite economic uncertainty in this year, with the highest capex increment were to Asia and Latin America regions. This may drive automotive growth in the future. While in the domestic market, despite the upside down in the industry, we believe optimism in Indonesia’s automotive industry is remain intact. Indonesia’s automotive industry also still much smaller than Thailand, the largest automotive industry in the region, which
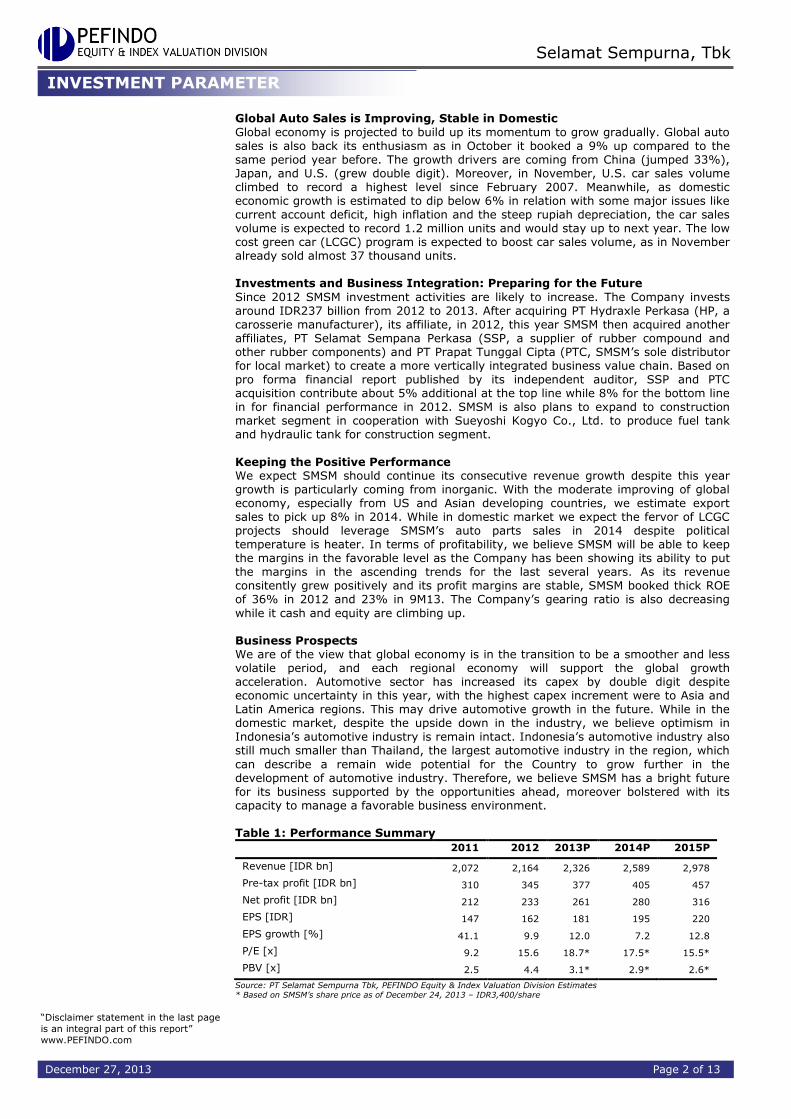
can describe a remain wide potential for the Country to grow further in the development of automotive industry. Therefore, we believe SMSM has a bright future for its business supported by the opportunities ahead, moreover bolstered with its capacity to manage a favorable business environment. Table 1: Performance Summary
2011 2012 2013P 2014P 2015P
Revenue [IDR bn] 2,072 2,164 2,326 2,589 2,978
Pre-tax profit [IDR bn] 310 345 377 405 457
Net profit [IDR bn] 212 233 261 280 316
EPS [IDR] 147 162 181 195 220
EPS growth [%] 41.1 9.9 12.0 7.2 12.8
P/E [x] 9.2 15.6 18.7* 17.5* 15.5*
PBV [x] 2.5 4.4 3.1* 2.9* 2.6*
Source: PT Selamat Sempurna Tbk, PEFINDO Equity & Index Valuation Division Estimates * Based on SMSM’s share price as of December 24, 2013 – IDR3,400/share
INVESTMENT PARAMETER
“Disclaimer statement in the last page
is an integral part of this report”
www.PEFINDO.com
Selamat Sempurna, Tbk
December 27, 2013 Page 3 of 13
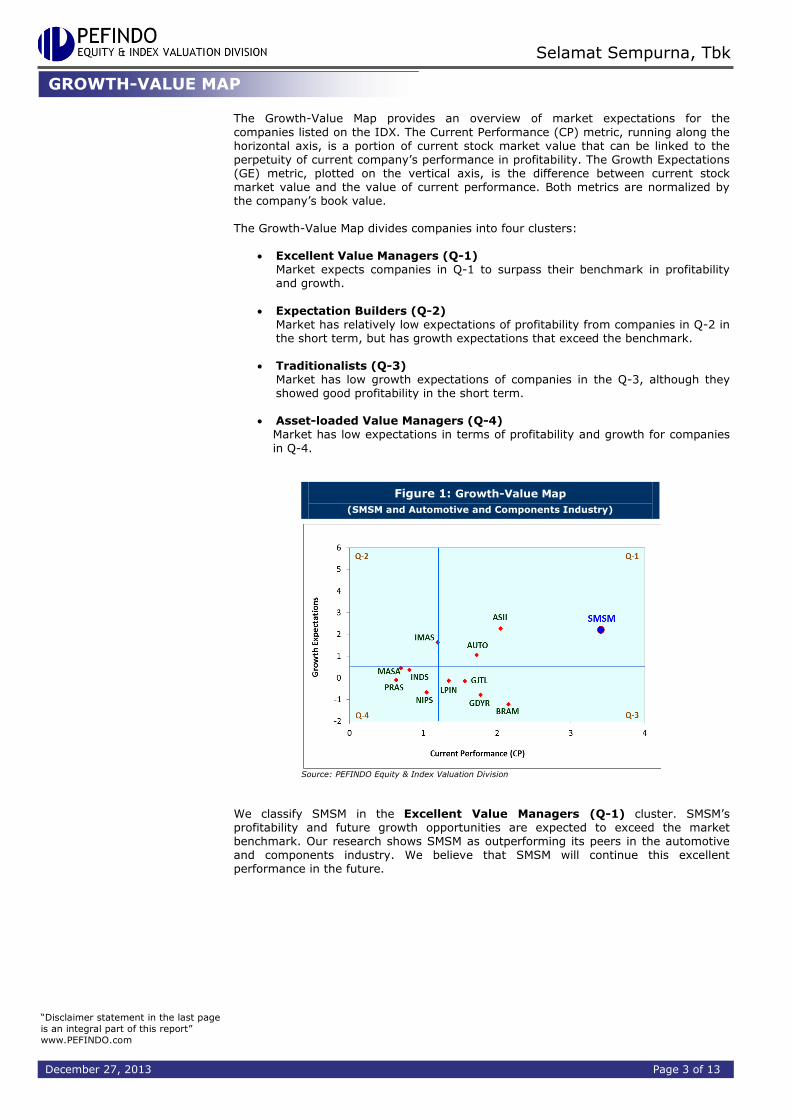
The Growth-Value Map provides an overview of market expectations for the
companies listed on the IDX. The Current Performance (CP) metric, running along the horizontal axis, is a portion of current stock market value that can be linked to the perpetuity of current company’s performance in profitability. The Growth Expectations (GE) metric, plotted on the vertical axis, is the difference between current stock market value and the value of current performance. Both metrics are normalized by the company’s book value. The Growth-Value Map divides companies into four clusters:
Excellent Value Managers (Q-1) Market expects companies in Q-1 to surpass their benchmark in profitability and growth.
Expectation Builders (Q-2)
Market has relatively low expectations of profitability from companies in Q-2 in the short term, but has growth expectations that exceed the benchmark.
Traditionalists (Q-3) Market has low growth expectations of companies in the Q-3, although they showed good profitability in the short term.
Asset-loaded Value Managers (Q-4)
Market has low expectations in terms of profitability and growth for companies
in Q-4.
Figure 1: Growth-Value Map
(SMSM and Automotive and Components Industry)
Source: PEFINDO Equity & Index Valuation Division
We classify SMSM in the Excellent Value Managers (Q-1) cluster. SMSM’s profitability and future growth opportunities are expected to exceed the market benchmark. Our research shows SMSM as outperforming its peers in the automotive and components industry. We believe that SMSM will continue this excellent performance in the future.
GROWTH-VALUE MAP
“Disclaimer statement in the last page
is an integral part of this report”
www.PEFINDO.com
Selamat Sempurna, Tbk
December 27, 2013 Page 4 of 13
Business Profile
PT Selamat Sempurna started its bright business journey since 1976 and now known as the largest filter manufacturer in Indonesia as well as a reputable manufacturer of other automotive components. One of the Company’s business foundation is when it acquired PT Chandra Automotive Products (ACAP), a well-known automotive components manufacturer, in 1995, which then merged to the Company in 2006. In 1995, SMSM also developed a joint venture company with Donaldson Company Inc. (USA) called PT Panata Jaya Mandiri (a filter manufacturer) SMSM has an extensive range of product that involves 5,000 stock keeping units (SKUs). SMSM’s products market is mainly in the after-market. The company’s products are exported to and registered in more than 100 countries worldwide that include Asia, America, Europe, and Australia. Its flagship brands are Sakura, ADR-
Radiator, ADR-Brake Parts, ADR-Dump Hoist, and ADR-Coolant. As part of its strategy and to strengthen its position in the original equipment manufacturers (OEM) market, SMSM in cooperation with Tokyo Radiator MFG. Co., Ltd. (Japan) has developed PT Tokyo Radiator Selamat Sempurna (TRSS). TRSS is a radiator and intercooler manufacturer and its production facilities has been operated since July 2013. SMSM also has an ownership in POSCO IJPC, a steel processing company, a joint venture with POSCO and DAEWOO from Korea.
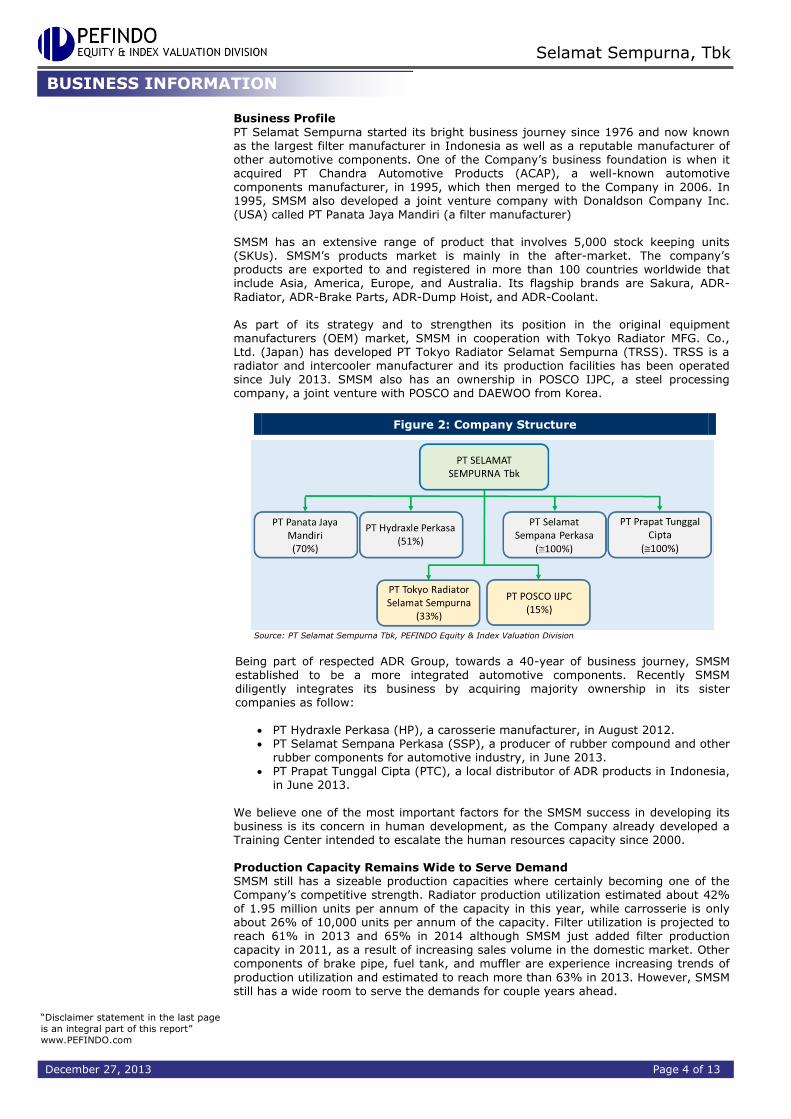
Figure 2: Company Structure
Source: PT Selamat Sempurna Tbk, PEFINDO Equity & Index Valuation Division
Being part of respected ADR Group, towards a 40-year of business journey, SMSM established to be a more integrated automotive components. Recently SMSM diligently integrates its business by acquiring majority ownership in its sister companies as follow:
PT Hydraxle Perkasa (HP), a carosserie manufacturer, in August 2012. PT Selamat Sempana Perkasa (SSP), a producer of rubber compound and other
rubber components for automotive industry, in June 2013. PT Prapat Tunggal Cipta (PTC), a local distributor of ADR products in Indonesia,
in June 2013.
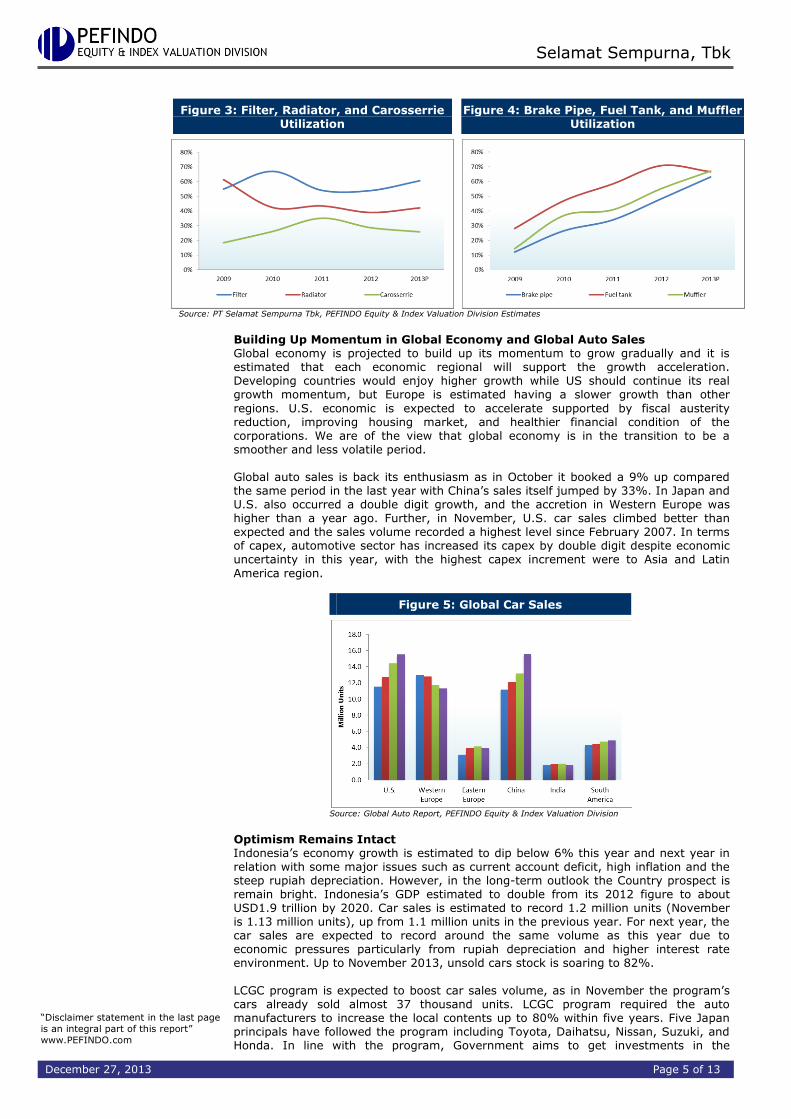
We believe one of the most important factors for the SMSM success in developing its business is its concern in human development, as the Company already developed a Training Center intended to escalate the human resources capacity since 2000. Production Capacity Remains Wide to Serve Demand SMSM still has a sizeable production capacities where certainly becoming one of the Company’s competitive strength. Radiator production utilization estimated about 42% of 1.95 million units per annum of the capacity in this year, while carrosserie is only about 26% of 10,000 units per annum of the capacity. Filter utilization is projected to reach 61% in 2013 and 65% in 2014 although SMSM just added filter production capacity in 2011, as a result of increasing sales volume in the domestic market. Other components of brake pipe, fuel tank, and muffler are experience increasing trends of
production utilization and estimated to reach more than 63% in 2013. However, SMSM still has a wide room to serve the demands for couple years ahead.
BUSINESS INFORMATION
“Disclaimer statement in the last page
is an integral part of this report”
www.PEFINDO.com
Selamat Sempurna, Tbk
December 27, 2013 Page 5 of 13
Figure 3: Filter, Radiator, and Carosserrie Utilization
Figure 4: Brake Pipe, Fuel Tank, and Muffler
Utilization
Source: PT Selamat Sempurna Tbk, PEFINDO Equity & Index Valuation Division Estimates
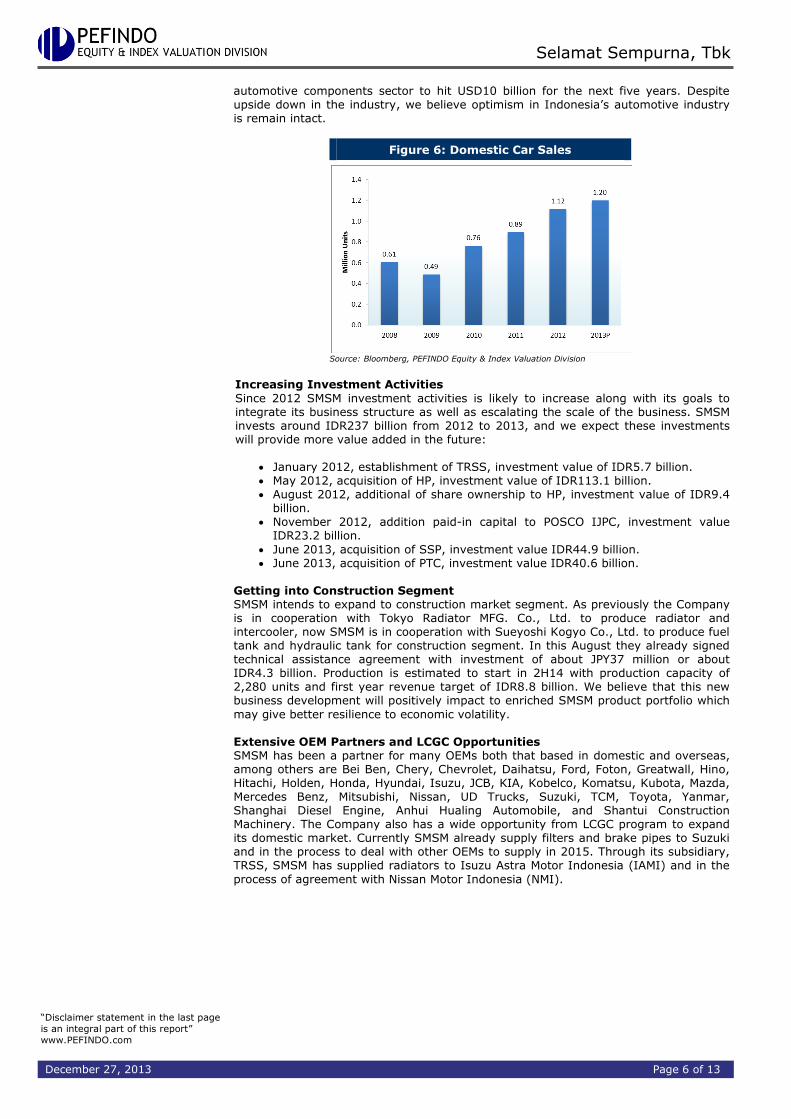
Building Up Momentum in Global Economy and Global Auto Sales Global economy is projected to build up its momentum to grow gradually and it is estimated that each economic regional will support the growth acceleration. Developing countries would enjoy higher growth while US should continue its real growth momentum, but Europe is estimated having a slower growth than other
regions. U.S. economic is expected to accelerate supported by fiscal austerity reduction, improving housing market, and healthier financial condition of the corporations. We are of the view that global economy is in the transition to be a smoother and less volatile period. Global auto sales is back its enthusiasm as in October it booked a 9% up compared the same period in the last year with China’s sales itself jumped by 33%. In Japan and U.S. also occurred a double digit growth, and the accretion in Western Europe was higher than a year ago. Further, in November, U.S. car sales climbed better than expected and the sales volume recorded a highest level since February 2007. In terms of capex, automotive sector has increased its capex by double digit despite economic uncertainty in this year, with the highest capex increment were to Asia and Latin
America region.
Figure 5: Global Car Sales
Source: Global Auto Report, PEFINDO Equity & Index Valuation Division
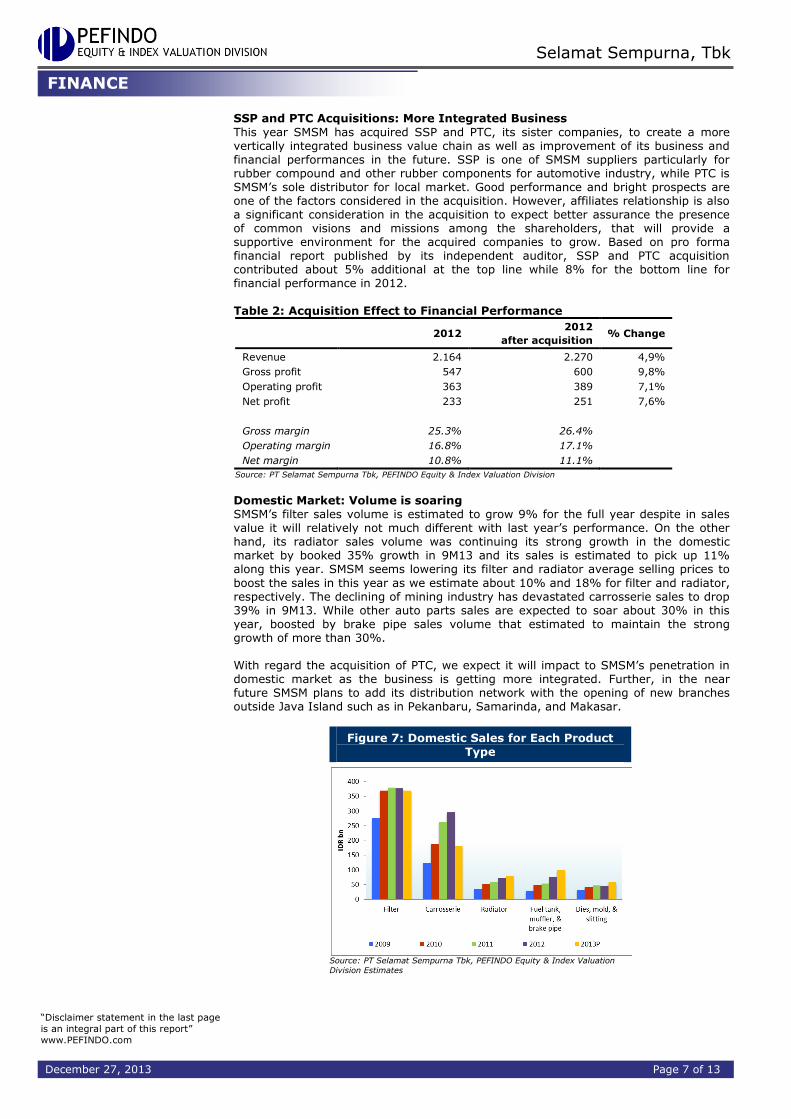
Optimism Remains Intact Indonesia’s economy growth is estimated to dip below 6% this year and next year in relation with some major issues such as current account deficit, high inflation and the steep rupiah depreciation. However, in the long-term outlook the Country prospect is remain bright. Indonesia’s GDP estimated to double from its 2012 figure to about USD1.9 trillion by 2020. Car sales is estimated to record 1.2 million units (November is 1.13 million units), up from 1.1 million units in the previous year. For next year, the car sales are expected to record around the same volume as this year due to economic pressures particularly from rupiah depreciation and higher interest rate environment. Up to November 2013, unsold cars stock is soaring to 82%.
LCGC program is expected to boost car sales volume, as in November the program’s cars already sold almost 37 thousand units. LCGC program required the auto manufacturers to increase the local contents up to 80% within five years. Five Japan principals have followed the program including Toyota, Daihatsu, Nissan, Suzuki, and Honda. In line with the program, Government aims to get investments in the
“Disclaimer statement in the last page
is an integral part of this report”
www.PEFINDO.com
Selamat Sempurna, Tbk
December 27, 2013 Page 6 of 13
automotive components sector to hit USD10 billion for the next five years. Despite upside down in the industry, we believe optimism in Indonesia’s automotive industry is remain intact.
Figure 6: Domestic Car Sales
Source: Bloomberg, PEFINDO Equity & Index Valuation Division
Increasing Investment Activities
Since 2012 SMSM investment activities is likely to increase along with its goals to integrate its business structure as well as escalating the scale of the business. SMSM invests around IDR237 billion from 2012 to 2013, and we expect these investments will provide more value added in the future:
January 2012, establishment of TRSS, investment value of IDR5.7 billion. May 2012, acquisition of HP, investment value of IDR113.1 billion. August 2012, additional of share ownership to HP, investment value of IDR9.4
billion. November 2012, addition paid-in capital to POSCO IJPC, investment value
IDR23.2 billion.
June 2013, acquisition of SSP, investment value IDR44.9 billion. June 2013, acquisition of PTC, investment value IDR40.6 billion.
Getting into Construction Segment SMSM intends to expand to construction market segment. As previously the Company is in cooperation with Tokyo Radiator MFG. Co., Ltd. to produce radiator and intercooler, now SMSM is in cooperation with Sueyoshi Kogyo Co., Ltd. to produce fuel tank and hydraulic tank for construction segment. In this August they already signed technical assistance agreement with investment of about JPY37 million or about IDR4.3 billion. Production is estimated to start in 2H14 with production capacity of 2,280 units and first year revenue target of IDR8.8 billion. We believe that this new business development will positively impact to enriched SMSM product portfolio which
may give better resilience to economic volatility. Extensive OEM Partners and LCGC Opportunities SMSM has been a partner for many OEMs both that based in domestic and overseas, among others are Bei Ben, Chery, Chevrolet, Daihatsu, Ford, Foton, Greatwall, Hino, Hitachi, Holden, Honda, Hyundai, Isuzu, JCB, KIA, Kobelco, Komatsu, Kubota, Mazda, Mercedes Benz, Mitsubishi, Nissan, UD Trucks, Suzuki, TCM, Toyota, Yanmar, Shanghai Diesel Engine, Anhui Hualing Automobile, and Shantui Construction Machinery. The Company also has a wide opportunity from LCGC program to expand its domestic market. Currently SMSM already supply filters and brake pipes to Suzuki and in the process to deal with other OEMs to supply in 2015. Through its subsidiary, TRSS, SMSM has supplied radiators to Isuzu Astra Motor Indonesia (IAMI) and in the
process of agreement with Nissan Motor Indonesia (NMI).
“Disclaimer statement in the last page
is an integral part of this report”
www.PEFINDO.com
Selamat Sempurna, Tbk
December 27, 2013 Page 7 of 13
SSP and PTC Acquisitions: More Integrated Business
This year SMSM has acquired SSP and PTC, its sister companies, to create a more vertically integrated business value chain as well as improvement of its business and financial performances in the future. SSP is one of SMSM suppliers particularly for rubber compound and other rubber components for automotive industry, while PTC is SMSM’s sole distributor for local market. Good performance and bright prospects are one of the factors considered in the acquisition. However, affiliates relationship is also a significant consideration in the acquisition to expect better assurance the presence of common visions and missions among the shareholders, that will provide a supportive environment for the acquired companies to grow. Based on pro forma financial report published by its independent auditor, SSP and PTC acquisition contributed about 5% additional at the top line while 8% for the bottom line for financial performance in 2012.
Table 2: Acquisition Effect to Financial Performance
2012 2012
after acquisition % Change
Revenue 2.164 2.270 4,9%
Gross profit 547 600 9,8%
Operating profit 363 389 7,1%
Net profit 233 251 7,6%
Gross margin 25.3% 26.4%
Operating margin 16.8% 17.1%
Net margin 10.8% 11.1%
Source: PT Selamat Sempurna Tbk, PEFINDO Equity & Index Valuation Division
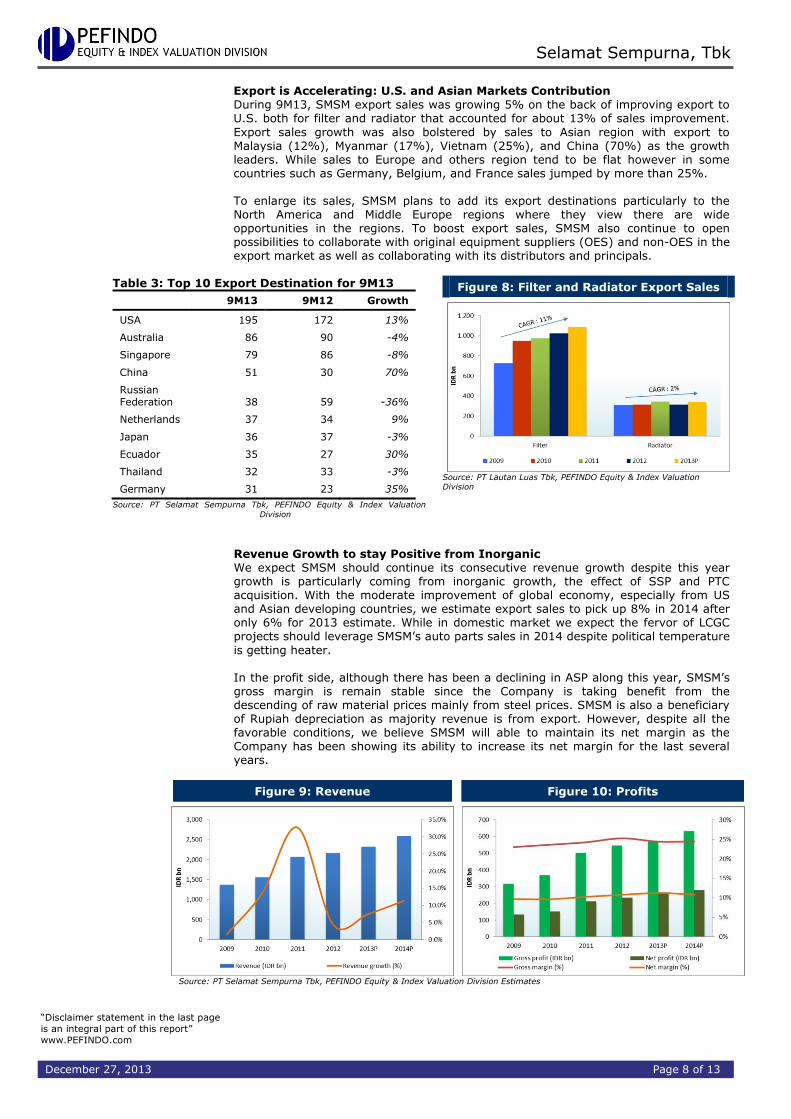
Domestic Market: Volume is soaring SMSM’s filter sales volume is estimated to grow 9% for the full year despite in sales value it will relatively not much different with last year’s performance. On the other hand, its radiator sales volume was continuing its strong growth in the domestic market by booked 35% growth in 9M13 and its sales is estimated to pick up 11% along this year. SMSM seems lowering its filter and radiator average selling prices to
boost the sales in this year as we estimate about 10% and 18% for filter and radiator, respectively. The declining of mining industry has devastated carrosserie sales to drop 39% in 9M13. While other auto parts sales are expected to soar about 30% in this year, boosted by brake pipe sales volume that estimated to maintain the strong growth of more than 30%. With regard the acquisition of PTC, we expect it will impact to SMSM’s penetration in domestic market as the business is getting more integrated. Further, in the near future SMSM plans to add its distribution network with the opening of new branches outside Java Island such as in Pekanbaru, Samarinda, and Makasar.
Figure 7: Domestic Sales for Each Product
Type
Source: PT Selamat Sempurna Tbk, PEFINDO Equity & Index Valuation
Division Estimates
FINANCE
“Disclaimer statement in the last page
is an integral part of this report”
www.PEFINDO.com
Selamat Sempurna, Tbk
December 27, 2013 Page 8 of 13
Export is Accelerating: U.S. and Asian Markets Contribution During 9M13, SMSM export sales was growing 5% on the back of improving export to U.S. both for filter and radiator that accounted for about 13% of sales improvement.
Export sales growth was also bolstered by sales to Asian region with export to Malaysia (12%), Myanmar (17%), Vietnam (25%), and China (70%) as the growth leaders. While sales to Europe and others region tend to be flat however in some countries such as Germany, Belgium, and France sales jumped by more than 25%. To enlarge its sales, SMSM plans to add its export destinations particularly to the North America and Middle Europe regions where they view there are wide opportunities in the regions. To boost export sales, SMSM also continue to open possibilities to collaborate with original equipment suppliers (OES) and non-OES in the export market as well as collaborating with its distributors and principals.
Table 3: Top 10 Export Destination for 9M13
9M13 9M12 Growth
USA 195 172 13%
Australia 86 90 -4%
Singapore 79 86 -8%
China 51 30 70%
Russian Federation 38 59 -36%
Netherlands 37 34 9%
Japan 36 37 -3%
Ecuador 35 27 30%
Thailand 32 33 -3%
Germany 31 23 35%
Source: PT Selamat Sempurna Tbk, PEFINDO Equity & Index Valuation
Division
Figure 8: Filter and Radiator Export Sales
Source: PT Lautan Luas Tbk, PEFINDO Equity & Index Valuation Division
Revenue Growth to stay Positive from Inorganic We expect SMSM should continue its consecutive revenue growth despite this year growth is particularly coming from inorganic growth, the effect of SSP and PTC acquisition. With the moderate improvement of global economy, especially from US and Asian developing countries, we estimate export sales to pick up 8% in 2014 after only 6% for 2013 estimate. While in domestic market we expect the fervor of LCGC projects should leverage SMSM’s auto parts sales in 2014 despite political temperature
is getting heater. In the profit side, although there has been a declining in ASP along this year, SMSM’s gross margin is remain stable since the Company is taking benefit from the descending of raw material prices mainly from steel prices. SMSM is also a beneficiary of Rupiah depreciation as majority revenue is from export. However, despite all the favorable conditions, we believe SMSM will able to maintain its net margin as the Company has been showing its ability to increase its net margin for the last several years.
Figure 9: Revenue Figure 10: Profits
Source: PT Selamat Sempurna Tbk, PEFINDO Equity & Index Valuation Division Estimates
“Disclaimer statement in the last page
is an integral part of this report”
www.PEFINDO.com
Selamat Sempurna, Tbk
December 27, 2013 Page 9 of 13
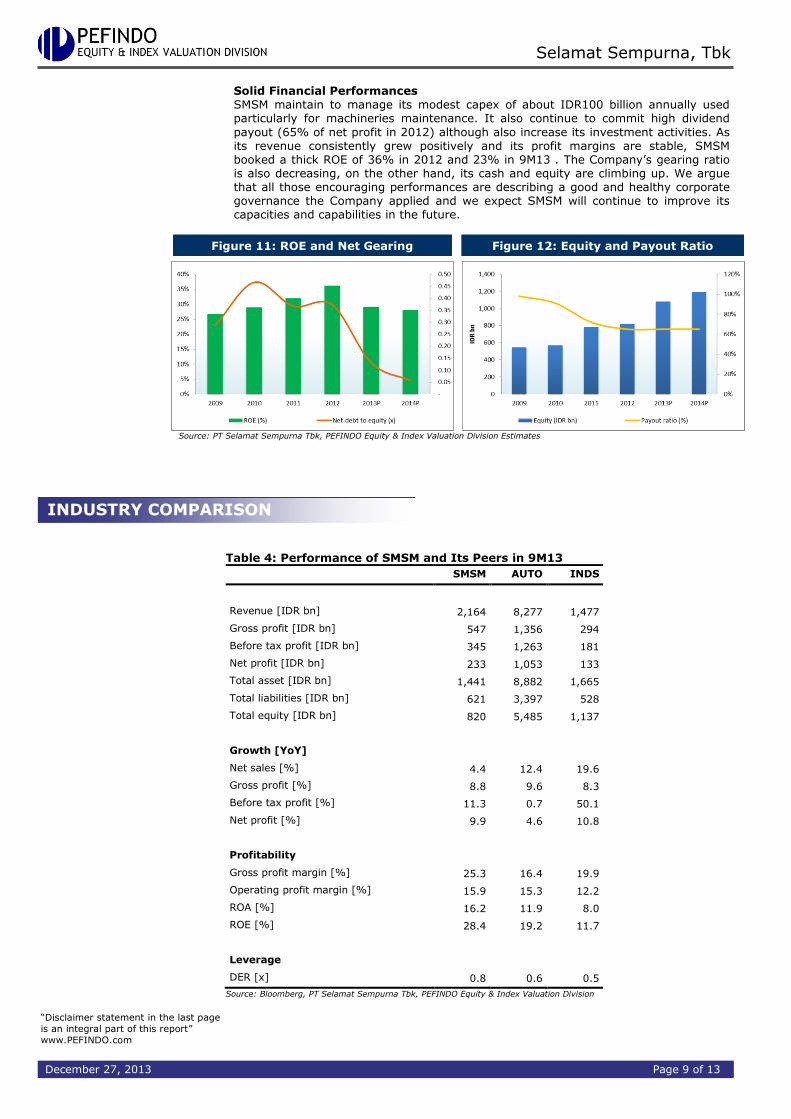
Solid Financial Performances SMSM maintain to manage its modest capex of about IDR100 billion annually used particularly for machineries maintenance. It also continue to commit high dividend
payout (65% of net profit in 2012) although also increase its investment activities. As its revenue consistently grew positively and its profit margins are stable, SMSM booked a thick ROE of 36% in 2012 and 23% in 9M13 . The Company’s gearing ratio is also decreasing, on the other hand, its cash and equity are climbing up. We argue that all those encouraging performances are describing a good and healthy corporate governance the Company applied and we expect SMSM will continue to improve its capacities and capabilities in the future.
Figure 11: ROE and Net Gearing Figure 12: Equity and Payout Ratio
Source: PT Selamat Sempurna Tbk, PEFINDO Equity & Index Valuation Division Estimates
Table 4: Performance of SMSM and Its Peers in 9M13
SMSM AUTO INDS
Revenue [IDR bn] 2,164 8,277 1,477
Gross profit [IDR bn] 547 1,356 294
Before tax profit [IDR bn] 345 1,263 181
Net profit [IDR bn] 233 1,053 133
Total asset [IDR bn] 1,441 8,882 1,665
Total liabilities [IDR bn] 621 3,397 528
Total equity [IDR bn] 820 5,485 1,137
Growth [YoY]
Net sales [%] 4.4 12.4 19.6
Gross profit [%] 8.8 9.6 8.3
Before tax profit [%] 11.3 0.7 50.1
Net profit [%] 9.9 4.6 10.8
Profitability
Gross profit margin [%] 25.3 16.4 19.9
Operating profit margin [%] 15.9 15.3 12.2
ROA [%] 16.2 11.9 8.0
ROE [%] 28.4 19.2 11.7
Leverage
DER [x] 0.8 0.6 0.5
Source: Bloomberg, PT Selamat Sempurna Tbk, PEFINDO Equity & Index Valuation Division
INDUSTRY COMPARISON
“Disclaimer statement in the last page
is an integral part of this report”
www.PEFINDO.com
Selamat Sempurna, Tbk
December 27, 2013 Page 10 of 13
VALUATION
Methodology
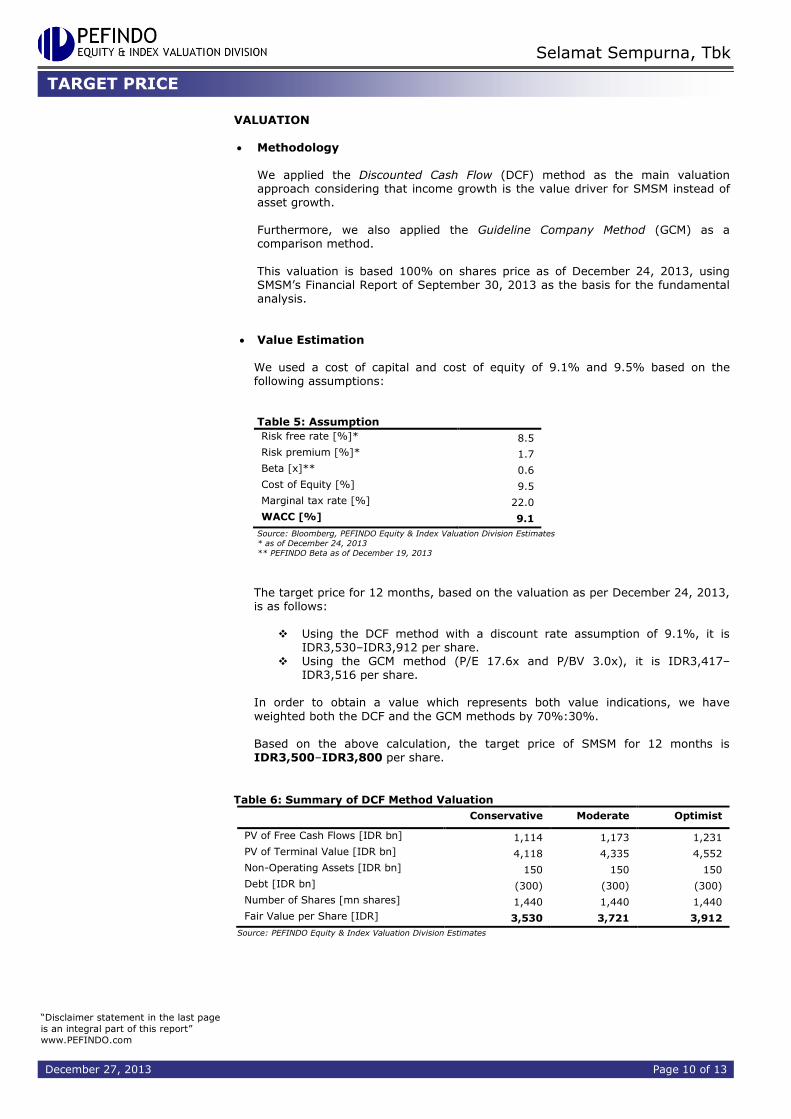
We applied the Discounted Cash Flow (DCF) method as the main valuation approach considering that income growth is the value driver for SMSM instead of asset growth. Furthermore, we also applied the Guideline Company Method (GCM) as a comparison method.
This valuation is based 100% on shares price as of December 24, 2013, using SMSM’s Financial Report of September 30, 2013 as the basis for the fundamental analysis.
Value Estimation
We used a cost of capital and cost of equity of 9.1% and 9.5% based on the following assumptions: Table 5: Assumption
Risk free rate [%]* 8.5
Risk premium [%]* 1.7
Beta [x]** 0.6
Cost of Equity [%] 9.5
Marginal tax rate [%] 22.0
WACC [%] 9.1
Source: Bloomberg, PEFINDO Equity & Index Valuation Division Estimates
* as of December 24, 2013
** PEFINDO Beta as of December 19, 2013
The target price for 12 months, based on the valuation as per December 24, 2013, is as follows:
Using the DCF method with a discount rate assumption of 9.1%, it is IDR3,530–IDR3,912 per share.
Using the GCM method (P/E 17.6x and P/BV 3.0x), it is IDR3,417–IDR3,516 per share.
In order to obtain a value which represents both value indications, we have
weighted both the DCF and the GCM methods by 70%:30%. Based on the above calculation, the target price of SMSM for 12 months is IDR3,500–IDR3,800 per share.
Table 6: Summary of DCF Method Valuation
Conservative Moderate Optimist
PV of Free Cash Flows [IDR bn] 1,114 1,173 1,231
PV of Terminal Value [IDR bn] 4,118 4,335 4,552
Non-Operating Assets [IDR bn] 150 150 150
Debt [IDR bn] (300) (300) (300)
Number of Shares [mn shares] 1,440 1,440 1,440
Fair Value per Share [IDR] 3,530 3,721 3,912
Source: PEFINDO Equity & Index Valuation Division Estimates
TARGET PRICE
“Disclaimer statement in the last page
is an integral part of this report”
www.PEFINDO.com
Selamat Sempurna, Tbk
December 27, 2013 Page 11 of 13
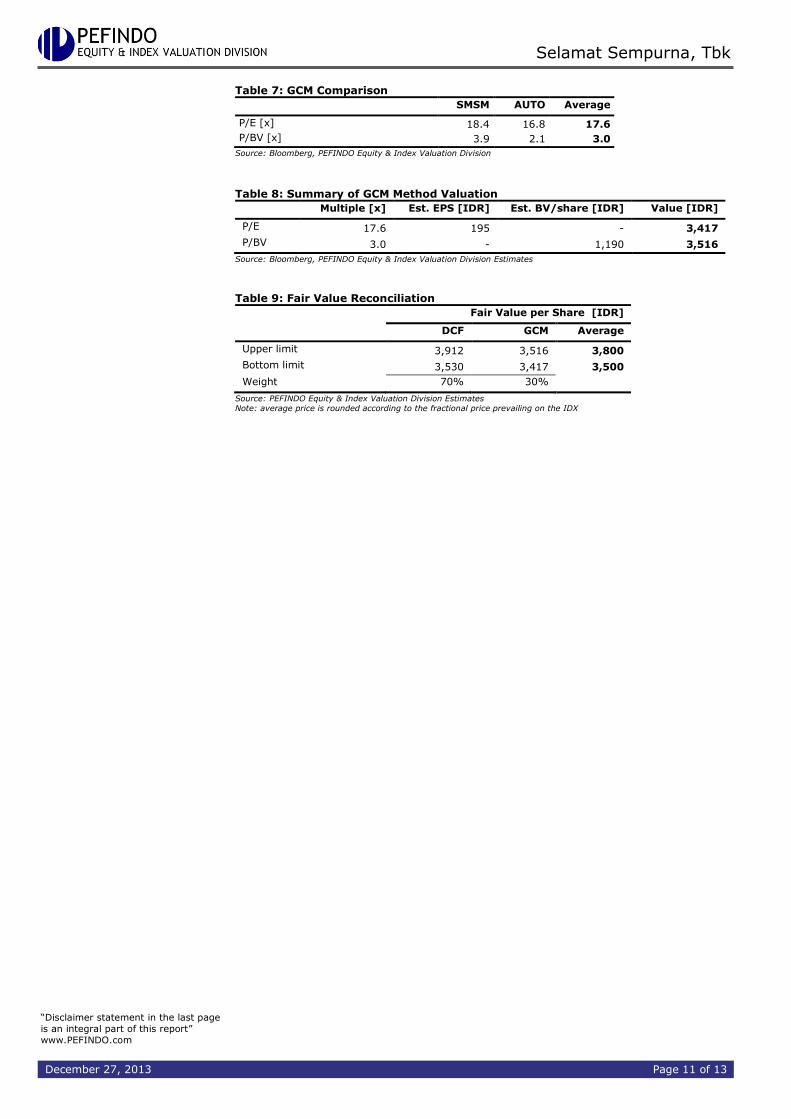
Table 7: GCM Comparison
SMSM AUTO Average
P/E [x] 18.4 16.8 17.6
P/BV [x] 3.9 2.1 3.0
Source: Bloomberg, PEFINDO Equity & Index Valuation Division
Table 8: Summary of GCM Method Valuation Multiple [x] Est. EPS [IDR] Est. BV/share [IDR] Value [IDR]
P/E 17.6 195 - 3,417
P/BV 3.0 - 1,190 3,516
Source: Bloomberg, PEFINDO Equity & Index Valuation Division Estimates
Table 9: Fair Value Reconciliation
Fair Value per Share [IDR]
DCF GCM Average
Upper limit 3,912 3,516 3,800
Bottom limit 3,530 3,417 3,500
Weight 70% 30%
Source: PEFINDO Equity & Index Valuation Division Estimates
Note: average price is rounded according to the fractional price prevailing on the IDX
“Disclaimer statement in the last page
is an integral part of this report”
www.PEFINDO.com
Selamat Sempurna, Tbk
December 27, 2013 Page 12 of 13
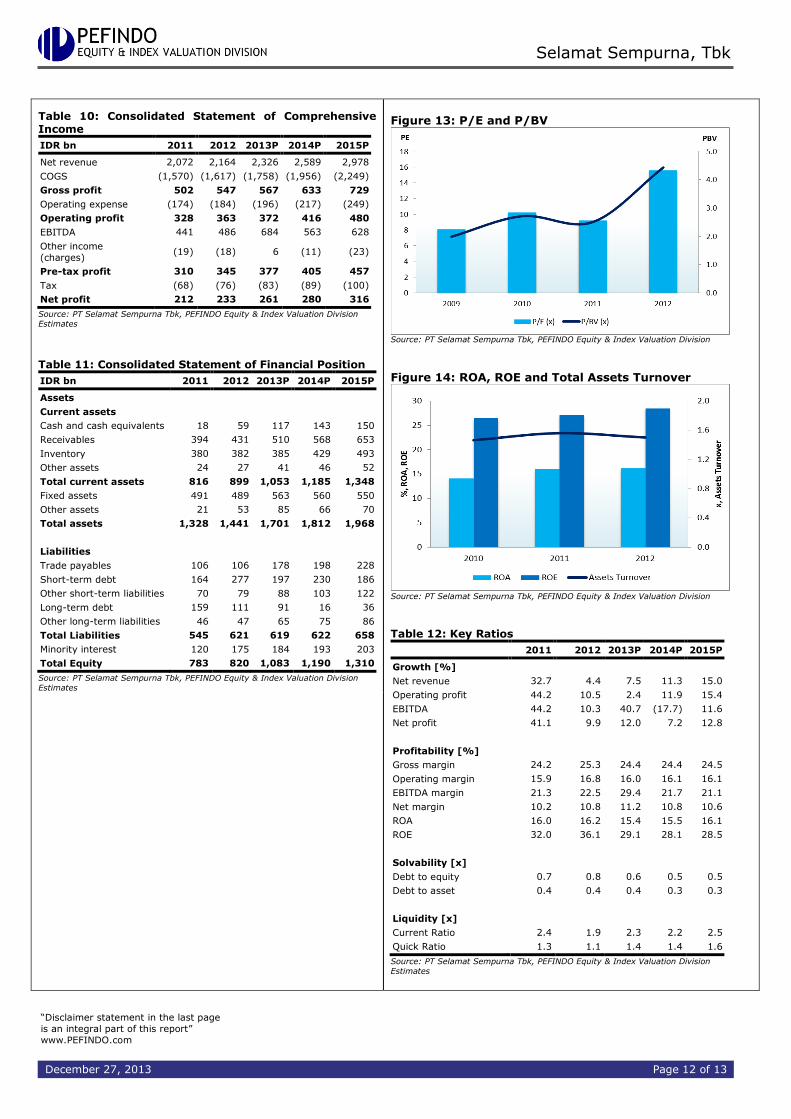
Table 10: Consolidated Statement of Comprehensive Income
IDR bn 2011 2012 2013P 2014P 2015P
Net revenue 2,072 2,164 2,326 2,589 2,978
COGS (1,570) (1,617) (1,758) (1,956) (2,249)
Gross profit 502 547 567 633 729
Operating expense (174) (184) (196) (217) (249)
Operating profit 328 363 372 416 480
EBITDA 441 486 684 563 628
Other income
(charges) (19) (18) 6 (11) (23)
Pre-tax profit 310 345 377 405 457
Tax (68) (76) (83) (89) (100)
Net profit 212 233 261 280 316
Source: PT Selamat Sempurna Tbk, PEFINDO Equity & Index Valuation Division
Estimates Table 11: Consolidated Statement of Financial Position
IDR bn 2011 2012 2013P 2014P 2015P
Assets
Current assets
Cash and cash equivalents 18 59 117 143 150
Receivables 394 431 510 568 653
Inventory 380 382 385 429 493
Other assets 24 27 41 46 52
Total current assets 816 899 1,053 1,185 1,348
Fixed assets 491 489 563 560 550
Other assets 21 53 85 66 70
Total assets 1,328 1,441 1,701 1,812 1,968
Liabilities
Trade payables 106 106 178 198 228
Short-term debt 164 277 197 230 186
Other short-term liabilities 70 79 88 103 122
Long-term debt 159 111 91 16 36
Other long-term liabilities 46 47 65 75 86
Total Liabilities 545 621 619 622 658
Minority interest 120 175 184 193 203
Total Equity 783 820 1,083 1,190 1,310
Source: PT Selamat Sempurna Tbk, PEFINDO Equity & Index Valuation Division
Estimates
Figure 13: P/E and P/BV
Source: PT Selamat Sempurna Tbk, PEFINDO Equity & Index Valuation Division
Figure 14: ROA, ROE and Total Assets Turnover
Source: PT Selamat Sempurna Tbk, PEFINDO Equity & Index Valuation Division
Table 12: Key Ratios
2011 2012 2013P 2014P 2015P
Growth [%]
Net revenue 32.7 4.4 7.5 11.3 15.0
Operating profit 44.2 10.5 2.4 11.9 15.4
EBITDA 44.2 10.3 40.7 (17.7) 11.6
Net profit 41.1 9.9 12.0 7.2 12.8
Profitability [%]
Gross margin 24.2 25.3 24.4 24.4 24.5
Operating margin 15.9 16.8 16.0 16.1 16.1
EBITDA margin 21.3 22.5 29.4 21.7 21.1
Net margin 10.2 10.8 11.2 10.8 10.6
ROA 16.0 16.2 15.4 15.5 16.1
ROE 32.0 36.1 29.1 28.1 28.5
Solvability [x]
Debt to equity 0.7 0.8 0.6 0.5 0.5
Debt to asset 0.4 0.4 0.4 0.3 0.3
Liquidity [x]
Current Ratio 2.4 1.9 2.3 2.2 2.5
Quick Ratio 1.3 1.1 1.4 1.4 1.6
Source: PT Selamat Sempurna Tbk, PEFINDO Equity & Index Valuation Division
Estimates
“Disclaimer statement in the last page
is an integral part of this report”
www.PEFINDO.com
Selamat Sempurna, Tbk
December 27, 2013 Page 13 of 13
DISCLAIMER
This report was prepared based on trusted and reliable sources. Nevertheless, we do not guarantee i ts
completeness, accuracy and adequacy. Therefore, we are not responsible for any investment decisions
made based on this report. All assumptions, opinions and predictions were solely our internal judgments
as of the reporting date, and those judgments are subject to change without further notice.
We are not responsible for any mistakes or negligence that occur by using this report. Recent performance
cannot always be used as a reference for future outcome. This report does not offer a recommendation to
purchase or hold particular shares. This report might not be suitable for some investors. All opinions in
this report have been presented fairly as of the issuing date with good intentions; however, they could
change at any time without further notice. The price, value or income of each share of the Company stated
in this report might be lower than investor expectations, and investors may obtain returns lower than the
invested amount. Investment is defined as the probable income that will be received in the f uture;
nonetheless such returns may fluctuate. As for companies whose shares are denominated in a currency
other than Rupiah, foreign exchange fluctuation may reduce their share value, price or the returns for
investors. This report does not contain any information for tax considerations in investment decision-
making.
The share price target in this report is a fundamental value, not a fair market value or a transaction price
reference required by regulations.
The share price target issued by the PEFINDO Equity & Index Valuation Division is not a recommendation
to buy, sell or hold particular shares. It should not be considered as investment advice from the PEFINDO
Equity & Index Valuation Division and its scope of service to some parties, including li sted companies,
financial advisors, brokers, investment banks, financial institutions and intermediaries, does not correlate
with receiving rewards or any other benefits from such parties.
This report is not intended for any particular investor and cannot be used as part of an objective
investment analysis of particular shares, an investment recommendation, or an investment strategy. We
strongly recommend investors to consider the suitability of the situation and conditions before making a
decision in relation with the figures in this report. If necessary, consult with your financial advisor.
PEFINDO keeps the activities of the Equity Valuation Division separate from its Ratings Division to
preserve the independence and objectivity of its analytical processes and products. PEFINDO has
established policies and procedures to maintain the confidentiality of non-public information received in
connection with each analytical process. The entire process, methodology and the database used in the
preparation of the Reference Share Price Target Report as a whole are different from the processes,
methodologies and databases used by PEFINDO in issuing ratings.
This report was prepared and composed by the PEFINDO Equity & Index Valuation Division with the
objective of enhancing the transparency of share prices of listed companies in the Indonesia Stock
Exchange (IDX). This report is also free of influence from any other party, including pressure or force
either from IDX or the listed company reviewed. PEFINDO Equity & Index Valuation Division earns a
reward amounting to IDR20 million from IDX and the reviewed company for issuing this report twice a
year. For further information, please visit our website at http://www.pefindo.com
This report was prepared and composed by the PEFINDO Equity & Index Valuation Division. In Indonesia, this report is published in our website and in the IDX website.


![PT Selamat Sempurna Tbk [SMSM:IJ] 1 Half 2014 Performanceadr-group.com/uploads/attachment/SMSM_Presentation_CIMB_Conference... · PT Selamat Sempurna Tbk [SMSM:IJ] 1 Half 2014 Performance](https://static.fdocuments.us/doc/165x107/5e21709ae7716c521551c568/pt-selamat-sempurna-tbk-smsmij-1-half-2014-performanceadr-groupcomuploadsattachmentsmsmpresentationcimbconference.jpg)