Seizing opportunities 2008 - Homepage - Fresenius · Seizing opportunities Fresenius is a health...
205
Seizing opportunities 2008 ANNUAL REPORT ANNUAL REPORT
Transcript of Seizing opportunities 2008 - Homepage - Fresenius · Seizing opportunities Fresenius is a health...
Seizing opportunities
2008ANNUAL REPORTANNUAL REPORT
Seizing opportunities
Fresenius is a health care group providing products and services
for dialysis, hospitals and the medical care of patients at home.
In addition, Fresenius focuses on hospital operation, as well as
on engineering and services for hospitals and other health care
facilities. About 122,000 employees have dedicated themselves
to the service of health in about 100 countries worldwide.

in million € 2008 2007 2006 2005 2004
Earnings
Sales 12,336 11,358 10,777 7,889 7,271
EBIT 1,7271) 1,609 1,444 969 845
Net income 4501) 410 330 222 168
Depreciation and amortization 783 421 399 320 315
Operating cash flow 1,074 1,296 1,052 780 851
Operating cash flow in % of sales 8.7% 11.4% 9.8% 9.9% 11.7%
Earnings per ordinary share in € 2.851) 2.64 2.15 8) 1.768) 1.368)
Earnings per preference share in € 2.861) 2.65 2.16 8) 1.778) 1.378)
Balance sheet
Total assets 20,544 15,324 15,024 11,594 8,188
Non-current assets 15,466 11,033 10,918 8,063 5,433
Equity2) 6,943 6,059 5,728 5,130 3,347
Equity ratio2) 34% 40% 38% 44% 41%
Investments3) 4,617 1,318 4,314 2,247 421
Profitability
EBIT margin 14.0%1) 14.2% 13.4% 12.3% 11.6%
Return on equity after taxes (ROE) 4) 6) 9) 10.5% 12.0% 10.4% 11.4% 10.5%
Return on operating assets (ROOA) 4) 5) 9) 9.8% 11.4% 10.4% 11.7% 11.1%
Return on invested capital (ROIC) 4) 5) 9) 7.3% 8.4% 7.4% 8.0% 7.4%
Dividend per ordinary share in € 0.70 7) 0.66 0.57 0.498) 0.458)
Dividend per preference share in € 0.717) 0.67 0.58 0.508) 0.468)
Employees (December 31) 122,217 114,181 104,872 91,971 68,494
1) Before special items from the APP acquisition2) Equity including minority interest3) Investments in property, plant and equipment and intangible assets, acquisitions4) 2005: balance sheet adjusted for acquisition of HELIOS Kliniken5) 2006 pro forma Renal Care Group, excluding earnings from the divestiture of US dialysis clinics
as well as their first quarter 2006 earnings6) 2006 pro forma Renal Care Group, excluding first quarter 2006 earnings of divested US dialysis
clinics7) Proposal8) Adjusted for share split in February 20079) 2008 pro forma APP Pharmaceuticals and excluding special items from the acquisition
You will find a 10-year overview on our website: www.fresenius.com / Investor Relations.
FRESENIUS GROUP IN FIGURES
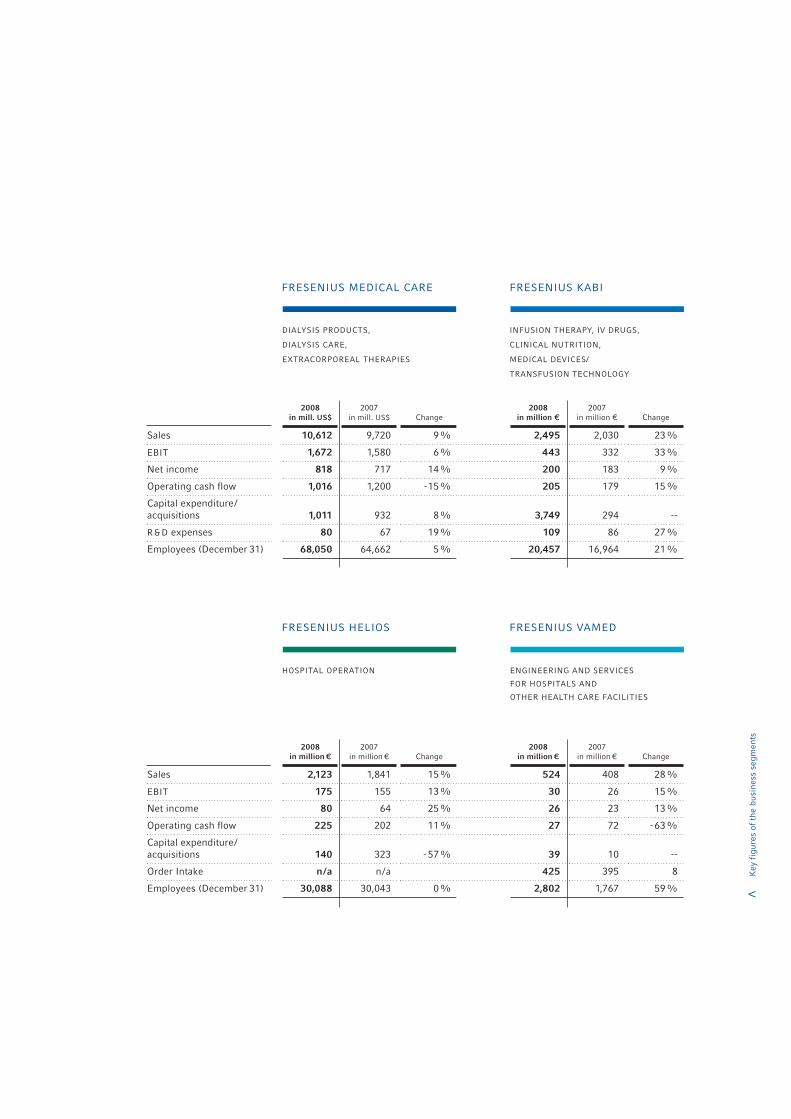
DIALYSIS PRODUCTS,
DIALYSIS CARE,
EXTRACORPOREAL THERAPIES
ENGINEERING AND SERVICES
FOR HOSPITALS AND
OTHER HEALTH CARE FACILITIES
HOSPITAL OPERATION
<
Key
fig
ures
of
the
busi
ness
seg
men
ts
2008
in mill. US$
2007in mill. US$ Change
2008
in million €
2007in million € Change
Sales 10,612 9,720 9% 2,495 2,030 23%
EBIT 1,672 1,580 6% 443 332 33%
Net income 818 717 14% 200 183 9%
Operating cash flow 1,016 1,200 -15% 205 179 15%
Capital expenditure/acquisitions 1,011 932 8% 3,749 294 --
R&D expenses 80 67 19% 109 86 27%
Employees (December 31) 68,050 64,662 5% 20,457 16,964 21%
2008
in million €
2007in million € Change
2008
in million €
2007in million € Change
Sales 2,123 1,841 15% 524 408 28%
EBIT 175 155 13% 30 26 15%
Net income 80 64 25% 26 23 13%
Operating cash flow 225 202 11% 27 72 -63%
Capital expenditure/acquisitions 140 323 -57% 39 10 --
Order Intake n/a n/a 425 395 8
Employees (December 31) 30,088 30,043 0% 2,802 1,767 59%
FRESENIUS MEDICAL CARE
FRESENIUS HELIOS FRESENIUS VAMED
INFUSION THERAPY, IV DRUGS,
CLINICAL NUTRITION,
MEDICAL DEVICES/
TRANSFUSION TECHNOLOGY
FRESENIUS KABI
> for sustainedsuccess In 2008, we tackled new challenges, made
ongoing improvements, and achieved new
record sales and earnings. Going forward,
we will continue to seize opportunities with
enthusiasm and determination, while pur-
suing our long-term strategy of profitable
growth.
To Our Shareholders2
We seized our opportunities in the past year, expanding our business with confidence and determination.
Fresenius Kabi was our main focus. With the acquisition of APP Pharmaceuticals, Fresenius Kabi gained a
leading global position in the field of generic IV drugs. In addition, APP Pharmaceuticals provides Fresenius
Kabi with a North American platform for its product portfolio, offering attractive mid-term growth opportuni-
ties. The APP Pharmaceuticals acquisition is the latest move in a series of significant strategic initiatives –
such as the acquisition of the German hospital operator HELIOS Kliniken in 2005 and the US dialysis provider
Renal Care Group in 2006.
Our other business segments also took full advantage of their business opportunities in 2008. Fresenius
Medical Care continued its growth strategy in renal pharmaceuticals, broadening its product range with the
addition of IV iron formulations. Fresenius Helios was a leading player in the German hospital privatization
process and acquired six new clinics. Fresenius Vamed successfully leveraged its expertise in hospital pro-
jects and services, winning important new contracts.
Opportunities for growth are not only offered by acquisitions. Cutting-edge products and services, uncom-
promising quality, and international expansion help to improve the level of medical care for our patients
around the globe. They also provide significant opportunities for organic growth. We present some of these
opportunities in this annual report.
In addition to our significant strategic steps, we achieved excellent financial results in the past year. Sales
grew to € 12.3 billion, an increase of 13 percent in constant currency. We saw outstanding organic growth
in all our business segments. Net income before special items relating to the acquisition of APP Pharma-
ceuticals also increased by 13 percent in constant currency to € 450 million. Fresenius coped very well with
To Our Shareholders:
To Our S
hareholders

3
the challenging business environment in 2008 and I would like to sincerely thank the Group’s employees
for their achievements, exceptional commitment, and hard work.
We have ambitious targets for 2009. In constant currency, we expect to increase sales by more than
10 percent and net income before special items by approximately 10 percent. At the same time, we aim
to improve our debt ratios, following the substantial investments of 2008.
The financial market crisis and the global economic slowdown make it all the more crucial that we achieve
sustainable entrepreneurial success. In this regard, it is especially important that we integrate our
acquisitions swiftly, generate industry-leading organic growth, and strive for cost and quality leadership.
We will continue on our course, managing Fresenius with a strong focus on operational excellence and
commercial prudence.
Thank you for your continued trust and support.
Dr. Ulf M. Schneider
Chairman of the Management Board
To O
ur S
hare
hold
ers

Content4
26 Business Segments
26 Fresenius Medical Care
32 Fresenius Kabi
38 Fresenius Helios
42 Fresenius Vamed
46 Responsibility, Environment, Sustainability
47 Employees
50 Research and Development
54 Environmental Management
12 To Our Shareholders
6 Seizing Opportunities
6 in new Markets – Fresenius Medical Care
8 for further Growth – Fresenius Kabi
10 for better Health – Fresenius Helios
12 for greater Efficiency – Fresenius Vamed
14 Summary of the Fiscal Year
16 Fresenius Shares and Corporate Governance Report
Seizing opportunities
Fresenius Kabi
Page 8
Seizing opportunities
Fresenius Medical Care
Page 6
26
CONTENT

5
58 106106 Consolidated Financial Statements
118 Notes
188 Report of the Supervisory Board
192 Management Board
193 Supervisory Board
195 Glossary
198 Index
58 Management Report
59 Operations and Business Environment
59 Group Structure and Business
62 Corporate Performance Criteria,
Goals and Strategy
64 Research and Development
65 Overall Business Development
72 Results of Operations, Financial Position,
Assets, and Liabilities
83 Non-financial Performance Indicators and
Other Success Factors
90 Overall assessment of the Business Situation
90 Opportunities and Risk Report
97 Subsequent Events
97 Outlook
Bus
ines
s S
egm
ents
Fres
eniu
s S
hare
sS
umm
ary
To O
ur S
hare
hold
ers
Sus
tain
abili
tyM
anag
emen
t R
epor
tF
inan
cial
Sta
tem
ents
Not
esR
epor
t S
uper
viso
ry B
oard
Seizing opportunities
Fresenius Helios
Page 10
Seizing opportunities
Fresenius Vamed
Page 12

Fresenius Medical Care6
Asia is an important growth market for Fresenius Medical Care. Approximately
620,000 patients with chronic kidney failure are currently being treated in
this region, and every year this number increases by about 10 to 11%. We
will continue to take advantage of this growth potential. The significant
demand for dialysis services offers substantial opportunities to expand our
network of clinics in the Asian countries.
In 2008, Fresenius Medical Care achieved sales of US$ 606 million in the
Asia-Pacific region. Our goal is to continue our strong organic growth and to
increase sales to more than US$ 800 million in constant currency by 2010.
Seizing opportunities
2008 2007 Change
Sales (in million US$) 606 541 12%
Employees (December 31) 3,558 3,095 15%
Dialysis patients (December 31) 9,158 7,789 18%
Dialysis treatments (million) 1.34 1.21 11%
Dialysis clinics (December 31) 125 105 19%
FRESENIUS MEDICAL CARE IN ASIA
>in new markets

Fresenius Kabi8
With the acquisition of APP Pharmaceuticals, Fresenius Kabi has achieved
a leading position in the global market for intravenously administered
generic drugs. APP Pharmaceuticals has a strong drug registration portfolio
pending and over 70 products under development, opening up new growth
opportunities.
At the same time, we are seizing the opportunity of introducing selected
Kabi products into the US, with initial focus on parenteral nutrition. We are
also planning to launch selected APP IV drugs outside the US.
Seizing opportunities
2008
Sales US$ 777 million
EBITDA, adjusted* US$ 317 million
EBITDA margin, adjusted* 40.8%
Employees (December 31, full-time equivalent) 1,487
Production facilities 3
Number of products > 100
Market share ~17%
* Non-GAAP item
APP PHARMACEUTICALS IN FIGURES

>for furthergrowth
Fresenius Helios10
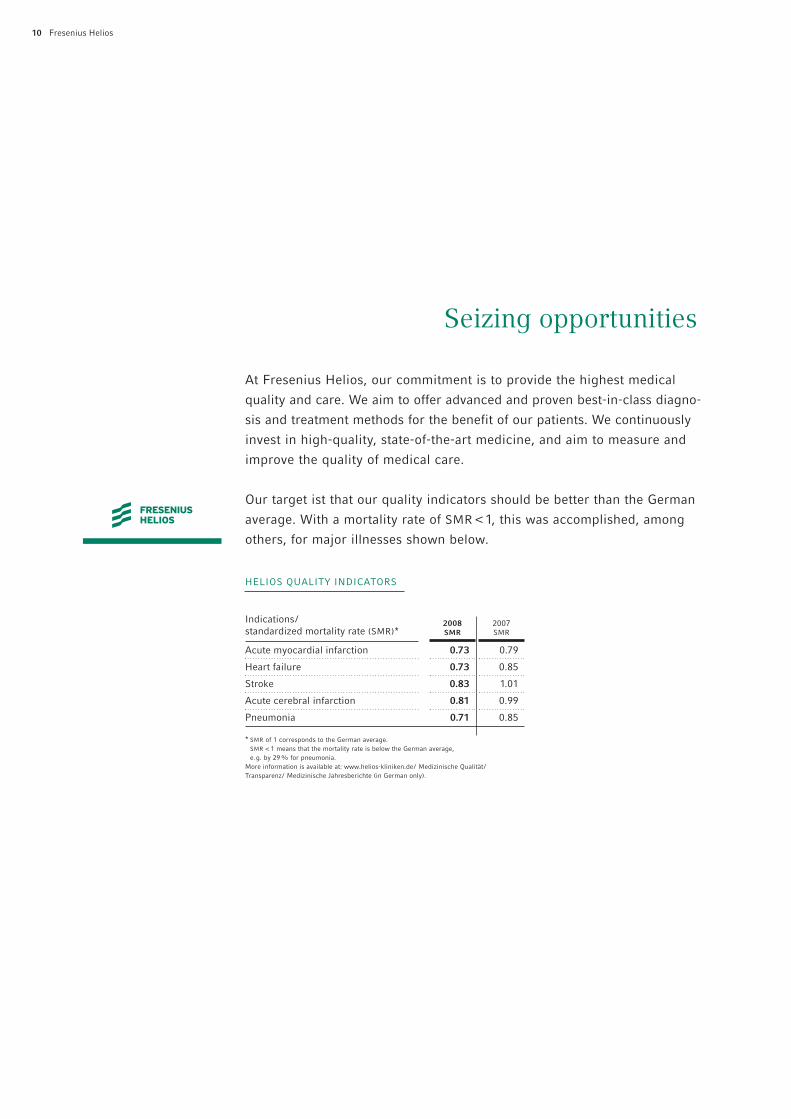
At Fresenius Helios, our commitment is to provide the highest medical
quality and care. We aim to offer advanced and proven best-in-class diagno-
sis and treatment methods for the benefit of our patients. We continuously
invest in high-quality, state-of-the-art medicine, and aim to measure and
improve the quality of medical care.
Our target ist that our quality indicators should be better than the German
average. With a mortality rate of SMR < 1, this was accomplished, among
others, for major illnesses shown below.
Seizing opportunities
Indications/ standardized mortality rate (SMR)*
2008SMR
2007SMR
Acute myocardial infarction 0.73 0.79
Heart failure 0.73 0.85
Stroke 0.83 1.01
Acute cerebral infarction 0.81 0.99
Pneumonia 0.71 0.85
* SMR of 1 corresponds to the German average. SMR < 1 means that the mortality rate is below the German average, e.g. by 29% for pneumonia.
More information is available at: www.helios-kliniken.de/ Medizinische Qualität/Transparenz/ Medizinische Jahresberichte (in German only).
HELIOS QUALITY INDICATORS

>for betterhealth

Fresenius Helios10
At Fresenius Helios, our commitment is to provide the highest medical
quality and care. We aim to offer advanced and proven best-in-class diagno-
sis and treatment methods for the benefit of our patients. We continuously
invest in high-quality, state-of-the-art medicine, and aim to measure and
improve the quality of medical care.
Our target ist that our quality indicators should be better than the German
average. With a mortality rate of SMR < 1, this was accomplished, among
others, for major illnesses shown below.
Seizing opportunities
Indications/ standardized mortality rate (SMR)*
2008SMR
2007SMR
Acute myocardial infarction 0.73 0.79
Heart failure 0.73 0.85
Stroke 0.83 1.01
Acute cerebral infarction 0.81 0.99
Pneumonia 0.71 0.85
* SMR of 1 corresponds to the German average. SMR < 1 means that the mortality rate is below the German average, e.g. by 29% for pneumonia.
More information is available at: www.helios-kliniken.de/ Medizinische Qualität/Transparenz/ Medizinische Jahresberichte (in German only).
HELIOS QUALITY INDICATORS

> for greaterefficiency

14 Summary14
Sum
mary
SALES
Consolidated sales increased by 9% to € 12,336 million in
2008. Excellent organic growth of 8% was achieved, while
acquisitions contributed 5% to growth. Currency translation
effects reduced sales by 4%.
EARNINGS
Operating income (EBIT) adjusted for special items relating
to the acquisition of APP Pharmaceuticals grew by 11%
to € 1,727 million (2007: € 1,609 million). All the business
segments contributed to this substantial growth.
Summary of the Fiscal Year
in million € 2008 2007 Change
Change inconstantcurrency
EBIT, adjusted 1,727 1,609 7% 11%
Net interest - 431 -368 -17% -20%
Income taxes - 442 -448 1% -3%
Minority interest - 404 -383 -5% -10%
Net income, adjusted 450 410 10% 13%
SALES BY REGION
Europe 45%Asia-Pacific 7%
North America 41%
Latin America
and other regions 7%
2008: € 12.3 billion
� Group net interest was € -431 million (2007: € -368 mil-
lion). The change compared to the prior-year figure
is mainly due to the financing of the APP acquisition.
� Net income before special items relating to the APP
acquisition was € 450 million, an excellent increase of
13%. Adjusted earnings per ordinary and preference
share rose by 11%.
� In North America, sales increased by 9% in constant
currency due to a good organic growth of 5%. Net
acquisitions contributed 4%.
� In Europe, sales grew by 14%, with organic sales
contributing 9%.
� In emerging markets, strong organic growth rates
continued, achieving 17% in Asia-Pacific and 18%
in Latin America.

15
Sum
mar
y
SummaryTo Our Shareholders Fresenius Shares Business Segments Responsibility, Environment, Sustainability
CASH FLOW
Operating cash flow of € 1,074 million was below previous
year’s € 1,296 million, mainly due to an increase in net
working capital. This is attributable to higher trade accounts
receivable and an increase in inventories.
BALANCE SHEET
Total assets rose by 34% to € 20,544 million. In constant
currency, the increase was 31%. Of the growth in total
assets, 27% is attributable to the companies acquired in
2008, mainly APP Pharmaceuticals.
� The operating cash flow margin was 8.7% (2007:
11.4%).
� Cash flow before acquisitions and dividends decreased
to € 338 million (2007: € 630 million), mainly due to
high investments in property, plant, and equipment.
Dividends were financed out of cash flow. Acquisi-
tions were financed through new debt and equity.
� Shareholders’ equity, including minority interest, increased
by 15% to € 6,943 million.
� The equity ratio, including minority interest, was 33.8%.
� Debt increased to € 8,787 million (December 31, 2007:
€ 5,699 million), mainly as a result of the acquisition
financing of APP Pharmaceuticals.
� The net debt /EBITDA ratio* increased to 3.6 (December 31,
2007: 2.6) due to the financing of the acquisitions.
* Pro forma APP Pharmaceuticals and excluding special items relating to the acquisition.
Equity and minority interest
Debt
Other liabilities
Non-current assets
Trade accounts receivable
Other current assets
EQUITY AND LIABILITIESASSETS
75%
12%
72%
14%
34% 40%
2004 2006 2007 2008
851780
2005
1,296
1,052
Dec 31, 2007 Dec 31, 2008 Dec 31, 2007
15,32420,544 20,544 15,324Total assets
in million €
14%13%
37%
23%
43%
23%
1,074
OPERATING CASH FLOW, IN MILLION €
Dec 31, 2008

� SHARE PRICE PERFORMANCE IMPACTED BY
THE GLOBAL FINANCIAL MARKET CRISIS.
� IN TERMS OF MARKET CAPITALIZATION,
FRESENIUS IS ONE OF THE 30 LARGEST
PUBLICLY TRADED COMPANIES IN GERMANY.
� DIVIDEND INCREASE PROPOSED.
16 Fresenius Shares
FRESENIUS SHARES AND
CORPORATE GOVERNANCE REPORT

17
Fres
eniu
s S
hare
s
SummaryTo Our Shareholders Fresenius Shares Business Segments Responsibility, Environment, Sustainability
In 2008, the stock markets were marked by the international financial market crisis and its
impact on the real economy. In the course of the year, all stocks were buffeted by these events –
resulting, in part, in correspondingly high share price losses. Despite the Fresenius Group’s
excellent financial results, neither the ordinary shares nor the preference shares were
able to bypass this development.
STOCK MARKETS
The equity markets experienced strong price fluctuations in the
first half of 2008. Although supported at first by the good
company results released in the reporting season, the equity
markets were not able to escape from the continuing turbu-
lences on the money and credit markets. As early as January
2008, at 7,949 points, the DAX registered what would be its
high for the year. By May 2008, the MDAX reached 10,069
points – its high for the year. From midyear, the effects of the
financial crisis in the United States – triggered by the credit
crisis on the US subprime mortgage market – spilled over
with full force to the international capital markets. This led to
a downward trend that persisted to the end of 2008. Despite
the launch of global economic support programs for the indus-
trial sector and huge rescue packages for banks, investors
lost confidence. To limit their risks, many withdrew their cap-
ital from the stock market, leading to correspondingly high
losses in stock prices and indices. The DAX lost heavily in
the second half of the year, falling to 4,127 points in Novem-
ber 2008. At its low of 4,735 points in November the MDAX
had lost over 50% in value. Both indices recovered slightly by
the end of the year but remained well below their levels at
the beginning of 2008; the DAX and MDAX closed the year at
4,810 points and 5,602 points, respectively. Over the year
the DAX lost 40% and the MDAX 43%. Despite the heavy
losses, the DAX still did well compared to other European
blue chip indices. The EuroStoxx 50 suffered considerable
losses in 2008 with a decrease of 44%. The European Dow
Jones STOXX 600 Index, which comprises Europe’s 600 largest
companies, closed the year at 197 points, a decrease of 45%.
In this index the best performing sectors were Healthcare
(-18%), Food&Beverages (-30%), and Telecommunications
(-36%), while Banks (-64%), Basic Resources (-64%),
and Financial Services (-55%) were the three worst perform-
ers. The leading US indices also lost heavily. The S & P 500
closed 2008 with a loss of 38%, while the Dow Jones Indus-
trial Average fell 34%.
Dec 31, 2007
120
110
100
90
80
70
60
50
40
Mar 31, 2008 Jun 30, 2008 Sep 30, 2008 Dec 31, 2008
DAX MDAX Ordinary share Preference share
RELATIVE SHARE PRICE PERFORMANCE
December 31, 2007 = 100
18 Fresenius Shares1818
Fresenius Shares
FRESENIUS SHARES
In 2008, the prices of both our ordinary shares and prefer-
ence shares were affected by the repercussions of the global
financial market crisis. At the end of the year, the ordinary
share had lost 35%, while the preference share was down
27% from its price at the beginning of the year. Despite
excellent financial results and a positive company outlook,
Fresenius shares were unable to escape the general market
trend. Both share classes exceeded the DAX and the MDAX
but underperformed the Dow Jones Stoxx European Health-
care sector index (-18%) and the German DAXsector
Pharma&Healthcare index (-22%). On December 22, 2008,
at € 31.93, the ordinary share reached its low for the year,
recovering only slightly to close the year at € 36.23. Its high
for the year, € 60.87, was reached on May 19, 2008. The
preference share registered its low for the year, € 37.23, on
December 11, 2008 and its high, € 59.25, as early as Janu-
ary 9, 2008. It closed the year at € 41.59. Fresenius SE came
10th in the MDAX in terms of its full-year performance in
2008. Out of the 110 companies listed in the Deutsche Börse
index, Fresenius was ranked 24th, at the end of 2008.
Fresenius SE’s market capitalization as of December 31,
2008 was € 6.3 billion, a decrease of 28% compared to
December 31, 2007. As the following table shows, the aver-
age daily trading volume in Fresenius shares on Xetra has
continued to rise.
CAPITAL STRUCTURE
To partially finance the acquisition of APP Pharmaceuticals,
we conducted a capital increase in authorized capital on
August 12, 2008 with the issuance of 2,748,057 new ordinary
shares and 2,748,057 new preference shares, generating
gross proceeds of approximately € 289 million. The issue
price was € 52.00 per ordinary share and € 53.00 per prefer-
ence share. Existing shareholders’ subscription rights were
excluded. The new shares were included in the quotation of
existing Fresenius SE shares in the Regulated Market at
the stock exchanges in Frankfurt, Munich, and Düsseldorf
on August 19, 2008. They have full dividend entitlement
for the fiscal year 2008.
In addition, stock options on ordinary and preference
shares under the 1998 and 2003 stock option plans were exer-
cised to a small extent in 2008, increasing the number of
ordinary and preference shares by 241,425 each. Further infor-
mation on the stock option plan can be found on pages 173
to 179 of this Annual Report.
At the end of 2008, there were 80,571,867 bearer ordinary
shares and 80,571,867 bearer preference shares outstanding.
Average tradingvolume 2008
Average tradingvolume 2007
Change in %
Ordinary share 79,081 70,574 12
Preference share 566,635 534,660 6
2008*1999 2000
0.67
0.27
0.32
0.35
0.39
0.42
0.46
0.50
0.58
2001 2002 2003 2004 2005 2006 2007
* Proposal
DIVIDEND PREFERENCE SHARE IN €
0.71
19
Fres
eniu
s S
hare
s
SummaryTo Our Shareholders Fresenius Shares Business Segments Responsibility, Environment, Sustainability
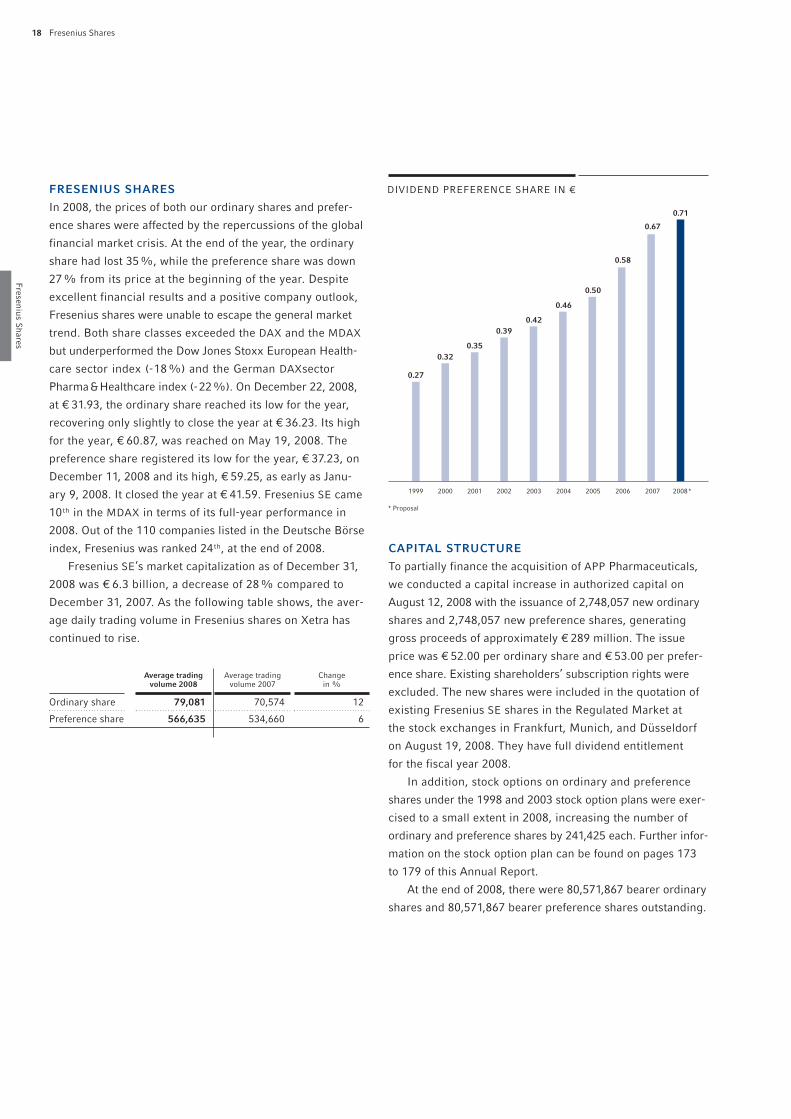
DIVIDEND
Based on the Group’s excellent financial results, we are
pleased to increase the dividend for 2008. We are therefore
continuing our earnings-linked dividend policy. For the
16th consecutive year we are proposing to our shareholders
a dividend increase to € 0.70 (2007: € 0.66) per ordinary
share and € 0.71 (2007: € 0.67) per preference share – an
increase of 6% per share. The total proposed dividend
distribution will be € 113.6 million, equivalent to 25% of
adjusted Group net income (before special items).
We have added a total return calculator as a service on
our website at www.fresenius.com, see Investor Relations/
Shares/Share Price. You can use the calculator to determine
the total return on your Fresenius shares including dividend
payments.
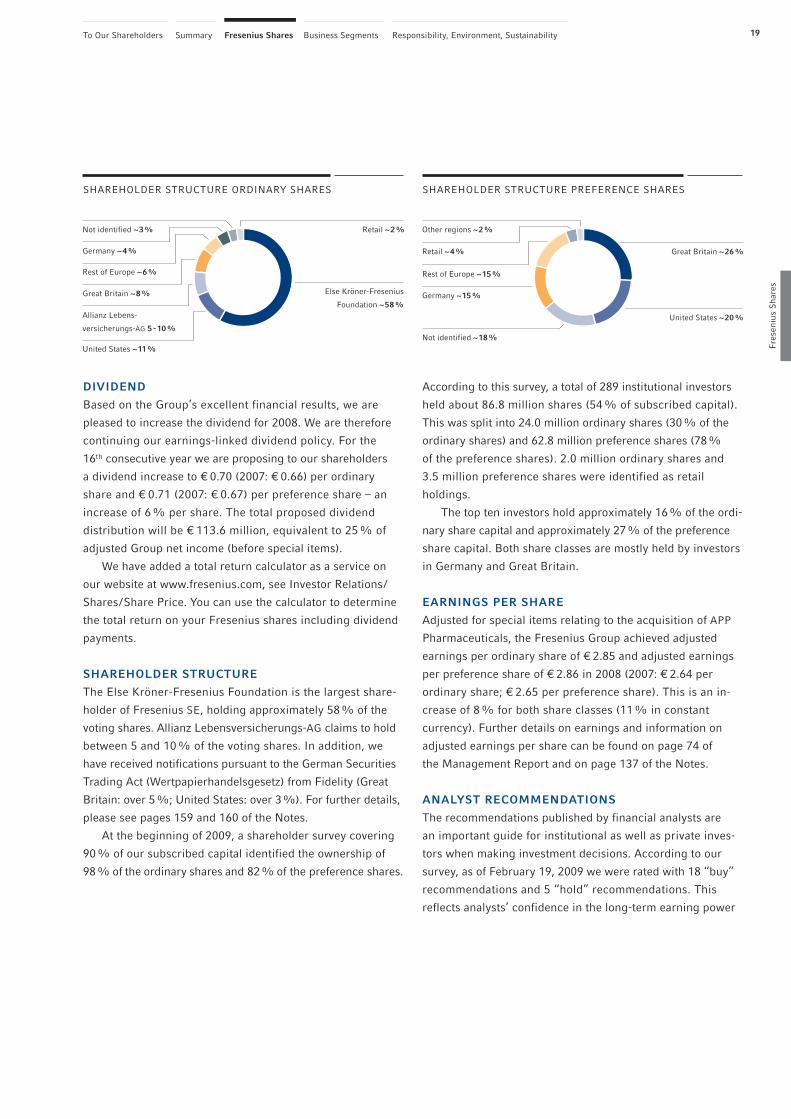
SHAREHOLDER STRUCTURE
The Else Kröner-Fresenius Foundation is the largest share-
holder of Fresenius SE, holding approximately 58% of the
voting shares. Allianz Lebensversicherungs-AG claims to hold
between 5 and 10% of the voting shares. In addition, we
have received notifications pursuant to the German Securities
Trading Act (Wertpapierhandelsgesetz) from Fidelity (Great
Britain: over 5%; United States: over 3%). For further details,
please see pages 159 and 160 of the Notes.
At the beginning of 2009, a shareholder survey covering
90% of our subscribed capital identified the ownership of
98% of the ordinary shares and 82% of the preference shares.
According to this survey, a total of 289 institutional investors
held about 86.8 million shares (54% of subscribed capital).
This was split into 24.0 million ordinary shares (30% of the
ordinary shares) and 62.8 million preference shares (78%
of the preference shares). 2.0 million ordinary shares and
3.5 million preference shares were identified as retail
holdings.
The top ten investors hold approximately 16% of the ordi-
nary share capital and approximately 27% of the preference
share capital. Both share classes are mostly held by investors
in Germany and Great Britain.
EARNINGS PER SHARE
Adjusted for special items relating to the acquisition of APP
Pharmaceuticals, the Fresenius Group achieved adjusted
earnings per ordinary share of € 2.85 and adjusted earnings
per preference share of € 2.86 in 2008 (2007: € 2.64 per
ordinary share; € 2.65 per preference share). This is an in-
crease of 8% for both share classes (11% in constant
currency). Further details on earnings and information on
adjusted earnings per share can be found on page 74 of
the Management Report and on page 137 of the Notes.
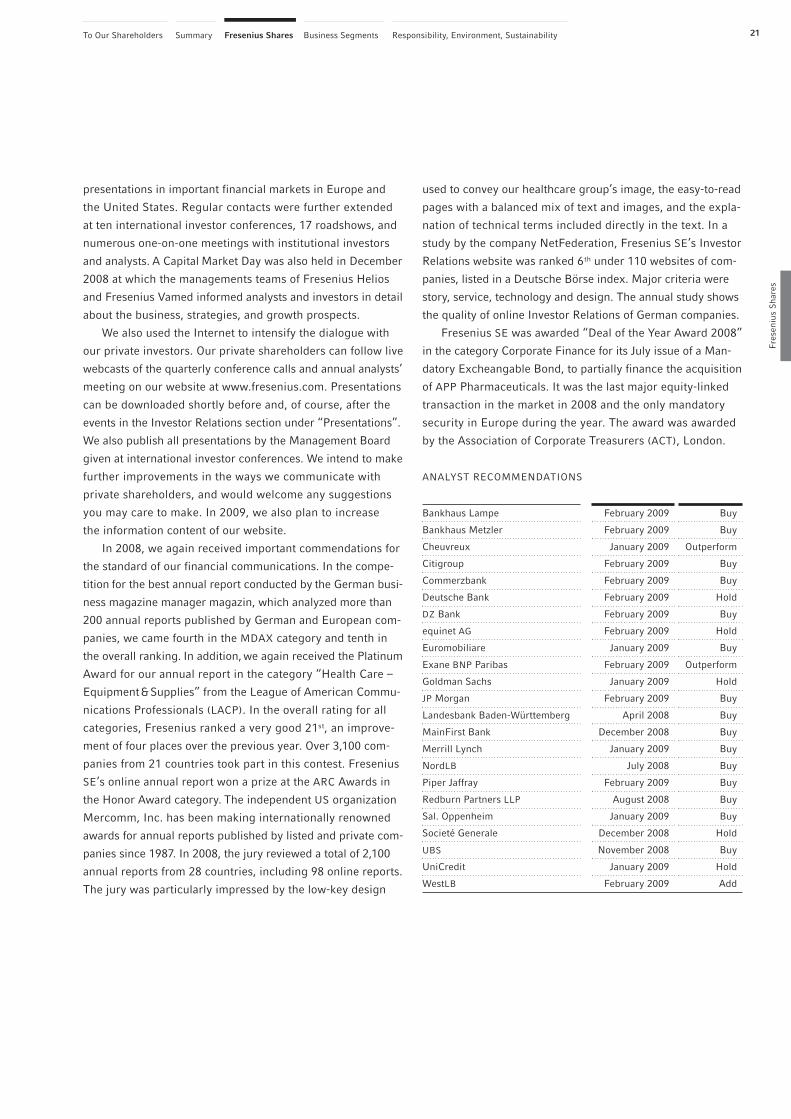
ANALYST RECOMMENDATIONS
The recommendations published by financial analysts are
an important guide for institutional as well as private inves-
tors when making investment decisions. According to our
survey, as of February 19, 2009 we were rated with 18 “buy”
recommendations and 5 “hold” recommendations. This
reflects analysts’ confidence in the long-term earning power
SHAREHOLDER STRUCTURE PREFERENCE SHARES
Not identified ~3%
SHAREHOLDER STRUCTURE ORDINARY SHARES
Else Kröner-Fresenius
Foundation ~58%
Great Britain ~8%
Germany ~4%
Retail ~2%
Rest of Europe ~6%
Other regions ~2%
Great Britain ~26%
Germany ~15%
Rest of Europe ~15%
Retail ~4%
United States ~11%
United States ~20%
Not identified ~18%
Allianz Lebens-
versicherungs-AG 5 -10%
20 Fresenius Shares2020
Fresenius Shares
of the Fresenius Group and the potential both for our busi-
ness and for our shares. The table on the next page lists the
banks which provide regular analyst coverage on Fresenius
and their latest recommendations.
INVESTOR RELATIONS
Our Investor Relations activities are in accordance with the
transparency rules of the German Corporate Governance
Code. We pursue comprehensive, timely, and open commu-
nication with private and institutional investors as well as
financial analysts. The equal treatment of all market actors is
very important to us in our day-to-day communication.
In 2008, we again intensified our dialogue with the capi-
tal market in order to enable investors and analysts to make a
fair assessment of Fresenius Group’s business situation and
market conditions. In addition to the annual analysts’ meet-
ing and the quarterly conference calls, Fresenius also made
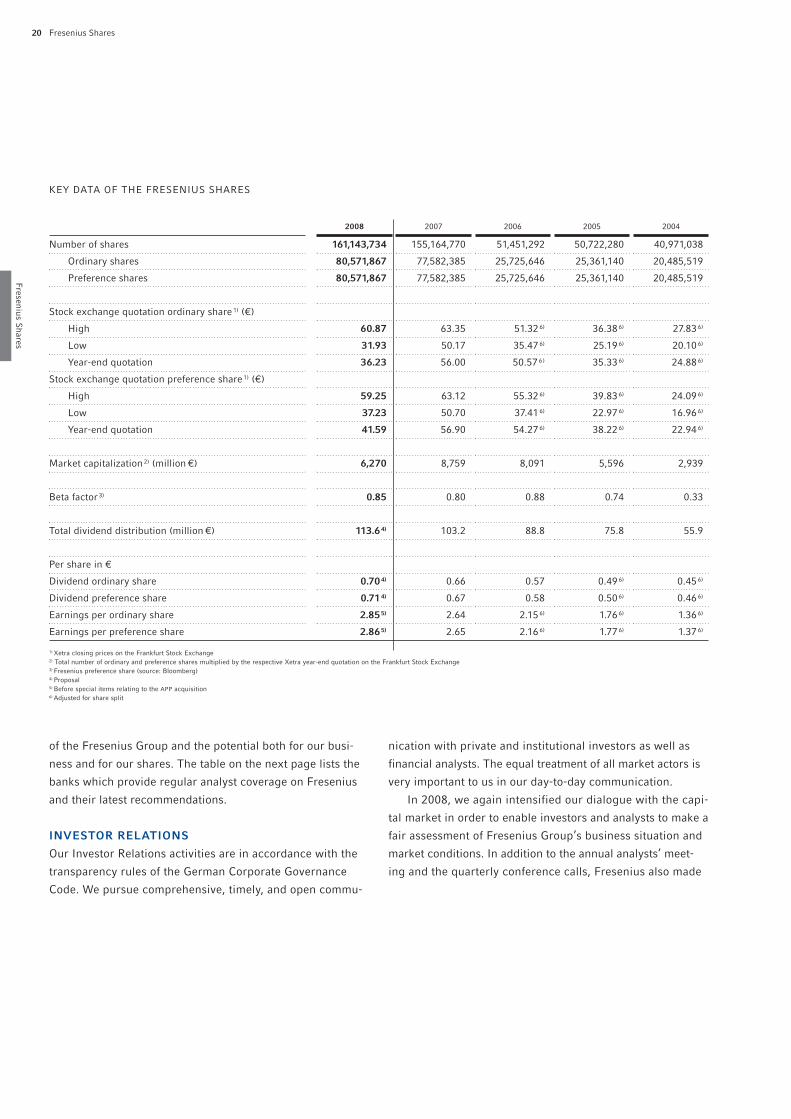
KEY DATA OF THE FRESENIUS SHARES
2008 2007 2006 2005 2004
Number of shares 161,143,734 155,164,770 51,451,292 50,722,280 40,971,038
Ordinary shares 80,571,867 77,582,385 25,725,646 25,361,140 20,485,519
Preference shares 80,571,867 77,582,385 25,725,646 25,361,140 20,485,519
Stock exchange quotation ordinary share1) (€)
High 60.87 63.35 51.32 6) 36.386) 27.83 6)
Low 31.93 50.17 35.476) 25.19 6) 20.10 6)
Year-end quotation 36.23 56.00 50.576) 35.336) 24.886)
Stock exchange quotation preference share1) (€)
High 59.25 63.12 55.326) 39.836) 24.096)
Low 37.23 50.70 37.41 6) 22.976) 16.966)
Year-end quotation 41.59 56.90 54.276) 38.226) 22.946)
Market capitalization2) (million €) 6,270 8,759 8,091 5,596 2,939
Beta factor3) 0.85 0.80 0.88 0.74 0.33
Total dividend distribution (million €) 113.6 4) 103.2 88.8 75.8 55.9
Per share in €
Dividend ordinary share 0.70 4) 0.66 0.57 0.496) 0.456)
Dividend preference share 0.71 4) 0.67 0.58 0.506) 0.466)
Earnings per ordinary share 2.85 5) 2.64 2.15 6) 1.766) 1.366)
Earnings per preference share 2.86 5) 2.65 2.16 6) 1.776) 1.376)
1) Xetra closing prices on the Frankfurt Stock Exchange2) Total number of ordinary and preference shares multiplied by the respective Xetra year-end quotation on the Frankfurt Stock Exchange3) Fresenius preference share (source: Bloomberg)4) Proposal5) Before special items relating to the APP acquisition6) Adjusted for share split
21
Fres
eniu
s S
hare
s
SummaryTo Our Shareholders Fresenius Shares Business Segments Responsibility, Environment, Sustainability
Bankhaus Lampe February 2009 Buy
Bankhaus Metzler February 2009 Buy
Cheuvreux January 2009 Outperform
Citigroup February 2009 Buy
Commerzbank February 2009 Buy
Deutsche Bank February 2009 Hold
DZ Bank February 2009 Buy
equinet AG February 2009 Hold
Euromobiliare January 2009 Buy
Exane BNP Paribas February 2009 Outperform
Goldman Sachs January 2009 Hold
JP Morgan February 2009 Buy
Landesbank Baden-Württemberg April 2008 Buy
MainFirst Bank December 2008 Buy
Merrill Lynch January 2009 Buy
NordLB July 2008 Buy
Piper Jaffray February 2009 Buy
Redburn Partners LLP August 2008 Buy
Sal. Oppenheim January 2009 Buy
Societé Generale December 2008 Hold
UBS November 2008 Buy
UniCredit January 2009 Hold
WestLB February 2009 Add
used to convey our healthcare group’s image, the easy-to-read
pages with a balanced mix of text and images, and the expla-
nation of technical terms included directly in the text. In a
study by the company NetFederation, Fresenius SE’s Investor
Relations website was ranked 6th under 110 websites of com-
panies, listed in a Deutsche Börse index. Major criteria were
story, service, technology and design. The annual study shows
the quality of online Investor Relations of German companies.
Fresenius SE was awarded “Deal of the Year Award 2008”
in the category Corporate Finance for its July issue of a Man-
datory Excheangable Bond, to partially finance the acquisition
of APP Pharmaceuticals. It was the last major equity-linked
transaction in the market in 2008 and the only mandatory
security in Europe during the year. The award was awarded
by the Association of Corporate Treasurers (ACT), London.
presentations in important financial markets in Europe and
the United States. Regular contacts were further extended
at ten international investor conferences, 17 roadshows, and
numerous one-on-one meetings with institutional investors
and analysts. A Capital Market Day was also held in December
2008 at which the managements teams of Fresenius Helios
and Fresenius Vamed informed analysts and investors in detail
about the business, strategies, and growth prospects.
We also used the Internet to intensify the dialogue with
our private investors. Our private shareholders can follow live
webcasts of the quarterly conference calls and annual analysts’
meeting on our website at www.fresenius.com. Presentations
can be downloaded shortly before and, of course, after the
events in the Investor Relations section under “Presentations”.
We also publish all presentations by the Management Board
given at international investor conferences. We intend to make
further improvements in the ways we communicate with
private shareholders, and would welcome any suggestions
you may care to make. In 2009, we also plan to increase
the information content of our website.
In 2008, we again received important commendations for
the standard of our financial communications. In the compe-
tition for the best annual report conducted by the German busi-
ness magazine manager magazin, which analyzed more than
200 annual reports published by German and European com-
panies, we came fourth in the MDAX category and tenth in
the overall ranking. In addition, we again received the Platinum
Award for our annual report in the category “Health Care –
Equipment&Supplies” from the League of American Commu-
nications Professionals (LACP). In the overall rating for all
categories, Fresenius ranked a very good 21st, an improve-
ment of four places over the previous year. Over 3,100 com-
panies from 21 countries took part in this contest. Fresenius
SE’s online annual report won a prize at the ARC Awards in
the Honor Award category. The independent US organization
Mercomm, Inc. has been making internationally renowned
awards for annual reports published by listed and private com-
panies since 1987. In 2008, the jury reviewed a total of 2,100
annual reports from 28 countries, including 98 online reports.
The jury was particularly impressed by the low-key design
ANALYST RECOMMENDATIONS
22 Fresenius Shares2222
Fresenius Shares
casted live over the Internet on the Investor Relations/Annual
General Meeting section of our website at www.fresenius.com.
Additionally, shareholders were able to have their voting rights
exercised by proxy, or, in line with the recommendation in
the Code, by a voting representative appointed by Fresenius SE.
Those at the AGM voted on the appropriation of the distrib-
utable profits, gave their approval to the actions of the Manage-
ment and Supervisory Boards and to the appointment of
the auditors. Other resolutions passed at the AGM included
the election of a new Supervisory Board and the approval
of the 2008 stock option plan, including the creation of condi-
tional capital and corresponding amendments of the Com-
pany Statutes. On each of the last two resolutions a special
vote of the preference shareholders had to be taken.
MANAGEMENT BOARD
The Management Board of Fresenius SE is responsible for
managing the Company and conducting its business, focusing
its actions and decisions on the Company’s interests. The
Management Board’s seven members are listed on page 192
of this Annual Report.
SUPERVISORY BOARD
The Supervisory Board of Fresenius SE consists of 12 mem-
bers who are elected at the AGM. Of these, six have been
proposed directly by the employees; the AGM is bound to these
nominations. The term of office of the current Supervisory
Board will end at the close of the Company’s AGM in 2013.
One Supervisory Board member is a partner in a law firm
that provides legal advice to the Group, a mandate approved
by the Supervisory Board. Another Supervisory Board member
is a partner and the supervisory board chairman of a company
that provided consultancy services for the Fresenius Group
in 2008. The Supervisory Board also approved this mandate.
Yet another Supervisory Board member is the supervisory
board chairman of a bank where the Fresenius Group main-
tains business accounts (on normal business terms). Fresenius
SE has disclosed these details in the quarterly reports for
2008 and on page 179 of the Annual Report for 2008. There
CORPORATE GOVERNANCE REPORT
The German Corporate Governance Code (Code) was estab-
lished to increase confidence in the corporate management
of publicly traded companies. It aims to provide more trans-
parency for investors regarding existing regulations covering
the management and monitoring of companies. The Manage-
ment and Supervisory Boards of Fresenius SE support the
principles set out in the Code and are committed to responsi-
ble management that is focused on achieving a sustainable
increase in the value of the Company. Key elements of this
approach are solid financial management, long-term corporate
strategies, and strict adherence to legal and ethical business
standards. Transparency in corporate communication is a fur-
ther commitment. Good corporate governance is an integral
part of corporate policy at Fresenius. Our value-enhancing
strategies, as well as the majority of the guidelines, recom-
mendations, and proposals for responsible management
contained in the Code, have been basic components of our
activities for many years.
Fresenius has published extensive information on the
subject of corporate governance on the company website.
The latest declaration of conformity and those for prior
years are published there, where they can be downloaded.
SHAREHOLDERS
The shareholders uphold their rights at the Annual General
Meeting, where they exercise their voting rights. Each ordi-
nary share of Fresenius SE confers one vote. Although prefer-
ence shares of Fresenius SE basically carry no voting rights,
holders of these shares have precedence in the distribution
of earnings and are entitled to a higher dividend. None of
the shares carry multiple or preferential voting rights.
ANNUAL GENERAL MEETING
Our Annual General Meeting (AGM) was held on May 21,
2008 in Frankfurt am Main. Approximately 90% of the ordi-
nary share capital and over 59% of the preference share
capital was represented at the meeting. Those shareholders
unable to attend the AGM were able to listen to the speech
of the Chairman of the Management Board, which is broad-

23
Fres
eniu
s S
hare
s
SummaryTo Our Shareholders Fresenius Shares Business Segments Responsibility, Environment, Sustainability
important part of the Supervisory Board’s activities is the work
conducted within committees formed in accordance with
the requirements of the German Stock Corporation Act (Aktien-
gesetz) and the recommendations of the Code. The mem-
bers of the Supervisory Board are listed on pages 193 to 194
of this Annual Report.
SUPERVISORY BOARD COMMITTEES
The Supervisory Board of Fresenius SE has three permanent
committees: the Audit Committee, consisting of five mem-
bers, and the Personnel Committee and the Nomination Com-
mittee, each comprising three members. The members of
the committees are listed on pages 193 and 194 of this Annual
Report. The chairman of the Audit Committee is appointed
in accordance with clause 5.3.2 of the Code. The Audit Com-
mittee’s function is, among other things, to prepare the Super-
visory Board’s approval of the financial statements and the
consolidated financial statements, review the quarterly reports
before they are published, and – following discussion with
are no other consulting and service contracts between the
Company and members of the Supervisory Board. The Super-
visory Board is not aware of any conflicts of interest involv-
ing members of the Supervisory or Management Boards.
Should such conflicts arise, members are required to notify
the Supervisory Board immediately.
The Supervisory Board appoints the members of the
Management Board, and supervises and advises the Manage-
ment Board in its management of the Company. The Super-
visory Board has established its rules of procedure in accord-
ance with clause 5.1.3 of the Code. The Chairman of the
Supervisory Board is responsible for coordinating the activi-
ties of the Board, chairing its meetings, and representing its
interests externally. Regular dialogue with the Management
Board insures that the Supervisory Board is well informed at
all times about the Company’s operating performance and
corporate development and strategy. It approves all corporate
planning and, taking into account the auditor’s reports,
approves the Group’s annual financial statements. Another
2008 Name Position Class of share QuantityPricein €
Total volume in €
Type of transaction
June 4 Prof. Dr. R. Berger SB Ords 33,000 59.90 1,976,700.00 Sale
June 5 Prof. Dr. R. Berger SB Ords 18,000 60.04 1,080,720.00 Sale
June 10 Prof. Dr. R. Berger SB Ords 6,028 59.80 360,487.06 Sale
June 11 Prof. Dr. R. Berger SB Ords 3,882 59.85 232,330.32 Sale
June 12 Prof. Dr. R. Berger SB Ords 1,353 59.06 79,908.18 Sale
June 13 Prof. Dr. R. Berger SB Ords 13,009 59.27 771,043.43 Sale
August 8 Prof. Dr. R. Berger SB Ords 5,000 59.05 295,250.00 Sale
August 8 Prof. Dr. R. Berger SB Ords 4,009 59.20 237,332.80 Sale
July 7 R. Baule MB Prefs 200 48.68 9,736.00 Purchase
July 7 R. Baule MB Prefs 800 48.69 38,952.00 Purchase
August 28 B. Lipps MB Prefs 5,499 55.35 304,369.65 Sale
July 7 S. Sturm MB Prefs 1,000 49.90 49,907.68 Purchase
November 5 S. Sturm MB Ords 3,300 41.64 137,412.20 Purchase
November 5 S. Sturm MB Prefs 2,860 48.01 137,305.54 Sale
November 13 S. Sturm MB Ords 990 39.85 39,453.08 Purchase
November 13 S. Sturm MB Prefs 750 47.71 35,782.50 Sale
December 16 K. Berger Wife of SB member Ords 330 34.34 11,330.55 Sale
SB = Supervisory Board, MB = Management Board, Ords = Ordinary shares, Prefs = Preference shares
DIRECTOR’S DEALINGS

24 Fresenius Shares2424
Fresenius Shares
the Management Board – to appoint the auditor for the
financial statements and determine the auditor’s fees. Other
matters within its remit are risk management and com-
pliance issues.
The Personnel Committee is responsible for determining
the conclusion, modification, and termination of the Manage-
ment Board’s employment contracts and the structuring of
their compensation scheme. The Nomination Committee pro-
poses suitable candidates to the Supervisory Board for the
nominations it makes to the AGM for election to the Supervi-
sory Board. It consists solely of shareholders’ representatives.
In 2008, the Supervisory Board of Fresenius SE also set up
a “Transaction Financing APP Pharmaceuticals, Inc.” com-
mittee in connection with the acquisition of the US company
APP Pharmaceuticals, Inc. The committee consisted of two
shareholder representatives and two employee representa-
tives. The functions delegated to this committee by the Super-
visory Board included the provision of resolutions on the
final acquisition price and on those terms of the transaction’s
financing that are subject to approval. In particular, the com-
mittee exercised the Supervisory Board’s rights of consultation
and approval with regard to the use of authorized capital pur-
suant to § 4 (5) of the Company Statutes (Authorized Capital
II). The committee continued to exist after the end of 2008
in order to oversee the offering of unsecured Senior Notes in
January 2009.
SUPERVISORY BOARD EFFICIENCY EVALUATION
The Supervisory Board deliberated on the efficiency evaluation
in accordance with clause 5.6 of the Code at two of its meet-
ings in 2008 and resolved to adopt a new procedure. The self-
evaluations conducted so far have shown that the Supervi-
sory Board is organized efficiently and that the Management
Board and the Supervisory Board are cooperating effectively.
COOPERATION BETWEEN THE MANAGEMENT
AND SUPERVISORY BOARDS
Good corporate governance requires trusting and efficient
cooperation between the Management Board and the Super-
visory Board. The Management and Supervisory Boards of
Fresenius SE work closely together in the interests of the
Company. Open communication is of great importance.
The Management Board discusses the Company’s strategic
focus with the Supervisory Board. As the monitoring body,
the Supervisory Board also needs to be informed comprehen-
sively about operating performance and corporate plan-
ning, as well as the risk situation, including risk management
and compliance. Important business transactions require
the approval of the Supervisory Board.
COMPENSATION OF THE MANAGEMENT
AND SUPERVISORY BOARDS
Details about the Management and Supervisory Board mem-
bers’ compensation, disclosures relating to the stock option
plans, and on Directors & Officers (D & O) insurance policies
can be found on pages 180 to 184 of the Notes.
DISCLOSURES ON DIRECTOR’S DEALINGS
AND SHAREHOLDINGS IN 2008
Members of the Management and Supervisory Boards, other
executive officers and persons closely related to them are
required, pursuant to §15a of the German Securities Trading
Act (Wertpapierhandelsgesetz), to disclose purchases and
sales of shares of Fresenius SE and financial instruments based
on them (Director’s Dealings). In compliance with clause 6.6
of the Code, ownership of company shares and financial instru-
ments based on them must be disclosed by Management
and Supervisory Board members if more than 1% of the shares
issued by Fresenius SE are held either directly or indirectly.
No member of either board holds, directly and indirectly, more
than 1% of these shares. Furthermore, the combined hold-
ings of all Management and Supervisory Board members of
shares issued by Fresenius was less than 1% in 2008. Nor did
we receive any notifications that the shareholdings of mem-
bers of the Management and Supervisory Boards had reached,
exceeded, or fallen below the reporting thresholds stipulated
in the German Securities Trading Act.
TRANSPARENCY AND COMMUNICATION
Fresenius adheres to all recommendations of clause 6 of the
Code. Transparency is guaranteed by continuous communi-
cation with the public. In that way we are able to validate and
extend the trust given to us. Of particular importance to us

25SummaryTo Our Shareholders Fresenius Shares Business Segments Responsibility, Environment, Sustainability
is the equal treatment of all recipients. To insure that all
market recipients receive the same information at the same
time, we post all important publications on our website
www.fresenius.com in the Investor Relations section. These
publications include financial reports and director’s deal-
ings in accordance with §15a of the German Securities Trad-
ing Act (Wertpapierhandelsgesetz).
RISK MANAGEMENT
In our view, the responsible handling of risks is an element
of good corporate governance. The systematic risk manage-
ment that Fresenius practices allows the Management Board
to make early identifications of market trends and to react
promptly to relevant changes in our risk profile. The risk
management system is reviewed as part of the annual audit.
Further information can be found on pages 90 to 91 of the
Management Report.
COMPLIANCE
At Fresenius, compliance with national and international
legal and ethical principles is an integral part of our corpo-
rate culture. These principles, which underpin our profes-
sionalism, include honesty and integrity in relations with our
patients, customers, suppliers, governments, employees,
shareholders, and the general public. We make every effort
to insure that our employees comply with the relevant
national and international rules.
FINANCIAL ACCOUNTING AND REPORTING
Fresenius prepares its consolidated financial statements in
accordance with the United States Generally Accepted
Accounting Principles (US GAAP). As from the 2005 fiscal
year, Fresenius, as a publicly traded company based in a
member country of the European Union, has been required
to prepare and publish its consolidated financial statements
in accordance with International Financial Reporting Stand-
ards (IFRS), pursuant to § 315a of the German Commercial
Code (HGB). Our largest subsidiary, Fresenius Medical
Care, prepares its financial statements in accordance with
US GAAP. We therefore publish our consolidated financial
statements in accordance with US GAAP and our statutory
consolidated financial statements in accordance with IFRS.
This enables us to disclose our financial results to all our
shareholders in a comparable and transparent manner.
IMPLEMENTATION OF THE GERMAN CORPORATE
GOVERNANCE GUIDELINES
The Management and Supervisory Boards of Fresenius SE
have issued a Declaration of Conformity pursuant to §161
of the German Stock Corporation Act (Aktiengesetz) and
have made it available to shareholders. In accordance with
clause 3.10 of the Code, this declaration, as well as past dec-
larations, is available on our website at www.fresenius.com;
see Investor Relations/Corporate Governance. On May 21,
2008 the Management Board and the Supervisory Board
of Fresenius SE declared in their Declaration of Conformity
pursuant to §161 of the German Stock Corporation Act that
the recommendations of the German Commission on the Ger-
man Corporate Governance Code of June 14, 2007, published
by the Federal Ministry of Justice in the official section of the
electronic Federal Gazette, have been and are being met.
The Management Board and the Supervisory Board of
Fresenius SE also intend to follow the recommendations of
the Code in future.
Thus far, only the following recommendations have not
been or are not being adhered to:
� Code clause 4.2.3 recommends that the Supervisory
Board should agree to a cap for stock options and compa-
rable instruments in the event of extraordinary, unfore-
seen developments. The Stock Option Plan 2008 does not
contain such regulation.
� Pursuant to clause 5.4.1 of the Code, an age limit is to
be specified for the members of the Supervisory Board.
According to clause 5.1.2, the same shall apply for the
members of the Management Board. As in the past,
Fresenius will refrain from introducing an age limit for
members of the Management and Supervisory Boards
as this would limit the selection of qualified candidates.
Fres
eniu
s S
hare
s

� EXCELLENT OPERATING PERFORMANCE
ACHIEVED.
� MARKET LEADERSHIP FURTHER
STRENGTHENED.
� GROWTH STRATEGY IN RENAL
PHARMACEUTICALS CONTINUED.
Business Segments26
FACTS AND FIGURES 2008

27
Bus
ines
s S
egm
ents
Fresenius Medical Care
Fresenius KabiFresenius HeliosFresenius Vamed
SummaryTo Our Shareholders Fresenius Shares Business Segments Responsibility, Environment, Sustainability
With sales increasing by 9% and net income rising by 14%, 2008 was an excellent
year for Fresenius Medical Care. Operating performance in dialysis care was robust,
while dialysis product sales achieved significant growth.
Fresenius Medical Care is the world’s leading provider of dial-
ysis products and dialysis care for patients with chronic kid-
ney failure. In 2008, we treated 184,086 patients at 2,388 dial-
ysis clinics worldwide. The number of treatments increased
by 5% to 27.9 million. We market our comprehensive range
of products in more than 100 countries. A global production
network provides reliable patient care at any time. Fresenius
Medical Care’s largest plants are in the United States, Ger-
many, and Japan.
BUSINESS DEVELOPMENT
In 2008, sales increased by 9% to US$ 10,612 million (2007:
US$ 9,720 million). This was driven by excellent organic
growth of 7%. Currency translation had a positive effect of
1%. In constant currency, sales increased by 8%. Fresenius
Medical Care generated 66% of its sales in North America,
24% in Europe, and 10% in the rest of the world.
Dialysis care accounted for 73% of sales and dialysis
products for 27%. Revenues from dialysis care increased by
7% to US$ 7,737 million (2007: US$ 7,213 million). Sales
of dialysis products grew by 15% to US$ 2,875 million (2007:
US$ 2,507 million).
EBIT rose by 6% to US$ 1,672 million (2007: US$ 1,580 million)
resulting in an EBIT margin of 15.8% (2007: 16.3%). The
margin reduction mainly reflected higher personnel expenses,
and other operating and material costs, as well as lower uti-
lization levels and reduced reimbursement rates for EPO and
increased costs for the anticoagulant Heparin in North Amer-
ica. The margins were also influenced by a stronger growth
of the dialysis services business outside North America (Inter-
national segment) coupled with start-up costs for new clin-
ics and unfavorable currency effects. Both segments experi-
enced higher depreciation expense in 2008 compared to 2007
as a result of the expansion of production capacities. These
effects were partially offset by increases in commercial payor
revenue rates, higher volumes of products sold and other
operational improvements.
Net income increased by 14% to US$ 818 million (2007:
US$ 717 million).
DIALYSIS CARE
Fresenius Medical Care is the market leader in dialysis care in
North America. We treated about 33% of all dialysis patients
in the United States in 2008.
North America Europe Latin America Asia-Pacific Total
Sales (in million US$) 7,005 2,510 491 606 10,612
Dialysis clinics (December 31) 1,686 400 177 125 2,388
Dialysis patients (December 31) 125,857 29,841 19,230 9,158 184,086
Treatments (in million) 19.1 4.5 2.9 1.4 27.9
FRESENIUS MEDICAL CARE BY REGION

28 Business Segments
Business S
egments
Major growth drivers for the positive development of the dial-
ysis care business in North America, Fresenius Medical Care’s
largest business region, were a higher average reimburse-
ment per dialysis treatment and an increased number of treat-
ments. In 2008, the average revenue per dialysis treatment
in the United States was US$ 330; US$ 3 more than in 2007.
The improvement in revenue per treatment is mainly due to
increased commercial revenue rates. Organic sales growth
in North America was 3%. The average reimbursement per
dialysis treatment and acquisitions contributed each 1% to
the growth. The divestiture and closure of clinics had a nega-
tive impact of 1%.
Outside North America, dialysis care is a highly fragmented
market. Here, Fresenius Medical Care is once again the largest
provider and market leader. Sales rose by 23% (18% in con-
stant currency). Our operating performance in Latin America
and Europe was particularly successful in 2008, with growth
rates of 22% and 18% in constant currency.
Reimbursement policies and market access differ considerably
from country to country. In some countries, private compa-
nies are not permitted to operate dialysis clinics. However,
clinic privatizations are offering additional growth opportu-
nities. This trend can be observed especially in Eastern Europe.
DIALYSIS PRODUCTS
Fresenius Medical Care is also the world market leader for
dialysis products, with a market share of about 32% in 2008.
Sales from dialysis products increased by 15% to US$
2,875 million. Sales in North America grew by 15% and in the
International segment also by 15% (11% in constant cur-
rency). The main drivers were stronger sales of hemodialysis
machines, dialyzers, blood lines, dialyses concentrates, prod-
ucts for peritoneal dialysis, as well as increased sales of the
phosphate binder PhosLo and the intravenously administered
iron products in the North American market. The iron prod-
ucts are the pivotal item of a recent license agreement.
The main dialysis products are dialyzers, hemodialysis
machines, and dialysis solutions, as well as products for
peritoneal dialysis. Dialyzers and dialysis machines are
our top-selling products. In 2008, Fresenius Medical Care
produced about 80 million dialyzers, approximately 44%
of all dialyzers sold worldwide. The majority of all hemo-
dialysis patients in the United States were being treated in
2008 with single-use dialyzers made by Fresenius Medical
Care. In its own clinics, Fresenius Medical Care uses single-
use dialyzers exclusively. This advance is expected to in-
crease life expectancy and enhance patients’ quality of life.
DIALYSIS CARE INTERNATIONAL
SALES OF DIALYSIS PRODUCTS
DIALYSIS CARE IN NORTH AMERICA
2008 2007 Change
Sales (in million US$) 6,247 6,002 4%
Dialysis clinics (December 31) 1,686 1,602 5%
Dialysis patients (December 31) 125,857 121,431 4%
Treatments (in million) 19.1 18.5 4%
2008 2007 Change
Sales (in million US$) 1,490 1,211 23%
Dialysis clinics (December 31) 702 636 10%
Dialysis patients (December 31) 58,229 52,432 11%
Treatments (in million) 8.7 8.0 9%
in million US$ 2008 2007 Change
Sales 2,875 2,507 15%
Sales North America 758 661 15%
Sales International 2,117 1,846 15%

29
Bus
ines
s S
egm
ents
We are also the market leader for dialysis machines: Of the
approximately 65,000 dialysis machines sold worldwide in
2008, over 55% were produced by Fresenius Medical Care.
International marketing of our 5008 therapy system, as well
as the ongoing demand for the 4008 therapy system, contrib-
uted significantly toward this success. In the US market
our 2008K series dialysis machines continued to be in strong
demand. Our market share for these two product groups –
dialyzers and dialysis machines – exceeded 70% of the inde-
pendent market. We define the independent market as com-
prising all dialysis clinics that do not belong to a major US-
wide dialysis care provider, such as Fresenius Medical Care
or DaVita.
The number of peritoneal dialysis patients grew by about
7% to around 190,000 worldwide; the number of patients
treated with our products increased to around 35,000. World-
wide, we hold an 18% share of that market. Our market
share in the United States was 26% in 2008.
To meet the continuously growing global demand,
Fresenius Medical Care began expanding its production
capacities at various locations in Germany in 2008: At the
St. Wendel plant in the Saarland, a total of approximately
€ 39 million was invested in the production of hollow fibers,
the key component of dialyzers, and in expanding the pro-
duction of peritoneal dialysis bags. Fresenius Medical Care is
also investing about € 25 million in the plant in Schweinfurt,
where production capacities for dialysis machines are being
expanded. The growth in production will be driven both
by currently produced models and by new product develop-
ments such as the 5008S dialysis machine.
RENAL PHARMACEUTICALS
Broadening our renal pharmaceuticals portfolio is an inte-
gral part of Fresenius Medical Care’s growth strategy. By com-
bining renal pharmaceuticals with our dialysis products and
therapies, we intend to offer holistic therapy concepts that will
give rise to even better treatment results for dialysis patients
in the future.
We estimate that the global market for renal pharmaceu-
ticals (excluding erythropoiesis-stimulating agents) is worth
over US$ 2.2 billion. Fresenius Medical Care aims to generate
sales of about US$ 400 million in this market by the year 2010.
In 2008, Fresenius Medical Care entered into a strategic
joint venture with the Swiss health care group Galenica Ltd.
and its subsidiary Vifor Pharma. The exclusive license agree-
ments cover the intravenously administered (IV) iron prod-
ucts Venofer® and Ferinject®, used to treat the iron deficiency
anemia experienced by dialysis patients. Venofer® is the
world’s leading IV iron product.
The purpose of the joint venture is to market and distribute
Venofer® and Ferinject® in Europe, the Middle East, Africa,
and Latin America. The cooperation agreement concerns all
commercialization activities for both products in the field
of dialysis and became effective on January 1, 2009. Outside
the field of dialysis, commercialization of these IV iron prod-
ucts will remain fully the responsibility of Vifor Pharma and
its existing key partners.
The total market for IV iron products in Europe, the Middle
East, Africa, and Latin America was greater than US$ 120 mil-
lion in 2007. After the first year of the agreement, Fresenius
Medical Care expects combined annual sales from the two
products to be in excess of US$ 50 million.
Fresenius Medical Care has also an exclusive US manu-
facturing and distribution sublicense for Venofer® for dialysis
with Luitpold Pharmaceuticals, Inc. (Luitpold), which is a
licensee of Galenica. In addition, the agreement includes a
similar sublicense for the next generation of iron products
for the United States and Canada. Known as Injectafer® (ferric
carboxymaltose), this injection product is expected to en-
hance the treatment of anemia in dialysis patients through the
application of innovative drug administration techniques.
Currently, the total purchases of IV iron products in the
United States amount to approximately US$ 500 million.
Venofer® has a US market share of approximately 55%. As
Fresenius Medical Care
Fresenius KabiFresenius HeliosFresenius Vamed
SummaryTo Our Shareholders Fresenius Shares Business Segments Responsibility, Environment, Sustainability

30 Business Segments
Business S
egments
part of the 10-year agreement for North America, Luitpold
has contracted to continue to manufacture the products for
Fresenius Medical Care.
We received regulatory approval for our phosphate bind-
ers PhosLo and OsvaRen in further European countries.
Cooperation with the pharmaceutical and biotech com-
pany Amgen for marketing the drug Aranesp® (darbepoetin
alfa) in Europe continued successfully. Fresenius Medical
Care supports Amgen by providing nephrologists and other
dialysis specialists with scientific information about treat-
ing anemia.
NEW 5008S DIALYSIS SYSTEM
In 2008, three years after the successful launch of the 5008
therapy system, our new 5008S dialysis system was brought
onto the market. The new system features online hemodia-
filtration, the most advanced form of dialysis treatment cur-
rently available. This therapy allows that the special fluid
required for the hemodiafiltration process is prepared inside
the machine even when it is in operation, hence the term
Online-HDF. Online hemodiafiltration has positive effects on
the main cardiovascular risk factors for kidney patients and
is a core element of Fresenius Medical Care’s cardioprotective
hemodialysis concept. This concept is designed to reduce
cardiovascular disorders and helps further improve the prog-
noses for dialysis patients.
The 5008S system, for which our development engineers
have retained the main features of the 5008 machine, was
designed with the aim of making online hemodiafiltration
available as a simple, safe, and efficient standard treatment.
The ergonomic design, user friendliness, and level of auto-
mation of the 5008 generation have made them outstanding
products.
The two therapy systems, the 5008 and the 5008S, thus
exemplify a product philosophy characterized by the best
possible therapy for the patient, the easiest administration for
nursing staff, doctors, and technicians, and the optimal use
of resources such as water and time.
TREATMENT QUALITY AND A PARADIGM SHIFT
IN REIMBURSEMENT
In 2008, fundamental changes were introduced to reimburse-
ment schemes for dialysis treatment in the United States and
Europe. The modifications are aimed in particular at achieving
more comprehensive patient care, improving its quality, and
making healthcare systems more efficient.
A new reimbursement system was mandated in the Unit-
ed States for dialysis patients covered by the public health
insurance plans, to take effect from January 1, 2011. End-
stage kidney failure is one of the few chronic diseases that is
covered by public health insurance in the United States. All
products and services that are currently included in the basic
reimbursement scheme (composite rate) and those services
hitherto reimbursed separately, such as the administration of
certain drugs and diagnostic laboratory tests, will in future
be reimbursed by a single, flat-rate fee. The bundled reim-
bursement rate will be adapted to specific characteristics of
the individual patient – such as age and weight. There will
also be adjustments for those patients whose need for excep-
tional medical care results in high costs. In addition to the
implementation of inflationary adjustments, the new regime
will require the achievement of certain quality parameters.
The reimbursement rate will, for example, be reduced for dialy-
sis clinics that fail to meet certain quality standards. These
standards include such things as the control of hemoglobin
levels (anemia management), bone mineral metabolism, and
patient satisfaction.
The changed reimbursement structures will offer advan-
tages, opportunities, and challenges to Fresenius Medical Care.
Thanks to its integrated business model, Fresenius Medical
Care will not only be able to provide all the products and serv-
ices included in the “therapy bundle” to the required quality;
it can also work in a more focused way on the further develop-
ment of its product and service portfolio.
In Portugal, where Fresenius Medical Care treats about
4,200 patients at 34 dialysis centers, the Ministry of Health
and the National Association of privately run dialysis centers

31
Bus
ines
s S
egm
ents
agreed on a new reimbursement model for ambulatory care
to hemodialysis patients at the beginning of 2008. The new
flat-rate, is an integrated and quality-driven approach that no
longer reimburses the costs of dialysis services and products
individually but bundles a variety of dialysis related services
and products. The objective is to achieve health benefits for
the patient, quality improvement and system rationalization
in the dialysis area. The new reimbursement model provides
for payment of a national reimbursement rate per week per
patient. The main characteristic is that the amount of this
reimbursement will directly depend on the fulfilment of cer-
tain treatment results and quality control parameters with
the dialysis services provided.
Given our existing high quality standards and proven
methods of monitoring therapy results, Fresenius Medical
Care has the best prerequisites to meet the new require-
ments. Including the new additional services in this reim-
bursement model, the reimbursement rate increased by
about 50% for Fresenius Medical Care. It also opens up
completely new opportunities for quality oriented R&D
on an integrated product and service offering for this market.
Portugal is the first European country opting for a bundled
reimbursement model in dialysis.
For further information,please see Fresenius Medical Care’s
Annual Report for 2008 or visit its website at www.fmc-ag.com.
Fresenius Medical Care
Fresenius KabiFresenius HeliosFresenius Vamed
SummaryTo Our Shareholders Fresenius Shares Business Segments Responsibility, Environment, Sustainability
� EXCELLENT SALES AND EARNINGS
INCREASE ACHIEVED.
� A LEADING GLOBAL MARKET POSITION IN
INTRAVENOUSLY ADMINISTERED GENERIC
DRUGS ATTAINED.
� PRODUCT PORTFOLIO FOR CANCER
TREATMENT EXPANDED.
Business Segments32
FACTS AND FIGURES 2008

33
Bus
ines
s S
egm
ents
Fresenius Medical CareFresenius Kabi
Fresenius HeliosFresenius Vamed
SummaryTo Our Shareholders Fresenius Shares Business Segments Responsibility, Environment, Sustainability
Fresenius Kabi had an outstanding year in 2008. Once again we saw strong sales and
earnings growth. The acquisitions of APP Pharmaceuticals and Dabur Pharma
marked two important advances in our progress toward global market leadership in
intravenously administered generic drugs.
Fresenius Kabi specializes in the therapy and care of chron-
ically and critically ill patients, providing clinical nutrition,
infusion therapies, and related medical devices. Our products
cover the total range for patient care: emergency cases, dur-
ing surgery, intensive care, hospital wards, and outpatient care.
For infusion therapy, we provide infusion solutions, blood
volume replacement products, and intravenously administered
generic drugs such as antibiotics, anesthetics, analgesics,
and drugs for the treatment of oncological diseases and criti-
cally ill patients. For the administration of these therapies,
we provide infusion technologies and disposables.
For transfusion technology, we offer a range of products
used by blood banks and blood donation units to produce
blood products.
For clinical nutrition, we supply parenteral and enteral
nutrition products. To administer these products, we offer a
wide range of nutrition pumps and disposables.
BUSINESS DEVELOPMENT
In 2008, Fresenius Kabi increased sales by 23% to € 2,495
million (2007: € 2,030 million). Excellent organic growth of
9% was achieved. Net acquisitions had an impact of 16%,
including the APP Pharmaceuticals and Dabur Pharma acqui-
sitions, both of which were consolidated as from September 1,
2008. Currency translation had a negative impact of 2% on
sales, mainly due to the depreciation of the currencies in
Great Britain, South Africa and Korea.
The sales growth by region was as follows:
We increased sales in all regions. In Europe (excluding Ger-
many), we achieved organic growth of 7%. In Germany,
organic growth was 3%. We again reached record rates of
organic growth outside Europe, with growth of 21% in
Asia-Pacific, 14% in Latin America. The increase in sales
in North America is due to the initial consolidation of APP
Pharmaceuticals.
FRESENIUS KABI – INTEGRATED PRODUCT PORTFOLIO
Infusion and nutrition pumps
Infusion Therapy Clinical Nutrition
Medical disposables
Infusion management systems
Infusion solutions Colloids IV drugs Parenteral Nutrition Enteral Nutrition
Med
ical
D
evic
es
in million € 2008 2007 Change
Germany 435 434 0%
Europe (ex Germany) 1,064 930 14%
Asia-Pacific 381 311 23%
North America 336 121 178%
Latin America 184 143 29%
Other regions 95 91 4%
Total 2,495 2,030 23%

34 Business Segments
Business S
egments
in million € 2008 2007 Organic growth
Infusion therapy 683 683 8%
IV drugs 563 253 11%
Clinical nutrition 845 729 10%
Medical devices/Transfusion technology 404 365 8%
Total 2,495 2,030 9%
Sales by product segment were as follows: ACQUISITIONS
Fresenius Kabi continued its growth strategy in IV drugs
in 2008 with the acquisitions of APP Pharmaceuticals and
Dabur Pharma.
� APP Pharmaceuticals has a portfolio of over 100 drugs
for oncology, intensive care, anesthesia, pain therapy, and
the treatment of infections. The company distributes its
products in the United States and Canada, and is one of
the leading players in IV drugs in the North American
hospital market. APP Pharmaceuticals has a strong drug
registration pipeline in all therapeutic areas to further
expand its product portfolio. The acquisition gives us
access to the huge US pharmaceuticals market. With
APP Pharmaceuticals as its platform, Fresenius Kabi will
be able to introduce products in the United States. At
the same time, Fresenius Kabi’s international marketing
and sales network will allow us to sell APP’s products
globally.
APP Pharmaceuticals is based in Schaumburg, Illinois,
and has approximately 1,400 employees. The company
has state-of-the-art production plants in Illinois, New York,
and Puerto Rico as well as a sales subsidiary in Canada.
In 2008, APP Pharmaceuticals achieved sales of US$ 777
million (2007: US$ 647 million). Adjusted EBITDA was
€ 317 million (2007: US$ 253 million).
� Dabur Pharma is a leading manufacturer of generic
drugs and active pharmaceutical ingredients for cancer
treatment. The company is based in New Delhi and has
two production plants in India and one in Great Britain.
Dabur Pharma achieved sales of approximately € 47 mil-
lion in the fiscal year 2007/2008 (April 1, 2007 to March
31, 2008) and has about 960 employees. After acquiring
73.3% directly from the controlling shareholders and
17.6% through a public tender offer, Fresenius Kabi cur-
rently holds approximately 90.9% of all shares in Dabur
Pharma. Owing to regulatory requirements in India,
Fresenius Kabi has to reduce its equity interest to a maxi-
mum of 90%.
We continued the excellent earnings performance of past
years. EBIT increased by 33% to € 443 million (2007:
€ 332 million), including amortization of € 8 million on intan-
gible assets from APP Pharmaceuticals. The EBIT margin
rose by 140 basis points to 17.8% (2007: 16.4%). This strong
improvement is attributable to the initial consolidation of
APP Pharmaceuticals, which has considerably higher margins.
While the EBIT margin in Fresenius Kabi’s established busi-
ness was further improved, the margin contributions from
the other acquisitions remained below this level.
All regions contributed to the very good earnings perform-
ance. In Europe, we achieved EBIT of € 323 million (2007:
€ 294 million). This corresponds to an increase of 10% and
an EBIT margin of 21.5% (2007: 21.6%). In North America,
EBIT was € 87 million (2007: € 14 million); EBIT margin was
25.9% (2007: 11.6%). This is mainly attributable to the
initial consolidation of APP Pharmaceuticals. In Asia-Pacific,
Latin America and Africa, EBIT increased by 14% to € 113
million (2007: € 99 million). The EBIT margin was 17.1%
(2007: 18.2%). Administrative and corporate research and
development expenses were € 80 million (2007: € 75 million).
Fresenius Kabi increased its net income by 9% to € 200
million (2007: € 183 million).
The special items relating to the acquisition of APP
Pharmaceuticals reported in the consolidated financial state-
ments are included in the “Corporate/Other” segment.

35
Bus
ines
s S
egm
ents
The company has an extensive portfolio of oncology
drugs that are approved in more than 40 countries.
The acquisition broadens our product portfolio in this
important therapeutic area. Through Dabur Pharma
we are insuring long-term security of supplies of high-
quality cytostatic active agents. At the same time, this
acquisition makes us one of the few suppliers of oncolog-
ical generics in the world with manufacturing exper-
tise along the entire pharmaceutical value chain, which
is particularly important for quality standards.
� At the end of the year, we acquired 51% of the Viet-
namese company Bidiphar II. This company is a leading
local supplier of infusion therapies. Bidiphar II achieved
sales of approximately € 9 million in 2008 and has about
360 employees.
INFUSION THERAPY
Infusion solutions are used widely in everyday hospital rou-
tines. Among other things, they are administered to patients
suffering fluid loss or electrolyte deficiencies. They also serve
as carrier solutions for intravenously administered drugs.
We offer a comprehensive range of products in infusion bags
and bottles for all areas of application. We successfully con-
tinued with the international roll-out of our infusion solutions
in the KabiPac® plastic bottle, begun in 2007, and introduced
them in Italy, Greece and Spain.
For blood volume replacement, we offer so-called artificial
colloids. By binding water in the cardiovascular system, they
can compensate for blood loss. Our products contain hydroxy-
ethyl starch (HES), which is derived from waxy maize starch.
The products are used mainly in surgery and for emergency
cases, and can be infused regardless of blood group. We are
the world market leader for artificial colloids. Our Voluven®
product is a reference product in this category. In 2008, we
successfully launched a new blood volume substitute called
Volulyte®. Volulyte® contains our proven HES active ingre-
dient and was specially developed for patients with high blood
loss or who need to be treated with volume substitutes over a
longer period. This can be necessary for critically ill patients
or after major surgery or for multiple injuries. Our new prod-
uct is very similar to blood plasma in its electrolyte composi-
tion. This significantly reduces the risk of over-acidification
(acidosis) of the blood by chloride. If the blood is overly acid-
ified, the acid base balance in the blood is disturbed and the
pH value becomes too low. Acidosis can cause nausea, vomit-
ing, abdominal discomfort and in severe cases lead to im-
paired organ function and even death. Thanks to long years
of medical experience with Voluven®, we expect our new
product Volulyte® to establish itself quickly in the markets. Its
market introduction was begun in Germany, the United
Kingdom, and the Netherlands in June 2008.
Our extensive range of IV drugs is used mainly in the treat-
ment of critically ill hospital patients, for instance in intensive
care or emergency cases and after surgery. In 2008, we con-
tinued to internationalize our product range and introduced
products in various countries.
Our anesthetic Propofol Fresenius is used for inducing
and maintaining narcosis. We achieved strong sales growth
with this product in the Asia-Pacific region in the past year.
With the acquisition of APP Pharmaceuticals, which also mar-
kets Propofol, Fresenius Kabi has become the world market
leader for this anesthetic.
Following the launch of new products in the North Ameri-
can market, APP Pharmaceuticals strengthened its position
as a leading supplier of IV drugs in the field of antibiotics.
Dabur Pharma offers an extensive portfolio of cytostatics
for cancer treatment. In the past year the company worked
intensively on the registration of further cytostatics for the
European and US markets. Market launches are planned
for 2009 and 2010.
Our continued success with medical devices for the appli-
cation of infusion therapies consolidated our position as one
of the leading suppliers of these products in Europe. In the
past year we successfully launched the volumetric infusion
pump Volumat® MC Agilia® in the Scandinavian countries,
Fresenius Medical CareFresenius Kabi
Fresenius HeliosFresenius Vamed
SummaryTo Our Shareholders Fresenius Shares Business Segments Responsibility, Environment, Sustainability

36 Business Segments
Business S
egments
among others. Another product of the Agilia family, the syringe
pump Injectomat® TIVA Agilia®, was marketed for the first
time in Germany, the United Kingdom, Norway, and Switzer-
land. This syringe pump has been specially developed for
administering anesthetics and is therefore used primarily in
intensive care and during surgery.
In transfusion technology, we are one of Europe’s leading
suppliers of blood bag systems and medical devices for col-
lecting, processing, and transporting blood products. We are
a leading supplier in Europe and South America of in-line
filter systems, i.e. blood bags with an integrated filter. In 2008,
we successfully launched our CompoDock Data Management
product and the related DockMaster Net software in Germany,
the Netherlands, and in Italy.
CLINICAL NUTRITION
Fresenius Kabi is one of the few companies in the world to
offer parenteral as well as enteral nutrition therapies, including
the related medical devices. Both forms of clinical nutrition
serve to supply patients who are unable to eat any or sufficient
normal food. This applies especially to patients in intensive
care units, to the severely and chronically ill, and to those
that are malnourished.
We are one of the world’s leading suppliers of three-cham-
ber bag products. Our bags supply a patient’s entire required
daily intake of amino acids, lipids, glucose, and electrolytes.
We introduced the first three-chamber bags in 1999. The new
design that we launched two years ago has become well
established in our markets. Its safety factor has been an impor-
tant consideration in establishing the bag’s concept for every-
day hospital use. For example, the arrows on the closure caps
of the two ports immediately distinguish the infusion port from
the injection port. Nor do the ports need to be disinfected
before they are used for the first time since the ports’ mem-
brane is sterile. We are now selling the newly designed
three-chamber bag in almost every market in Europe as well
as in Australia, Argentina, and South Africa. In the past year
we also introduced the product in South Korea.
We are also one of the world’s leading suppliers of paren-
teral lipids. SMOFlipid® and Intralipid® are the main lipid
components in our range. SMOFlipid® is used especially in
nutrition therapies for intensive care patients. We are mar-
keting the product very successfully in over 25 countries. In
2008, we introduced it in Egypt, Taiwan, Malaysia, and Sin-
gapore, among others.
In the field of enteral nutrition, we launched the new sip
feeds Fresubin® 2 kcal DRINK and Fresubin® 2 kcal fibre
DRINK in Germany, Austria, the United Kingdom, Scandina-
via, and Switzerland, among other countries. With 2 kcals
per milliliter, we have given these products a higher energy
density than our earlier Fresubin® family products had. As
a result, the volume that has to be ingested to supply the body
with sufficient nutrients is lower compared to other sip
feeds. Fresubin® 2 kcal DRINK is rich in energy and proteins.
Thanks to this combination, the sip feed is not only suitable
for elderly patients suffering loss of appetite or who have
difficulty chewing and swallowing due to illness but is also
ideal for the needs-specific care of patients, such as dialy-
sis patients, who require a higher energy and protein intake
but can only ingest small amounts of liquid. The new sip
feeds have a delicious flavor. The variety of our range of prod-
ucts also helps prevent patients from taste fatigue.
We have also launched a new formulation in our pediatric
sip and tube feed products. Our Frebini® range has been
optimized in terms of its fat, fiber, and micronutrient compo-
sition. In addition to reformulating our Frebini® original and
Frebini® energy lines, we have further improved the taste of
the Frebini® sip feeds and added a vanilla flavor.
We have also increased the energy density of our
ProvideXtra® sip feed. This product now has an energy con-
tent of 1.5 kcal/ml and a protein content of 4.0 g/100 ml.
ProvideXtra® is a milk-protein and fat-free sip feed with juice
37
Bus
ines
s S
egm
ents
characteristics which is rich in vitamins and trace elements.
The product is used in the dietary treatment of patients
with increased energy needs and/or limited digestive and
absorption abilities, for instance patients suffering from
Morbus Crohn’s disease or short bowel syndrome.
We are also constantly working to develop new packag-
ing concepts for our enteral nutrition products that will provide
optimum convenience. For instance, in the past year we in-
troduced our new EasyBottle packaging which will replace the
present Tetra Brik® packaging for sip feeds. The EasyBottle
is designed for secure gripping and maximum handling con-
venience. To meet patients’ differing needs around the world,
the EasyBottle is available with two different closure systems:
with an integrated drinking aid and with a screw cap. The
integrated drinking aid enables patients to drink directly from
the bottle – without an extra straw. The shape of the drinking
aid ensures a clear seal between the lips and the bottle, which
can aid older patients for instance. It also has a smaller dia-
meter so that patients can also drink when lying down. The
EasyBottle with screw cap is supplied with a drinking straw.
The EasyBottle’s special design makes it easy to hold, trans-
port and store. It also prevents the bottle from rolling away
should it be dropped. In the past year, Fresubin® energy Drink
and Fresubin® protein energy Drink were the first products
we offered in the new EasyBottle.
In the field of medical devices for the application of clini-
cal nutrition, we are one of the leading providers in Europe.
We extended our international presence in 2008: Our Ambix®
activ infusion pump, which is used for outpatient parenteral
nutrition, was launched in the United Kingdom, Ireland, Poland,
Sweden, Norway, and South Africa.
Fresenius Medical CareFresenius Kabi
Fresenius HeliosFresenius Vamed
SummaryTo Our Shareholders Fresenius Shares Business Segments Responsibility, Environment, Sustainability

� POSITION IN THE GERMAN HOSPITAL
MARKET EXPANDED.
� EXCELLENT ORGANIC GROWTH OF
5% ACHIEVED.
� HELIOS CLINICS KREFELD SUCCESS-
FULLY INTEGRATED.
Business Segments38
FACTS AND FIGURES 2008

39
Bus
ines
s S
egm
ents
Fresenius Medical CareFresenius KabiFresenius Helios
Fresenius Vamed
SummaryTo Our Shareholders Fresenius Shares Business Segments Responsibility, Environment, Sustainability
At HELIOS’ established clinics, sales rose by 5% to € 1,921
million. EBIT improved by 18% to € 181 million. The EBIT
margin was 9.4% (2007: 8.4%). The acquired clinics (consol-
idation < 1 year) achieved sales of € 202 million and an EBIT
of € -6 million.
Fresenius Helios is a well-recognized partner in the German acute care market privatiza-
tion. In 2008, we deliberately continued our growth strategy, acquired one hospital and
announced the acquisition of five additional clinics. The integration of the HELIOS clinics
in Krefeld was successfully continued. In the past year, Fresenius Helios achieved sales
of € 2.1 billion and increased earnings significantly.
HELIOS operates 62 clinics with more than 18,000 beds,
including five maximum care clinics in Berlin-Buch, Erfurt,
Krefeld, Schwerin, and Wuppertal where about 600,000
inpatients were treated, today. In addition to the 43 acute
care hospitals, the HELIOS Group includes 19 postacute
care clinics. The company had over 30,000 employees at
the end of 2008.
BUSINESS DEVELOPMENT
In 2008, Fresenius Helios increased its sales by 15% to € 2,123
million (2007: € 1,841 million). Very good organic growth of
5% was achieved (2007: 3%), driven by a gratifying rise in
the number of inpatient and outpatient admissions. Acquisi-
tions, especially the acquisition of HELIOS Klinikum Krefeld,
contributed 11% to sales growth. Divestitures reduced sales
by 1%. Fresenius Vamed acquired four clinics in the Czech
Republic from Fresenius Helios, with effect as of October 22,
2008. Together, the clinics generated total sales of approxi-
mately € 24 million.
As the table shows, earnings were much improved:
EBITDA increased 14% to € 251 million (2007: € 220 million).
The EBITDA margin was 11.8% (2007: 12.0%). Fresenius
Helios achieved an EBIT growth of 13% to € 175 million
(2007: € 155 million), corresponding to an EBIT margin of
8.2% (2007: 8.4%). We achieved this very good result
despite a number of negative factors. Earnings were affected
particularly by a loss at the HELIOS Klinikum in Krefeld in its
first year of consolidation. An additional factor was the
0.5% budget cut for the stabilization of public health costs.
This will not apply in 2009. Net income rose by 25% to € 80
million (2007: € 64 million).
The hospital operations business exhibits stable cash flows,
thanks to the reimbursement by health insurers. In 2008, days
sales outstanding were 38 days (2007: 43 days). The loss on
revenue was at 0.3% (2007: 0.3%).
GROWTH IN HOSPITAL ADMISSIONS
AND TREATMENTS
The introduction of Diagnosis Related Groups (DRGs), with
standardized base rates in each federal state, means hospitals
in Germany face increasing competition for patients. The
HELIOS clinics have successfully adjusted to the changed reim-
bursement and competitive conditions. Due to the broaden-
ing of services being offered and our high quality standards,
we were again able to increase the number of inpatients
in million € 2008 2007 Change
Sales 2,123 1,841 15%
EBITDA 251 220 14%
EBITDA margin (%) 11.8 12.0
EBIT 175 155 13%
EBIT margin (%) 8.2 8.4
Net income 80 64 25%

40 Business Segments
Business S
egments
treated in Germany. These rose in 2008 to a total of 543,383,
an excellent growth of 15% (2007: 476,477). The number of
outpatients treated rose substantially by 26% to 1,418,325
(2007: 1,127,613).
Other performance indicators were as follows: At the acute
care hospitals, the average length of stay was 7.1 days (2007:
7.1 days). Occupancy at the postacute care clinics was 83%
(2007: 82%).
INVESTMENTS IN HOSPITAL BUILDINGS
In 2008, Fresenius Helios invested € 200 million in its clinics
(2007: € 401 million). Own investments amounted to € 135 mil-
lion (2007: € 149 million). The slight decrease is due to the
completion of the new Berlin-Buch hospital building in 2007.
Approximately € 37 million was invested at this hospital in
2008 (2007: about € 75 million). HELIOS also invested about
€ 16 million of its own funds in Schwerin. In 2008, HELIOS
approved the designs for the new buildings to be constructed
at the two clinics in Krefeld. The overall investment cost is
approximately € 180 million. These investments assure high
standards of medical quality long-term and enhance the
clinics’ profitability.
WAGE TARIFF AGREEMENTS NEGOTIATED
HELIOS aims to present itself as an attractive employer. HELIOS
concluded the first trade union wage tariff agreement in
the German hospital market with ver.di (the United Services
Union), in force since the end of 2006, followed by an agree-
ment with the Marburger Bund, in force since the beginning
of 2007. On October 1, 2008, HELIOS concluded a follow-on
tariff agreement with the Marburger Bund.
The group wage tariff agreement with ver.di was also
extended to cover other non-medical staff, particularly employ-
ees of the former HUMAINE acute care clinics in Bad Saarow,
Dresden, and Plauen. All HELIOS clinic staff are to be succes-
sively integrated into the group wage tariff agreement. In
this way, we shall be creating a homogeneous tariff structure
that contains clear incentives, with a focus on career paths
that cover training as well as reconciling the interests of fam-
ily and career.
EXPANSION SUCCESSFULLY CONTINUED
HELIOS’ business model is based on growth through acqui-
sitions. One element of our acquisition strategy is the regional
proximity of hospitals – sufficiently close to one another to
form networks (clusters). Regional clustering enables cost sav-
ings, especially by concentrating non-medical services (for
example, laundry or catering) in one hospital.
Our focus is on high standards of medical quality and
patient care. In the postacquisition phase, the reorganization
of processes and the implementation of HELIOS’ proven
in million € 2008 2007 Change
Investments 200 401 -50%
Own investments in property, plant, and equipment 135 149 -9%
Subsidies* 60 78 -23%
Acquisitions 5 174 –
* Total of purpose-related public investment subsidies according to section 9 of the Hospital Funding Act (Krankenhausfinanzierungsgesetz).
2008 2007 Change
Acute care clinics 38 40 -5%
Beds 13,733 13,333 3%
Length of stay (days)* 7.1 7.1 –
Postacute care clinics 19 20 -5%
Beds 3,516 3,859 -9%
Length of stay (days)* 30.1 31.9 -6%
Occupancy* 83% 82% –
* Germany only
2008 2007 Change
Inpatient and semi-
inpatient admissions 548,383 476,477 15%
Acute care clinics 513,990 442,383 16%
Postacute care clinics 34,393 34,094 1%
Outpatient admissions 1,418,325 1,127,613 26%
41
Bus
ines
s S
egm
ents
quality management system have led to focused, profit-ori-
ented hospital management. The aim is to increase the
EBITDA margin of a stand-alone hospital to 15% within five
years of consolidation.
HELIOS continued to expand successfully in the German
hospital market in the past year. The Mariahilf hospital in
Hamburg-Harburg was integrated into the HELIOS Kliniken
Group in August 2008. The hospital has a total of 185 beds
in the specialist areas of internal medicine, surgery, pediatrics,
neonatology, gynecology, and obstetrics.
In December 2008, HELIOS announced the acquisition
of three hospitals in the Mansfeld-Südharz county of Saxony-
Anhalt and two hospitals in the Northeim county of Lower
Saxony. Together, the five clinics generated total revenues of
approximately € 136 million in 2007. HELIOS successfully
closed the transactions in February 2009.
As an experienced privatization partner, HELIOS is in an
excellent position to make further acquisitions and will con-
tinue to focus on expanding its market position in Germany.
Great strides were made in integrating the HELIOS clinics
in Krefeld and Hüls that were first consolidated at the begin-
ning of 2008. The number of admissions rose by 7% in their
first year of affiliation, attributable to the swift implementa-
tion of medical, structural, and personnel decisions. Their inte-
gration into the established HELIOS quality management
system also contributed to this success.
GOAL: BEST-IN-CLASS MEDICAL RESULTS
In 2008, HELIOS continued its successful program for
improving the quality of its medical results. A unique quality
management system, developed in-house, assures con-
tinuous improvement in the standards of patient care. For
more information on quality management and the medi-
cal quality initiative co-sponsored by HELIOS, please see
the Management Report, page 88.
HELIOS has been pioneering the development of quality
indicators on the basis of administrative data since 2000. The
set of indicators currently used, which provides information on
the medical services performed and the quality of the results
for critical ailments in a standardized and comparable form,
is the most comprehensive in the German hospital market.
Not only applied at HELIOS, it is also considered at well over
200 other clinics in Germany and abroad – for instance in
Switzerland. In many areas, mortality rates at the HELIOS
clinics are 15% to 25% below the German average or a
comparable international benchmark. For further informa-
tion, please see page 10 of this annual report.
The QSR hospital reports (Qualitätssicherung der statio-
nären Versorgung mit Routinedaten – Securing quality of
inpatient treatment with administrative data) published by
health insurer AOK are an important extension of the quality
indicators based on hospital stays that HELIOS has already
been publishing for years. Since the indicators measured
within the hospital say nothing about how ailments may
develop after patients are discharged, HELIOS clinics have
been working with the National AOK Association and other
partners to develop indicators for long-term quality results
derived from health insurers’ existing administrative data.
The QSR hospital reports of AOK enable a standardized evalua-
tion of long-term results of medical treatment in all German
clinics. HELIOS was the first hospital group that published
this new significant quality information for all HELIOS clinics.
The QSR results, like the HELIOS indicators that have been
published for some time, show HELIOS to have a quality lead
over the national average in many areas.
Continuous quality improvement at HELIOS clearly requires
an optimal cost-effective organization of the processes and
the treatment procedures at our clinics. In 2009, we will con-
tinue to work in all major areas toward our goal of achieving
levels of treatment quality that are higher than the German
average or other generally accepted international standards.
You will find more information on the German hospital
market on pages 70 to 71 and 101 to 102 in the Management
Report.
Fresenius Medical CareFresenius KabiFresenius Helios
Fresenius Vamed
SummaryTo Our Shareholders Fresenius Shares Business Segments Responsibility, Environment, Sustainability
� STRONG SALES AND EARNINGS GROWTH
ACHIEVED.
� NEW RECORD IN ORDER INTAKE.
� WELL-POSITIONED FOR FURTHER GROWTH.
Business Segments42
FACTS AND FIGURES 2008

43
Bus
ines
s S
egm
ents
Fresenius Medical CareFresenius KabiFresenius HeliosFresenius Vamed
SummaryTo Our Shareholders Fresenius Shares Business Segments Responsibility, Environment, Sustainability
BUSINESS DEVELOPMENT
In 2008, Fresenius Vamed increased sales by 28% to € 524
million (2007: € 408 million). The table shows the sales devel-
opment by activity:
Fresenius Vamed had a successful year in 2008 with sales growth of 28% and
EBIT growth of 15%. Order intake and order backlog also developed excellently
and provide a solid basis for further growth.
Fresenius Vamed specializes in international projects for hos-
pitals and other health care facilities. The portfolio ranges
from project development, planning and turnkey construction,
via maintenance, technical, commercial and infrastructure
services as well as the total operational management. VAMED
offers a complete value chain to support hospitals efficiently
and successfully at each level of their life cycle. The company
is also a pioneer in public-private partnership (PPP) models
for hospitals in Central Europe. Founded in 1982, VAMED has
grown from a small project company to become one of the
world’s leading providers of a full line of services for the health
care industry. Meanwhile, we hold a unique position with
our comprehensive portfolio of services. We have completed
approximately 470 projects in 50 countries.
Fresenius Vamed has the following structure:
Fresenius Vamed
Project business
- Project management and consulting
- Planning, engineering and contracting
Service business
- Facility management- Technical and total opera-
tional management of healthcare facilities
In 2008, the strongest region was Europe with 73% of total
sales. Both Asia-Pacific and Africa accounted for 13% of total
sales.
In addition, VAMED was responsible for revenues of
approximately € 470 million from management contracts in
2008. The related fees are included in VAMED’s financial
statements.
in million € 2008 2007 Change
Project business 336 259 30%
Service business 188 149 26%
SALES BY REGION
Europe 73%
Asia-Pacific 13%
Africa 13%
Latin America 1%
2008: € 524 million
44 Business Segments
Business S
egments
Order intake and order backlog for projects improved strongly
as follows:
Earnings performance at Fresenius Vamed was very positive.
In 2008, EBIT rose by 15% to € 30 million (2007: € 26 mil-
lion), with an EBIT margin of 5.7% (2007: 6.4%).
Since the individual areas of activity are not capital inten-
sive, Fresenius Vamed achieved an excellent return on equity
(ROE) before taxes of 22.2% (2007: 22.9%).
Fresenius Vamed’s net income was € 26 million, an increase
of 13% (2007: € 23 million).
PROJECT BUSINESS
The project business comprises the consulting, project devel-
opment, planning, turnkey construction and financing manage-
ment of projects. VAMED responds flexibly to clients’ local
needs, providing custom-tailored solutions, all from one source.
VAMED also carries out projects in cooperation with partners.
Among public clients in particular there is growing interest
in public-private partnerships (PPPs). With these business
models hospitals or other health care facilities are planned,
constructed, financed and operated by public and private
partners through a joint project company.
Our project business was again very successful in 2008. In
Gabon, one of our key markets in Africa, VAMED completed
and handed over three regional hospitals. Work was begun on
the project development for the extension of the central hos-
pital in Libreville and for a new regional hospital with attached
oncology unit. We also won a contract for the construction
and equipment of a supra-regional medical training center for
African physicians. The center is located near the regional
hospital at Libreville planned, constructed and operated by
VAMED.
In Ghana, another key market, VAMED was awarded the con-
tract for the turnkey construction of five polyclinics. In Nigeria,
VAMED began work on the extension of six university clinics.
We were able to win further projects as well.
In Sri Lanka, VAMED successfully entered the market
with a contract for the supply of medical equipment for 20
hospitals across the country.
In China, a market where VAMED has already been oper-
ating successfully for many years, a total of five new contracts
were won for the supply of medical equipment for a number
of hospitals. To further strengthen our position, we also con-
tinued to pursue various joint venture projects. Here, the
focus is especially on contracts for the turnkey construction
of hospitals.
In Russia, work was successfully continued on the turnkey
construction of a 300-bed hospital in Krasnodar. Our cover-
age of the markets in Azerbaijan, Kazakhstan, Uzbekistan and
Turkmenistan was continued intensively in 2008. We have
already won several planning contracts and a project for the
supply of medical equipment.
In VAMED’s home market, Austria, the focus was on the
development of further PPP projects and holistic realization
models. Additional project assignments were successfully
executed within the framework of existing private-public part-
nerships. A number of other PPP projects are currently being
developed in Central Europe.
In partnership with the City of Vienna, the thermal center
in Vienna-Oberlaa is currently being expanded into a unique
health and wellness center. This mega project – the only ther-
mal center of this size in a European city – is due to be com-
pleted by the year 2011. The contract for this project is worth
over € 100 million.
Work was begun on another thermal center project, the
Tauern SPA World in the Kaprun/Salzburg region. VAMED
is the developer, general contractor and future operator of
this € 80 million project.
In Vorarlberg, the go-ahead was given for the construction
of the 150-bed Montafon postacute care clinic. This clinic
will remedy the lack of facilities for inpatient postacute care
in million € 2008 2007 Change
Order intake 425 395 8%
Order backlog (December 31) 571 510 12%

45
Bus
ines
s S
egm
ents
in the region. When the project is completed, VAMED will also
be responsible for the clinic’s total operational management
under long-term contract.
Approval was also issued in 2008 for the construction of
the Neurological Therapy Center in Gmunderberg, Upper
Austria, with about 150 beds. VAMED will be responsible for
the planning and construction of this project and later for
the total operational management of the facility.
SERVICE BUSINESS
VAMED offers a full range of facility management services for
health care facilities from consulting, planning and execu-
tion to total operational management. Modular in design, our
service offering encompasses every aspect of technical, com-
mercial and infrastructural facility management, ranging from
building and equipment maintenance, medical technology
management, waste management, energy management, clean-
ing of buildings and outdoor facilities, security services,
through to technical management. With this integrated port-
folio of services we guarantee optimal operation of a facility
over its entire life cycle, from the construction of the buildings
to the end of primary use, modernization or renewal. In addi-
tion to facility management, VAMED also specializes in logis-
tics for the health care industry. By optimizing the processes,
logistics costs are minimized while still maintaining the nec-
essary supply standards.
In the field of hospital services, the partnership with AKH
in Vienna has been successfully continued. As well as VAMED’s
technical management role, which we have been perform-
ing since 1986, this also included a number of structural build-
ing projects. AKH comprises 31 clinics and institutes with a
total of about 2,100 beds. With the PPP contract for the tech-
nical management of two hospitals in Lower Austria with a
total of 1,230 beds, VAMED also succeeded in winning the
second largest contract of this kind ever awarded in Austria.
A project of special interest is the PPP model in Oberndorf
near Salzburg. Here, VAMED has been engaged to operate
the existing acute care hospital, make structural improvements
and extend it, and with the construction of a new medical
and postacute care center develop the site into an integrated
health care facility.
In Germany, the service contract with the university clinic
in Hamburg Eppendorf was renewed for another three years
until 2013 on the basis of the successful cooperation in the
past. Under the service contract with the Charité University
Clinic in Berlin the consortium headed by VAMED is respon-
sible for all operations at Charité except the purely medical
services. The approximately 2,300 employees of Charité CFM
Facility Management GmbH, the company set up specially
for this purpose, again carried out their services to the cus-
tomer’s complete satisfaction in 2008.
At the beginning of 2008, VAMED acquired the German
company HERMED Technische Beratungs GmbH. HERMED
specializes in the maintenance, repair and operation of med-
ical equipment in hospitals, primarily for small to mid-sized
units. HERMED also provides consulting and planning services
in the medical equipment of hospitals. With the acquisition
of HERMED and its further successful development in 2008,
we gained access to new customer and market segments.
In Gabon, VAMED is responsible for the overall manage-
ment of a total of seven regional hospitals and for the technical
management of a hospital in Libreville. In Libya, the Medical
Center Tripoli is one of the most important technical manage-
ment reference projects. This service contract was renewed
for another two years in 2008.
Our total operational management of both the 450-bed Al
Ain Clinic in Abu Dhabi and the exclusive 330-bed Petronas
Clinic in Kuala Lumpur, Malaysia, was successfully continued.
These two projects are being conducted in cooperation with
the Vienna University of Medicine and are important reference
projects for VAMED’s all-round competence in the Arab and
South-east Asia regions.
In Europe, the focus of VAMED’s activities will be on holis-
tic realization and PPP projects in 2009. Outside Europe, the
focus will be on custom-tailored solutions for hospitals along
the VAMED value chain.
Fresenius Medical CareFresenius KabiFresenius HeliosFresenius Vamed
SummaryTo Our Shareholders Fresenius Shares Business Segments Responsibility, Environment, Sustainability
� CONTINUITY OF PERSONNEL DEVELOPMENT
IS OF HIGHEST IMPORTANCE AT FRESENIUS.
� THE QUALITY OF OUR PRODUCTS AND THER-
APIES IS ESSENTIAL FOR BEST-IN-CLASS
MEDICAL CARE.
� WE ARE CONSTANTLY STRIVING TO IMPROVE
OUR ENVIRONMENTAL MANAGEMENT.
Responsibility, Environment, Sustainability 46
RESPONSIBILITY,
ENVIRONMENT, SUSTAINABILITY

47SummaryTo Our Shareholders Fresenius Shares Business Segments Responsibility, Environment, Sustainability
Employees
Research and developmentEnvironmental management
Sus
tain
abili
ty
Our products provide optimum care for the severely and chron-
ically ill. To the patients’ benefit, we are constantly striving
to develop new therapies and to improve the performance of
existing products.
Our employees are the foundation of our company’s suc-
cess. We are committed to further the development of our
employees through a wide range of measures and actively
promote international and divisional cooperation.
Our processes conform to the highest quality and safety
standards as well as the needs of environmental protection and
thus the conservation of natural resources.
EMPLOYEES
The high qualification standards and commitment of our
employees are the basis of our growth, evidenced by the wide-
ranging opportunities offered to employees for assuming
responsibility early in their careers. The Fresenius Group is
a favored employer, not only for national and international
university graduates, school leavers, and qualified specialists
but also for internships and degree projects.
The successes achieved in our personnel activities have
encouraged us to address other challenging projects. In addi-
tion to employee development and personnel marketing, we
are also focusing on the management of demographic change.
A distinctive impact of the demographic development is that
fewer young employees will be available. So, an important
strategic task is to prepare our staff for a longer working life
and to offer even more attractive career opportunities for young
employees.
EMPLOYEE DEVELOPMENT AND PERSONNEL
MARKETING
Employee development at Fresenius aims to prepare employ-
ees for the dynamic business developments that lie ahead, and
to support them in responding to changes and opportunities
early on by accepting these as a positive challenge. Since
needs in the various business segments differ, all employee
development concepts are formulated and implemented
according to specific requirements.
In the development of international top management exec-
utives, we again collaborated successfully in the past year
with our longstanding partner, the INSEAD Business School,
with locations in Fontainebleau, Singapore, and Abu Dhabi.
A special focus was on the international networking of the
course participants. The resulting personal, strategic, and pro-
cedural challenges are part of the current program.
Another target is providing the various business segments
and their employees with professional support when faced
with growth-induced organizational changes. Organizational
development measures can, for instance, build on segment-
specific employee surveys which form the basis for tailored
concepts.
Fresenius also continuously supports its employees
through a comprehensive range of training measures to en-
hance their professional, personal, and leadership skills,
designed to develop and tap their individual strengths. The
targeted, organized transfer of an employee’s know-how
to a successor makes sure that the knowledge does not
get lost.
By defining both our corporate goals and our internal processes for the long term,
we can make sure that our activities meet the needs of patients, employees, and
third parties on a sustainable basis.

48 Responsibility, Environment, Sustainability
Sustainability
An important module here is our trainee program, which has
become an established entry opportunity for high-potential
junior specialists and managers in all business segments.
We have continued to expand our personnel marketing
activities in order to reach interested and suitable potential
employees and persuade them to further their careers with
Fresenius. This is particularly important since most people
only come into contact with our products and services in
extreme personal situations. Consequently, activities such as
our presence at careers fairs at selected universities, and
presentations given by our employees at careers events, are
a vital aspect of our personnel marketing activities. We con-
tinually update the careers section of our website. A new ele-
ment – an electronic e-recruiting system – has been added.
This tool not only facilitates the job application process, mak-
ing it faster and more transparent, but also enhances the
contact between interested applicants and our company dur-
ing the application phase. Our aim is to be the employer of
choice for high-potential job applicants. More information is
available at www.fresenius.com/Career.
To make HELIOS more attractive to job applicants, the
company has also created an online application tool where
applicants can find out about vacancies and apply online. The
response to the HELIOS careers portal is very positive. Over
8,000 applications were received by the end of December 2008.
More information is available at www.helios-kliniken.de/
Careers.
In 2008, HELIOS again significantly widened the range of
seminars the HELIOS Academy offers for various professional
groups. The most important of these are the hands-on courses
(e.g. basic principles of minimal invasion surgery) and spe-
cialist seminars (e.g. dealing with emergencies in anesthesia)
in special simulation centers. Here, HELIOS employees have
the opportunity to learn the basics or acquire specialist know-
how, pool experiences, and improve procedures. The spec-
trum of modular training programs – especially for nursing
care – has been extended. In addition to the fields of man-
agement, coaching, and anesthesia/intensive care, modules
are now also offered for surgery staff. The seminars offered
by the HELIOS Academy are being supplemented by an ever
wider offering of online modules: All employees have round-
the-clock access to online modules on specific themes, rang-
ing from the right action in the event of clinical emergencies
through to performing injections. More information on the
training opportunities offered by HELIOS is available at
www.helios-akademie.de.
We have also extended our development programs for
middle management medical and nursing staff. As in the past,
employees can broaden and deepen their leadership skills
through a combination of seminars/workshops and work on
an interdisciplinary project, in this way preparing themselves
for advanced management positions at HELIOS. In 2009,
we plan to resume our executive development program in the
area of Management. To align the development of future
management staff with the Group’s sustained growth, we have
significantly broadened our trainee programs in the areas
of Hospital Management, Finance&Controlling, and Purchas-
ing&Logistics, and added the field of Medical Equipment.
The Bachelor in Nursing Care, the first-ever degree course
for nursing staff, was launched in Germany during the past
year. This course, developed in collaboration by HELIOS and
SRH Fachhochschule Gera, is directed at qualified nurses
wishing to pursue further academic professional training and
to acquire additional competence in nursing care manage-
ment and medical science. Offered as a sandwich course, the
degree course is practice-oriented. The major subjects are
anesthesiology/anesthesia care or intensive medicine/inten-
sive care, with a further module chosen from the areas of
emergency medicine/emergency care, pain therapy/pain man-
agement, oncology and palliative medicine/care or diseases
of old-age and diseases of civilization. The curriculum aims
to provide for the future demands of day-to-day hospital life,
thus catering for the concrete skill profiles required by Ger-
man clinics.

49
Sus
tain
abili
ty
SummaryTo Our Shareholders Fresenius Shares Business Segments Responsibility, Environment, Sustainability
Employees
Research and developmentEnvironmental management
VOCATIONAL TRAINING
The professional training of young people is an important
means of securing a company’s future. Fresenius is very well
positioned in this respect. In Germany, at the end of 2008,
we employed about 1,300 young people in apprenticeships
in 34 different job categories and over 20 students were
studying at vocational training academies. In 2008, we were
again able to increase the number of apprenticeships offered
at all our training locations by over 10%, having previously
increased our intake by over 30% in 2007.
To promote entrepreneurial thinking and interpersonal,
communication, and business skills in our apprentices,
we organized a management game once again in 2008. It
met with a strong response, with a total of 13 teams from
different locations competing. The apprentices were required
to run a fictitious firm for one year, where decisions had
to be taken on investments, inventory levels, recruitments,
marketing schemes, etc.
By making use of more intensive marketing in and with
schools, we want to attract even more able young people
to take up apprenticeships with Fresenius. We invite school
students to visit us and provide job application guidance,
and also offer various training courses within the Arbeitskreis
SchuleWirtschaft (School and Industry Working Group) for
teachers. In September 2008, with the title “Training Live,”
we held our second Open Day for vocational training at
our corporate headquarters. The many guests were able to
find out about the apprenticeships offered within the Group
and the courses of study available at the vocational train-
ing academies, and recognize our appeal as a provider of
vocational training. Our intensified marketing measures
have already yielded positive results: Contrary to general
trends in the apprenticeship market, we received many
more high-quality applications in 2008.
Vocational training begins with a five-week course during
which the apprentices not only learn computer skills but
are also encouraged to develop their personal skills, with the
emphasis on improving communication skills, teamwork,
and project management. Additionally, the apprentices at our
corporate headquarters can attend a free English-language
course.
At the beginning of December 2008, our apprentices for the
first time took part in the innovation game “Jugend denkt
Zukunft” (“Youth Thinks Future”), held at many companies
throughout Germany with government support. The aim
is to encourage apprentices to think about their company’s
future and to devise new products and services for the 2020
market. The competitors spent one week at a future-work-
shop, where they considered the theme “Innovative Concepts
for Future Customer Service” in discussions with company
representatives regarding forward-looking product develop-
ment and marketing processes. They put forward their ideas
and recommendations in a concluding presentation.
PROFIT-SHARING SCHEME AND
STOCK OPTION PLAN
Fresenius employees in Germany have been sharing in the
company’s financial success for over 10 years. In the form of
Fresenius SE preference shares, we provide a long-term,
value-oriented performance incentive. The level of the annual
bonus is based on Group operating profit (EBIT). Employ-
ees can receive either the full amount in shares or two-thirds
of the amount in shares and the rest in cash.
Our executive employees also share in the company’s per-
formance. On May 21, 2008, the Annual General Meeting
approved a new stock option plan for the Management Board
of Fresenius SE and certain other executive employees. Under
this plan a total of up to 6,200,000 subscription rights for
Fresenius SE ordinary and preference shares can be issued
over a period of five years. Since 1998, Fresenius has been
providing a value-based incentive for its executive employees,
linked to the company’s performance. The subscription rights
issued under the current plan can be exercised after a three-
year vesting period if the adjusted net income has increased
at an annual rate of at least 8% during the vesting period. If
this rate is not achieved in one or more years of the vesting
period, the subscription rights granted are forfeited propor-
tionally. The new stock option plan offers an internationally
attractive compensation instrument, linking management’s
entrepreneurial responsibility to the risks and opportunities
of our company’s future development. In 2008, 1,099,102 sub-
scription rights were issued under this plan. Further informa-
tion can be found on page 173 of the Notes.
50 Responsibility, Environment, Sustainability
Sustainability
RESEARCH AND DEVELOPMENT
We place great importance on research and development at
Fresenius, where we develop products and therapies for
severely and chronically ill patients. High quality is crucial
for providing patients with optimal care, improving their
quality of life, and thus increasing their life expectancy. As
an integral part of our corporate strategy, research and
development also serves to secure the Company’s economic
growth and success.
DIALYSIS
Research and development at Fresenius Medical Care is
focused on products and therapies for dialysis and other extra-
corporeal blood therapies. The company benefits from its
vertical integration, covering both dialysis products and dialy-
sis care. The daily experience we gain from treating around
184,086 patients provides important insights for the develop-
ment of new products and therapies, and is therefore of
enormous value. It also fosters the development of holistic
therapies.
Hemodialysis
A main focus of our development work in 2008 was on online
hemodiafiltration (Online-HDF) and the 5008S hemodialysis
machine. With the development of the 5008 therapy system, we
have upgraded Online-HDF from an exclusive technology for
just a few users into a standard feature included in the basic
version of the machine. The liquid required for the hemodia-
filtration process – a sterile and pyrogen-free dialysis solution –
is now produced from standard bicarbonate dialysate in the
machine itself while it is running – hence the name “Online-
HDF”. There are no bags of liquid to be changed. In 2008,
we launched the 5008S hemodialysis machine, a further devel-
opment of the 5008 therapy system, on the European mar-
ket. Its operation has been simplified and improved, and fur-
ther safety and control mechanisms have been added. For
instance, the flow rate of the dialysate is automatically adjusted
to the dialysis patient’s individual blood flow rate. We expect
the 5008S dialysis system, which can be operated intuitively,
to help establish Online-HDF worldwide in kidney replacement
therapy. We will continue to use the 5008 therapy system
as a platform for further improving our products and adding
new features.
The Body Composition Monitor (BCM) was introduced
on the market in 2007. The BCM is a device that can be used
to determine the dialysis patient’s body composition, i. e.
body water, fat-free body mass, and fat. Exact knowledge of
this data, especially the percentage of body water, is impor-
tant for assessing the patient’s condition and deciding on the
therapy. As the BCM is not yet a standard medical device,
Fresenius Medical Care is cooperating closely with clinical
experts who report on their experience with the BCM at
clinics after introducing the device. The findings will provide
important guidance for our customer service’s consulting
work. The BCM and its further development will continue to
be a focus of our development work in future.
With the acquisition of the US company Renal Solutions,
Inc. (RSI) in 2007, an important step forward was made in
integrating radically new functionalities in medical devices.
RSI is an internationally renowned specialist in the field of
dialysate regeneration using enzyme-based sorbent systems.
RSI’s SORB technology enables ordinary tap water to be pre-
pared for dialysis, and for the dialysis solution to be reused.
Only six liters of tap water are required per dialysis treatment,
instead of the approximately 120 liters of ultra-pure water from
reverse osmosis systems previously. In addition to ecologi-
cal and financial considerations, this technology also allows
a substantial reduction in the size of the dialysis machines.
An aspect of this technology of particular interest to us is that
it points to possibilities for selective toxin removal from the
patient’s blood. In the coming years we will be focusing on the
development of further innovative solutions for home dialysis.

51
Sus
tain
abili
ty
SummaryTo Our Shareholders Fresenius Shares Business Segments Responsibility, Environment, Sustainability
EmployeesResearch and development
Environmental management
Peritoneal dialysis
Peritoneal dialysis is an optimal home therapy for early-stage
treatment of kidney failure, when the kidney still partially
functions. In peritoneal dialysis, our portfolio of individually
tailored, biocompatible dialysis solutions – using toxicolog-
ically and ecologically compatible packaging systems – tradi-
tionally covers a broad spectrum of products for all applica-
tions. We are therefore excellently positioned in the market.
We also have high-performance machines for automated
peritoneal dialysis (APD) – so-called cyclers. In its efforts to
offer high-quality ADPs worldwide at optimized cost, the R & D
department is currently working on a global cycler. Devel-
oping a uniform technological platform for this cycler is an
important step along this path. A cycler developed specif-
ically for the US market was approved by the U.S. Food and
Drug Administration (FDA) in 2008. The response from cus-
tomers to date has been extremely positive. We are planning
on enhancing this cycler to make it one of our core products
in the US and contribute to gaining additional market share.
Fresenius Medical Care also offers software-assisted peri-
toneal dialysis treatment. With the PatientOnLine software,
the clinic staff can monitor the patients’ treatment individually,
which is an important help in insuring the quality of the ther-
apy. A new version of the software was released in 2008. This
enables the doctor to assess the patient’s current condition
even more reliably. Owing to its high standard of quality the
new version bears the CE (Conformité Européene) mark of
conformity issued under the European Union Medical Device
Directive. This means that this software version is a certified
medical device. With the CE mark of conformity, Fresenius
Medical Care guarantees that PatientOnLine conforms to the
statutory health, safety and environmental protection stand-
ards prevailing in the EU.
INFUSION THERAPY AND CLINICAL NUTRITION
Fresenius Kabi’s research and development activities are
focused on infusion therapy and clinical nutrition. Our devel-
opment competence spans all product-relevant components:
the primary packaging, pharmaceutical solutions for infusion
therapy and clinical nutrition, medical devices for applica-
tion and the manufacturing technology for their production.
We are also a leader in the development of generic drugs
that are administered intravenously (IV drugs).
Our research and development strategy is built on two
pillars:
� the development of innovative products in product areas
where we hold a leading position, such as blood volume
substitution and clinical nutrition;
� continuous improvement of our pharmaceutical products
and medical devices.
In this way we are making an important contribution toward
achieving medical advancements in the therapy of critically
and chronically ill patients and for improving their quality
of life.
Infusion therapy
For decades, the use of blood volume substitution products in
emergency and intensive care medicine has been a focus of
research and development at Fresenius Kabi. Our blood vol-
ume substitution products contain hydroxyethyl starch (HES)
based on waxy maize starch. HES molecules adhere to the
fluid in a blood vessel, thus insuring that the fluid remains in
the vessel and does not pass rapidly into the surrounding
cells and tissue. More than 100 studies have confirmed the
clinical efficacy of HES.
In 2008, we continued our research and development
efforts in the area of blood volume substitutes, thereby
strengthening the evidence base for the high safety and

52 Responsibility, Environment, Sustainability
Sustainability
efficacy of our products. We are currently supporting four
controlled, randomized, double-blind studies with our prod-
uct Voluven® 6% for sepsis, trauma, dialysis, and cesarean
patients.
We also made further progress with our HESylation®
technology. This enables an active pharmaceutical substance
to be coupled to specific hydroxyethyl starch molecules,
decisively modifying a drug’s profile. Such coupled products
usually have a longer half-life and a better the safety profile
than unmodified drugs. In partnerships with pharmaceutical
companies, we are working to further develop the potential
of this technology.
In the field of intravenously administered generic drugs
(IV drugs) we focus on antiinfectives, anesthetics, analgesics
and drugs that are used in oncological diseases as well as with
critically ill patients. In our development portfolio we have an
extensive range of active substances that will be ready for
market launch in the coming years. We are working on the
registration dossiers for their marketing authorization in
Europe and outside Europe. With the acquisition of APP Phar-
maceuticals, United States, and Dabur Pharma, India, we
have substantially enlarged our research and development
capacities for IV drugs. Both companies have high compe-
tence in the further development of pharmaceutical active
agents for intravenous administration and a strong pipeline
of promising drugs in the regulatory approval phase.
In 2008, we submitted the registration files for the approv-
al of 11 IV drugs to the European regulatory authorities and
expect to be able to launch these products on the market in
2009 and 2010. We plan, for instance, to broaden our port-
folio of antibiotics for severe infections and to introduce fur-
ther anesthetics.
We have also begun an international rollout of the drugs
obtained with the acquisition of Dabur Pharma. These prod-
ucts are cytostatics, drugs which inhibit cell growth or cell
division and are used primarily in chemotherapy for the treat-
ment of cancer. In 2008, we received regulatory approval
for marketing further cytostatic products in several European
countries.
The acquisition of APP Pharmaceuticals enabled us to inte-
grate another development team with extensive know-how and
experience in the development of IV drugs into our organi-
zation. Based in the United States, the team concentrates on
pharmaceutical products used to treat critically ill patients
in intensive and emergency care. Although APP Pharmaceu-
ticals currently only operates in the US market, in the mid-
term the APP Pharmaceuticals products will supplement our
portfolio of IV products also outside the United States.
Clinical nutrition
In parenteral nutrition we concentrate on the development of
pharmaceutical products that have a high therapeutic effect
in the care of critically and chronically ill patients. We focus on
two areas:
� innovative parenteral nutrition products to support and
improve the therapy of patients in hospital;
� innovative containers, e. g. multi-chamber bags that
allow maximum safety in application and convenient,
and daily clinical use.
In 2008, we submitted documentation for regulatory approval
of the use of SMOFlipid® in pediatric care. SMOFlipid® is a
lipid emulsion with four different lipid components:
� soybean oil serves as a reliable source of essential fatty
acids;
� medium-chain triglycerides (MCT) provide a quick supply
of energy;
� olive oil supplies mono-unsaturated fatty acids that have
an immune-neutral effect;
� fish oil supplies poly-unsaturated fatty acids that have an
anti-inflammatory effect.
This special lipid concept has proven clinical benefits over
traditional lipid emulsions and is very well established in the
53
Sus
tain
abili
ty
market. We believe the high therapeutic relevance in par-
enteral nutrition can also play an important role in the treat-
ment of critically ill children.
In 2008, we completed the registration procedure for
SMOFKabiven® and plan to launch it in the market in 2009.
SMOFKabiven® is a three-chamber bag containing SMOFlipid®
as lipid component.
The use of the amino acid glutamine in parenteral nutrition
therapy has been our development work for decades. In 2008,
we received regulatory approval for higher intravenous doses
of glutamine containing dipeptides for the European market.
Our product Dipeptiven® is a concentrate of alanyl glutamine
that, subject to compatibility, can be added to any parenteral
nutrition regime. The amino acid glutamine is conditionally
essential – not vital for healthy people but necessary for
severely ill patients in a catabolic metabolic condition – for
instance following trauma, surgery, or with sepsis. Glutamine
is required in large amounts as a source of energy and nitro-
gen by the intestinal and immune cells of these patients, serv-
ing to maintain the structure and functioning of the intestine.
If these patients are not supplied with glutamine, they can
suffer a glutamine deficiency and associated functional dis-
orders.
In the area of enteral nutrition products we continued
our development projects, conducted within the framework
of our innovation program. This aims to integrate the latest
insights – not only in medical and nutritional science but also
in food and process technology – into our product develop-
ment. Here, our emphasis is currently on products for the ther-
apy areas of diabetes, dysphagia, oncology, and for critically
ill patients. An example of a project we have been working on
is a product concept that can be used especially with diabe-
tes mellitus patients who have impaired glucose tolerance.
We also continued our work on the development of a
product line for dysphagia patients and will be launching the
new products in 2009. Dysphagia is the term used to refer
to difficulties in controlling the swallowing process. This con-
dition can have a wide range of causes – for instance stroke,
cancer diseases, neurological conditions, and Parkinson’s
disease. In patients with dysphagia the swallowing reflex is
delayed or does not function at all. This can cause aspiration
if as a result of the lack of muscle coordination, solid or
liquid matter enters the respiratory tract. If aspiration goes
undetected, there is a heightened risk of pneumonia. Both
nutritional deficiencies and dehydration can be effectively
remedied with a product line specially designed for this
group of patients.
ANTIBODY THERAPIES
Fresenius Biotech develops innovative therapies with tri-
functional antibodies for the treatment of cancer. For many
years Fresenius Biotech has been successfully marketing
ATG-Fresenius S, a polyclonal antibody. This is an immuno-
suppressive agent used to suppress and treat graft rejection
following organ transplantation.
Trifunctional antibodies
Fresenius Biotech filed the application for approval of the tri-
functional antibody Removab® (INN: catumaxomab) with
the European regulatory authority, the European Medicines
Agency (EMEA), at the end of 2007. Application has been
made for the intraperitoneal treatment of patients with malig-
nant ascites following epithelial tumors where standard ther-
apies are not available or are no longer feasible. The review
and the response to questions raised by the authority in
May and October proceeded as planned. We received a posi-
tive opinion from EMEA‘s Committee for Medicinal Products
for Human Use (CHMP) in February 2009. The approval by
the European Commission is expected within a few months.
The decision, which is usually based on the CHMP opinion,
will apply to all EU member states. Removab® would be the
first drug worldwide with a regulatory label for the treat-
ment of malignant ascites. Fresenius Biotech is prepared to
launch Removab® upon approval. Removab® has received
orphan drug status in Switzerland for each of the indications
of malignant ascites, gastric cancer and ovarian cancer.
SummaryTo Our Shareholders Fresenius Shares Business Segments Responsibility, Environment, Sustainability
EmployeesResearch and development
Environmental management

54 Responsibility, Environment, Sustainability
Sustainability
The Swiss health authority (Swiss Medic) assigns orphan
drug status to drugs for treating fatal or chronic diseases
affecting not more than five out of 10,000 people in Switzer-
land for which there is currently no, or no adequate, possi-
bility for treatment.
Parallel with the approval process, the CASIMAS study, a
randomized phase IIIb study, was begun in key European
countries. This study is examining tolerability, safety and
effectiveness of treatment with Removab® of ascites patients
receiving co-medication with a corticosteroid.
New data from further evaluations of the pivotal study
in the area of malignant ascites that supported the clinical
benefits of Removab® were delivered for the first time in an
oral presentation at the Annual Congress of the American
Society of Clinical Oncology (ASCO) in 2008. Analyses at the
primary endpoint of the study and at important secondary
endpoints had already shown that treatment with Removab®
significantly prolongs median puncture-free survival. A pos-
itive trend was also observed for overall survival.
Clinical studies of the indications of gastric and ovarian
cancer were continued and have produced their first results
on the use of the trifunctional antibody catumaxomab as
intra-operative medication in adjuvant treatment situations.
An adjuvant therapy is administered at very early stages of
cancer diseases and, following the complete removal of the
tumor tissue, aims to destroy any tumor cells that might still
exist but are not visible.
A Phase II study with the trifunctional antibody catumaxo-
mab in the treatment of patients with gastric cancer showed
the antibody was well tolerated. The primary endpoint of the
study – safety and tolerability of Removab® administration
after tumor resection – was achieved.
The recruitment of patients was completed for the develop-
ment program for the phase II studies with ovarian cancer in
the United States and Europe. For the first time the European
study examined safety and tolerability on intra-operative
administration of catumaxomab on ovarian cancer patients
after a first treatment. In the US study, patients with
advanced ovarian cancer were treated.
The trifunctional antibody ertumaxomab is being developed
for the treatment of metastasized breast cancer and is cur-
rently being examined in phase II studies as a mono-therapy
in Europe and the United States. The studies conducted in
Europe focus on patients with low Her2/neu expression. The
study currently in progress in the United States is examining
the effect of ertumaxomab on patients with Her2/neu over-
expression on whom previous therapies have failed.
Immunosuppressive agent ATG-Fresenius S
Sales of ATG-Fresenius S increased by 8% to approximately
€ 21 million (2007: € 19 million). Preclinical and clinical
development for other applications and distribution in new
markets was continued. The clinical study for the use of
ATG-Fresenius S in the prophylaxis of acute Graft-versus-Host
disease (GvHd) in stem cell transplantation produced first
positive intermediate results on its efficacy and safety. They
were presented at the American Society for Hematology
Congress. The final report will be published at the end of the
two-year post-treatment observation period in 2009. A first
approval has been issued for the prophylaxis of GvHd in a
European country (Portugal). Others are expected to follow
in 2009.
The study with ATG-Fresenius S in lung transplantation
in the United States that was taken over in 2007 continued
successfully. The study compares the effects of two different
ATG dosage regimes and a placebo (double-blinded and pla-
cebo controlled) on organ rejection and mortality rates among
patients six months and 12 months after transplantation.
ATG-Fresenius S has received orphan drug status from the
U.S. Food and Drug Administration (FDA) for the prophy-
laxis of acute organ rejection in the area of solid organ trans-
plantation on adults.
ENVIRONMENTAL MANAGEMENT
We are committed to protecting nature as the basis of life and
to using its resources responsibly. We strive to constantly
improve our performance in environmental protection, occu-
pational health, technical safety, product responsibility and
logistics, and to comply with legal requirements. The interna-
tional ISO Standard 14001:2004 provides the benchmark for

55
Sus
tain
abili
ty
environmental protection in the corporate sector. Among other
things, it stresses the need for continuous assessment of a
production site’s impact on the environment, for instance with
regard to emissions and waste. These international stand-
ards have been implemented at our various production plants
and dialysis clinics.
FRESENIUS MEDICAL CARE
Fresenius Medical Care already established an environmental
program in 2007 that covers Europe, the Middle East and
Africa and defines specific goals to be achieved by the year
2010. These include:
� Definition of environment-relevant performance indicators
for all participating production facilities
� Further improvement of energy efficiency and the avoid-
ance of emissions
� Implementation of a feasibility study on the use of alterna-
tive energy generation methods at a sample production site
� Improvement of the recycling rate from currently just over
70% to 85%
� Training and raising the awareness of our employees on
environmental protection and environmental management
issues, and
� Optimization of the eco-controlling system for our fast-
growing number of dialysis clinics in Europe.
In 2008, the extension to one of the production units at our
plant in Schweinfurt, Germany, was taken into operation.
The building is equipped with a heat recovery system and
an automated fresh air supply system, dispensing with the
need for air-conditioning and making it very economical in
terms of energy consumption. Production processes were
also improved and made more environment-friendly at a num-
ber of other plants in Germany, France and Italy: the scope
of the plastic raw materials used was increased.
Another environmental project launched in 2008 was the
implementation of the new EU chemicals directive REACH
(Registration, Evaluation, Authorisation and Restriction of
Chemicals). A focus was on assessing the risks if certain
raw materials are not available in future. This led to the formu-
lation of appropriate precautionary measures, such as the
exchange of information with suppliers and advance ordering
of strategically important materials. Fresenius Medical Care
is an active member of the REACH working group of the Fed-
eral Association of the Medical Device Industry (BVMed)
in Germany.
At the largest industry trade fair EDTA (European Dialysis
and Transplant Association), we presented the SmartBag, a
resource-saving packaging solution. This primary container
for dialysis concentrates is PVC-free, and contains 80% less
plastic and produces 90% less waste than the conventional
Duroplastic containers. It can also be recycled very well as it
consists of polyolefins.
In the past years Fresenius Medical Care has introduced
a number of environment-friendly products. Biofine® for
instance is a proprietary plastic developed by us that consists
only of carbon and hydrogen (polyolefin). It is 60% thinner
than PVC and is easy to recycle. Owing to its many advantages
Fresenius Medical Care today produces most of its perito-
neal dialysis products with Biofine®. A major achievement in
2008 was the award of the Nordic Ecolabel (“SWAN”). The
Nordic Ecolabel organization certified several product lines
and the related accessories, all of which are completely PVC-
free. Nordic Ecolabel is the officially recognized labeling
organization for eco-friendly products in Norway, Sweden and
Finland, and in Iceland and Denmark. The Nordic Ecolabel
is also recognized in other countries for its high quality stand-
ards. These standards apply not only to the environment-
friendly product qualities, but also to the production processes.
The environmental system based on ISO 14001 is to be ex-
tended and further dialysis clinics will be certified in 2009. We
will be focusing this year on our clinics in Spain and Romania.
In Sweden, we are seeking certification to ISO 9001. In addi-
tion, we will be pressing on with our “Energy squeeze” effi-
ciency initiative at our principal European plants. Our target is
to reduce energy consumption at these plants by 5%, which
would represent cost savings of about € 1 million in the cur-
rent year. We will continue implementing the objectives
of our environmental program.
SummaryTo Our Shareholders Fresenius Shares Business Segments Responsibility, Environment, Sustainability
EmployeesResearch and developmentEnvironmental management

56 Responsibility, Environment, Sustainability
Sustainability
In the United States, we are already recycling an average of
1,752 tons of paper and cardboard each year. This avoids 1,226
tons of CO2 emissions, saves some 160,000 liters of fuel,
approximately 46.6 million liters of water and 7.2 million KWh
of electricity, and prevents the felling of about 29,700 trees.
We intend to continue pursuing our selectively focused envi-
ronmental activities in future.
FRESENIUS KABI
Fresenius Kabi assumes active responsibility for environ-
mental protection. The emphasis at Fresenius Kabi is on con-
tinuous improvement of product quality in order to benefit
the patient. This goes hand in hand with environmental meas-
ures that take local regulations into account. In 2008, certi-
fication to environment standard 14001:2004 was rolled out
to further locations, for instance in India and China.
The materials recycling system at our plant in Friedberg,
Germany, was further optimized in 2008. About 5,900 tons
of waste was recycled, the recycling rate increasing slightly
to approximately 95% in 2008 (2007: > 94%). In addition
to optimizing building facilities and process equipment, a new
heating system for the high-bay warehouse achieved sav-
ings of 700,000 KWh in thermal energy in 2008 – equivalent
to a reduction of CO2 emissions by approximately 180,000
tons. The heating is controlled via the central building control
system that regulates the rundown at night and switches
off the air-conditioning systems or lowers their level of opera-
tion. The central building control system itself was also opti-
mized. This now features a programmable control unit that
rapidly detects and eliminates any faults, records any devia-
tions from set values, and evaluates energy data. With this
technology Fresenius Kabi not only reduced its energy con-
sumption but CO2 emissions were also lowered.
The water treatment plant for production was fitted with
a membrane degassing module. In industrial processes, the
quality and purity of the water used – in terms of concentra-
tions of dissolved gases in the water – plays an important
role. The membrane continuously removes the dissolved gases
from the water. Since no chemicals are used, the membrane
degassing process is especially environmentally friendly.
A project group had already been set up at the Friedberg
plant in 2006 to implement energy-saving measures. In 2008,
the lighting was switched to a modern, energy-saving tech-
nology. When completed, this project will result in annual
electricity savings in the region of 78,000 KWh, equivalent to
a reduction in CO2 emissions of about 40,000 tons per year.
Fresenius Kabi invested a total of € 140,000 in these measures
at the Friedberg plant.
Fresenius Kabi will continue to implement measures
that optimize energy consumption and thus reduce CO2 emis-
sions. The use of regenerative energies is currently being
reviewed. We expect the first results in 2009. Parallel with
this, Fresenius Kabi is constructing a combined heat and
power unit for the plant’s energy supply. It is expected to
come onstream in mid-2009 and will generate approxi-
mately 1.8 million KWh of heat and about 1 million KWh of
electricity per year. This will cover about 50% of the heat
and about 5% of the electricity consumed at the Friedberg
plant, and will also reduce CO2 emissions significantly.
Beyond the primary objective of environmental protec-
tion, the measures undertaken in 2008 also significantly
reduced energy costs.
At our plant in Graz, Austria, the implementation of the
environmental management system to ISO 14001:2004 and
its certification was successfully completed in January 2008.
The certification of the Linz site is planned for 2009.
In 2008, projects were carried out in Graz to optimize
existing energy provisions. We are analyzing the consumption
of energy and other resources and conducting technical fea-
sibility studies, partly in collaboration with universities, to
identify potential savings. However, the aim of the projects is
not only to reduce energy costs but also to optimize the tech-
nical equipment and to boost the responsible use of resources.
Fresenius Kabi also optimized the management of produc-
tion materials at the Graz plant. Production materials are all
those elements that have to be considered in the production
process, i.e. not only input materials and intermediate prod-
ucts but also waste and any unforeseen contaminating sub-
stances that may be produced. A database-assisted system
coordinates critical material data to assure optimum protec-
tion for employees and the environment. This includes instruc-
tion for employees, special storage for certain materials,
57
Sus
tain
abili
ty
and transportation and handling regulations that have to
be observed. The collection and sorting of waste was also
improved. The recycling rate was further increased through
extended sort-clean waste separation. Sort-clean waste
separation is to be further improved by means of training
and internal audits.
At our plants in Uppsala and Brunna, Sweden, we contin-
ued to reduce our emissions of greenhouse gases. In 2008,
the volume of pharmaceutical waste was reduced by more than
30%. In Uppsala alone our waste disposal costs were cut
by about 50%. Among other things, investments were made
in a screw compactor and a compactor for corrugated card-
board. The screw compactor enables packaging materials for
liquid medications to be completely drained, thus eliminat-
ing the reliance on outside parties to dispose of the bags.
The waste compactor compresses the cardboard for disposal,
significantly reducing transport costs. Several other waste
management projects were initiated, aimed at reducing the
volume of waste and, equally, at organizing the disposal of
the waste in the most environmentally sound and efficient
manner.
FRESENIUS HELIOS
HELIOS had already organized waste disposal at its clinics
according to previously set legal standards. The goal is cost-
efficient and environmentally compatible waste disposal.
We see waste management as a process that begins with pur-
chasing – employing all the instruments of the German Pack-
aging Code – and ends with systematic recycling, for exam-
ple recycling solvents or the resale of infusion glass bottles.
All waste materials are recorded using a standardized sys-
tem and classified in corresponding waste categories. We use
this data, for instance, as a basis for deciding whether to
conclude contracts with regional waste management compa-
nies or to have a groupwide contract with one company.
In 2008, HELIOS launched a pilot environmental project
at the HELIOS clinic in Bad Berleburg. The aim is to achieve
reductions in all important energy and emissions areas. In
addition, extensive information is to be distributed to instruct
employees and patients on how everyone can make a per-
sonal contribution toward active environmental protection by
saving energy. HELIOS is training employees from various
units at the Bad Berleburg clinic to serve as information con-
tacts for colleagues and patients and by actively supporting
them in implementing energy saving measures. A part of the
energy costs saved at the clinic is being invested in an envi-
ronmental project. An energy-savings barometer has been
installed at the site to make the effectiveness of the measures
evident to all the employees. It shows how much energy has
been consumed, and the reduction achieved, in comparison to
the previous year. The environmental project is due to end
in April 2009 with a final recording of the amount of energy
saved.
FRESENIUS VAMED
In the future, health care systems will also have to pay greater
attention to sustainability. This factor must, especially, be
taken into account in the hospital sector. As an active contri-
bution toward environmental protection, VAMED already
integrates national environmental standards and regulations
into the planning and construction of a hospital or other
health care facility. VAMED is responsible, among other things,
for the technical management of the Vienna General Hospi-
tal and University Clinic (AKH), one of the largest hospitals in
Austria with over 10,000 employees. Together with the AKH,
VAMED has implemented a range of measures designed to
conserve energy, especially in the areas of air-conditioning and
heat recovery. The target set in the Kyoto Protocol, to reduce
greenhouse gas emissions by 5.2%, has already been achieved
in 2008, representing a reduction of emissions by approxi-
mately 134,000 tons to about 123,000 tons of CO2 per year.
VAMED measures the hospital’s emissions on a CO2 equivalent
basis. This is a standard measure that converts greenhouse
gas emissions into the equivalent amount of CO2, also taking
into account other greenhouse gases in order to achieve the
Kyoto target, enabling companies to demonstrate the effective-
ness of environmental and climate protection measures. The
AKH, together with VAMED, has set itself the target of reduc-
ing greenhouse gas emissions by 2012 by three times the
amount required by the Kyoto Protocol.
SummaryTo Our Shareholders Fresenius Shares Business Segments Responsibility, Environment, Sustainability
EmployeesResearch and developmentEnvironmental management

� 59 OPERATIONS AND BUSINESS ENVIRONMENT
59 Group structure and business
59 Management and control
60 Key products, services and business processes
60 Important markets and competitive position
60 Legal and economic factors
61 Capital, shareholders, statutes
62 Corporate performance criteria, goals and strategy
63 Strategy and goals
64 Research and development
65 Overall business development
65 Economic environment
67 Health care industry
71 The Management Board’s assessment of the effect of
general economic developments and those in the
health care sector for Fresenius
71 Significant factors affecting operating performance
72 The Management Board’s assessment of the
business results
72 Comparison of the actual business results with the
forecasts
� 72 RESULTS OF OPERATIONS, FINANCIAL
POSITION, ASSETS, AND LIABILITIES
72 Results of operations
72 Sales
74 Earnings structure
75 Reconciliation to adjusted earnings
76 Development of other major items in the statement
of income
76 Value added
77 Financial position
77 Financial management policies and goals
77 Financing
79 Effect of off-balance-sheet financing instruments on
our financial position and assets and liabilities
79 Liquidity analysis
80 Dividend
CONTENT MANAGEMENT REPORT
58
80 Cash flow analysis
80 Investments and acquisitions
81 Assets and liabilities
81 Asset and liability structure
83 Currency and interest risk management
� 83 NON-FINANCIAL PERFORMANCE INDICATORS
AND OTHER SUCCESS FACTORS
83 Employees
84 Procurement
86 Quality management
89 Sales, marketing, and logistics
� 90 OVERALL ASSESSMENT OF THE BUSINESS
SITUATION
� 90 OPPORTUNITIES AND RISK REPORT
90 Opportunities management
90 Risk management
91 Risk areas
96 Assessment of overall risk
96 Corporate rating
� 97 SUBSEQUENT EVENTS
� 97 OUTLOOK
97 General and mid-term outlook
98 Future markets
98 Economic outlook
100 Health care sector and markets
102 Group sales and Group earnings
103 Sales and earnings by business segment
103 Financing
104 Investments
104 Procurement
105 Research and development
105 Corporate legal structure and organization
105 Planned changes in human resources and the social area
105 Dividend
Management Report
59
Man
agem
ent
Rep
ort
Operations and business environment
Results of operations, financial position, assets, and liabilitiesNon-financial performance indicators and other success factors
Overall assessment of the business situationOpportunities and risk reportSubsequent eventsOutlook
Management Report Report Supervisory Board Management Board Supervisory BoardConsolidated Financial Statements Glossary
For the Fresenius Group, 2008 was an outstanding year. We again achieved record levels
in sales and earnings in every business segment. The acquisition of APP Pharmaceuticals,
a leading US manufacturer, enabled Fresenius Kabi to enter the North American market
for intravenously administered generic drugs.
OPERATIONS AND BUSINESS ENVIRONMENT
GROUP STRUCTURE AND BUSINESS
Fresenius is an international health care group providing
products and services for dialysis, hospitals, and outpatient
medical care. In addition, Fresenius specializes in hospital
operations and offers hospital engineering and services for
hospitals and other health care facilities. Our legal form is
that of a European Company (Societas Europaea or SE), hav-
ing converted from a German stock corporation, or AG, when
our entry in the Commercial Register became effective on
July 13, 2007. The operational business comprises the busi-
ness segments Fresenius Medical Care, Fresenius Kabi,
Fresenius Helios, and Fresenius Vamed, all of which are legal-
ly independent entities managed by the operating parent
company Fresenius SE. This group structure has been in place
since January 1, 2008 and has not changed in the reporting
period.
� Fresenius Medical Care concentrates on dialysis care,
manufacturing and marketing products for the treatment
of patients with end stage renal disease (ESRD).
� Fresenius Kabi specializes in the production and sale of
products for infusion therapy and clinical nutrition as well
as intravenously administered generic drugs (IV drugs)
and transfusion technology.
� Fresenius Helios operates hospitals and had a network of
57 clinics, 56 in Germany and one in Switzerland, as of
December 31, 2008.
� Fresenius Vamed provides engineering and services for
hospitals and other health care facilities internationally.
� The segment Corporate/Other comprises the holding ac-
tivities of Fresenius SE, the IT service provider Fresenius
Netcare, and Fresenius Biotech. Fresenius Biotech is
active in research and development in the field of antibody
therapies. Corporate/Other also includes the consolida-
tion measures conducted between the business segments.
The Fresenius Group operates internationally and all the busi-
ness segments have a regional and decentralized structure.
Responsibilities are clearly defined in line with the company’s
“entrepreneurship within the enterprise” management prin-
ciple. Additionally, management responsibility is reinforced by
an earnings orientated and target-linked compensation sys-
tem. Fresenius has an international marketing and production
network consisting of about 70 production sites worldwide.
Key production sites are located in the United States, China,
Japan, Germany, and Sweden. Production plants are also
located in other European countries, Latin America, Asia-
Pacific, and South Africa. This international production net-
work allows us to implement our business model while meet-
ing the most exacting logistics and regulatory requirements.
The decentralized structure of the production sites also sub-
stantially reduces transportation costs and currency exposure.
Management and control
The corporate bodies of the group are the Management
Board, the Supervisory Board, and the General Meeting. In
accordance with Regulation No. 2157/2001 on the Statute
for a European Company (SE), Fresenius SE has a two-tier
management and control system consisting of the Manage-
ment Board and the Supervisory Board. The two boards
work independently of each other and no one is allowed to
be a member of both simultaneously.
60 Management Report
Managem
ent Report
ysis care providers in more than 115 countries. Fresenius
Kabi is one of the few companies to offer a comprehensive
range of enteral and parenteral nutrition therapies. The com-
pany also offers a broad spectrum of products for fluid and
blood volume replacement as well as an extensive portfolio of
IV drugs. Fresenius Kabi sells its products mainly to hospi-
tals in approximately 100 countries. Fresenius Helios operates
hospitals mainly in Germany. Fresenius Vamed provides
engineering and services for hospitals and health care facili-
ties internationally.
Important markets and competitive position
Fresenius operates in more than 60 countries through its sub-
sidiaries. The main markets are Europe and North America,
where Fresenius generates 45% and 41% of its sales, respec-
tively.
Fresenius Medical Care is the largest dialysis company in
the world. Fresenius Kabi holds leading positions in Europe
and in the growth markets of Asia-Pacific, Latin America, and
South Africa. With the acquisition of APP Pharmaceuticals,
Fresenius Kabi has become one of the leading suppliers of IV
drugs in the United States. Fresenius Helios is a leading pri-
vate hospital operator in Germany. Fresenius Vamed is one
of the internationally leading companies in the field of health
care engineering and services.
Legal and economic factors
The intrinsic importance of the life-saving and life-sustaining
products and therapies that the group offers insures that
the markets of the Fresenius Group are fundamentally stable
and relatively independent of economic cycles. Furthermore,
these markets are expanding, mainly for three reasons: demo-
graphics, the demand for innovative therapies in the indus-
trialized countries, and the increasing availability of high-qual-
ity health care in the developing and newly industrializing
countries.
The statement of income and the balance sheet can be
influenced by currency translation effects as a result of
exchange rate fluctuations, especially the rate of the US dol-
lar to the euro, which had a pronounced effect in 2008.
The Management Board of Fresenius SE conducts the busi-
ness and represents the company in dealings with third par-
ties. As from January 1, 2008, the Management Board has
seven members. According to the Management Board’s rules
of procedure, each member is accountable for their own area
of responsibility, but all have joint responsibility for the man-
agement of the group. The Management Board is required to
report to the Supervisory Board regularly, in particular on
corporate policy and strategy, profitability, current operations,
and any other matters that could be of significance for the
company’s profitability and liquidity.
The Supervisory Board appoints the members of the
Management Board and advises and supervises the Manage-
ment Board in its management of the Company, but is pro-
hibited from managing the Company directly. However, the
Management Board’s rules of procedure require it to obtain
the Supervisory Board’s approval for specific activities.
The Supervisory Board is comprised of six shareholders’
representatives and six employees’ representatives. All 12
members of the Supervisory Board are appointed by the Gen-
eral Meeting. The employees’ six representatives must be
appointed on the basis of a proposal put forward by the em-
ployees and must be accepted by the General Meeting. In
accordance with the legal form of an SE, the employee repre-
sentatives may come from various European countries.
The Supervisory Board must meet at least twice per calen-
dar half-year. The appointment and dismissal of the mem-
bers of the Management Board is in accordance with Article
39 of the SE Regulations. The statutes of Fresenius SE also
provide that deputy members of the Management Board may
be appointed.
For information on Management Board and the Super-
visory Board compensation, please see pages 180 to 184 of
the Notes.
Key products, services and business processes
Fresenius Medical Care offers a comprehensive range of prod-
ucts for hemodialysis and peritoneal dialysis and provides
dialysis care at its own clinics in over 30 countries. Dialysis
products are sold both to group clinics and to external dial-

61
Man
agem
ent
Rep
ort
Operations and business environment
Results of operations, financial position, assets, and liabilitiesNon-financial performance indicators and other success factors
Overall assessment of the business situationOpportunities and risk reportSubsequent eventsOutlook
Management Report Report Supervisory Board Management Board Supervisory BoardConsolidated Financial Statements Glossary
This impacted: first, on the statement of income due to the
changed average annual exchange rate between these cur-
rencies of 1.47 in 2008 compared to 1.37 in 2007; and second,
on the balance sheet due to the changed spot rate of 1.39
as of December 31, 2008 compared to 1.47 as of December
31, 2007.
There were no legal aspects that significantly affected the
business performance in 2008.
Capital, shareholders, statutes
The summary below shows the subscribed capital of
Fresenius SE.
The shares of Fresenius SE are non-par value bearer
shares. The subscribed capital is divided into an equal num-
ber of ordinary and preference shares. Shareholders’ rights
are regulated by the Statute for a European Company (SE)
and the German Stock Corporation Act (AktG). Additionally,
the articles of association of Fresenius SE contain the fol-
lowing three provisions for the holders of non-voting prefer-
ence shares:
1. From retained earnings for the year they will receive a div-
idend of least € 0.02 per preference share and higher by
€ 0.01 per preference share than that for an ordinary share.
2. The minimum dividend payable on preference shares
takes precedence over payment of a dividend on ordinary
shares.
3. If retained earnings in one or more fiscal years are not
sufficient to pay a dividend of € 0.02 per preference share,
the amounts not distributed will be paid in arrears, without
interest, from the retained earnings in subsequent fiscal
years, after distributing the minimum preference dividend
for those fiscal years and before payment of a dividend on
the ordinary shares. The deferred payment right is a con-
stituent of the share of profits from retained earnings of
that fiscal year for which the deferred payment is made.
The Management Board is authorized, with the agreement of
the Supervisory Board, to increase the subscribed capital of
Fresenius SE in accordance with the General Meeting’s reso-
lutions on approved capital. The Approved Capital II of origi-
nally € 5,496,115.20 was utilized for the capital increase of
€ 5,496,114.00 in August 2008. Hence, there are two author-
izations:
� Authorization to increase the subscribed capital by a
maximum nominal amount of € 12,800,000.00 by May 9,
2011 through one or more issues of bearer ordinary
shares and/or non-voting bearer preference shares against
contribution in cash and/or assets in kind (Approved
Capital I).
� Authorization to increase the subscribed capital by a
maximum nominal amount of € 1.20 by May 9, 2011
through one or more issues of bearer ordinary shares
and/or non-voting bearer preference shares against
contribution in cash and/or assets in kind (Approved
Capital II). Shareholders’ preemptive rights of sub-
scription can be excluded. Approved Capital II has been
reduced from € 6,400,000.00 to € 1.20 as a result of
financing the acquisitions of HUMAINE in 2006 and APP
Pharmaceuticals in 2008.
In addition, there is the following conditional capital:
� The subscribed capital is increased conditionally by a
maximum nominal amount of € 1,536,612.00 by the
issuance of new bearer ordinary shares and non-voting
bearer preference shares (Conditional Capital I). The
conditional capital increase will be executed only to the
extent that subscription rights to ordinary and prefer-
ence shares are issued under the 1998 Stock Option
Plan and the holders of these rights exercise these rights.
December 31, 2008 December 31, 2007
Number of sharesSubscribed capital
€
% of
subscribed capital Number of sharesSubscribed capital
€
Ordinary shares/capital 80,571,867 80,571,867.00 50% 77,582,385 77,582,385.00
Preference shares/capital 80,571,867 80,571,867.00 50% 77,582,385 77,582,385.00
Total 161,143,734 161,143,734.00 100% 155,164,770 155,164,770.00

62 Management Report
Managem
ent Report
� The subscribed capital is increased conditionally by a
maximum nominal amount of € 4,729,422.00 by the issu-
ance of new bearer ordinary shares and non-voting bear-
er preference shares (Conditional Capital II). The condi-
tional capital increase will be executed only to the extent
that bonds convertible into ordinary and preference shares
are issued under the 2003 Stock Option Plan and the
holders of these convertible bonds exercise their conver-
sion rights.
� The subscribed capital is increased conditionally by a
maximum nominal amount of € 6,200,000.00 by the issu-
ance of new bearer ordinary shares and non-voting bear-
er preference shares (Conditional Capital III). The condi-
tional capital increase will be executed only to the extent
that subscription rights to ordinary and preference shares
are issued under the 2008 Stock Option Plan and the
holders of these rights exercise these rights. The condi-
tional capital increase was in accordance with the reso-
lution of the General Meeting on May 21, 2008, and was
entered in the Commercial Register on July 11, 2008.
Fresenius SE does not have a share buyback program.
Direct and indirect ownership interests in Fresenius SE are
listed on pages 159 and 160 of the Notes. The Else Kröner-
Fresenius-Stiftung informed the company on December 14,
2008 that it holds 46,871,154 ordinary shares of Fresenius SE.
This corresponds to a voting interest of 58.17%.
Changes to the statutes are made in accordance with Arti-
cle 59 of the SE Regulation pursuant to Section 18 (3) of the
statutes. Unless mandatory legal provisions require otherwise,
amendments to the statutes require a majority of two-thirds
of the votes cast or, if at least half of the subscribed capital is
represented, a simple majority of the votes cast. If, for the
effectiveness of the passing of resolutions, mandatory legal
provisions require that, in addition, a majority of the sub-
scribed capital be represented when the resolution is passed,
the simple majority of the subscribed capital represented
shall be sufficient, to the extent that this is permitted by law.
If the voting results in a tie, the motion will automatically
be rejected. The statutes of Fresenius SE authorize the Super-
visory Board to make changes to any statutes that relate to
their wording in its respective relevant version without a
resolution by the General Meeting.
Material agreements incorporating contingent conditions
in the event of a change of control as the result of a take-
over bid exist in respect of some of our long-term financing
agreements. These agreements contain customary change
of control clauses that grant creditors the right of premature
call in the event of a change of control, whereby, generally,
the change of control has to be followed by a downgrading
of the company’s rating.
CORPORATE PERFORMANCE CRITERIA,
GOALS AND STRATEGY
The Management Board controls the business segments
by setting strategic and operating goals and through various
financial ratios. In line with our growth strategy, organic
growth is a key indicator. Operating income (EBIT – earnings
before interest and taxes) is another useful yardstick for
measuring the profitability of the business segments.
The Management Board believes that, in addition to oper-
ating income, EBITDA (earnings before interest, taxes, depre-
ciation, and amortization) is a good indicator of the business
segments’ ability to achieve positive financial results and
to discharge their financial commitments. The operating cash
flow contributions of our business segments are also con-
trolled on the basis of days sales outstanding (DSO) and scope
of inventory (SOI). A key performance indicator at the group
level is the net debt/EBITDA ratio.
Financing is a central Group function over which the busi-
ness segments have no control. The financial goals for the
business segments therefore exclude both interest payments
resulting from financing activities and tax expenses.
At Group level we use return on operating assets (ROOA)
and return on invested capital (ROIC) as benchmarks for
evaluating our business segments and their contribution to
the value creation of the Group. Group ROIC is 7.3% (2007:
8.4%) and Group ROOA is 9.8% (2007: 11.4%). The decline
in the two ratios compared to 2007 is due to the acquisition
of APP Pharmaceuticals. We expect an improvement in ROIC
and ROOA in the future.

63
Man
agem
ent
Rep
ort
Operations and business environment
Results of operations, financial position, assets, and liabilitiesNon-financial performance indicators and other success factors
Overall assessment of the business situationOpportunities and risk reportSubsequent eventsOutlook
Management Report Report Supervisory Board Management Board Supervisory BoardConsolidated Financial Statements Glossary
The summary below shows ROIC and ROOA by business
segment:
Strategy and goals
The key elements of Fresenius Group’s strategy and goals are:
� To expand our market position: Fresenius’ goal is to
ensure the long-term future of the company as a lead-
ing international provider of products and services in
the health care industry and to grow our market share.
Fresenius Medical Care is the largest dialysis company
in the world, with an especially strong market position in
the United States. Future opportunities in dialysis will
arise from international expansion in dialysis care and
products and in renal pharmaceuticals. Fresenius Kabi
is the European market leader in infusion therapy and
clinical nutrition. To strengthen the position, more prod-
ucts in its portfolio will be rolled out to growth markets.
Further market share is also anticipated from the launch
of new products in the field of IV drugs and new medi-
cal devices for infusion therapy and clinical nutrition.
Mid-term, Fresenius Kabi plans to market products from
its existing range in the United States; similarly, prod-
ucts from the newly acquired American company APP
Pharmaceuticals will be sold globally. Fresenius Helios
is in a strong position to take advantage of the further
growth opportunities offered by the continuing privatiza-
tion process in the German hospital market. Fresenius
Vamed will be further strengthening its position as a spe-
cialist provider of engineering and services to hospitals
and other health care facilities.
� To extend our global presence: In addition to sustained
organic growth in markets where Fresenius is already
established, our strategy is to diversify into new growth
markets worldwide, especially in Asia-Pacific and Latin
America. With our brand name, product portfolio, and
existing infrastructure, we intend to concentrate on
markets that offer attractive growth potential. Fresenius
also plans to make further selective acquisitions to im-
prove the company’s market position and to diversify its
business geographically.
� To strengthen innovation in the development of new
products and technologies: Fresenius’ strategy is to con-
tinue building on its strong position in technology, its
competence and quality in patient care, and its ability to
manufacture cost-effectively. We are convinced that we
can leverage on our competence in research and devel-
opment in our operations to develop products and sys-
tems that provide a high level of safety and user-friendli-
ness and which can be tailored to meet individual patient
needs. We shall continue to meet the requirements of
best-in-class medical standards, developing and produc-
ing more effective products and treatment methods for
the critically and chronically ill. Fresenius Helios’ goal is
to increase brand recognition for its health care services
and innovative therapies.
� To enhance profitability: Our goal is to continue to improve
Group profitability. To contain costs, we are concentrating
particularly on making our production plants more effi-
cient, exploiting economies of scale, leveraging the exist-
ing marketing and distribution infrastructure more inten-
sively, and imposing strict cost controls. Focusing on our
operating cash flow and maintaining efficient working
capital management will improve our investment flexibility
and improve our balance sheet ratios. Another goal is
to optimize our weighted average cost of capital (WACC)
by deliberately employing a balanced mix of equity and
debt funding. Our net debt/EBITDA ratio rose to 3.6 as of
in %
ROIC ROOA
2008 2007 2008 2007
Fresenius Medical Care 8.6 8.4 12.3 12.5
Fresenius Kabi 7.0 14.0 8.9 17.7
Fresenius Helios 5.9 5.0 6.3 5.6
Fresenius Vamed* – – 22.2 22.8
Group 7.3 8.4 9.8 11.4
* ROIC: Invested capital is negative due to prepayments, cash, and cash equivalents. 2008: Pro forma APP Pharmaceuticals and excluding special items from the acquisition.

64 Management Report
Managem
ent Report
December 31, 2008 as a result of financing the acquisition
of APP Pharmaceuticals. In 2010, we expect to bring down
this ratio to a level of between 2.5 and 3.0 again.
We report on our goals in detail in the Outlook section
of the Management Report on pages 97 to 105.
RESEARCH AND DEVELOPMENT
Fresenius centers its R & D efforts on its core activities.
These are:
� dialysis and other extracorporeal therapies
� infusion and nutrition therapies and related
medical devices
� antibody therapies.
Apart from products, we are concentrating on optimizing or
developing completely new therapies, treatment methods,
and services. In 2008, we successfully continued numerous
projects, and several new products were launched.
Fresenius Medical Care continued to work hard to improve
dialysis therapies. One project was the further development
of the 5008 hemodialysis machine; the successor product
5008S was launched in 2008. In the field of home dialysis, our
development work was primarily on a machine for automated
peritoneal dialysis – a so-called cycler – for global use. Our
overall goal is to offer high-quality peritoneal dialysis world-
wide at optimized cost.
Fresenius Kabi concentrated on developing new prod-
ucts and product enhancements in its core areas of infusion
therapy, clinical nutrition, IV drugs, and medical devices.
Attention was centered on IV drugs, where we are working on
filing dossiers for approval in and outside Europe. In 2008,
we submitted the dossiers for 11 products to the European
regulatory authorities. With the acquisition of APP Pharma-
ceuticals and Dabur Pharma, we have significantly expanded
our R & D capabilities in this product segment. We began
rolling out the Dabur products internationally last year. Dabur
Pharma is a leading supplier of generic drugs and active
agents for cancer treatment. In clinical nutrition, we submitted
dossiers for the approval of SMOFlipid®, a lipid emulsion, for
pediatric use in 2008. The approval process for SMOFKabiven®
was completed. In enteral clinical nutrition, we continued
our work on the development of a product line for dysphagia
patients.
Important projects at Fresenius Biotech involved trifunc-
tional antibody therapies: Fresenius Biotech has dispatched
the marketing authorization application for Removab®, used
for the indication of malignant ascites, to EMEA, the Euro-
pean Medicines Agency, at the end of December 2007. In Feb-
ruary 2009, EMEA’s Committee for Medicinal Products for
Human Use (CHMP) issued a positive opinion recommending
approval of Removab®.
Expenditure for research and development was € 479
million in 2008 (2007: € 184 million). This amount includes
€ 272 million of acquired R &D activities from the acquisi-
tion of APP Pharmaceuticals. As in 2007, excluding this spe-
cial item, we invested about 5% of our product sales in R &D.
The pie chart shows the R &D figures by business segment.
In 2008, Fresenius Medical Care increased R &D spending by
12% and Fresenius Kabi by 27%. In the segment Corpo-
rate/Other R &D, € 43 million were expended on the clinical
development of trifunctional antibodies at Fresenius Biotech.
Detailed figures are included in the segment reporting on
pages 114 to 115.
* Excludes amortization of acquired in-process R & D activities of € 272 million from the acquisition of APP Pharmaceuticals
R & D EXPENSES BY SEGMENT
Group/Fresenius Biotech*
21%
Fresenius
Medical Care 26%
Fresenius Kabi 53%
65
Man
agem
ent
Rep
ort
Operations and business environment
Results of operations, financial position, assets, and liabilitiesNon-financial performance indicators and other success factors
Overall assessment of the business situationOpportunities and risk reportSubsequent eventsOutlook
Management Report Report Supervisory Board Management Board Supervisory BoardConsolidated Financial Statements Glossary
As of December 31, 2008, 1,562 people were employed in
research and development in the Group (2007: 999). Of that
number, 427 were employed at Fresenius Medical Care
(2007: 357), 1,019 at Fresenius Kabi (2007: 550), and 116 at
Fresenius Biotech (2007: 92). The large increase at Fresenius
Kabi is mainly due to the first-time consolidation of APP Phar-
maceuticals and Dabur Pharma as of September 1, 2008.
The table shows a historical comparison of R &D expend-
iture and the number of employees working in R &D:
Our main research sites are in Europe. Production-related
research is also carried out in the United States and in China.
Our research and development projects are mainly con-
ducted in-house; external research is commissioned only on
a limited scale.
OVERALL BUSINESS DEVELOPMENT
Economic environment
The global economy was marked by the escalating financial
market crisis, whose repercussions for the real economy, even
outside the United States, were clearly felt in the course of
2008. The world economy cooled off appreciably, with growth
in global gross domestic product (GDP) only 3.1% (2007:
4.7%). As a result, a number of industrial countries are in or
are on the verge of recession and the expectation that the
emerging economies could decouple from the economic trend
in the industrial countries was not fulfilled.
2008 2007 2006 2005 2004
R & D expenses (in million €) 207* 184 167 149 133
R & D employees 1,562 999 911 856 819
* Excludes amortization of acquired in-process R & D activities of € 272 million from the acquisition of APP Pharmaceuticals
There were extreme fluctuations in commodity prices in
2008, with a strong rise in the first half of the year followed
by an even steeper fall later in the year. This development
was driven not only by underlying factors but also by specu-
lation. The price of Brent oil climbed from January to July
to reach a new record high of about US$ 145 per barrel. The
ensuing sharp fall by almost 70% to a low of US$ 44 per
barrel was largely attributable to the rapidly worsening out-
look for the world economy.
The euro’s strength against the US dollar also flagged con-
siderably in the last months of the year. In mid-July the euro
was worth US$ 1.57. By the end of the year it was worth only
US$ 1.39, a substantial drop of about 11%. That the US dol-
lar firmed against the euro despite the lower level of US inter-
est rates can be largely attributed to the repatriation of US
investments abroad. US investors have increasingly pulled
capital out of the emerging markets,with the resulting demand
for dollars causing the US currency to appreciate relative to
other currencies.
� Europe
The economic dynamic in the Eurozone weakened appre-
ciably in 2008. GDP growth was 0.9%, well below the
previous year’s level of 2.6%. Despite the strong trade
links within the single market, the weakness of the US
economy and the global financial market crisis had a
dampening effect on the economy in all member coun-
tries of the Eurozone, albeit to differing extents. Coun-
tries that had also witnessed a property boom, such as
Spain and Ireland, were hit harder by the correction to
the property market, with declining investment in residen-
tial construction and falling asset prices. Germany, on
the other hand, was affected more by the indirect reper-
cussions of the crisis, feeding through later in the form
of weak foreign demand. The labor market continued to
improve. The unemployment rate in the Eurozone was

66 Management Report
Managem
ent Report
7.4%, the lowest since recording began. Given the mas-
sive economic downturn, the jobless rate in Europe is
likely to rise significantly in 2009. Government budgets
also felt the effects of the slowing economic momentum.
Higher government spending, especially as a result of
the support measures in response to the financial market
crisis, caused deficit levels to rise. Another concern in
the first half of 2008 was the steep rise in the inflation rate
in the Eurozone to almost 4%, with strong inflationary
pressure coming especially from higher commodity and
food prices. In the second half of the year, both the weak-
ening economic dynamic and the strong fall in the oil
price caused inflation to ease significantly. At the end of
the year the inflation rate was close to the ECB’s target
of about 2%.
GDP growth in the emerging economies of Central and
Eastern Europe remained generally robust. In Germany,
GDP grew by 1.3% in 2008 (2007: 2.6%). The level of
activity in the corporate sector was increasingly affected
by the slowdown in global economic growth. GDP con-
tracted in the second half of the year, ending an upswing
of more than three years. Since the third quarter of 2008,
the German economy has technically been in recession.
Although, by the fall, the decline in commodity and energy
prices had caused inflation to ease and the euro had lost
considerable strength, September marked the escala-
tion of the financial crisis. In Germany, the turbulence
reached a new dimension with the threatened collapse of
the Hypo Real Estate and troubles at numerous regional
state banks. With the passing of the Financial Markets
Stabilization Act, the government introduced sweeping
measures whose effective implementation will decisively
shape the economy’s future development. With the ex-
ception of the automotive industry, the financial crisis
largely had no direct impact on the real economy in 2008.
However, there are early indications that the economic
situation is clearly worsening.
� United States
The development of the US economy was marked in
2008 by the impact of the financial and property crisis.
There were bankruptcies, including that of investment
bank Lehman Brothers, and the bailout of major financial
institutions through takeovers, all of which led to a credit
crunch, especially in the mortgage sector. Governments
reacted to the worsening situation with far-reaching meas-
ures. This was particularly manifest in March when the
Federal Reserve supported JP Morgan Chase&Co’s take-
over of the troubled investment bank Bear Stearns with
extensive government guarantees. This was followed by
direct government investment in troubled financial insti-
tutions – first with the takeover of the ailing mortgage
lenders Fannie Mae and Freddie Mac and then with the
nationalization of the insurance group AIG. The US gov-
ernment also launched a US$700 billion rescue plan. Ini-
tially, this was used to make further direct investments
in and to recapitalize the biggest US financial institutions.
To cushion the downturn in the real economy triggered
by the financial and property crisis, the Federal Reserve
cut its rates by a total of 400 basis points in 2008 to a new
target corridor of 0 to 0.25%.
Overall, GDP grew by 1.2% (2007: 2.0%). Given
stagnating real incomes, rising gasoline and food prices
in the early part of the year, and a marked labor market
deterioration, private consumption – traditionally the
strongest pillar of the US economy – was extremely sub-
dued, with growth of 0.4% in 2008. Exports were a much
stronger prop, with growth of 7.3%, mainly due to the
much weaker dollar.
� Asia
In Asia (excluding Japan), economic development was
more restrained than the year before, with GDP growth
of 7.1% (2007: 9.4%). Nonetheless, despite this slow-
down, Asia is still the fastest growing region in the world.
In China, for the first time in five years, GDP growth, at

67
Man
agem
ent
Rep
ort
Operations and business environment
Results of operations, financial position, assets, and liabilitiesNon-financial performance indicators and other success factors
Overall assessment of the business situationOpportunities and risk reportSubsequent eventsOutlook
Management Report Report Supervisory Board Management Board Supervisory BoardConsolidated Financial Statements Glossary
9.1%, was not in double digits (2007: 11.9%). In India,
GDP growth was 7.2%, down from 9.3% in 2007. This
decline is mostly due to weak global demand, especially
from the industrial countries. India’s economic downturn
mainly affected the services industry, the biggest sector
of the economy. China, on the other hand, suffering from
a decline in foreign demand, experienced slower export
growth. Japan’s GDP growth fell appreciably from 2.1% to
0.3%. It’s economy, which received strong support from
exports in recent years, was hit particularly hard by the
global economic downturn, especially by the sharp fall in
exports to the United States. Exports to other economic
regions, such as the European Union and China, on the
other hand, developed very dynamically. The hope that
the emerging economies of Southeast Asia could decouple
from the leading industrial nations was not fulfilled. Given
their strong dependence on exports, economic growth
in Indonesia, Singapore, Korea, and Taiwan is also likely
to weaken considerably.
� Latin America
The countries in Latin America were affected by the tur-
bulence in the financial market and the global economic
weakness only to a small extent at first, with the pace of
growth merely slowing. GDP growth was relatively robust
at 4.3% in 2008 (2007: 5.5%). These countries profited
from higher export revenues, especially as a result of the
strong rise in commodity prices in the first half of the
year. In Brazil, private consumption, too, was boosted by
relatively high wage increases. However, first effects of
the economic downturn in the industrial countries began
to be felt in the further course of the year, so the eco-
nomic dynamic in Latin America also slackened more and
more toward the end of the year. The financial sector
was affected far less by the liquidity crisis since it is less
dependent on foreign capital than Europe, for instance.
Nonetheless, the central banks, especially in Brazil and
Mexico, injected dollar liquidity into the financial sector
from their reserves. Despite these interventions, invest-
ment activity still declined. GDP growth was 6.2% in
Argentina (2007: 8.6%), 5.2% in Brazil (2007: 5.4%),
and 1.9% in Mexico (2007: 3.2%). Exports continue
to be the main economic drivers – 60 % of which were
commodities. A further significant fall in global com-
modity prices therefore presents an additional risk for
the Latin American economies.
Health care industry
The health care sector is one of the most stable industries in
the generally difficult present market environment and, com-
pared with other sectors, has set itself apart through years of
continuous growth and its relative insensitivity to economic
fluctuations. Its main drivers in the industrialized countries
are aging populations, the demand for innovative therapies,
and advances in medical technology. Growing health con-
sciousness is also increasing the demand for health care serv-
ices and facilities. In the emerging countries, the main growth
driver is the increasing availability of primary health care.
At the same time, the cost of health care is rising and is
claiming an ever increasing share of national income. Health
spending averaged 8.9% of GDP in the OECD countries in
2006, with an average of US$ 2,824 spent per capita. The Unit-
ed States had the highest per capita spending with US$ 6,714
followed by Norway, Switzerland, and Luxemburg with over
US$ 4,000. Germany ranked tenth among the OECD countries
with per capita spending of US$ 3,371.
Reforms and cost-containment measures are the main
reactions to steadily rising health care expenditures. However,
ever greater emphasis is being placed on disease preven-
tion and innovative reimbursement models where the quality
of treatment is the key parameter. Quality of treatment plays
a crucial role in optimizing medical results and reducing over-
all treatment costs.
Source: German Council of Economic Experts Annual Report 2008/2009, bank research

68 Management Report
Managem
ent Report
Our most important markets developed as follows:
� The dialysis market
In 2008, the global dialysis market grew by around 5%
to approximately US$ 65 billion, with the market for dial-
ysis care (including renal pharmaceuticals) accounting
for approximately US$ 55 billion and the market for dialy-
sis products for about US$ 10.5 billion. The number of
dialysis patients increased by about 7%.
Kidney failure has various causes. Diabetes and high
blood pressure are the leading causes of terminal kidney
failure. Aging populations, improved treatments, and
higher living standards in the industrialized countries are
additional reasons for the increase in patient numbers.
In more than 145 countries, patients with terminal kid-
ney failure receive kidney replacement therapy in the
form of dialysis. In these countries, patient numbers can
be compared in terms of prevalence – in other words
the number of people with terminal kidney failure treated
per million population. Prevalence differs widely from
region to region, ranging from well below 100 to over
2,000 patients per million population. Taiwan has the
highest prevalence with 2,420 per million population, fol-
lowed by Japan and the United States with approxi-
mately 1,780 per million population. The average for the
27 countries of the European Union is about 960. World-
wide, the average is 340. These figures show that in
many countries the availability of life-saving dialysis treat-
ment is still limited. A great many people with terminal
kidney failure are not treated and therefore do not appear
in the prevalence statistics.
In 2008, there were approximately 1.77 million patients
receiving regular dialysis treatment. More than 89% of
these are treated with hemodialysis, while about 11%
choose peritoneal dialysis. The majority of hemodialysis
patients are treated in dialysis clinics. There are about
28,000 dialysis clinics worldwide with an average of 55
hemodialysis patients per clinic. In 2008, about 21% of
the dialysis patients were treated in the United States,
while 16% were treated in Japan and 17% in the Euro-
pean Union. The other 46% were treated in a total of
120 other countries.
In the United States, most of the approximately 5,000
dialysis clinics are run privately, with only about 1%
publicly operated. By contrast, some 60% of the approx-
imately 5,000 dialysis clinics in the European Union are
publicly owned. In Japan, about 75% of the dialysis clin-
ics are run by private nephrologists.
In the dialysis products market, the most important
products are dialyzers, hemodialysis machines, dialysis
solutions, and products for peritoneal dialysis. Fresenius
Medical Care is the world market leader in dialysis care
as well as in dialysis products. Dialyzers are by far the
biggest product segment in the dialysis market. Approxi-
mately 180 million units were sold in 2008, of which about
80 million were produced by Fresenius Medical Care.
Of the approximately 65,000 new dialysis machines that
were brought onto the market in 2008, over 55% were
from Fresenius Medical Care. The top three manufactur-
ers have a share of almost 70% of the global market for
dialysis products. Fresenius Medical Care is the market
leader with a share of about 32%.
DIALYSIS PATIENTS BY REGION
Japan 16%
European Union 17%Rest of the world 46%
USA 21%
69
Man
agem
ent
Rep
ort
Operations and business environment
Results of operations, financial position, assets, and liabilitiesNon-financial performance indicators and other success factors
Overall assessment of the business situationOpportunities and risk reportSubsequent eventsOutlook
Management Report Report Supervisory Board Management Board Supervisory BoardConsolidated Financial Statements Glossary
Fresenius Medical Care is the leading provider of dialysis
care in the United States with a market share of about
33%. Together, Fresenius Medical Care and the second
largest dialysis care provider DaVita treat almost 63% of
all US dialysis patients. Outside the United States, the
markets for dialysis care are much more fragmented. With
over 700 dialysis clinics outside the United States and
more than 60,000 patients treated in over 30 countries,
Fresenius Medical Care has by far the largest and most
international network of dialysis clinics.
Because treatment costs in the United States are cov-
ered primarily by public health insurers, providers main-
ly compete on quality and availability. In most countries
outside the United States, Fresenius Medical Care com-
petes mainly with independent clinics and clinics that are
affiliated to hospitals. Fresenius Medical Care has been
operating for many years in countries with different health
care systems and reimbursement structures. Thanks to
this international experience, we are able to support the
efforts of the national health care systems in creating
suitable reimbursement structures, adjust our business
to the local environment, and generate profitable growth.
Terminal kidney failure is one of the few chronic dis-
eases whose treatment is covered by the public health
insurers in the United States. The two public health care
programs Medicare and Medicaid cover the medical
services for more than 80% of all dialysis patients in the
United States. Changes in the reimbursement rates or
in the method of reimbursement therefore have special
relevance for our North America business.
In the United States, certain services and products
provided or sold at the company’s dialysis clinics are reim-
bursed by Medicare based on a basic case-mix adjusted
prospective system. This system provides a fixed payment
per dialysis treatment consisting of a composite rate and
a drug add-on adjustment component. In this system the
payment rates are adjusted from time to time through
changes in the Medicare Statute or through annual re-
views. For 2008, the CMS (Center for Medicare and Medi-
caid Services) increased the drug add-on adjustment
by US$ 0.69, so it now represents 15.5% of the total per-
treatment prospective payment.
Certain other items and services are not included in
the composite rate and are reimbursed separately by
Medicare. The most significant of these are drugs or bio-
logicals such as erythropoietin-stimulating agents (ESAs),
vitamin D analogs, and iron supplements, which are
reimbursed at a rate of 106% of the average sales price
(ASP) as reported by the manufacturer to the Center for
Medicare and Medicaid Services (CMS).
� The market for infusion therapy and clinical nutrition
Demographic changes, the resulting increased need
for medical services, and the demand for innovative ther-
apies are the main growth drivers for this market. In
addition, in the emerging economies, the growth in natio-
nal incomes has been the trigger for higher health care
spending.
However, market conditions for infusion therapy and
clinical nutrition products vary widely from region to
region:
In Central and Western Europe, therapies that lead to
better clinical outcomes while reducing the length of
hospital stays are increasingly gaining importance. Nutri-
tional therapy measures are therefore becoming more
and more important, not only on health grounds but also
for economic reasons. Patients with nutritional deficien-
cies have poorer chances of recovery than patients with
a normal nutritional status. These deficiencies can lead
to higher treatment costs and longer hospital stays. Out-
patient clinical nutrition therapies should also gain in
importance. Cost pressures in hospitals, budget caps, and
health care cost-containment schemes are continuing
the shift away from inpatient care to more outpatient care.

70 Management Report
Managem
ent Report
In Central and Western Europe, the total market for infu-
sion therapy and clinical nutrition is currently growing at
a low single-digit rate.
Generic drugs are currently making a vital contribu-
tion to health care. Their importance will continue to grow
in future. Faced by cost pressure, health care regula-
tions are being introduced that facilitate the prescription
of generics. More and more generics are being used to
reduce costs. The expiration of patents for many original
drugs will further accelerate this growth. The European
market for generic IV drugs for hospitals is growing at a
mid single-digit rate. The US market for IV drugs, which
has acquired new relevance for Fresenius with the acqui-
sition of APP Pharmaceuticals, is worth about US$ 3.6 bil-
lion, and is growing at rates of over 5%.
The market for medical devices for infusion therapy
and clinical nutrition in Europe is continuing to grow at
mid single-digit rates. Here, the main growth drivers are
technical innovations that focus on treatment safety and
therapy efficiency.
In the growth regions of Asia-Pacific, Latin America,
and Eastern Europe the main focus is on the provision of
primary health care to the population. There is increas-
ing demand for life-saving and life-prolonging health care
services. Growth rates in our product markets here are in
the high single to double digits.
Based on its own surveys, Fresenius Kabi considers
its relevant market for infusion solutions and clinical nutri-
tion to be in the range of €9 billion.
� The German hospital market
In the current critical economic environment, the German
hospital market is one of the most stable sectors. Demands
from the aging German population are still increasing.
Health care finance is regulated by statute. The introduc-
tion of the DRG system (Diagnosis Related Groups) in
2003 and 2004 and the following convergence phase pro-
vided an opportunity for efficient hospital operators to
improve the sector’s market position by increasing effi-
ciency.
The total volume for hospital treatment (excluding
research and teaching) in Germany was about € 67 bil-
lion in 2007. Personnel costs accounted for about 62%
and material costs for about 38%. Personnel costs rose
by 1.7%, and material costs by 7.3%.
The acute care clinic market in Germany continues to
be marked by a highly regulated reimbursement regime
for hospitals and structural overcapacity.
Between 2000 and 2007 the number of hospitals
declined at an average annual rate of 1.0% to 2,087 and
the number of beds at an average annual rate of 1.4%
to 506,954. Nonetheless, with 6.16 beds per 1,000 popu-
lation in 2007, Germany is still well above the OECD
average of 3.9 (2006). Overall, it is estimated that further
hospitals in Germany will close.
The average stay of a patient in an acute care clinic
(excluding specialized psychiatric clinics) in Germany
fell at an average annual rate of 2.1% over the same peri-
od, and at the last count was 8.3 days. At the time of the
introduction of the DRG system in 2003, the average stay
in Germany was still 8.9 days.
Source: OECD Health Data 2008, June 2008; IMS; own estimates
2007 KEY FIGURES FOR INPATIENT CARE IN GERMANY
2007 2006 Change
Hospitals 2,087 2,104 -0.8%
Available beds 506,954 510,767 -0.7%
Number of admissions(millions) 17.18 16.83 2.1%
Beds per 1,000 population 6.16 6.20
Average costs per admission (€)* 4,028 3,932 2.4%
Length of stay (days) 8.3 8.5
* total costs, gross

71
Man
agem
ent
Rep
ort
Operations and business environment
Results of operations, financial position, assets, and liabilitiesNon-financial performance indicators and other success factors
Overall assessment of the business situationOpportunities and risk reportSubsequent eventsOutlook
Management Report Report Supervisory Board Management Board Supervisory BoardConsolidated Financial Statements Glossary
After reaching a peak of 17.43 million in 2002, the num-
ber of inpatient admissions at acute care clinics in Ger-
many declined at first to 16.54 million in 2005 after the
introduction of DRG-based reimbursement. This was due,
on the one hand, to a reduction in unnecessary referrals
and growth in the number of outpatient treatments and, on
the other, to technical changes in admission statistics
following the introduction of DRGs. The number of admis-
sions has risen slightly again since 2006, and at the last
count was approximately 17.18 million or 209 admissions
per 1,000 population. Other countries rank well below
the German level, e.g. Switzerland with 173 admissions
per 1,000 population. The pressure on inpatient hospital
capacities in Germany is therefore likely to persist.
The difficult financial and economic situation at many
hospitals has been compounded by rising investment
needs, especially in response to technological advances
and higher quality requirements. It is estimated that the
current annual investment backlog is about € 5 billion.
Hospital competitiveness is therefore also dependent on
their ability to self-finance these investments.
The privatization trend in the German hospital mar-
ket has continued unbroken, with the share of private hos-
pital beds rising to approximately 16% in 2007 (2006:
about 14%).
Quality continues to be a key competitive factor for the
hospital market. The structured quality reports which all
acute care hospitals in Germany have had to publish
since 2005 provide information on the type and number
of treatments and their quality. The transparency and
comparability of the treatments for the patients and their
doctors will play an increasingly decisive role.
In the postacute care market in Germany there were
a total of 1,239 clinics with 170,845 beds in 2007. The
total number of admissions in Germany in 2007 was 1.94
million and the average length of stay was 25.5 days.
The Management Board’s assessment of the effect of
general economic developments and those in the health
care sector for Fresenius
The weakening of world economic growth in the second
half of 2008 has had no impact on our industry as yet. On the
whole, the health care sector, both in the mature and the
growth markets, developed positively for Fresenius in 2008.
While this was responsible for much of the Group’s growth,
strong demand for its products and services enabled Fresenius
to outpace the growth of the health care industry as a whole.
Significant factors affecting operating performance
In 2008, the positive development was again driven to a large
extent by the very good operating results in all business seg-
ments, where significant increases in sales and in earnings
were achieved.
Currency changes, especially in the US dollar/euro ex-
change rate, had an important impact on currency translation.
The Group financial statements were also affected by a
number of acquisitions and divestitures, partly from 2007.
The principal transactions were: the acquisition of APP Phar-
maceuticals and Dabur Pharma in 2008, and in 2007 the
acquisition of Nestlé’s enteral nutrition business in France
(Novartis Nutrition S.A.S.) and Spain (Nestlé España), and
the acquisition of Ribbon, a leading European manufacturer
of antibiotic active agents. Städtische Kliniken Krefeld was
Source: German Federal Statistics Office; research study “Perspectives for Hospital Care in Germany”,McKinsey 2006.
HOSPITAL BEDS BY OPERATOR 2007
Private hospitals 16%
Independent non-profit
hospitals 35%
Public hospitals 49%
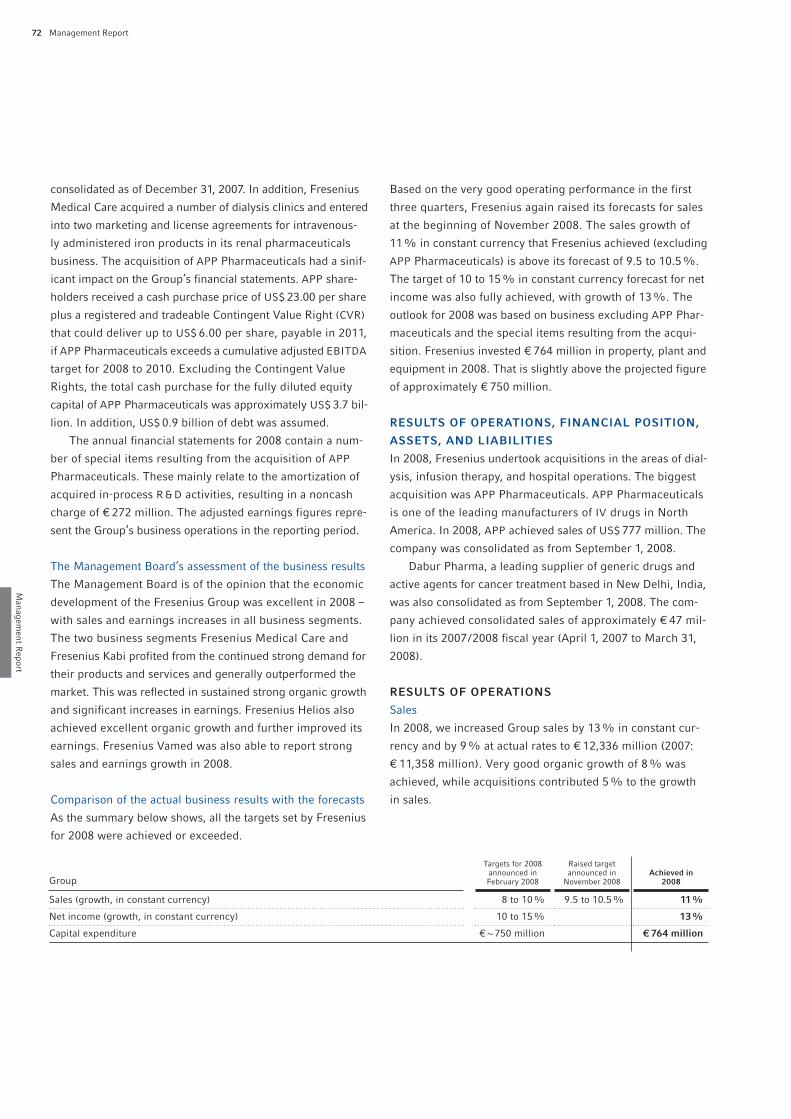
72 Management Report
Managem
ent Report
Based on the very good operating performance in the first
three quarters, Fresenius again raised its forecasts for sales
at the beginning of November 2008. The sales growth of
11% in constant currency that Fresenius achieved (excluding
APP Pharmaceuticals) is above its forecast of 9.5 to 10.5%.
The target of 10 to 15% in constant currency forecast for net
income was also fully achieved, with growth of 13%. The
outlook for 2008 was based on business excluding APP Phar-
maceuticals and the special items resulting from the acqui-
sition. Fresenius invested € 764 million in property, plant and
equipment in 2008. That is slightly above the projected figure
of approximately € 750 million.
RESULTS OF OPERATIONS, FINANCIAL POSITION,
ASSETS, AND LIABILITIES
In 2008, Fresenius undertook acquisitions in the areas of dial-
ysis, infusion therapy, and hospital operations. The biggest
acquisition was APP Pharmaceuticals. APP Pharmaceuticals
is one of the leading manufacturers of IV drugs in North
America. In 2008, APP achieved sales of US$ 777 million. The
company was consolidated as from September 1, 2008.
Dabur Pharma, a leading supplier of generic drugs and
active agents for cancer treatment based in New Delhi, India,
was also consolidated as from September 1, 2008. The com-
pany achieved consolidated sales of approximately € 47 mil-
lion in its 2007/2008 fiscal year (April 1, 2007 to March 31,
2008).
RESULTS OF OPERATIONS
Sales
In 2008, we increased Group sales by 13% in constant cur-
rency and by 9% at actual rates to € 12,336 million (2007:
€ 11,358 million). Very good organic growth of 8% was
achieved, while acquisitions contributed 5% to the growth
in sales.
consolidated as of December 31, 2007. In addition, Fresenius
Medical Care acquired a number of dialysis clinics and entered
into two marketing and license agreements for intravenous-
ly administered iron products in its renal pharmaceuticals
business. The acquisition of APP Pharmaceuticals had a sinif-
icant impact on the Group’s financial statements. APP share-
holders received a cash purchase price of US$ 23.00 per share
plus a registered and tradeable Contingent Value Right (CVR)
that could deliver up to US$ 6.00 per share, payable in 2011,
if APP Pharmaceuticals exceeds a cumulative adjusted EBITDA
target for 2008 to 2010. Excluding the Contingent Value
Rights, the total cash purchase for the fully diluted equity
capital of APP Pharmaceuticals was approximately US$ 3.7 bil-
lion. In addition, US$ 0.9 billion of debt was assumed.
The annual financial statements for 2008 contain a num-
ber of special items resulting from the acquisition of APP
Pharmaceuticals. These mainly relate to the amortization of
acquired in-process R & D activities, resulting in a noncash
charge of € 272 million. The adjusted earnings figures repre-
sent the Group’s business operations in the reporting period.
The Management Board’s assessment of the business results
The Management Board is of the opinion that the economic
development of the Fresenius Group was excellent in 2008 –
with sales and earnings increases in all business segments.
The two business segments Fresenius Medical Care and
Fresenius Kabi profited from the continued strong demand for
their products and services and generally outperformed the
market. This was reflected in sustained strong organic growth
and significant increases in earnings. Fresenius Helios also
achieved excellent organic growth and further improved its
earnings. Fresenius Vamed was also able to report strong
sales and earnings growth in 2008.
Comparison of the actual business results with the forecasts
As the summary below shows, all the targets set by Fresenius
for 2008 were achieved or exceeded.
Group
Targets for 2008announced in February 2008
Raised targetannounced in
November 2008Achieved in
2008
Sales (growth, in constant currency) 8 to 10% 9.5 to 10.5% 11%
Net income (growth, in constant currency) 10 to 15% 13%
Capital expenditure € ~ 750 million € 764 million
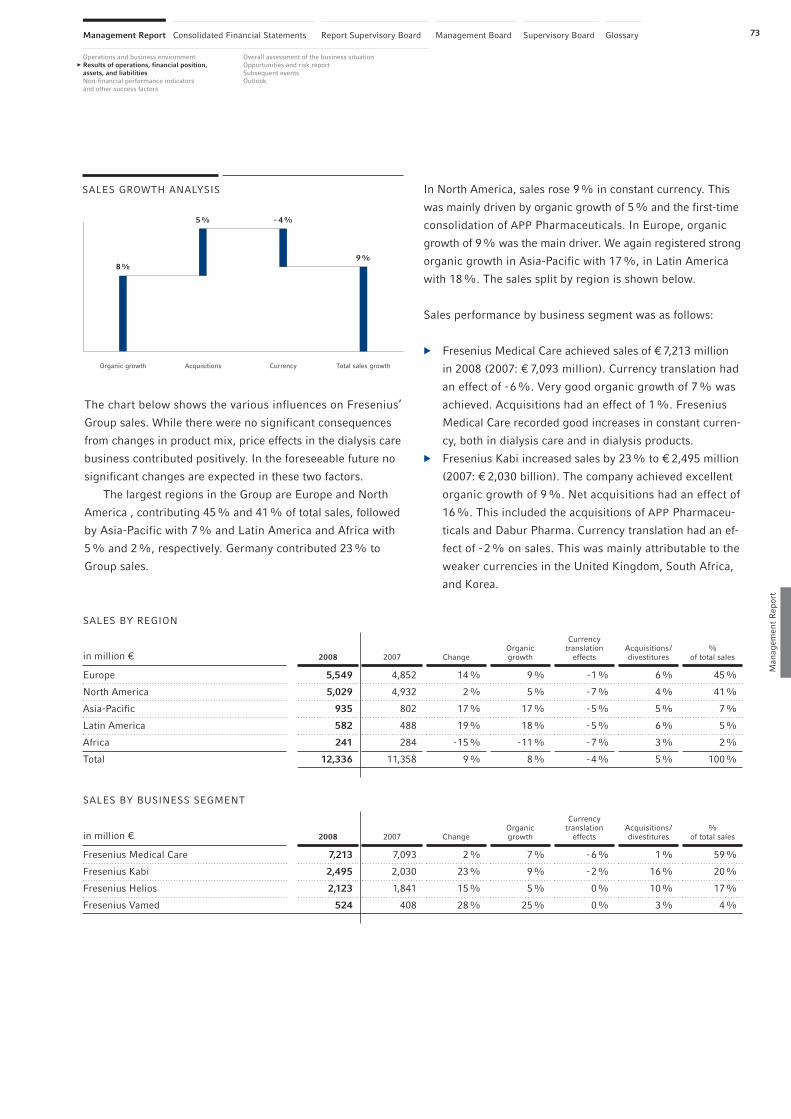
73
Man
agem
ent
Rep
ort
Operations and business environmentResults of operations, financial position,
assets, and liabilities
Non-financial performance indicators and other success factors
Overall assessment of the business situationOpportunities and risk reportSubsequent eventsOutlook
Management Report Report Supervisory Board Management Board Supervisory BoardConsolidated Financial Statements Glossary
The chart below shows the various influences on Fresenius’
Group sales. While there were no significant consequences
from changes in product mix, price effects in the dialysis care
business contributed positively. In the foreseeable future no
significant changes are expected in these two factors.
The largest regions in the Group are Europe and North
America , contributing 45% and 41% of total sales, followed
by Asia-Pacific with 7% and Latin America and Africa with
5% and 2%, respectively. Germany contributed 23% to
Group sales.
In North America, sales rose 9% in constant currency. This
was mainly driven by organic growth of 5% and the first-time
consolidation of APP Pharmaceuticals. In Europe, organic
growth of 9% was the main driver. We again registered strong
organic growth in Asia-Pacific with 17%, in Latin America
with 18%. The sales split by region is shown below.
Sales performance by business segment was as follows:
� Fresenius Medical Care achieved sales of € 7,213 million
in 2008 (2007: € 7,093 million). Currency translation had
an effect of -6%. Very good organic growth of 7% was
achieved. Acquisitions had an effect of 1%. Fresenius
Medical Care recorded good increases in constant curren-
cy, both in dialysis care and in dialysis products.
� Fresenius Kabi increased sales by 23% to € 2,495 million
(2007: € 2,030 billion). The company achieved excellent
organic growth of 9%. Net acquisitions had an effect of
16%. This included the acquisitions of APP Pharmaceu-
ticals and Dabur Pharma. Currency translation had an ef-
fect of -2% on sales. This was mainly attributable to the
weaker currencies in the United Kingdom, South Africa,
and Korea.
Currency Total sales growthAcquisitionsOrganic growth
8%
- 4%
9%
5%
SALES GROWTH ANALYSIS
SALES BY REGION
SALES BY BUSINESS SEGMENT
in million € 2008 2007 ChangeOrganicgrowth
Currency translation
effectsAcquisitions/divestitures
% of total sales
Europe 5,549 4,852 14% 9% -1% 6% 45%
North America 5,029 4,932 2% 5% -7% 4% 41%
Asia-Pacific 935 802 17% 17% -5% 5% 7%
Latin America 582 488 19% 18% -5% 6% 5%
Africa 241 284 -15% -11% -7% 3% 2%
Total 12,336 11,358 9% 8% -4% 5% 100%
in million € 2008 2007 ChangeOrganicgrowth
Currency translation
effectsAcquisitions/divestitures
% of total sales
Fresenius Medical Care 7,213 7,093 2% 7% -6% 1% 59%
Fresenius Kabi 2,495 2,030 23% 9% -2% 16% 20%
Fresenius Helios 2,123 1,841 15% 5% 0% 10% 17%
Fresenius Vamed 524 408 28% 25% 0% 3% 4%
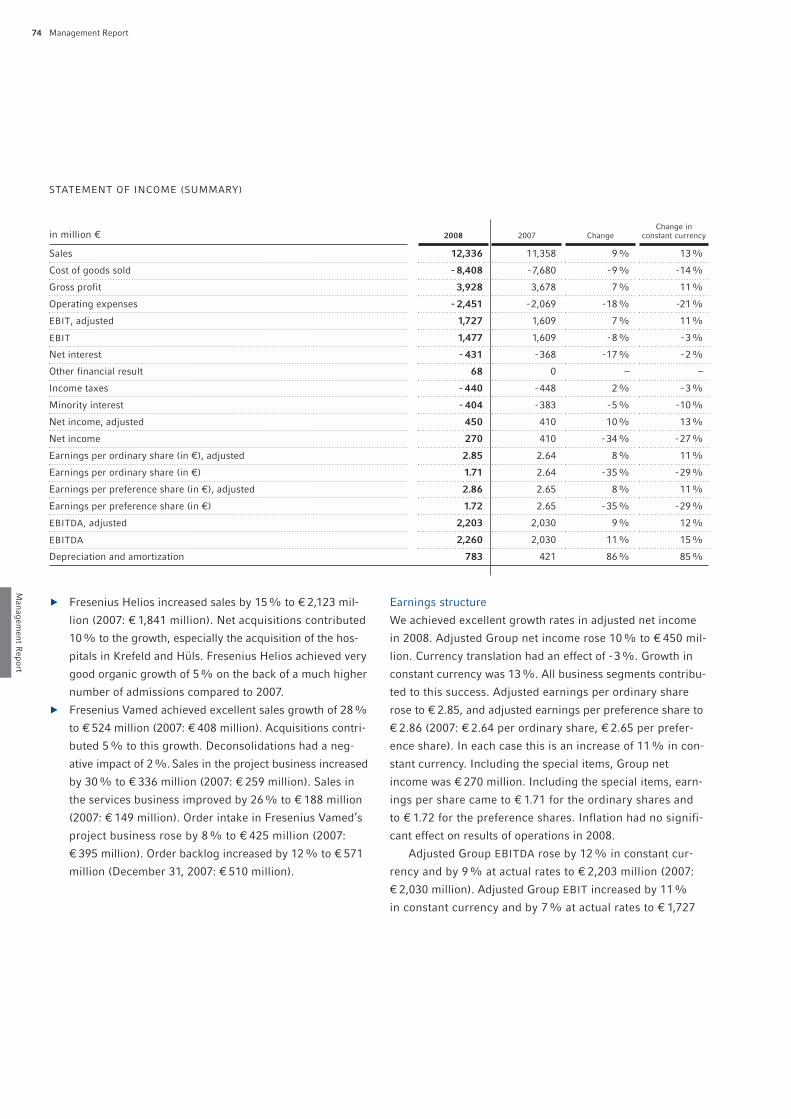
74 Management Report
� Fresenius Helios increased sales by 15% to € 2,123 mil-
lion (2007: € 1,841 million). Net acquisitions contributed
10% to the growth, especially the acquisition of the hos-
pitals in Krefeld and Hüls. Fresenius Helios achieved very
good organic growth of 5% on the back of a much higher
number of admissions compared to 2007.
� Fresenius Vamed achieved excellent sales growth of 28%
to € 524 million (2007: € 408 million). Acquisitions contri-
buted 5% to this growth. Deconsolidations had a neg-
ative impact of 2%. Sales in the project business increased
by 30% to € 336 million (2007: € 259 million). Sales in
the services business improved by 26% to € 188 million
(2007: € 149 million). Order intake in Fresenius Vamed’s
project business rose by 8% to € 425 million (2007:
€ 395 million). Order backlog increased by 12% to € 571
million (December 31, 2007: € 510 million).
Earnings structure
We achieved excellent growth rates in adjusted net income
in 2008. Adjusted Group net income rose 10% to € 450 mil-
lion. Currency translation had an effect of -3%. Growth in
constant currency was 13%. All business segments contribu-
ted to this success. Adjusted earnings per ordinary share
rose to € 2.85, and adjusted earnings per preference share to
€ 2.86 (2007: € 2.64 per ordinary share, € 2.65 per prefer-
ence share). In each case this is an increase of 11% in con-
stant currency. Including the special items, Group net
income was € 270 million. Including the special items, earn-
ings per share came to € 1.71 for the ordinary shares and
to € 1.72 for the preference shares. Inflation had no signifi-
cant effect on results of operations in 2008.
Adjusted Group EBITDA rose by 12% in constant cur-
rency and by 9% at actual rates to € 2,203 million (2007:
€ 2,030 million). Adjusted Group EBIT increased by 11%
in constant currency and by 7% at actual rates to € 1,727
Managem
ent Report
STATEMENT OF INCOME (SUMMARY)
in million € 2008 2007 ChangeChange in
constant currency
Sales 12,336 11,358 9% 13%
Cost of goods sold - 8,408 -7,680 -9% -14%
Gross profit 3,928 3,678 7% 11%
Operating expenses - 2,451 -2,069 -18% -21%
EBIT, adjusted 1,727 1,609 7% 11%
EBIT 1,477 1,609 -8% -3%
Net interest - 431 -368 -17% -2%
Other financial result 68 0 – –
Income taxes - 440 -448 2% -3%
Minority interest - 404 -383 -5% -10%
Net income, adjusted 450 410 10% 13%
Net income 270 410 -34% -27%
Earnings per ordinary share (in €), adjusted 2.85 2.64 8% 11%
Earnings per ordinary share (in €) 1.71 2.64 -35% -29%
Earnings per preference share (in €), adjusted 2.86 2.65 8% 11%
Earnings per preference share (in €) 1.72 2.65 -35% -29%
EBITDA, adjusted 2,203 2,030 9% 12%
EBITDA 2,260 2,030 11% 15%
Depreciation and amortization 783 421 86% 85%
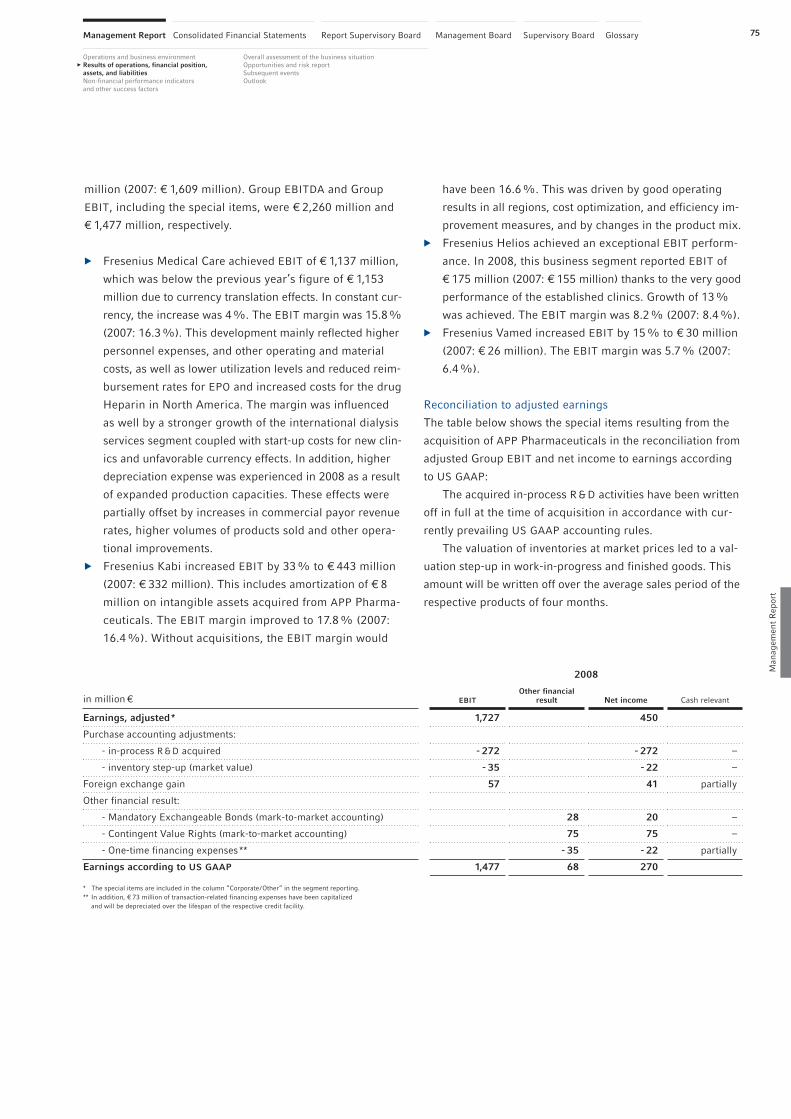
75
Man
agem
ent
Rep
ort
Overall assessment of the business situationOpportunities and risk reportSubsequent eventsOutlook
Management Report Report Supervisory Board Management Board Supervisory BoardConsolidated Financial Statements Glossary
million (2007: € 1,609 million). Group EBITDA and Group
EBIT, including the special items, were € 2,260 million and
€ 1,477 million, respectively.
� Fresenius Medical Care achieved EBIT of € 1,137 million,
which was below the previous year’s figure of € 1,153
million due to currency translation effects. In constant cur-
rency, the increase was 4%. The EBIT margin was 15.8%
(2007: 16.3%). This development mainly reflected higher
personnel expenses, and other operating and material
costs, as well as lower utilization levels and reduced reim-
bursement rates for EPO and increased costs for the drug
Heparin in North America. The margin was influenced
as well by a stronger growth of the international dialysis
services segment coupled with start-up costs for new clin-
ics and unfavorable currency effects. In addition, higher
depreciation expense was experienced in 2008 as a result
of expanded production capacities. These effects were
partially offset by increases in commercial payor revenue
rates, higher volumes of products sold and other opera-
tional improvements.
� Fresenius Kabi increased EBIT by 33% to € 443 million
(2007: € 332 million). This includes amortization of € 8
million on intangible assets acquired from APP Pharma-
ceuticals. The EBIT margin improved to 17.8% (2007:
16.4%). Without acquisitions, the EBIT margin would
have been 16.6%. This was driven by good operating
results in all regions, cost optimization, and efficiency im-
provement measures, and by changes in the product mix.
� Fresenius Helios achieved an exceptional EBIT perform-
ance. In 2008, this business segment reported EBIT of
€ 175 million (2007: € 155 million) thanks to the very good
performance of the established clinics. Growth of 13%
was achieved. The EBIT margin was 8.2% (2007: 8.4%).
� Fresenius Vamed increased EBIT by 15% to € 30 million
(2007: € 26 million). The EBIT margin was 5.7% (2007:
6.4%).
Reconciliation to adjusted earnings
The table below shows the special items resulting from the
acquisition of APP Pharmaceuticals in the reconciliation from
adjusted Group EBIT and net income to earnings according
to US GAAP:
The acquired in-process R & D activities have been written
off in full at the time of acquisition in accordance with cur-
rently prevailing US GAAP accounting rules.
The valuation of inventories at market prices led to a val-
uation step-up in work-in-progress and finished goods. This
amount will be written off over the average sales period of the
respective products of four months.
2008
in million € EBIT
Other financialresult Net income Cash relevant
Earnings, adjusted* 1,727 450
Purchase accounting adjustments:
- in-process R & D acquired - 272 - 272 –
- inventory step-up (market value) - 35 - 22 –
Foreign exchange gain 57 41 partially
Other financial result:
- Mandatory Exchangeable Bonds (mark-to-market accounting) 28 20 –
- Contingent Value Rights (mark-to-market accounting) 75 75 –
- One-time financing expenses** - 35 - 22 partially
Earnings according to US GAAP 1,477 68 270
* The special items are included in the column “Corporate/Other“ in the segment reporting. ** In addition, € 73 million of transaction-related financing expenses have been capitalized
and will be depreciated over the lifespan of the respective credit facility.
Operations and business environmentResults of operations, financial position,
assets, and liabilities
Non-financial performance indicators and other success factors
76 Management Report
Managem
ent Report
The foreign exchange gain has resulted from the firmer US
dollar, which has increased the value of the US dollar inter-
company loan to Fresenius Kabi Pharmaceuticals Holding, Inc.
The Mandatory Exchangeable Bonds (MEB) and the Con-
tingent Value Rights (CVR) are recognized as liabilities. The
repayment value of the CVR and the derivative elements of
the MEB are measured at market prices, with the change in
market value (mark-to-market accounting), measured on a
quarterly basis over the entire life of the instruments, result-
ing either in a gain or an expense.
The one-time financing expenses include commitment
and funding fees for the bridge facility as well as the full
write-off of the financing costs of a syndicated credit facility
of APP Pharmaceuticals from the year 2007.
Development of other major items in
the statement of income
Group gross profit increased to € 3,928 million, exceeding
the € 3,678 million in 2007 by 7% (11% in constant curren-
cy). The gross margin was 31.8% (2007: 32.4%). The cost
of sales rose 9% to € 8,408 million (2007: € 7,680 million).
This figure includes special items from the inventory step-up
due to market price accounting. Cost of sales as a percent-
age of Group sales was 68.2%, up from 67.6% in 2007. Sell-
ing, general, and administrative expenses consisted prima-
rily of personnel costs, marketing and distribution costs, as
well as depreciation and amortization. These expenses rose
by 5% to € 1,972 million in 2008 (2007: € 1,885 million).
Their ratio as a percentage of Group sales improved slightly to
16.0% (2007: 16.6%). This includes special items of € 57
million from the currency gain on US dollar intercompany
loans. Depreciation and amortization (adjusted for special
items) were € 476 million (2007: € 421 million). Their ratio as
a percentage of sales was 3.9% (2007: 3.7%). Including
special items, depreciation and amortization was € 783 mil-
lion. This includes amortization of € 272 million on acquired
in-process R & D and the valuation step-up of € 35 million in
inventories.
Group net interest was € -431 million, an increase of € 63
million versus € -368 million in 2007. Lower average inter-
est rates on liabilities at Fresenius Medical Care and currency
translation had a positive effect, while higher debt especially
as a result of the APP Pharmaceuticals and Dabur Pharma
acquisitions had a negative impact. The currency translation
effect was € 10 million since approximately 63% of the debt
is denominated in US dollars.
The other financial result of € 68 million consists of the
change in market value recognized in the repayment value of
Mandatory Exchangeable Bonds and Contingent Value Rights
(mark-to-market accounting) and the one-time financing
expenses associated with the APP acquisition.
The adjusted Group tax rate was 34.1% (2007: 36.1%).
Including the special items, the Group’s tax rate was 39.5%.
Minority interest increased to € 404 million, mainly due
to good earnings performance at Fresenius Medical Care
(2007: € 383 million). Of this, 93% was attributable to the
minority interest in Fresenius Medical Care.
The table below shows the profit margin development
(before special items):
Value added
The value added statement shows Fresenius’ total output in
2008 less purchased goods and services, and less deprecia-
tion and amortization. The value added of the Fresenius Group
was € 5,903 million in 2008 (2007: € 5,754 million). This is
an increase of 3%. The distribution statement shows that, at
€ 4,332 million or 74%, the largest portion of our value
added went to our employees. Governments and lenders came
next with € 534 million and € 431 million, or 9% and 7%,
respectively. Shareholders received € 114 million and minority
interest € 404 million. The Company retained € 88 million
for reinvestment.
in % 2008 2007
EBITDA margin, adjusted 17.9 17.9
EBIT margin, adjusted 14.0 14.2
Return on sales (before taxes and minority interest), adjusted 10.5 10.9

77
Man
agem
ent
Rep
ort
Overall assessment of the business situationOpportunities and risk reportSubsequent eventsOutlook
Management Report Report Supervisory Board Management Board Supervisory BoardConsolidated Financial Statements Glossary
FINANCIAL POSITION
Financial management policies and goals
Insuring financial flexibility is key to the financing strategy of
the Fresenius Group. We achieve this flexibility through a
broad spectrum of financing instruments and the wide diver-
sification of our investors. The maturity profile is character-
ized by a broad spread of maturities with a large proportion
of mid- to long-term financing.
Sufficient financial cushion is assured for the Fresenius
Group by the revolving syndicated credit lines and bilateral
credit lines that are only partially drawn. Market capacity,
investor diversification, flexibility, credit covenants, and the
current maturity profile are all taken into consideration when
selecting financing instruments. At the same time, we seek to
optimize our financing costs.
In line with the Group’s structure, financing for Fresenius
Medical Care and for the rest of the Fresenius Group is
conducted separately. There are no joint loans or credit agree-
ments and no mutual guarantees. The Fresenius Kabi,
Fresenius Helios, and Fresenius Vamed business segments
are financed primarily through Fresenius SE in order to
avoid any structural subordination.
Financing
Fresenius meets its financing needs through a combination
of operating cash flows generated in the business segments
and short, mid-, and long-term debt. In addition to conven-
tional bank loans, important financing instruments include the
issuance of bonds, notes, trust preferred securities, a com-
mercial paper program, a receivables securitization program,
and mandatory exchangeable bonds.
In 2008, the Group’s financing activities mainly involved
the financing of the APP Pharmaceuticals acquisition, includ-
ing the refinancing of its financial liabilities that totaled
approximately US$ 4.8 billion (including financing expenses).
This acquisition was financed by a mix of equity and debt.
Thanks to the great advances the Group has made in lower-
ing its leverage since 2006, it was possible to finance by
far the greater part of this transaction with debt instruments.
Consequently, the impact on Fresenius SE’s credit ratings
was minimized.
VALUE ADDED STATEMENT
in million € 2008 % 2007 %
Creation
Company output 12,390 100 11,489 100
- Materials and services purchased 5,704 46 5,314 46
Gross value added 6,686 54 6,175 54
- Depreciation and amortization 783 6 421 4
Net value added 5,903 48 5,754 50
Distribution
Employees 4,332 74 4,052 71
Governments 534 9 541 9
Lenders 431 7 368 6
Shareholders 114 2 103 2
Company and minority interest 492 8 690 12
Net value added 5,903 100 5,754 100
Operations and business environmentResults of operations, financial position,
assets, and liabilities
Non-financial performance indicators and other success factors

78 Management Report
Managem
ent Report
� On July 17, 2008 Fresenius SE successfully placed man-
datory exchangeable bonds (MEB) with a total nominal
amount of € 554 million. The bonds have a term of 3 years
and may only be redeemed by exchanging them for
ordinary shares of Fresenius Medical Care AG &Co.KGaA.
At maturity, Fresenius has to deliver a minimum of 14.24
million shares and a maximum of 16.80 million shares,
equivalent to about 4.8% and about 5.6%, respectively,
of the total subscribed capital of Fresenius Medical Care
AG &Co. KGaA. The bond carries an annual coupon of
55/8%. The minimum exchange price is equal to the ref-
erence price of € 33.00 and the maximum exchange
price has been set 18% above the reference price. This
structure enables Fresenius SE to participate in a rise
in the price of the Fresenius Medical Care ordinary shares
up to a maximum exchange price of € 38.94.
� On August 15, 2008 Fresenius SE completed a capital
increase, with gross proceeds of approximately € 289 mil-
lion. Priced at € 52.00, 2,748,057 new bearer shares were
issued as well as 2,748,057 new preference shares at a
price of € 53.00. The new shares were offered to institu-
tional investors through an accelerated bookbuilt offering.
� On August 20, 2008, a US$ 2.45 billion senior secured
credit facilities agreement was signed. Of this, US$ 2.25
billion was drawn to cover the purchase price, to refi-
nance APP’s existing debt, and to meet transaction-related
expenses when the APP acquisition was closed on Sep-
tember 10, 2008. On October 6, 2008, in response to strong
demand among investors, Fresenius SE increased the
credit facilities by the equivalent of US$ 500 million to
approximately US$ 2.95 billion. For greater financial flex-
ibility, the credit facilities’ revolving credit lines were
increased from US$ 450 million to US$ 550 million on No-
vember 26, 2008. The total volume of the senior secured
credit facilities is thus approximately US$ 3.05 billion, with
US$ 550 million of revolving credit lines, a Loan A of
US$ 1.0 billion, and a Loan B of approximately US$ 1.5 bil-
lion. Loan B consists of US dollar tranches of US$ 497.5
million, US$ 502.5 million and US$ 210.5 million, respec-
tively, and a euro tranche of € 200 million. The revolving
credit lines and Loan A have a term of 5 years. Loan B has
a term of 6 years. When the APP Pharmaceuticals acqui-
sition was closed, US$ 250 million of the revolving credit
lines were drawn.
� On August 20, 2008 an agreement was signed for a bridge
facility of US$ 1.3 billion, which was also drawn in full
on September 10, 2008. This financing was reduced to
US$ 650 million in October 2008, using proceeds from the
increase in the senior secured credit facilities and funds
from other credit lines.
� On January 21, 2009 Fresenius issued unsecured Senior
Notes by its subsidiary Fresenius US Finance II, Inc. Pro-
ceeds were US$ 800 million. The euro tranche of € 275
million principal amount was issued at a price of 93.024%
and has a coupon of 8.75%, resulting in a yield to matu-
rity of 10.25%. The US dollar tranche of US$ 500 million
principal amount was issued at a price of 93.076% and
has a coupon of 9.00%, resulting in a yield to maturity
of 10.50%. Both tranches will mature in 2015 and are
noncallable. Proceeds of the Notes offering were used to
replace the bridge facility of US$ 650 million used to
finance the acquisition of APP Pharmaceuticals and to
reduce short-term debt. This transaction completed the
financing of the APP Pharmaceuticals acquisition.
A € 400 million private placement with European investors
was completed on April 2, 2008. A syndicated senior unse-
cured note was offered in four tranches. The placement was
divided into tranches of € 200 million with maturities of 4
and 6 years respectively, each with a fixed rate tranche and
a floating rate tranche. The note was issued by Fresenius
Finance B.V. and guaranteed by Fresenius SE.
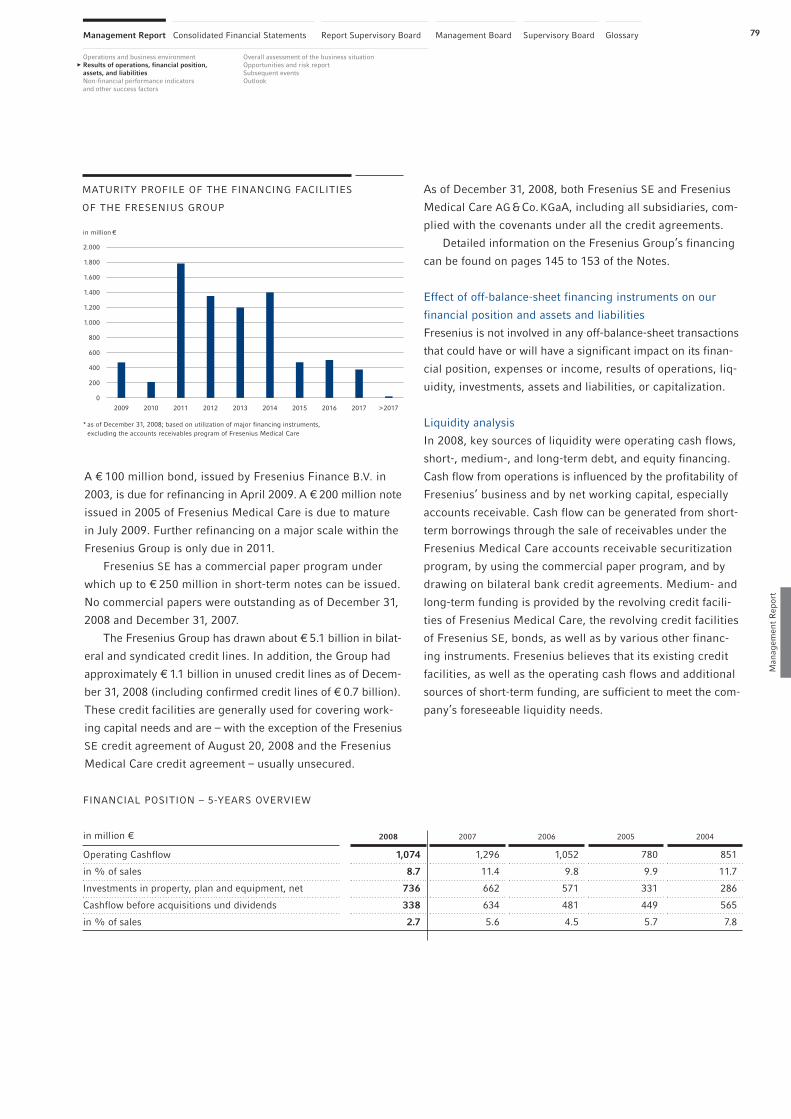
79
Man
agem
ent
Rep
ort
Overall assessment of the business situationOpportunities and risk reportSubsequent eventsOutlook
Management Report Report Supervisory Board Management Board Supervisory BoardConsolidated Financial Statements Glossary
As of December 31, 2008, both Fresenius SE and Fresenius
Medical Care AG &Co.KGaA, including all subsidiaries, com-
plied with the covenants under all the credit agreements.
Detailed information on the Fresenius Group’s financing
can be found on pages 145 to 153 of the Notes.
Effect of off-balance-sheet financing instruments on our
financial position and assets and liabilities
Fresenius is not involved in any off-balance-sheet transactions
that could have or will have a significant impact on its finan-
cial position, expenses or income, results of operations, liq-
uidity, investments, assets and liabilities, or capitalization.
Liquidity analysis
In 2008, key sources of liquidity were operating cash flows,
short-, medium-, and long-term debt, and equity financing.
Cash flow from operations is influenced by the profitability of
Fresenius’ business and by net working capital, especially
accounts receivable. Cash flow can be generated from short-
term borrowings through the sale of receivables under the
Fresenius Medical Care accounts receivable securitization
program, by using the commercial paper program, and by
drawing on bilateral bank credit agreements. Medium- and
long-term funding is provided by the revolving credit facili-
ties of Fresenius Medical Care, the revolving credit facilities
of Fresenius SE, bonds, as well as by various other financ-
ing instruments. Fresenius believes that its existing credit
facilities, as well as the operating cash flows and additional
sources of short-term funding, are sufficient to meet the com-
pany’s foreseeable liquidity needs.
A € 100 million bond, issued by Fresenius Finance B.V. in
2003, is due for refinancing in April 2009. A € 200 million note
issued in 2005 of Fresenius Medical Care is due to mature
in July 2009. Further refinancing on a major scale within the
Fresenius Group is only due in 2011.
Fresenius SE has a commercial paper program under
which up to € 250 million in short-term notes can be issued.
No commercial papers were outstanding as of December 31,
2008 and December 31, 2007.
The Fresenius Group has drawn about € 5.1 billion in bilat-
eral and syndicated credit lines. In addition, the Group had
approximately € 1.1 billion in unused credit lines as of Decem-
ber 31, 2008 (including confirmed credit lines of € 0.7 billion).
These credit facilities are generally used for covering work-
ing capital needs and are – with the exception of the Fresenius
SE credit agreement of August 20, 2008 and the Fresenius
Medical Care credit agreement – usually unsecured.
* as of December 31, 2008; based on utilization of major financing instruments, excluding the accounts receivables program of Fresenius Medical Care
2009 2010 2011 2012 2013 2014 2015 2016 2017 >2017
in million €
2.000
1.800
1.600
1.400
1.200
1.000
800
600
400
200
0
MATURITY PROFILE OF THE FINANCING FACILITIES
OF THE FRESENIUS GROUP
FINANCIAL POSITION – 5-YEARS OVERVIEW
in million € 2008 2007 2006 2005 2004
Operating Cashflow 1,074 1,296 1,052 780 851
in % of sales 8.7 11.4 9.8 9.9 11.7
Investments in property, plan and equipment, net 736 662 571 331 286
Cashflow before acquisitions und dividends 338 634 481 449 565
in % of sales 2.7 5.6 4.5 5.7 7.8
Operations and business environmentResults of operations, financial position,
assets, and liabilities
Non-financial performance indicators and other success factors

80 Management Report
Managem
ent Report
Dividend
The Management and Supervisory Boards will propose a div-
idend increase to the Annual General Meeting. For 2008, a
dividend of € 0.70 per ordinary share and € 0.71 per prefer-
ence share is proposed. This is an increase of about 6%. The
total dividend distribution will increase by 10% to € 113.6
million (2007: € 103.2 million).
Cash flow analysis
Overall, the cash flow statement shows a sustainable develop-
ment. Cash flow increased by 18% to € 1,445 million in 2008
(2007: € 1,223 million). This is due to higher depreciation and
amortization as a result of special items, while the special
items reduced net income. The change in working capital
was € -276 million (2007: € 73 million). This was due to
the increase in trade accounts receivable and the growth in
inventories.
Operating cash flow was € 1,074 million in 2008 (2007:
€ 1,296 million). The cash flow margin reached 8.7% (2007:
11.4%). Operating cash flow was more than sufficient to
meet all the financing needs for investing activities excluding
acquisitions, whereby cash used for capital expenditure was
€ 759 million and proceeds from the sale of property, plant,
and equipment amounted to € 23 million (2007: € 700 million
and € 38 million, respectively). Cash flow before acquisitions
and dividends was therefore € 338 million (2007: € 634 mil-
lion). Group dividends were financed in full from cash flow.
The cash required for acquisitions was funded through equity
measures and new debt.
Cash from financing activities (excluding dividend pay-
ments) was € 2,869 million (2007: € 83 million). In 2008, this
was marked primarily by the equity and debt financing of
the APP Pharmaceuticals acquisition. In addition to the acqui-
sition expenditure, Group dividend payments led to a cash
outflow of € 245 million in 2008 (2007: € 205 million). The
Fresenius SE dividends accounted for € 103 million (2007:
€ 89 million). Cash and cash equivalents amounted to € 370
million as of December 31, 2008 (December 31, 2007: € 361
million).
Investments and acquisitions
The Fresenius Group invested € 4,617 million in 2008 (2007:
€ 1,318 million). At € 764 million (2007: € 700 million), invest-
ment in property, plant and equipment was well above the
level of depreciation of € 476 million before special items and
serves as the basis for preserving the company’s value over
the long term and for expansion. Of the total, about 49%
was invested in maintenance and about 51% on expansion.
Acquisitions incurred € 3,853 million (2007: € 618 million).
Of the total investment volume in 2008, 17% was invested in
property, plant and equipment; 83% was spent on acquisi-
tions.
CASH FLOW STATEMENT (SUMMARY)
in million € 2008 2007
Net income before minority interest 674 793
Depreciation and amortization 783 421
Change in pension provisions -12 9
Cash flow 1,445 1,223
Change in working capital - 276 73
Change in mark-to-market valuation of the mandatory exchangeable bonds and the CVR - 95 –
Operating cash flow 1,074 1,296
Property, plant and equipment - 759 -700
Proceeds from the sale of property, plant and equipment 23 38
Cash flow before acquisitions and dividends 338 634
Cash used for acquisitions/proceeds from disposals - 2,957 -396
Dividends - 245 -205
Cash flow after acquisitions and dividends - 2,864 33
Cash provided by/used for financing activities(without dividends paid) 2,869 83
Effect of exchange rate changes on cash andcash equivalents 4 -16
Change in cash and cash equivalents 9 100
The detailed cash flow statement is shown in the consolidated financial statements.

81
Man
agem
ent
Rep
ort
Overall assessment of the business situationOpportunities and risk reportSubsequent eventsOutlook
Management Report Report Supervisory Board Management Board Supervisory BoardConsolidated Financial Statements Glossary
The table below shows the distribution of investments by
business segment. The chart shows the regional breakdown.
The cash outflows for acquisitions related mainly to
the acquisition of APP Pharmaceuticals and the acquisition
of Dabur Pharma in the Fresenius Kabi business segment.
Fresenius Medical Care invested in expanding its global di-
alysis care business and its production of renal drugs. At
Fresenius Helios, expenditure was for the acquisition of hos-
pitals. Fresenius Vamed mainly invested into hospitals in the
Czech Republic and the expansion of the service business.
The main investments in property, plant and equipment
were as follows:
� start-up of new dialysis clinics, primarily in the United
States, and expansion and modernization of existing clin-
ics for Fresenius Medical Care;
� expansion and optimization of production sites for
Fresenius Medical Care and Fresenius Kabi;
� hospital modernization for Fresenius Helios. The largest
single projects were the HELIOS clinics in Berlin-Buch
and in Schwerin.
Investments in property and plant and equipment of € 138
million will be made in 2009 to continue the major invest-
ment projects that were already underway on the reporting
date. These are chiefly investment obligations for hospitals
for Fresenius Helios as well as investments to expand and
optimize production plants. These projects will be financed
from operating cash flow.
ASSETS AND LIABILITIES
Asset and liability structure
The total assets of the Group rose by € 5,220 million (34%) to
€ 20,544 million (December 31, 2007: € 15,324 million). In
constant currency, this is an increase of 31%. Of this growth,
27% is attributable to the acquisitions in 2008, especially
APP Pharmaceuticals. The expansion of existing business ac-
tivities accounted for 4%. Inflation had no significant impact
on the assets of Fresenius in 2008.
Non-current assets were € 15,466 million (2007: € 11,033
million). Based on the exchange rates as of December 31,
2007, this was an increase of 36%, and was driven by addi-
tions to property, plant and equipment, as well as acquisi-
tions. Goodwill from acquisitions was € 3,121 million as of
December 31, 2008, of which € 2,637 million was attributa-
ble to the acquisition of APP Pharmaceuticals.
Current assets rose by 18% to € 5,078 million (2007:
€ 4,291 million). In constant currency, this is also an increase
INVESTMENTS BY REGION
Other regions 2%
Europe 14%
North America 77%
Asia-Pacific 7%
2008: € 4,617 million
in million € 2008 2007
Thereof property,plant and equipmentand intangible assets
Thereof acquisitions Change % of total
Fresenius Medical Care 687 680 467 220 1% 15%
Fresenius Kabi 3,749 294 137 3,612 – 81%
Fresenius Helios 140 323 135 5 -57% 3%
Fresenius Vamed 39 10 4 35 – 1%
Corporate/Other 2 11 21 -19 -82% –
Total 4,617 1,318 764 3,853 – 100%
INVESTMENTS BY BUSINESS SEGMENT
Operations and business environmentResults of operations, financial position,
assets, and liabilities
Non-financial performance indicators and other success factors

82 Management Report
Managem
ent Report
of 18%. Within current assets, trade accounts receivable rose
by 15% to € 2,477 million, primarily due to business expan-
sion as a result of acquisitions (2007: € 2,159 million). Aver-
age days sales outstanding (DSO) of 71 days was on previous
year’s level. The acquisition of APP Pharmaceuticals had a
positive effect while DSO increased at Fresenius Medical Care
and Fresenius Kabi. Inventories rose by 29% to € 1,127 mil-
lion (2007: € 875 million). The scope of inventory (SOI) was 48
days in 2008 (2007: 42 days). This was affected by the first-
time consolidation of APP Pharmaceuticals. The ratio of inven-
tories to total assets slightly decreased to 5.5% as of Decem-
ber 31, 2008 (December 31, 2007: 5.7%).
Shareholders’ equity, including minority interest, rose by
15%, or € 884 million, to € 6,943 million (2007: € 6,059 mil-
lion). In constant currency, this is an increase of 12%. Group
net income increased shareholders’ equity by € 270 million.
The capital increase in the third quarter of 2008 to finance the
APP Pharmaceuticals acquisition added € 289 million. The
equity ratio, including minority interest, was 33.8% as of De-
cember 31, 2008 (December 31, 2007: 39.5%).
The liabilities and equity side of the balance sheet shows
a solid financing structure. Shareholders’ equity of the Group,
including minority interest, comprises 45% of non-current
assets (2007: 55%). Together, shareholders’ equity, minority
interest, and long-term liabilities cover all non-current assets
and 81% of the inventories.
Long-term liabilities were € 9,432 million as of Decem-
ber 31, 2008, an increase of € 3,670 million compared to the
previous year’s figure of € 5,762 million. The large increase
is mainly attributable to the financing of the APP Pharma-
ceuticals acquisition. Short-term liabilities were € 4,169 mil-
lion, an increase of 19% versus the previous year’s figure
of € 3,503 million.
The Group has no significant accruals. The largest single
accrual is to cover the settlement of fraudulent conveyance
claims and all other legal matters relating to the National Med-
ical Care transaction in 1996 that resulted from the bank-
ruptcy of W.R. Grace. The accrual amounts to US$ 115 million
(€ 83 million). Please see page 162 of the Notes for details.
Group debt was € 8,787 million. This is well above the pre-
vious year’s level (2007: € 5,699 million) due to the financing
of the APP Pharmaceuticals acquisition. In constant currency
Investments Operating cash flow Depreciation and amortization
200720052004 2006
851
315
421
780
320
2,247
399
4,314
1,052
1,318
421
1,296
2008
4,617
1,074
783*
* includes special items of € 307 million from the acquisition of APP Pharmaceuticals
INVESTMENTS, OPERATING CASH FLOW, DEPRECIATION
AND AMORTIZATION IN MILLION € – 5-YEARS OVERVIEW
ASSETS AND LIABILITIES – 5-YEARS OVERVIEW
in million € 2008 2007 2006 2005 2004
Total assets 20,544 15,324 15,024 11,594 8,188
Shareholders’ equity* 6,943 6,059 5,728 5,130 3,347
As % of total assets* 34 40 38 44 41
Shareholders’ equity*/non-current assets (%) 45 55 52 64 62
Debt 8,787 5,699 5,872 3,502 2,735
As % of total assets 43 37 39 30 33
Gearing (%) 121 88 98 63 78
* including minority interest

83
Man
agem
ent
Rep
ort
Operations and business environmentResults of operations, financial position, assets, and liabilitiesNon-financial performance indicators
and other success factors
Overall assessment of the business situationOpportunities and risk reportSubsequent eventsOutlook
Management Report Report Supervisory Board Management Board Supervisory BoardConsolidated Financial Statements Glossary
it was € 8,495 million. Its relative weight in the balance sheet
increased to 42.8% (2007: 37.2%). Approximately 63% of
the Group’s debt is denominated in US dollars. Liabilities due
in less than one year were € 1,262 million (2007: € 932 mil-
lion), while liabilities due in one to five years or more were
€ 7,525 million (2007: € 4,767 million).
The net debt to equity ratio including minority interest
(gearing) has risen to 121.2% (2007: 88.1%). The return
on equity after taxes reached 10.5% (2007: 12.0%), and
the return on total assets after taxes and before minority
interest was 4.0% in 2008 (2007: 5.2%); both pro forma
APP Pharmaceuticals and including special items related to
the acquisition.
The table below shows other key asset and capital ratios:
Currency and interest risk management
The nominal value of all foreign currency hedging contracts
was € 1,493 million as of December 31, 2008. These con-
tracts had a market value of € 31 million. The nominal value
of interest rate hedging contracts was € 3,470 million. These
contracts had a market value of € -191 million. Please see
the Risk Report on page 94 and the Notes on pages 166 to
169 for further details.
NON-FINANCIAL PERFORMANCE INDICATORS
AND OTHER SUCCESS FACTORS
EMPLOYEES
The Fresenius Group had 122,217 employees worldwide at
the end of 2008. The increase of 8,036 or 7% (December 31,
2007: 114,181) was mainly due to acquisitions.
Employee numbers in the business segments were as
follows:
The chart shows the distribution of our employees by region.
These percentages roughly correspond to the sales contri-
butions of the respective continents. With an increase of 7%,
the number of employees has grown significantly in North
America. This is mainly due to the APP Pharmaceuticals acqui-
sition. The number of employees also rose strongly in Asia-
Pacific, with an increase of 32%. This reflects the acquisition
in million € Dec 31, 2008 Dec 31, 2007
Debt/EBITDA* 3.8 2.8
Net debt/EBITDA* 3.6 2.6
EBITDA/interest ratio* 4.0 5.5
* pro forma APP acquisition (included for the full year 2008)and before special items
Number of employees Dec 31, 2008 Dec 31, 2007 Change
Fresenius Medical Care 68,050 64,662 5%
Fresenius Kabi 20,457 16,964 21%
Fresenius Helios 30,088 30,043 0%
Fresenius Vamed 2,802 1,767 59%
Corporate/Other 820 745 10%
Total 122,217 114,181 7%
EMPLOYEES BY REGION
Asia-Pacific 8%
North America 35%
Europe 48%
Latin America and
other regions 9%
2008: 122,217
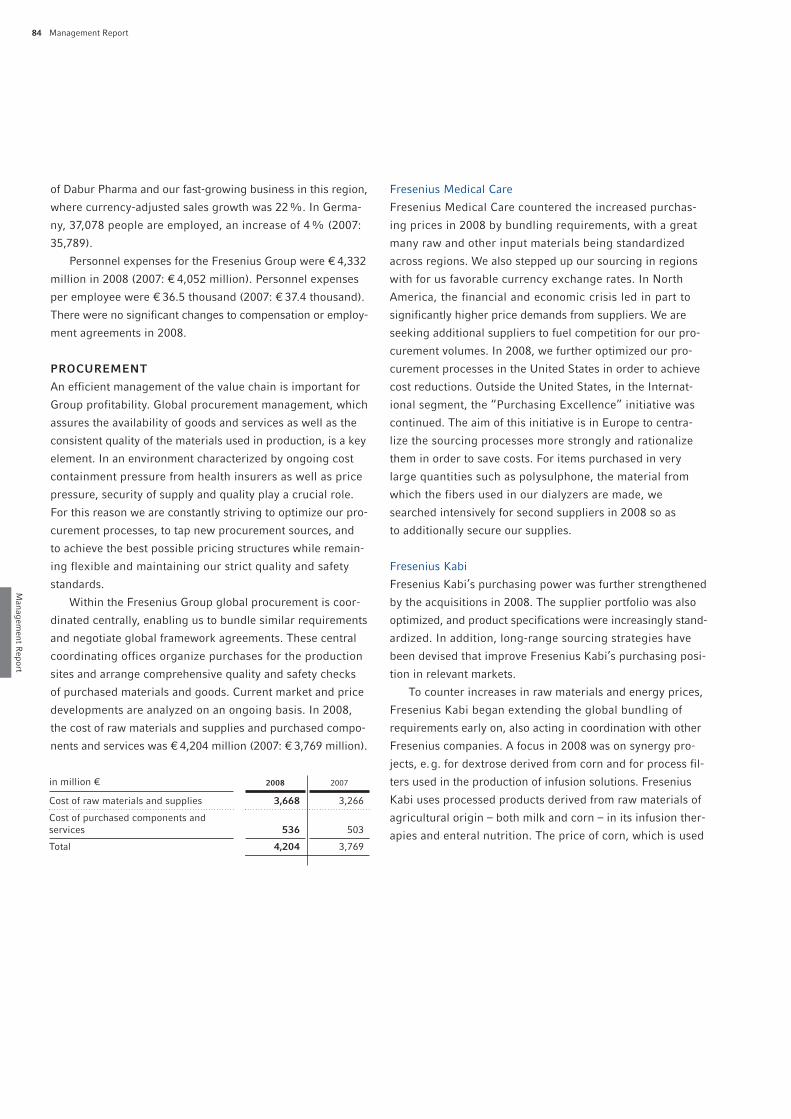
84 Management Report
Managem
ent Report
of Dabur Pharma and our fast-growing business in this region,
where currency-adjusted sales growth was 22%. In Germa-
ny, 37,078 people are employed, an increase of 4% (2007:
35,789).
Personnel expenses for the Fresenius Group were € 4,332
million in 2008 (2007: € 4,052 million). Personnel expenses
per employee were € 36.5 thousand (2007: € 37.4 thousand).
There were no significant changes to compensation or employ-
ment agreements in 2008.
PROCUREMENT
An efficient management of the value chain is important for
Group profitability. Global procurement management, which
assures the availability of goods and services as well as the
consistent quality of the materials used in production, is a key
element. In an environment characterized by ongoing cost
containment pressure from health insurers as well as price
pressure, security of supply and quality play a crucial role.
For this reason we are constantly striving to optimize our pro-
curement processes, to tap new procurement sources, and
to achieve the best possible pricing structures while remain-
ing flexible and maintaining our strict quality and safety
standards.
Within the Fresenius Group global procurement is coor-
dinated centrally, enabling us to bundle similar requirements
and negotiate global framework agreements. These central
coordinating offices organize purchases for the production
sites and arrange comprehensive quality and safety checks
of purchased materials and goods. Current market and price
developments are analyzed on an ongoing basis. In 2008,
the cost of raw materials and supplies and purchased compo-
nents and services was € 4,204 million (2007: € 3,769 million).
Fresenius Medical Care
Fresenius Medical Care countered the increased purchas-
ing prices in 2008 by bundling requirements, with a great
many raw and other input materials being standardized
across regions. We also stepped up our sourcing in regions
with for us favorable currency exchange rates. In North
America, the financial and economic crisis led in part to
significantly higher price demands from suppliers. We are
seeking additional suppliers to fuel competition for our pro-
curement volumes. In 2008, we further optimized our pro-
curement processes in the United States in order to achieve
cost reductions. Outside the United States, in the Internat-
ional segment, the “Purchasing Excellence” initiative was
continued. The aim of this initiative is in Europe to centra-
lize the sourcing processes more strongly and rationalize
them in order to save costs. For items purchased in very
large quantities such as polysulphone, the material from
which the fibers used in our dialyzers are made, we
searched intensively for second suppliers in 2008 so as
to additionally secure our supplies.
Fresenius Kabi
Fresenius Kabi’s purchasing power was further strengthened
by the acquisitions in 2008. The supplier portfolio was also
optimized, and product specifications were increasingly stand-
ardized. In addition, long-range sourcing strategies have
been devised that improve Fresenius Kabi’s purchasing posi-
tion in relevant markets.
To counter increases in raw materials and energy prices,
Fresenius Kabi began extending the global bundling of
requirements early on, also acting in coordination with other
Fresenius companies. A focus in 2008 was on synergy pro-
jects, e.g. for dextrose derived from corn and for process fil-
ters used in the production of infusion solutions. Fresenius
Kabi uses processed products derived from raw materials of
agricultural origin – both milk and corn – in its infusion ther-
apies and enteral nutrition. The price of corn, which is used
in million € 2008 2007
Cost of raw materials and supplies 3,668 3,266
Cost of purchased components and services 536 503
Total 4,204 3,769

85
Man
agem
ent
Rep
ort
Overall assessment of the business situationOpportunities and risk reportSubsequent eventsOutlook
Management Report Report Supervisory Board Management Board Supervisory BoardConsolidated Financial Statements Glossary
as a basic raw material for various processed products, rose
strongly at times in the course of 2008. Following large price
increases for processed milk products, supply grew in 2008.
As a result of this development, Fresenius Kabi was able to
enhance its negotiating results. A bidding process was devel-
oped together with Fresenius Medical Care for joint require-
ments in the area of solution filters. This will take effect
in 2009.
The bundling of requirements for the strategic sourcing
of active substances for the production of pharmaceuticals
progressed successfully in 2007, resulting in a cost reduction
in 2008.
The prices of energy, oil-based products, and all products
based on energy-intensive production processes increased
again in 2008. These include plastic granulate and foil used
in the production of primary packaging for infusion solutions
and other pharmaceutical products, glass for containers, and
aluminum for fastenings. A supply agreement for aluminum
fastenings was concluded in 2007 at slightly increased prices,
but these were still below the level of market prices in 2008.
There were further increases in the prices of cardboard boxes.
Thanks to an agreement concluded in 2005, the price of
electricity was held stable at the locations in Germany in 2008.
Moreover, Fresenius Kabi had already examined the poten-
tial for cutting gas and electricity costs in a number of regional
synergy projects in 2007. This will be continued and extended
over the long term.
The “Fresenius Pool IT” sourcing project was also com-
pleted in 2008 with very good negotiating results. This led
to the conclusion of new contracts for IT hardware for all
Fresenius companies.
For the production of IV drugs in the United States, we
require raw and other materials conforming to U.S. Food and
Drugs Administration regulations. Some materials are only
available from a limited number of suppliers, meaning that
higher stocks of these materials may need to be maintained
at times. Quality management and procurement management
are therefore closely coordinated to assure stability of supply
and the consistently high quality of the production materials
together with optimum storage.
Fresenius Helios
At HELIOS, high medical standards go hand in hand with
an efficient, economically sound management of available
resources. Its procurement management system combines
the expertise of its doctors and nurses with the commercial
competence gained in other areas from the various clinics
and disciplines. This capability and our standards of medical
quality are channeled into all procurement decisions for the
benefit of the patient.
Today, more than 85% of our medical supplies are stand-
ardized. A system of 280 product groups promotes transpar-
ency, planning efficiency, and competition. The electronic
configuration of all purchasing processes (e-procurement) –
from ordering to billing – results in even greater efficiency
and transparency. The process of consolidation among firms
in the healthcare market can lead to temporary supply bot-
tlenecks. Procurement management at HELIOS is success-
fully forestalling this by standardizing the drugs and medical
devices used at its clinics.
In 2008, the HELIOS Drug List was introduced, with 45
supply contracts covering 90% of our clinics’ drug require-
ments. About 10% of the product portfolio used at the clin-
ics was standardized. For the first time, 170 generic active
agents, representing an annual procurement volume of over
€ 4 million, were negotiated on a coordinated basis. The
goal was to standardize the drugs used at the HELIOS clinics
and agree with suppliers a minimum three-year period of
stability for this broad range of products. This cut costs by
over € 400,000 in 2008.
HELIOS actively involves suppliers in the procurement
management evaluation process. This is done once a year and
reviews the business relationship between HELIOS and its
suppliers from the viewpoint of both partners. The resulting
ratings and feedback are used to optimize business rela-
tions. A total of 59 suppliers took part in HELIOS’ third part-
ner rating process at the end of 2008.
In procurement management, the quality attributes of the
products used are of essential importance. For example, in
2008 HELIOS Kliniken Group sourced new safety syringes for
Operations and business environmentResults of operations, financial position, assets, and liabilitiesNon-financial performance indicators
and other success factors

86 Management Report
Managem
ent Report
blood collection and vein punctures where, after use, an irre-
versible guard is automatically fitted over the used syringe,
excluding all risk of accidental injury and infection for staff
and patients. Statutory regulations only require such safety
syringes to be used where the risk of accidental injury from
hypodermic needles is particularly high. HELIOS Kliniken
Group, however, uses these syringes in all inpatient and work-
ing areas.
In 2008, there were further increases in energy and food
prices. As a basis for its energy sourcing, HELIOS has created
an energy benchmark database that provides transparency
for all utilities (electricity, gas/heating oil, heat, water, and
waste water) at all clinic locations. Variances in consumption
and costs are promptly detected and directly acted upon.
HELIOS monitors the price trends on the energy exchanges
daily. Because pricing in the energy sector is not determined
solely by the actual energy price itself but also by other
components such as third-party access fees, HELIOS does
not conclude framework agreements for energy supplies.
In the second quarter of 2006, HELIOS purchased its electric-
ity for 2007 and 2008. In comparison to what they were
when HELIOS contracted, prices rose by over 30% on aver-
age. Thanks to the transparency created and to monitoring
current price trends, HELIOS is able to take advantage of
opportunities to buy energy at the best possible times. For
this purpose, HELIOS uses the enPortal online platform with
links to about 150 energy utilities in Germany. If HELIOS
tags all 57 clinic locations on this platform as buyers of elec-
tricity, all potential suppliers can quote within a day for each
location. While negotiations without the platform would
take about 10 to 12 weeks to complete, HELIOS can conduct
the bidding process and the placement of contracts within
three to four days.
QUALITY MANAGEMENT
Our quality management has the following three objectives:
� to identify value-enhancing processes oriented to the
needs of our customers and to efficiency;
� to use performance indicators to monitor and steer
these processes; and
� to improve procedures.
These objectives overlay the quality of our products and all
services and therapies that we provide. Our quality manage-
ment system integrates all product groups, including drugs,
medical devices, and nutrition, as well as our clinics. The
quality management system is regularly evaluated by inter-
nal audits and external certification bodies. Our products
are closely controlled even at the development stage. Because
our drugs are subject to regulatory approval, appropriate
documentation has to be prepared and submitted in accor-
dance with national and international regulations. Medical
devices undergo a conformity assessment procedure that
documents their compliance with the appropriate norms. In
enteral nutrition, we follow the Hazard Analysis Critical
Control Point (HACCP) principle during the development pro-
cess. We have established quality assurance systems in all
our production facilities. In addition to the controlled use of
materials, validated production procedures, and ambience
and in-process controls, each batch produced also undergoes
final controls and a formal release procedure. Our produc-
tion facilities are regularly inspected by regulatory authorities
or other independent institutions. All audits and inspections
have resulted in the renewal of the relevant manufacturing
authorization or certification. Sales and marketing are also an
integral part of the quality management system. For exam-
ple, at any given time we are able to trace where every batch
has been supplied.

87
Man
agem
ent
Rep
ort
Overall assessment of the business situationOpportunities and risk reportSubsequent eventsOutlook
Management Report Report Supervisory Board Management Board Supervisory BoardConsolidated Financial Statements Glossary
In recent years, HELIOS has initiated and further developed
a performance indicator system to evaluate the quality of med-
ical results in hospitals. Although not based on ISO certifica-
tion, within the hospital market this system is acknowledged
as a highly innovative procedure. The system is even used
as quality standard in more than 200 German hospitals out-
side HELIOS Group. Furthermore, in 2008 the Swiss Federal
Office of Public Health (Bundesamt für Gesundheit) started
a pilot project based on the HELIOS quality management sys-
tem to evaluate quality indicators in the hospital market.
Fresenius Medical Care
As a supplier of products and services for treating people with
kidney disease Fresenius Medical Care has a special respon-
sibility for its patients and thus for maintaining quality stand-
ards. Its Integrated Management System (IMS) not only takes
account of statutory regulations and standards applying to
its products business and services but is also oriented to inter-
nal processes. It meets the requirements of ISO Standard
9001:2000 for quality management systems and combines this
with those of ISO Standard 14001:2004 for environmental
management systems. At the same time it takes account of the
special standard for medical products ISO 13485:2003. IMS
has been introduced at most production facilities in Europe.
In the United States, the production sites in Odgen and
Walnut Creek and in Mexico in Reynosa are certified to ISO
13485:2003.
The number of clinics in Europe conforming to quality
management standard ISO 9001:2000 rose to 282.
Fresenius Medical Care monitors the effective implemen-
tation of IMS through so-called audits. To ensure that these
audits can be carried out regularly and company-wide further
employees were trained in 2008. Generally, quality manage-
ment is to be even more firmly embedded among employees.
Fresenius Medical Care is currently developing a training
management system. This holistic system, like IMS, will not
only cover aspects of product quality but also environmen-
tal management, occupational safety and especially risk man-
agement issues.
To assess quality in dialysis care, we use the generally
accepted quality parameters customary in dialysis, such as
the hemoglobin values. Hemoglobin mainly serves to trans-
port oxygen from the respiratory organs to the body tissues
that use oxygen. Our patients should have a hemoglobin
level of at least 11 grams per deciliter of blood. The average
hemoglobin level for healthy people is slightly above that.
Other indicators we use to assess treatment quality include
the phosphate level and the so-called Kt/V value, which
measures the effectiveness of the dialysis treatment by cal-
culating the filtration rates for certain toxic molecules in
relation to the length of treatment. Other quality indicators
are albumin, which gives an idea of the patient’s general
nutritional condition, and the number of days which dialysis
patients have to spend in the hospital. Measured on the
basis of the above parameters, the quality of dialysis treat-
ment at Fresenius Medical Care was further improved
in 2008.
Fresenius Kabi
Quality management at Fresenius Kabi is subject to a great
many national and international regulations, such as Good
Clinical Practice (GCP), current Good Manufacturing Practice
(cGMP), Good Distribution Practice (GDP), ISO Standard
13485:2003, the environmental management standard ISO
14001:2004 as well as regulatory, product-specific require-
ments. All of these requirements have been integrated into a
quality management system conforming to ISO Standard
9001:2008. Fresenius Kabi has included virtually all its global
production facilities and the majority of the local sales
Operations and business environmentResults of operations, financial position, assets, and liabilitiesNon-financial performance indicators
and other success factors
88 Management Report
Managem
ent Report
organizations in the external certification process. Quality
management at our production sites, in the sales divisions,
and at a cross-functional level is reviewed regularly by
national and international regulatory authorities and by
customers. The high standards and exemplary function-
ality of the systems were again confirmed in 2008.
The focus in 2008 was on new certification for the sales
organizations outside Europe. In addition to European sites,
plants in India and China are included in the certification
process to environmental standard 14001:2004. The existing
electronic workflow systems were further refined to improve
global communication in the area of quality management.
The diverse statutory requirements applying to drugs,
medical devices, and nutritional products require Fresenius
Kabi to meet a wide range of international and regional stan-
dards. Compliance with these standards is regularly audited.
Worth special mention is the successful inspection of our phar-
macovigilence system (drug safety system) by the British
Medicines and Healthcare Products Regulatory Agency, which
inspected our local drug safety system in Great Britain, and
their cooperation with our central pharmacovigilence organi-
zation. The inspection covered gathering data, providing
documentation, and reporting instances of drug side effects
and failures as well as defects in pharmaceutical products.
Successful inspections were also carried out by the U.S. Food
and Drug Administration at a number of locations.
We have initiated the integration of our quality manage-
ment processes at Dabur Pharma and APP Pharmaceuticals,
and will be continuing this work in 2009. Since both com-
panies already have a well-established and proven quality
management system, Fresenius Kabi is concentrating on
“best practice” solutions perfected to the Group-wide stan-
dard. Dabur Pharma is a leading supplier of generic drugs
and active agents for cancer treatment. Active substances for
cancer treatment need to be handled with extreme care, so
special attention is paid in our quality management system
to the safety of employees who come into contact with this
group of products.
Another project in 2009 will be the certification of the
compounding business to ISO 9001:2008.
Fresenius Helios
The HELIOS quality management system that was developed
in-house is committed to a continuous improvement in patient
care. Now, over 900 indicators (2007: about 700) cover all
the main diseases, so that the number of services performed
and partially also surgical procedures and, where possible,
the quality of the outcomes, can be recorded. Utilizing over
142 indicators, our annual medical report regularly publishes
the 30 most important diseases and surgical procedures for
the HELIOS Group. The individual clinics provide this informa-
tion in their hospital guidebooks. The results are also pub-
lished on the Internet. These publications demonstrate the
exemplary transparency of HELIOS’ performance externally.
Demanding targets were defined for 33 indicators. In these
areas, the HELIOS clinics aim to be at least as good as the
German average. Where benchmark data are available, HELIOS
expects its clinics to match best-in-class international stan-
dards in surgical medicine. The Group met or significantly
exceeded the targets for 24 of these indicators. Group-wide
mortality rates for major diseases, such as heart attack, heart
failure, stroke, and pneumonia, and for many major surgical
procedures, were well below the German average – by as
much as 29% in some cases. For example, the mortality rate
in the treatment of fractures of the neck of the femur, often
caused by falls of elderly persons, was below the German
average. Where targets were not achieved, the deviation from
the German average was so small as to be statistically insig-
nificant. The medical teams at HELIOS are also pursuing goals
relating to care in their various specialist areas.
HELIOS has taken yet another important step aimed at
independent and transparent reporting of treatment quality:
The Initiative of Quality Medicine (IQM) was launched in
collaboration with six other hospital operators. Close to a mil-
lion patients are treated at the 100 or so clinics covered by
this initiative. Members undertake to conduct standardized
measurements of the quality of the treatment results at
their clinics, based on administrative data, and to publish the
results. This voluntary commitment also includes a form
of peer reviewing: Internal and external experts analyze the

89
Man
agem
ent
Rep
ort
Overall assessment of the business situationOpportunities and risk reportSubsequent eventsOutlook
Management Report Report Supervisory Board Management Board Supervisory BoardConsolidated Financial Statements Glossary
treatment results that do not meet the initiative’s quality goals
and discuss concrete improvements with the clinic involved.
The aim of this review is to achieve improvements in the pro-
cedures and structures of the treatment process. IQM is the
first multi-operator, administrative data-based quality assur-
ance initiative in Germany and furthers HELIOS’ interest in
improving the transparency of quality data for the German
health care market.
Fresenius Vamed
In the planning and construction of hospitals, Fresenius
Vamed sets high quality standards in its flexible design of
parameters across processes and structures. These param-
eters include process optimization (covering, for example,
ambulance bays, admission and discharge areas, interdis-
ciplinary emergency facilities, interdisciplinary outpatient
clinics), differentiation according to modular care levels
(from basic to intensive care), and the flexible use of build-
ings and wards in response to shifts in demand – always
allowing for particular reimbursement systems and technical
developments. VAMED has an internationally experienced
team of experts who assure the quality of the structural and
process design even when the project is at the concept
stage and after, when the services are established. Internally,
the processes are designed for efficiency and sustainabil-
ity, using interdisciplinary quality standards. These standards
are mostly based on ISO 9001:2000 and ISO 13485:2003
standards, as well as the standards of the European Founda-
tion for Quality Management (EFQM).
VAMED was honored twice in the Austrian State Quality
Awards in 2008. In addition to coming first in the large com-
pany category, VAMED won a jury prize for special achieve-
ments. This latter award was mainly in recognition of its close
cooperation with the Vienna General Hospital and Univer-
sity Clinic (AKH). VAMED is the general contractor at the AKH,
responsible for the buildings’ utilities and operations, fleet
management, waste management, environmental and energy
management, and for servicing the approximately 48,000
medical devices.
SALES, MARKETING, AND LOGISTICS
Long-term, mutually trusting cooperation with our customers
is an essential basis for sustainable growth. We strive to
guarantee top quality and outstanding service to our custom-
ers, together with reliable logistics and product availability.
Thanks to its broad product portfolio and long experience,
Fresenius has been able to build and maintain close relation-
ships with its customers worldwide. Close cooperation be-
tween sales and research&development divisions enables the
company to integrate concepts and ideas generated by the
sales force with respect to product development. Fresenius
has its own sales organizations with trained sales personnel.
The sales teams coordinate direct sales promotion measures,
including visits to doctors, medical specialists, hospitals,
and specialist clinics. The company also employs distributors
in countries where we do not have our own sales team.
Fresenius’ products are shipped by the production plants
to central warehouses, generally located not far from the pro-
duction sites. These central warehouses dispatch the prod-
ucts to regional warehouses, which then distribute them to
the clinics and other customers, or directly to a patient’s
home. The business segments offer after-sales services, train-
ing in the local language, technical support, servicing, and
maintenance and warranty arrangements in every country in
which Fresenius sells its products. Product training is also
provided at the company’s production sites. Regional service
centers are responsible for day-to-day international service
support.
The business segments have the following customer
structure:
Dialysis clinics and hospitals are Fresenius Medical Care’s
main customers for its products business. In dialysis care,
approximately 35% of Fresenius Medical Care’s revenues are
derived from the U.S. government’s Medicare/Medicaid
programs, with about 65% from hospitals and private and
other health care payors.
Operations and business environmentResults of operations, financial position, assets, and liabilitiesNon-financial performance indicators
and other success factors

90 Management Report
Managem
ent Report
Fresenius Kabi has a broadly diversified customer base that
includes hospitals, wholesalers, purchasing organizations,
medical and similar institutions, hospital operators, and home
care patients. Fresenius Kabi has no significant dependence
on one source of revenue. In the United States, the products
of APP Pharmaceuticals are distributed primarily through
group purchasing organizations.
The customers of Fresenius Helios include social security
institutions, health insurers, and private patients.
The clients of Fresenius Vamed are public and private hos-
pitals and other health care facilities.
OVERALL ASSESSMENT OF THE BUSINESS
SITUATION
At the time this Group Management Report was prepared,
the Management Board continued to assess the development
of the Fresenius Group as positive. Our products and serv-
ices continue to be in significant demand around the world.
Operating performance in the first weeks of 2009 has been
in line with our expectations, with further increases in sales
and earnings.
OPPORTUNITIES AND RISK REPORT
Through the expansion, especially in international mar-
kets, and the complexity and dynamics of our business, the
Fresenius Group is exposed to a number of risks. These
risks are directly related to our business activities and have
to be accommodated if opportunities are to be exploited.
As a provider of often life-saving products and services for
the severely and chronically ill, we are relatively independ-
ent of economic cycles. Our experience in the development
and manufacture of products, as well as in our markets,
serves as a solid basis for a reliable assessment of risks. At
the same time, we will continue to take advantage of the
wide-ranging opportunities for sustainable growth that the
health care market offers to the Fresenius Group.
OPPORTUNITIES MANAGEMENT
Managing opportunities is an ongoing, integral part of corpo-
rate activity, aimed at securing the company’s long-term
success. In this way, we can explore new prospects and con-
solidate and improve on what we have already achieved.
Opportunities management is closely linked to the Fresenius
Group’s long-term strategy and medium-term planning. The
Group’s decentralized and regional organizational and man-
agement structure enables the early identification and anal-
ysis of trends, requirements, and opportunities in our often
fragmented markets; and we can respond to them flexibly
and in line with local market needs. Furthermore, we main-
tain regular contact and dialogue with research groups and
institutions, and keep a close watch on markets and compet-
itors in order to identify opportunities. Within the Group,
opportunities and synergies can be exploited through con-
tinuous communication involving the exchange of informa-
tion and know-how between the various business segments.
Anticipated future opportunities for the Fresenius Group are
discussed in the Outlook starting on page 97.
RISK MANAGEMENT
Like opportunities management, risk management is a con-
tinuous process. Identifying, analyzing, and controlling risks
are key tools of solid group management. The Fresenius
risk management system is closely linked to corporate strat-
egy and is based on its guidelines. Through the combina-
tion of our internal monitoring system, our risk controlling
procedures, and an early-warning system derived from our
risk management system, we can identify and counteract at
an early stage those developments that might threaten the
companies’ future. Responsibilities for the processes and for
monitoring risks in the individual business segments have
been assigned as follows:
� Using standardized processes, risk situations are evaluated
regularly and compared with specified requirements. If
negative developments emerge, responses can be initiated
at an early stage.

91
Man
agem
ent
Rep
ort
Operations and business environmentResults of operations, financial position, assets, and liabilitiesNon-financial performance indicators and other success factors
Overall assessment of the business situation
Opportunities and risk report
Subsequent eventsOutlook
Management Report Report Supervisory Board Management Board Supervisory BoardConsolidated Financial Statements Glossary
� The managers responsible are required to report without
delay any relevant changes in the risk profile to the Man-
agement Board.
� Markets are kept under constant observation and close
contacts maintained with customers, suppliers, and insti-
tutions. These policies allow us to swiftly identify and
react to changes in our business environment.
Risk management measures are supported both at Group
level and in the individual business segments by our risk con-
trolling measures and our management information system.
Detailed monthly and quarterly financial reports are used to
identify and analyze deviations in earnings and in assets
and liabilities from budget figures. In addition to risk manage-
ment, a monitoring system oversees organizational processes
and measures as well as internal controls and audits. Our
risk management system is regularly evaluated and, if neces-
sary, adjusted to allow prompt reaction to changes in the mar-
kets. This system has proved effective to date.
The functionality and effectiveness of the risk manage-
ment system is reviewed as part of the audit of the annual
financial statements and the internal audit. Conclusions aris-
ing from the audit are taken into account in the ongoing
refinement of our risk management system.
RISK AREAS
The main risk areas for the operations of the Fresenius
Group are as follows:
� General economic risks
At present, the development of the global economy exhib-
its no significant risk to the Fresenius Group. Although
overall economic growth should weaken considerably in
2009, we expect growing demand for our life-saving and
life-sustaining products and services.
� Risks in the general operating framework
The risk situation for each business segment depends
on the development of its markets. Therefore, political,
legal, and financial conditions are monitored and eval-
uated carefully. In addition, the growing internationaliza-
tion of our markets requires us to keep abreast of coun-
try-specific risks.
� Risks in the health care sector
Risks related to changes in the health care market are of
major importance to the Fresenius Group. The main risks
are the development of new products and therapies by
competitors, the financing of health care systems, and
reimbursement in the health care sector. The latter applies
especially in the United States, where a large portion of
our sales are generated, and where e. g. changes in the
reimbursement system could have an impact on our busi-
ness. The same applies to the hospital market in Ger-
many, where the DRG system (Diagnosis Related Groups)
is intended to increase the efficiency of hospitals while
reducing health care expenditure. The Company constant-
ly monitors further legislative developments of the DRG
system. Discussions about an ending dual financing in the
hospital sector are also being followed. Patients are largely
assigned to hospitals by the public health and pension
insurers. It is therefore especially important for the com-
pany that the contracts between its hospitals and the
insurers and health care institutions are maintained. For
this reason, we not only continually monitor legislative
changes but proactively work with governmental health
care institutions. Generally, our aim is to counter possi-
ble regulatory risks through enhanced performance and
cost reductions.
In the United States, almost all injectable pharmaceu-
tical products are sold to customers through arrange-
ments with group purchasing organizations (GPOs) and
distributors. The majority of hospitals contract with the
GPO of their choice for their purchasing needs. APP Phar-
maceuticals currently derives, and expects to continue
92 Management Report
Managem
ent Report
to derive, a large percentage of its revenue through a
small number of GPOs. Currently, fewer than ten GPOs
control a large majority of sales to hospital customers.
APP Pharmaceuticals has purchasing arrangements with
the major GPOs. To maintain these relationships, APP
Pharmaceuticals believes it needs to be a reliable sup-
plier, offer a broad high-quality product line, remain
price competitive and comply with FDA regulations. The
GPOs also have purchasing agreements with other man-
ufacturers, and the bid process for products such as
those of APP Pharmaceuticals is highly competitive. Most
of APP Pharmaceuticals’ GPO agreements can be termi-
nated at short notice.
In addition, our close ties with the medical and scien-
tific communities allow us to identify and support relevant
technological innovations and to keep abreast of devel-
opments in alternative treatment methods. These enable
us to evaluate and adjust our corporate strategy if neces-
sary.
� Operating risks
� Production, products and services
We confront potential risks in production and services
with the following measures: Compliance with product and
manufacturing regulations is insured by quality manage-
ment systems in accordance with the internationally rec-
ognized quality standards ISO 9001 and ISO 9002 and
corresponding internal standards as defined, for example,
in our quality and work procedure manuals. Regular
audits are carried out by quality management officers at
the Group’s production sites and dialysis clinics. These
audits test compliance with all regulations in all areas –
from management and administration to production and
clinical services and patient satisfaction. Our produc-
tion facilities comply with the international “Good Manu-
facturing Practice” (GMP) guidelines and other interna-
tionally and nationally recognized standards. In addition,
the quality management and compliance programs doc-
ument and make sure that business is carried out in line
with high ethical standards and in accordance with offi-
cial procedures. Internal and external audits review the
legality and efficiency of our operations and the effec-
tiveness of our internal monitoring systems. Potential risks,
such as those arising from the start-up of a new produc-
tion site or the introduction of new technologies, are
countered through careful planning, regular analysis, and
continual progress reviews.
Performing medical procedures on patients in our
hospitals and post-acute care clinics presents inherent
risks; in addition, operational risks, for example the
need for strict hygiene and sterile conditions, can arise.
We counteract these risks with strict working proce-
dures, continuous personnel training, and patient-ori-
ented working methods.
Risks can also arise from increasing pressure on our
product prices and from price increases on the procure-
ment side. For instance, changes in the United States in
the regulations concerning the reimbursement for ery-
thropoietin (EPO), or a change in the dosage, could have
a significant impact on the revenues and earnings of
Fresenius. EPO is a hormone used in dialysis that stimu-
lates the production of red blood cells. An interruption
in supply or worsening procurement conditions for EPO
could also reduce revenues and significantly increase
Fresenius’ costs. To counter this risk, Fresenius Medical
Care has entered into an agreement with Amgen for
the supply of EPO in the United States and Puerto Rico.
Amgen is the sole supplier of EPO in the United States.
The agreement runs until December 31, 2011. Reim-
bursement and revenues from the administration of EPO
accounted for approximately 7% of total sales of the
Fresenius Group in 2008.

93
Man
agem
ent
Rep
ort
Management Report Report Supervisory Board Management Board Supervisory BoardConsolidated Financial Statements Glossary
Growing competition could adversely affect the pricing
and sale of our products and services. The introduction
of new products and services by competitors could make
products and services of the Fresenius Group less com-
petitive. On the procurement side, we counter risks, which
mainly involve possible price increases, by appropri-
ately selecting and working together with our suppliers
through long-term framework agreements in certain
purchasing segments and by bundling volumes within the
Group. Generally, the markets in which we operate are
characterized by price pressure, competition, and efforts
to contain health care costs. These could result in lower
sales and adversely affect our business, our financial posi-
tion, and our operational results.
We counter the risks associated with the engineer-
ing and hospital services business through professional
project management and control, and with a proven
system tailored to each business activity for identifying,
evaluating, and minimizing these risks. This system
consists of organizational measures (such as standards
for pricing-in risks when preparing quotations, risk
assessment before accepting orders, regular project con-
trolling, and continual risk assessment updates), qual-
ity assurance measures, and financial measures, such as
checking creditworthiness, securing payment in advance
through deposits, letters of credit and secured credits.
� Research and development
The development of new products and therapies always
carries the risk that the ultimate goal is not achieved.
Regulatory approval of new products requires comprehen-
sive, cost-intensive preclinical and clinical studies. The
Fresenius Group spreads its risk widely by conducting
development activities in various product segments. We
also counteract risks from research and development
projects by regularly analyzing and assessing development
trends and examining the progress of research projects.
We also strictly comply with the legal regulations for clini-
cal and chemical-pharmaceutical research and develop-
ment. With IV drugs, it is also crucial that new products
are brought to the market continually and at the right
time.
� Risks from the integration of acquisitions
The integration of acquisitions or potential acquisitions
carries risks that can adversely affect Fresenius’ assets and
liabilities, our financial position, and results of opera-
tions. Following an acquisition, the infrastructure of the
acquired company must be integrated while legal ques-
tions and contractual obligations are being clarified. Mar-
keting, patient services, and logistics must also be uni-
fied. During the integration phase, key managers can leave
the company and the course of ongoing business as well
as relationships with customers and employees can be
harmed. In addition, change of control clauses may be
claimed. The integration process may prove to be more
difficult and cost-intensive or last longer than expected.
Risks can arise from the operations of the newly acquired
company that Fresenius regarded as insignificant or
was unaware of. An acquisition may also prove to be less
beneficial than initially expected. Future acquisitions
may be a strain on the finances and management of our
business. Moreover, as a consequence of an acquisition
Fresenius may become directly or indirectly liable toward
third parties or claims against third parties may turn out
to be nonassertible.
Acquired by Fresenius in 2008, APP Pharmaceuticals
has agreed to indemnify Abraxis BioScience, Inc. which
split from it in 2007, from and after the spin-off with respect
to all liabilities of the pre-separation company related to
APP Pharmaceuticals’ business. At the same time, Abraxis
BioScience agreed to indemnify APP Pharmaceuticals
Operations and business environmentResults of operations, financial position, assets, and liabilitiesNon-financial performance indicators and other success factors
Overall assessment of the business situationOpportunities and risk report
Subsequent eventsOutlook

94 Management Report
Managem
ent Report
from and after the spin-off with respect to all liabilities of
the pre-separation company not related to APP Pharma-
ceuticals’ business. The extent to which Abraxis Bio-
Science will be able to satisfy these potential claims in
future cannot be predicted.
As a result of Fresenius’ acquistion of APP Pharmaceu-
ticals, the spin-off from Abraxis BioScience which took
place in 2007 could fail to qualify as a tax-free distribution.
A fiscal law assessment obtained within the scope of
the acquisition confirms that the acquisition of APP Phar-
maceuticals should not affect the qualification of the
spin-off as a tax-free distribution in 2007. However, this
opinion is not binding on the Internal Revenue Service
(IRS), nor does it preclude the IRS from asserting a con-
trary position. If, notwithstanding the opinion, the IRS
were to audit the spin-off and successfully assert that the
spin-off failed to qualify for the tax-free status as a re-
sult of the acquisition of APP Pharmaceuticals, this would
lead to a material tax liability.
� Personnel risks
Risks in personnel marketing are not considered to be sig-
nificant. Nevertheless, the Group uses comprehensive
recruiting and personnel development programs to coun-
teract a possible shortage of skilled personnel. By using
targeted personnel marketing measures to recruit a qual-
ified and dedicated workforce, Fresenius counters the
general shortage of specialized hospital personnel, thus
insuring our high standards of treatment quality. At the
same time, by assisting in the training of young people we
thereby seek to commit them to the Company. HELIOS,
for instance, pays a monthly stipend to medical students
during their one-year internship. This practice puts
HELIOS at a considerable competitive advantage over
other hospital operators in recruiting staff.
� Financial risks
The international operations of the Fresenius Group
expose us to a variety of currency risks. In addition, the
manner of financing the business exposes us to certain
interest rate risks. We use derivative financial instruments
as part of our risk management to avoid possible nega-
tive impacts of these risks. However, we limit ourselves
to nonexchange traded, marketable instruments, used
exclusively to hedge our operations and not for trading
or speculative purposes.
The Fresenius Group’s currency and interest rate risk
management activities are based on a policy approved
by the Management Board that defines the targets, organ-
ization, and handling of the risk management processes.
In particular, the guidelines assign responsibilities for risk
determination, the execution of hedging transactions, and
for the regular reporting of risk management activities.
These responsibilities are coordinated with the manage-
ment structures in the residual business processes of
the Group. Hedging transactions using derivatives are car-
ried out solely by the Corporate Treasury Department of
the Fresenius Group – apart from a few exceptions in
order to adhere to foreign currency regulations – and are
subject to stringent internal controls. This policy insures
that the Management Board is fully informed of all signif-
icant risks and current hedging activities.
The Fresenius Group is protected to a large extent
against currency and interest rate risks. As of December
31, 2008, approximately 69% of the Fresenius Group’s
debt is protected against increases in interest rates either
by fixed-rate financing arrangements or by interest rate
hedges. Only 31%, or € 2,724 million, is exposed to an
interest rate risk. A rise of 0.5% in the reference rates
relevant for Fresenius would have a less than 1.5% impact
on Group net income.
As an international company, Fresenius is widely
exposed to translation effects due to foreign exchange
rate fluctuations. The exchange rate of the US dollar

95
Man
agem
ent
Rep
ort
Management Report Report Supervisory Board Management Board Supervisory BoardConsolidated Financial Statements Glossary
to the euro is of particular importance because of our
extensive operations in the United States. Translation risks
are not hedged. As a globally active company, we have
production facilities in all the main currency areas. In our
service businesses, the revenue and cost base coincide.
The exposure to currency risks arising from our business
activities does not rise to the same extent as sales.
Potential financial risks that could arise from acquisi-
tions, investments in property, plant and equipment, and
in intangible assets are assessed in advance. We perform
careful and in-depth reviews of the projects, sometimes
assisted by external consultants.
Fresenius’ debt has increased significantly as a result
of the financing of the APP Pharmaceuticals acquisition
reaching € 8,787 million as of December 31, 2008. The
debt could limit the ability to pay dividends, to arrange
refinancing, or to implement corporate strategy. Other
financing risks could arise for Fresenius against the
background of the general financial market crisis. This
is counteracted through a long-term spread maturities
profile. In addition, the Group has no material short-term
refinancing requirements.
� Government reimbursement payments
Fresenius is subject to comprehensive government regula-
tions in nearly all countries. This is especially true in the
United States and Germany. In addition, Fresenius has to
comply with general rules of law, which differ from coun-
try to country. There could be far-reaching legal reper-
cussions should Fresenius fail to comply with these laws
or regulations. A large part of Group revenue derives
from government reimbursement programs, such as the
federal dialysis reimbursement programs in the United
States under Medicare and Medicaid. Changes in the law,
or changes in the reimbursement method affecting the
amounts of these payments, could have a significant
adverse impact on the assets and liabilities, financial posi-
tion, and results of operations of the Group.
� Legal risks
Risks that arise from legal issues are continually identified,
analyzed, and communicated. Companies in the health
care industry are regularly exposed to actions for breach
of their duties of due care, product liability, breach of
warranty obligations, treatment errors, and other claims.
This can result in claims for damages and costs for legal
defense, regardless of whether a claim for damages is
actually justified. Legal disputes can also result in inabili-
ty to insure against risks of this kind at acceptable terms
in future. Products from the health care industry can also
be subject to recall actions and patent infringement suits.
In 2003, a definitive agreement was signed regard-
ing the settlement of fraudulent conveyance claims and
all other legal matters in connection with the National
Medical Care transaction in 1996 arising from the bank-
ruptcy of W.R. Grace. Under the settlement agreement,
Fresenius Medical Care will pay a total of US$ 115 million
without interest into the W.R. Grace & Co. bankruptcy
estate or as otherwise directed by the court upon plan
confirmation. The settlement agreement was approved by
the competent court. Claims made out of court by cer-
tain private US health insurers were also settled by an
agreement. Consequently, all legal issues resulting from
the NMC transaction have been finally concluded subject
to plan confirmation. FMCH and its subsidiaries, includ-
ing RCG (before its acquisition by Fresenius Medical Care)
received in April 2005 (RCG in August 2005) a subpoena
from the U.S. Department of Justice in St. Louis (Missouri)
in connection with civil and criminal investigations. Doc-
umentation must be provided on clinical quality programs,
business development activities, compensation of clinic
managers, contractual relationships with doctors, joint
ventures, and anemia treatment therapies, RCG’s suppliers,
Operations and business environmentResults of operations, financial position, assets, and liabilitiesNon-financial performance indicators and other success factors
Overall assessment of the business situationOpportunities and risk report
Subsequent eventsOutlook
96 Management Report
Managem
ent Report
pharmaceutical and other services which RCG has pro-
vided for patients, RCG’s relations to companies in the
pharmaceutical industry and RCG’s procurement of dialy-
sis machines from FMCH. The Inspector General of the
U.S. Department of Health and the Attorney General for
the Eastern District of Texas confirmed their involve-
ment in the review of the anemia management program.
In July 2007, the U.S. Attorney General filed a civil ac-
tion against RCG and FMCH, in its capacity as the pres-
ent holding company of RCG, before the U.S. district court
for the Eastern District of Missouri. The action claims
damages and penalties in respect of the business activities
of the RCG Method II supplier company in 2005, before
RCG was acquired by FMCH. The company believes that
RCG’s operation of its Method II supply company was
in compliance with applicable law and will defend this lit-
igation vigorously. Fresenius Medical Care will continue
to cooperate in the ongoing investigation.
Please see pages 162 and 165 of the Notes for further
information.
Furthermore, the Fresenius Group is involved in vari-
ous legal issues resulting from business operations and,
although it is not possible to predict the outcome of these
disputes, none is expected to have a significant adverse
impact on the assets and liabilities, financial position, and
results of operations of the Group.
� Other risks
Other risks, such as environmental risks and risks involv-
ing management and control systems or our IT systems,
are not considered to be significant. IT risks are countered
through security measures, such as controls and moni-
toring. In addition, we counter these risks with constant
investment in hardware and software as well as by improv-
ing our system know-how.
ASSESSMENT OF OVERALL RISK
The basis for evaluating overall risk is the risk management
system that is regularly audited by management. Potential
risks for the Group include factors beyond its control, such as
the evolution of national and global economies, constantly
monitored by Fresenius. Risks also include factors immedi-
ately within its control, such as operating risks, which the
company anticipates and reacts to appropriately, as required.
Currently, there are no recognizable risks regarding future
performance that appear to present a long-term and material
threat to the Group’s assets and liabilities, financial posi-
tion, and operational results. We have created organizational
structures that include all the conditions needed to rapidly
alert us to emerging risk situations.
CORPORATE RATING
Fresenius’ credit quality is assessed and regularly reviewed
by the two leading rating agencies Moody’s and Standard&
Poor’s. Standard&Poor’s overall rating for Fresenius SE is BB
and Moody’s rating is Ba1. Following the financing of the
APP Pharmaceuticals acquisition, Standard&Poor’s changed
its rating outlook from “stable” to “negative” in 2008. Moody’s
confirmed its rating, which was raised from Ba2 to Ba1 in
May 2008. Moody’s adjusted its outlook from “stable” to
“negative”. Standard & Poor’s has assigned a BB rating to the
Senior Notes, while Moody’s assigned a Ba1 rating. This is
in line with Fresenius SE’s existing unsecured Senior Notes
and its corporate credit rating. The agencies’ ratings for
Fresenius are as follows:
RATING OF FRESENIUS SE
Standard & Poor’s Moody’s Fitch
Rating BB Ba1 BB
Outlook negative negative negative

97
Man
agem
ent
Rep
ort
Management Report Report Supervisory Board Management Board Supervisory BoardConsolidated Financial Statements Glossary
SUBSEQUENT EVENTS
On January 21, 2009 Fresenius issued a US$ 800 million
equivalent of unsecured Senior Notes by its subsidiary
Fresenius US Finance II, Inc. Please see page 78 for fur-
ther details.
Apart from that, there have been no significant changes
in the Fresenius Group’s corporate position or operating
environment since the beginning of 2009. At present, the
Fresenius Group is not planning to carry out any signifi-
cant changes in its structure, administration, or in the area
of personnel. No other events of material importance have
occurred following the end of the fiscal year.
OUTLOOK
This Management Report contains forward-looking state-
ments, including statements on future sales, expenses and
investments, as well as potential changes in the health
care sector, our competitive environment, and our financial
situation. These statements were made on the basis of the
expectations and assessments of the Management Board
regarding events that could affect the company in the future.
Such forward-looking statements are subject as a matter
of course to risks, uncertainties, assumptions, and other fac-
tors, so that the actual results, including the financial posi-
tion and profitability of Fresenius, could therefore differ mate-
rially – positively or negatively – from those expressly or
implicitly assumed or described in these statements. For fur-
ther information, please see our Risk Report on pages 90 f.
GENERAL AND MID-TERM OUTLOOK
The outlook for the Fresenius Group for the coming years
continues to be positive. Good growth opportunities for
Fresenius are presented above all by:
� The sustained growth of the markets in which we operate:
Here, Fresenius sees very good opportunities to profit
from the considerable health care needs, primarily in the
developing and emerging countries.
� The development of innovative products and therapies:
These will create the potential to further expand our
market position in the regions. In addition to innovation,
best-in-class quality and the reliability of our products
and therapies is key to being able to exploit opportunities
for expansion.
� The expansion of our regional presence: The fast-grow-
ing markets in Asia-Pacific and Latin America especially
offer further opportunities for increasing our market
shares.
� We also plan to successively roll out products and thera-
pies from our existing portfolio in countries where we do
not yet offer a comprehensive range. The acquisition of
APP Pharmaceuticals in the Fresenius Kabi business seg-
ment will enable us over time to introduce infusion and
nutrition therapy products to the US market. Similarly,
Fresenius Kabi’s international marketing and sales net-
work will provide us with a global market for APP Pharma-
ceutical’s products in future.
� The broadening of our services business: Fresenius Helios
has concrete opportunities in the German hospital mar-
ket to profit from the further privatization of public hospi-
tals. Changes in the law could present new opportuni-
ties, for instance, for Fresenius Medical Care. Since Japan
is one of the world’s biggest dialysis markets, changes
in the framework conditions for the operation of dialysis
clinics for private commercial enterprises there could
open up new sales potential for Fresenius Medical Care,
since Japan is one of the world’s biggest dialysis markets.
� Selective acquisitions: We will continue to take opportu-
nities to grow by making acquisitions that extend our
product portfolio and strengthen our regional presence.
We are also exploiting any opportunities for tapping potential
within our operations for cost management and efficiency
and profitability enhancement measures. These include plans
for a further optimized procurement process and cost-effi-
cient production.
Operations and business environmentResults of operations, financial position, assets, and liabilitiesNon-financial performance indicators and other success factors
Overall assessment of the business situationOpportunities and risk reportSubsequent events
Outlook
98 Management Report
Managem
ent Report
Given sustained market growth and a long-term strategy ori-
ented toward profitable growth, Fresenius has set itself a
mid-term goal under the slogan “15/15.” Fresenius aims to
attain the following in 2010:
1. Group sales of € 15 billion.Based on the sales of € 12.3 bil-
lion generated in 2008, this represents a compounded
annual growth rate of about 10% p. a. It is to be achieved
through strong organic growth flanked by selective acqui-
sitions.
2. An EBIT margin of 15%.
Acquisitions, primarily the acquisition of APP Pharmaceu-
ticals, have led to appreciably higher Group debt with a cor-
responding impact on net interest. Our goal is therefore
to improve the Group’s leverage ratios again. The net debt/
EBITDA ratio of 3.6 as of December 31, 2008 is to be returned
to a range of 2.5 – 3.0 by the year 2010.
This forecast takes account of all events known at the
time the annual financial statements were prepared that could
influence our operating performance in 2009 and beyond.
Significant risks are discussed in the Risk Report. As in the
past, we will do our utmost to achieve and – if possible –
exceed our targets.
FUTURE MARKETS
As an international company, we offer our products and
services in more than 100 countries. We expect the consoli-
dation process among competitors in our markets in Europe,
Asia-Pacific, and Latin America to continue. Consequently, we
anticipate that there will be opportunities for Fresenius to
penetrate new markets, both by expanding its regional pres-
ence and by extending its product portfolio. In the United
States, since Fresenius Medical Care and its competitor DaVita
already share about two-thirds of the market, acquisitions
are likely to be few; potential antitrust restrictions are an addi-
tional factor. Other new markets will open up for Fresenius
as we successively roll out our existing product portfolio in
other regions. With the acquisition of APP Pharmaceuticals
and Dabur Pharma, Fresenius Kabi now has further access to
attractive growth markets.
ECONOMIC OUTLOOK
In view of the continuing strained situation on the global
financial markets, world economic growth can be expected
to be weaker in the foreseeable future. The outlook may
brighten a little in the second half of 2009, when the fiscal
policy measures already initiated should start to take effect.
However, experts do not believe this is likely to trigger a sus-
tained upswing dynamic such as that witnessed in 2004 to
2007. According to current estimates, it is expected that glob-
al GDP growth will decrease by 0.1% in 2009. From a global
perspective, 2009 is likely to be a generally weak year, espe-
cially in view of the pronounced weakening of the economic
dynamic in the industrial countries and the resulting repercus-
sions for the hitherto booming emerging economies.
� Europe
The Eurozone is set for its worst recession since World
War II, with a drop of 2.5% in GDP in 2009. On the whole,
the economy in the Eurozone will recover only very slow-
ly. Europe’s governments will be continuing their efforts
to stabilize the situation on the financial markets with res-
cue plans and economic programs. Although the Euro-
pean Central Bank (ECB) has already cut its rates by 225
basis points since October 2008 to 2.0%, there is likely
to be room for further monetary policy moves in 2009
since the continued easing of world commodity prices is
helping to bring down inflation closer to the ECB’s tar-
get level. Nonetheless, the process of transmitting the
cheaper credit conditions to firms and consumers is likely
to remain disrupted.
In Germany, GDP is set to contract sharply in 2009,
with a drop of 2.5% according to current estimates.
Economic momentum has been hit especially by the dra-
matic fall in global demand for Germany’s exports. Nor
is private consumption likely to provide much stimulus in
2009. Given the subdued global outlook, private invest-
ment may be expected to be extremely weak.
Growth is currently expected to slow appreciably in
the emerging economies of Central and Eastern Europe.

99
Man
agem
ent
Rep
ort
Management Report Report Supervisory Board Management Board Supervisory BoardConsolidated Financial Statements Glossary
� United States
The development of the US economy in the coming year
will again be affected to a large extent by the course of
the crisis on the financial and real estate markets. Private
consumption will be depressed by the continued fall in
property prices. Furthermore, the worsening situation on
the labor market will be reflected in much higher unem-
ployment, which will additionally frustrate the develop-
ment of real incomes. Unemployment increased strongly
in the United States at the end of 2008. Whether net ex-
ports of goods and services can fill the gap left by domes-
tic demand appears extremely doubtful, given the wors-
ening outlook for the world economy. It remains to be seen
how far the new government can succeed in stimulating
demand through economic programs. In view of the chal-
lenging macroeconomic environment, the US economy
is also likely to contract strongly in 2009, with a drop
of 2.0%.
� Asia
There are considerable risks for economic development in
Asia in 2009. The still strong reliance on exports is also
likely to lead to a further weakening of the economic dy-
namic in Asia. Although in the short term the current
account balances are benefiting from the fall in world com-
modity prices, in the mid-term the sharp fall in demand
in the industrial countries can be expected to spill over to
the Asian economies.
Compared to other emerging economies, relatively
robust growth is forecast for China, with private consump-
tion and public investment as the main drivers. Lower
interest rates should stimulate investment by private enter-
prise. However, the extent to which these trends can com-
pensate for the drop in foreign demand will depend on
how strong the downturn in the world economy is, and on
the scale of government investment programs. GDP growth
is expected to sink to 7.0% in 2009.
India’s economy is less vulnerable than China’s to a slump
in global demand, but Indian firms, too, face more diffi-
cult credit conditions and monetary strains. However, the
monetary policy measures announced by India’s central
bank should have a stimulating effect in the mid-term. It
is estimated that GDP growth will slow to 4.8% in 2009.
Japan’s economy will continue to suffer as a result of
the country’s strong reliance on exports. Domestic con-
sumption is expected to compensate for the fall in exports
only to a very small extent. On the other hand, Japan’s
large companies should provide stimulus in the coming
year thanks to their high liquidity and rigorous focus on
forward-looking technologies, for instance in environmen-
tal technology. Despite this, Japan’s economy is expected
to contract by 1.7% in 2009.
� Latin America
Latin America is proving to be comparatively crisis resist-
ant. Thanks to the buoyancy of the world economy and
rising commodity prices, current account deficits have
been reduced in recent years, and in many countries have
swung into surpluses. At the same time, Latin America’s
foreign exchange reserves have more than doubled since
2005. For the future there are two main risks: the mas-
sive and rapid fall in commodity prices, and the econom-
ic downswing in the industrial nations. Currency weak-
ness, on the other hand, is seen as positive because this
can damp down the growth in imports and prevent major
external imbalances. Mexico will be hit particularly due
to its strong exposure to the United States. GDP growth of
0.5% is expected in Mexico, -0.9% in Argentina, and
2.7% in Brazil. Overall, growth of 1.8% is forecast for
Latin America in 2009.
Operations and business environmentResults of operations, financial position, assets, and liabilitiesNon-financial performance indicators and other success factors
Overall assessment of the business situationOpportunities and risk reportSubsequent eventsOutlook
Source: German Council of Economic Experts Annual Report 2008/2009, bank research
100 Management Report
Managem
ent Report
HEALTH CARE SECTOR AND MARKETS
The health care sector is one of the world’s biggest industries.
The generally difficult conditions in 2009 should have a
moderate impact on the industry because of its defensive and,
compared to other sectors, less cyclically sensitive charac-
ter. The demand for life-saving and life-sustaining products
and services, especially, will remain intact since they are
medically necessary. However, in the mid to long-term, funds
channeled into economic programs to contend with the
financial crisis in other sectors may not be available for the
health industry.
� The dialysis market
We expect the number of dialysis patients to rise by 5 to
7% in the coming years, although significant regional
differences are anticipated. In industrialized nations, such
as the United States, Japan, and the countries of Central
and Western Europe, where people already have broad
access to dialysis treatment, we expect below-average pa-
tient growth. In many developing countries, however,
where the needs of patients with chronic kidney failure
are still not met sufficiently, we expect above-average
growth rates of up to 10% in these markets. That more
than 80% of the world’s population lives in these growth
regions highlights the enormous potential of the dialy-
sis market there. The global dialysis market will probably
grow by approximately 5% p. a. to clearly more than
US$ 70 billion by the year 2010.
Reimbursement schemes for dialysis treatment vary
from country to country. Reimbursement structures may
also differ within individual countries. They may depend,
for instance, on regional factors, the method of treatment,
regulatory aspects, or the status of the dialysis care pro-
vider. Reimbursement for dialysis treatments according to
quality-based criteria also remains a central issue. In this
reimbursement model, the quality of treatment should
increase while the total cost of treating a dialysis patient
should remain constant.
Fresenius Medical Care has been active for many years in
numerous countries, involving a variety of health care
systems and reimbursement schemes. Thanks to this inter-
national experience, we are able to support the varying
activities of the national health care systems, to adjust our
business to the local environment, and to generate prof-
itable growth. Patients covered by the public health insur-
ers Centers for Medicare and Medicaid Services (CMS)
in the United States account for about 35% of Fresenius
Medical Care’s dialysis care revenues.
The Medicare Improvements for Patients and Provid-
ers Act of 2008 was passed in 2008. The act increases
the composite rate by 1% from January 1, 2009 and by
another 1% from January 1, 2010. It also provides for
the introduction of a bundled payment system for ESRD
(end stage renal disease) from January 1, 2011. Under
this scheme, CMS will reimburse the dialysis clinics with
a single payment for (i) all items and services currently
included in the composite rate, (ii) all erythropoietin-
stimulating agents and other pharmaceuticals (other drugs
and biologicals, other than vaccines) furnished to the
patients that were previously reimbursed separately, (iii)
diagnostic laboratory tests and (iv) other services
furnished to individuals for the treatment of ESRD. The
bundled reimbursement rate is initially fixed at 98%
of the estimated costs of the Medicare program for dialy-
sis care in 2011. This estimate is calculated on the basis
of the lowest per patient utilization data from 2007, 2008,
or 2009 under the present reimbursement system.
From 2012 the bundled payment amount will be sub-
ject to yearly increases, based on the increase in the cost
of a mix of dialysis items and services still to be defined
by HHS (U.S. Department of Health and Human Services)
minus 1%.
The act will establish pay-for-performance quality
standards that will take effect in 2012. If dialysis clinics

101
Man
agem
ent
Rep
ort
Management Report Report Supervisory Board Management Board Supervisory BoardConsolidated Financial Statements Glossary
do not meet the set quality standards, their payments
will be cut by 2%. Quality standards will probably be
developed for clinics in the areas of anemia management,
patient satisfaction, iron management, bone mineral me-
tabolism, and vascular access.
Introduction of the bundled system will be phased
over a period of four years, with full implementation for
all dialysis clinics as from January 1, 2014. However,
providers may elect at any time prior to 2011 to become
fully subject to the new system.
� The market for infusion therapies and clinical nutrition
Demographic developments, medical advances, and the
often still insufficient availability of medical care in
developing countries will continue to be the growth driv-
ers in this market.
We expect further cost-containment pressure and
health care reforms in Central and Western Europe. De-
spite these trends, we believe that there will be continued
growing demand for innovative and cost-effective prod-
ucts and therapies. We expect growth in the low single
digits for the infusion therapy and clinical nutrition mar-
ket in Central and Western Europe. For Eastern Europe,
we expect market growth rates in the high single digits.
The market for IV drugs should see growth rates in the
mid single digits. In the United States, market growth
for intravenously administered generic drugs should also
be in the mid single digits.
There continues to be high growth potential in Asia-
Pacific – especially China – and Latin America. The rising
demand for better primary care, and thus for high-quality
therapies, should result in continued strong growth rates.
We expect the markets of Asia-Pacific and Latin Amer-
ica to continue growing at high single- to double-digit
rates. We also expect a rising demand for medical devices
in the coming years.
� The German hospital market
The proposed Hospital Funding Reform Act (KHRG) will
have a decisive influence on the development of the
hospital market and hospital finances in Germany. An
important element in the law is the end of the conver-
gence phase for virtually all German acute care hospitals
at the beginning of 2009. From then onward, hospitals
will have to bill on the basis of the standardized base rates
valid throughout individual federal states. This practice
will encourage further competition since it enables the
budgets agreed with the health insurers to be increased
if performance is enhanced because additional services
will no longer have to be provided at a low marginal rev-
enue rate. As the legislative process is not over, the details
of the last adjustment step in the convergence phase
that has been underway since 2005 are not clear as yet.
The law will probably be passed in February 2009. In
light of the experience with the DRG system so far, and
the convergence steps already completed, HELIOS does
not expect any fundamental changes in the framework
conditions.
As from 2009, the KHRG will also abolish the 0.5%
budget cut, a contribution hospitals are required to make
towards improving the finances of public health insur-
ers, and the deduction hitherto of up to 1% on billings
under integrated health care contracts.
In the mid-term, we expect legislative initiatives that
provide for the introduction of quality-based reimburse-
ment (pay-for-performance) and allow hospitals the option
of concluding selective contracts with health insurers.
With its strict focus on quality and transparency, HELIOS
is also excellently prepared for this future development.
No consequences from changes in the law are expect-
ed in the post-acute care segment. However, pricing and
other controls by health insurers will continue to increase.
As a result of the growth in acute care cases and the
continuous improvements in HELIOS’ internal referral
Operations and business environmentResults of operations, financial position, assets, and liabilitiesNon-financial performance indicators and other success factors
Overall assessment of the business situationOpportunities and risk reportSubsequent eventsOutlook
102 Management Report
Managem
ent Report
management, we expect to be able to leverage the poten-
tials from the combination of acute care and post-acute
care, thereby increasing our number of post-acute care
admissions.
Given that reimbursement schemes for hospitals are
largely regulated by law, the generally difficult environ-
ment is unlikely to have any direct impact on hospital
revenues.
The rationalization trend in the German hospital mar-
ket is expected to continue in 2009 and beyond. Accord-
ing to a study by management consultants Ernst&Young,
by the year 2020 there will be only 1,500 hospitals oper-
ating in Germany; 2.9 beds will be available per 1,000 pop-
ulation, and the average length of stay will fall to 4.0
days (2007: 6.16 beds, 8.3 days).
Private hospital chains and alliances are likely to be
able to respond to the pressure to improve efficiency
better than public hospitals. They often have more expe-
rience in operating commercially and creating efficient
structures. They have the potential to secure cost advan-
tages in procurement and generally have more advanta-
geous financing prospects. Finally, private operators have
more experience with the process know-how for acquir-
ing and integrating new facilities and quickly adjusting
their cost structures.
Against this background, we expect the concentra-
tion and privatization process to accelerate further, espe-
cially among public hospitals. Overall, experts expect
the market share of private operators in terms of beds to
rise from approximately 16% at present to about 35 to
40% by the year 2015.
Crucial factors for a clinic’s success will be excellent
medical standards, well-trained staff, well-organized
processes, and a well-structured treatment spectrum that
focuses on high-quality, complex medical services.
GROUP SALES AND GROUP EARNINGS
With its international production and sales platform and its
market-oriented products and services, the Fresenius Group
is excellently positioned for continued growth in the coming
years. Specific opportunities for profitable growth are indi-
cated by the developments described in the section “Health
Care Sector and Markets”. In 2009, we therefore expect to
increase sales by more than 10% at 2008 exchange rates.
While our traditional markets in Europe and North America
are growing at average low to mid single-digit rates, we
see stronger growth potential in the Asia-Pacific region and
in Latin America. Here, the demand for our life-saving and
life-sustaining products continues to be very high because
access to medical care is still limited. This will also be
reflected in sales.
We expect to increase Group net income once again in
2009. We aim to achieve this through the growth in sales
described above and by ongoing measures to lower costs as
a percentage of sales, especially in production. Despite a
market environment which continues to be marked by cost-
containment and price pressure, we expect to increase
adjusted net income (before special items due to mark-to-
market accounting of the mandatory exchangeable bonds
and the contingent value rights) by approximately 10% in
constant currency.
Source: Ernst&Young survey “Gesundheitsversorgung 2020“, bank research
Targets 2009 Fiscal year 2008
Sales, growth (in constant currency) >10% € 12,336 million
Net income, growth* (in constant currency) ~10% € 450 million
Capital expenditure ~ € 700–750 million € 764 million
DividendProfit-driven
dividend policy
Proposal: +6% per ordinary andpreference share
* before special items due to mark-to-market accounting of the mandatory exchangeable bonds and the contingent value rights
GROUP FINANCIAL TARGETS

103
Man
agem
ent
Rep
ort
Management Report Report Supervisory Board Management Board Supervisory BoardConsolidated Financial Statements Glossary
SALES AND EARNINGS BY BUSINESS SEGMENT
We expect further improvements in sales and earnings in
2009 in each of our business segments. The table gives an
overview.
The number of dialysis patients worldwide should rise by
about 5 to 7% in 2009, leading to continued growth in
demand for dialysis products and a higher number of treat-
ments. In 2009, Fresenius Medical Care expects revenues
to grow to more than 11.1 billion in US dollars, its reporting
currency. Net income is expected to be between US$ 850
and 890 million.
Fresenius Kabi expects its positive operating perform-
ance to continue in 2009, influenced to a large extent by
the first full-year consolidation of APP Pharmaceuticals. The
company estimates sales growth of 25 to 30% in constant
currency. Good growth potential is expected again in the Asia-
Pacific region and in Latin America. Based on its positive
sales projection, further cost optimizations, especially in pro-
duction, and an improved product mix, Fresenius Kabi again
expects to increase earnings significantly in 2009. Fresenius
Kabi forecasts an EBIT margin of 19.5 to 20.5%. Transla-
tion effects may impact Fresenius Kabi’s margin as APP pro-
vides a significant earnings contribution from the US$ area.
This guidance is based on the US$ / € exchange rate from
early 2009. The strong margin improvement versus 2008 will
be largely attributable to the full-year consolidation of APP
Pharmaceuticals.
Fresenius Helios expects a continued good performance
in the hospital operations business. The company forecasts
revenues of more than € 2.3 billion in 2009. EBIT is expected
to increase to € 180 to 200 million.
Given its positive order book, Fresenius Vamed expects
a good performance in 2009. Sales growth of 5 to 10% is
forecast. Fresenius Vamed also expects to increase EBIT by
5 to 10%.
Fresenius Biotech will continue its clinical study program.
We expect that the expenditures for our biotechnology pro-
jects will lead to negative EBIT of about € -40 to -50 million
in 2009.
FINANCING
In 2008, we generated a sustained operating cash flow of
€ 1,074 million. The key driver was our good earnings per-
formance. The cash flow margin was 8.7%. We estimate
that a cash flow margin of this order can be achieved again
in 2009.
The net debt / EBITDA ratio is a key financial target fig-
ure for the Fresenius Group. The financing of the APP Phar-
maceuticals acquisition caused this ratio to rise to 3.6 as of
December 31, 2008. Our goal is to bring this ratio down to a
level of between 2.5 and 3.0 by 2010, primarily through
earnings improvements and continued positive cash flows.
FINANCIAL TARGETS BY BUSINESS SEGMENT
Targets 2009 Fiscal year 2008
Fresenius Medical Care
Sales > US$ 11.1 billion US$ 10,612 million
Net income US$ 850–890 million US$ 818 million
Fresenius Kabi
Sales growth (inconstant currency) 25–30% € 2,495 million*
EBIT margin*** 19.5–20.5% 17.8%
Fresenius Helios
Sales > € 2.3 billion € 2,123 million
EBIT € 180–200 million € 175 million
Fresenius Vamed
Sales growth 5 –10% € 524 million*
EBIT growth 5 –10% € 30 million**
Fresenius Biotech
EBIT € -40 – -50 million € -47 million
* Sales** EBIT
*** Translation effects may impact Fresenius Kabi’s margin as APP provides a significant earnings contribution from the US$ area. This guidance is based on the US$/€ exchange rate from early 2009.
Operations and business environmentResults of operations, financial position, assets, and liabilitiesNon-financial performance indicators and other success factors
Overall assessment of the business situationOpportunities and risk reportSubsequent eventsOutlook

104 Management Report
Managem
ent Report
Overall, unused credit lines under syndicated or bilateral
credit facilities from banks will provide us with a sufficient
financial cushion. Fresenius SE’s € 250 million commercial
paper program was not utilized. For further details, please
see page 79 of the Management Report.
Only limited financing will be required in 2009 and
2010. This can be met from cash flow and, if necessary, from
existing credit facilities.
INVESTMENTS
Fresenius plans to invest in further growth in 2009, increas-
ing capital expenditure in property, plant, and equipment by
about € 700 to 750 million, a figure slightly below the very
high € 764 million invested in 2008. About 60% of the capi-
tal expenditure will be invested at Fresenius Medical Care,
while Fresenius Kabi and Fresenius Helios will each account
for over 15%. Investments at Fresenius Medical Care will
be concentrated on the construction and expansion of dialy-
sis clinics, and on the maintenance and expansion of pro-
duction plants. Fresenius Kabi will invest in expanding and
maintaining production facilities and in introducing new
manufacturing technologies, enabling further improvements
in production efficiency. At Fresenius Helios, we will be
investing primarily in modernizing hospitals and in hospital
equipment. The regional focus of the investments will be
on Europe and North America, which will account for about
50% and 35%, respectively. The remainder will be invest-
ed in Asia, Latin America, and Africa. About 30% of the funds
will be invested in Germany.
PROCUREMENT
As a result of the fluctuation in energy and raw material prices,
the ongoing optimization of our procurement management,
including price, conditions, and product quality, is a key fac-
tor for securing further earnings growth.
In the current year, Fresenius Medical Care will primarily
be implementing measures that have been developed in pro-
jects, for instance regarding supplier management. This will
yield further cost savings in the areas of procurement and
logistics. Material costs will again be a challenge in 2009.
In future, we will therefore be searching more intensively for
new suppliers. To which extend the generally unfavorable
economic outlook will lead to a decline in the demand for raw
and other materials, and thus in prices, too, has to be seen.
The markets in the Asia-Pacific region will still place strains
on supply capacities for selected material groups. We will
therefore continue to pursue cost reductions in 2009 and
ensure our production capacities. The potentials of the
North American and Asian-Pacific markets will become in-
creasingly important. The corresponding initiatives are
already underway.
Fresenius Kabi expects procurement costs for electricity
and natural gas to rise in 2009. The prices of other produc-
tion materials such as cardboard boxes should remain stable.
We will continue bundling our procurement processes on
a global, cross-company basis. Individual processes will also
be streamlined over the longer term through the introduc-
tion of electronic requisitioning procedures. It remains to be
seen whether the trends in the second half of 2008 in the
prices of energy and oil-based products will continue in 2009.
We expect price reductions for processed corn products in
Europe as a result of the good harvest in 2008, but a continued
high price level in the United States. The prices of processed
milk products will probably come down from their present
level since the supply has increased. We will be successively
integrating the procurement management processes at APP
Pharmaceuticals from 2009 onward.
Fresenius Helios will start implementing a master article
database in 2009. The project analysis was performed in 2008.
As a first step, the HELIOS product group catalog will be
completely revised, with an improved structure, hierarchy,
and specification system that will make effective materials
control easier. All materials negotiated will then be assigned
to new groups, with designations, volumes, and supplier
names harmonized across all regions. The structure of the
groupwide updating and administration of the master data

105
Man
agem
ent
Rep
ort
Management Report Report Supervisory Board Management Board Supervisory BoardConsolidated Financial Statements Glossary
will be developed together with related IT. This will enable
further cost savings and improve cost control in future. The
integration of more clinics will support these goals, increasing
purchasing power by ordering in larger quantities, and by
requiring sourcing to be conducted through the HELIOS Kli-
niken procurement management system.
By using the enPortal online platform, HELIOS was able to
hold the increase in the price of its electricity purchases for
2009 in the third quarter of 2008 below the market level. The
electricity for 2010, purchased in the fourth quarter of 2008,
is priced below the level for 2009.
RESEARCH AND DEVELOPMENT
Our R & D activities will continue to play a key role in securing
the Group’s long-term growth through innovations and new
therapies. We are concentrating our R & D on products for the
treatment of patients with chronic kidney failure. Here, the
emphasis will continue to be on dialysis membranes and dial-
ysis machines.
Another focus is infusion and nutrition therapies and the
development of IV drugs.
We are also concentrating on targeted development in the
biotechnology sector, in the field of antibody therapies. Bio-
technology research opens up possibilities for treating dis-
eases which cannot be cured at present, and offers Fresenius
potential for further growth with innovative cancer therapies.
In February 2009, the European Medicines Agency’s (EMEA)
Committee for Medicinal Products for Human Use (CHMP)
issued a positive opinion recommending approval of Removab®
for the treatment of malignant ascites. Fresenius Biotech
expects a possible market introduction of this product – sub-
ject to approval – in 2009.
We are planning to invest more in research and develop-
ment in 2009 (on a comparable base, i.e. excluding in-process
R & D activitities acquired from the APP acquisition). The
increase should be higher than the expected organic growth
rate in sales. The number of employees in research and devel-
opment will also be increased.
Market-oriented research and development with strict
time-to-market management processes is crucial for the
success of new products. We continually review our R & D
results using clearly defined milestones. Innovative ideas,
product development, and therapies with a high level of
quality will continue to be the basis for future market-lead-
ing products.
CORPORATE LEGAL STRUCTURE AND
ORGANIZATION
Fresenius completed its conversion from a German stock cor-
poration (AG) into a Societas Europaea (SE) in 2007. No fur-
ther change in the company’s legal form is planned for the
foreseeable future.
Since January 1, 2008, the Fresenius Group has been di-
vided into four business segments, each of which is a legally
independent entity. The business segments are organized
on a regional and decentralized basis to provide the greatest
flexibility for meeting the demands of their respective mar-
kets. The “entrepreneur in the enterprise” principle, with
clearly defined responsibilities, has proven itself over many
years. We will continue to follow this principle.
PLANNED CHANGES IN HUMAN RESOURCES
AND THE SOCIAL AREA
The number of employees in the Group will continue to rise
in the future as a result of strong organic expansion. How-
ever, the growth in the number of employees will further be
held below the expected rate of organic sales growth. The
regional distribution of our employees will not change signifi-
cantly – about 48% will be located in Europe, about 34% in
North America, and about 18% in Asia-Pacific, Latin America,
and Africa.
DIVIDEND
Continuity in our dividend policy remains an important pri-
ority, clearly demonstrated by dividend increases over the last
15 years. We want to remain true to this policy in the 2009
fiscal year and offer our shareholders a dividend in line with
our positive earnings forecasts.
Operations and business environmentResults of operations, financial position, assets, and liabilitiesNon-financial performance indicators and other success factors
Overall assessment of the business situationOpportunities and risk reportSubsequent eventsOutlook

Consolidated Financial Statements106
CONTENTS
� 107 CONSOLIDATED STATEMENT OF INCOME
� 108 CONSOLIDATED BALANCE SHEET
� 110 CONSOLIDATED CASH FLOW STATEMENT
� 112 CONSOLIDATED STATEMENT OF
SHAREHOLDERS’ EQUITY
� 114 SEGMENT REPORTING
� 118 NOTES

Consolidated statement of income
January 1 to December 31, in million € Note 2008 2007
Sales 4 12,336 11,358
Cost of sales 5 - 8,408 -7,680
Gross profit 3,928 3,678
Selling, general and administrative expenses 8 -1,972 -1,885
Research and development expenses - 479 -184
Operating income (EBIT) 1,477 1,609
Interest income 9 25 27
Interest expenses 9 - 456 -395
Other financial result 10 68 0
Financial result - 363 -368
Earnings before income taxes and minority interest 1,114 1,241
Income taxes 11 - 440 -448
Minority interest 26 - 404 -383
Net income 270 410
Basic earnings per ordinary share in € 12 1.71 2.64
Fully diluted earnings per ordinary share in € 12 1.58 2.61
Basic earnings per preference share in € 12 1.72 2.65
Fully diluted earnings per preference share in € 12 1.59 2.62
The following Notes are an integral part of the Consolidated Financial Statements.
107
Fin
anci
al S
tate
men
ts
Management Report Report Supervisory Board Management Board Supervisory BoardConsolidated Financial Statements
Consolidated statement of income
Consolidated balance sheetConsolidated cash flow statement
Consolidated statement of shareholders’ equitySegment ReportingNotes
Auditor’s Report
Glossary

Consolidated Balance Sheet108
Financial S
tatements
Consolidated balance sheetAssets
as of December 31, in million € Note 2008 2007
Cash and cash equivalents 13 370 361
Trade accounts receivable, less allowance for doubtful accounts 14 2,477 2,159
Accounts receivable from and loans to related parties 22 8
Inventories 15 1,127 875
Prepaid expenses and other current assets 16 773 603
Deferred taxes 11 309 285
I. Total current assets 5,078 4,291
Property, plant and equipment 17 3,420 2,971
Goodwill 18 10,379 7,094
Other intangible assets 18 1,078 546
Other non-current assets 16 433 290
Deferred taxes 11 156 132
II. Total non-current assets 15,466 11,033
Total assets 20,544 15,324

109
Fin
anci
al S
tate
men
ts
Management Report Report Supervisory Board Management Board Supervisory BoardConsolidated Financial Statements
Consolidated statement of incomeConsolidated balance sheet
Consolidated cash flow statement
Consolidated statement of shareholders’ equitySegment ReportingNotes
Auditor’s Report
Glossary
Liabilities and shareholders’ equity
as of December 31, in million € Note 2008 2007
Trade accounts payable 598 485
Short-term accounts payable to related parties 6 5
Short-term accrued expenses and other short-term liabilities 19, 20 2,129 1,897
Short-term borrowings 21 729 362
Short-term loans from related parties 2 –
Current portion of long-term debt and liabilities from capital lease obligations 21 431 115
Current portion of Senior Notes 22 100 0
Current portion of trust preferred securities ofFresenius Medical Care Capital Trusts 25 0 455
Short-term accruals for income taxes 104 158
Deferred taxes 11 70 26
A. Total short-term liabilities 4,169 3,503
Long-term debt and liabilities from capital lease obligations,less current portion 21 5,716 2,887
Senior Notes, less current portion 22 1,354 1,434
Mandatory Exchangeable Bonds 23 554 0
Long-term accrued expenses and other long-term liabilities 19, 20 475 326
Trust preferred securities of Fresenius Medical Care Capital Trusts,less current portion 25 455 446
Pension liabilities 24 282 270
Long-term accruals for income taxes 147 87
Deferred taxes 11 449 312
B. Total long-term liabilities 9,432 5,762
I. Total liabilities 13,601 9,265
II. Minority interest 26 3,033 2,644
Subscribed capital 27 161 155
Capital reserve 27 2,048 1,739
Other reserves 27 1,803 1,636
Accumulated other comprehensive income (loss) 28 -102 -115
III. Total shareholders’ equity 3,910 3,415
Total liabilities and shareholders’ equity 20,544 15,324
The following Notes are an integral part of the Consolidated Financial Statements.
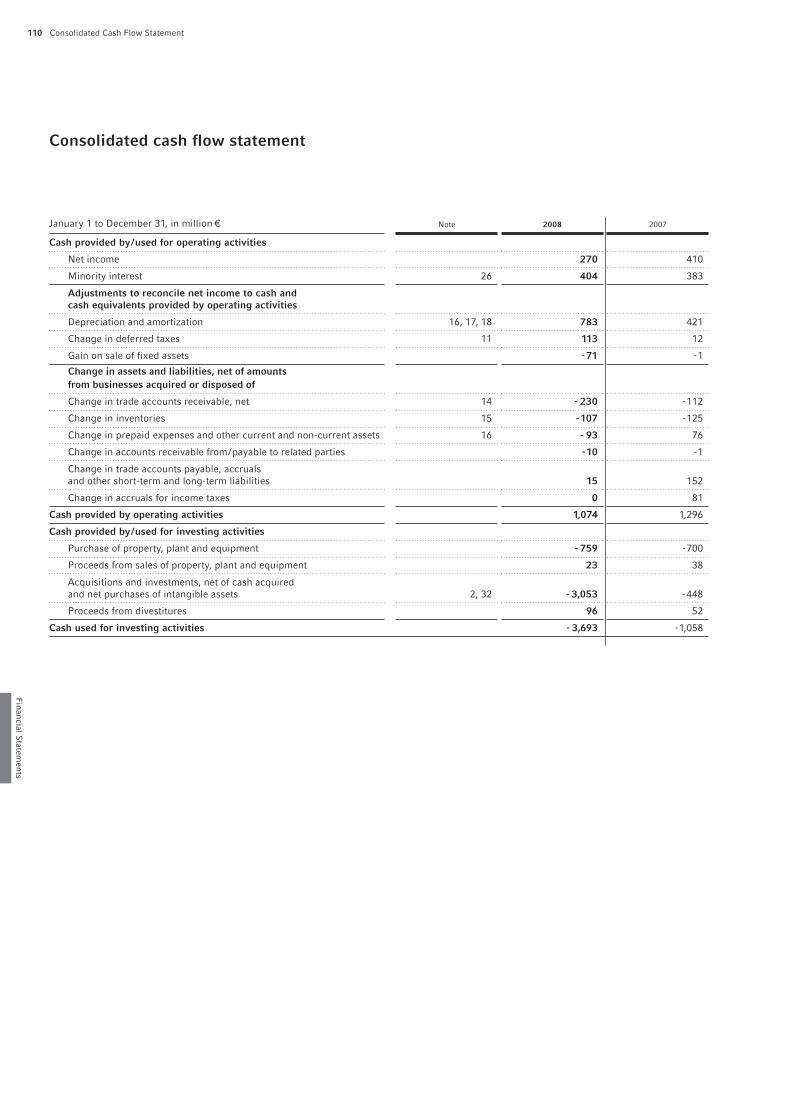
Consolidated Cash Flow Statement110
Financial S
tatements
Consolidated cash flow statement
January 1 to December 31, in million € Note 2008 2007
Cash provided by/used for operating activities
Net income 270 410
Minority interest 26 404 383
Adjustments to reconcile net income to cash and
cash equivalents provided by operating activities
Depreciation and amortization 16, 17, 18 783 421
Change in deferred taxes 11 113 12
Gain on sale of fixed assets - 71 -1
Change in assets and liabilities, net of amounts
from businesses acquired or disposed of
Change in trade accounts receivable, net 14 - 230 -112
Change in inventories 15 -107 -125
Change in prepaid expenses and other current and non-current assets 16 - 93 76
Change in accounts receivable from/payable to related parties -10 -1
Change in trade accounts payable, accruals and other short-term and long-term liabilities 15 152
Change in accruals for income taxes 0 81
Cash provided by operating activities 1,074 1,296
Cash provided by/used for investing activities
Purchase of property, plant and equipment - 759 -700
Proceeds from sales of property, plant and equipment 23 38
Acquisitions and investments, net of cash acquiredand net purchases of intangible assets 2, 32 - 3,053 -448
Proceeds from divestitures 96 52
Cash used for investing activities - 3,693 -1,058

111
Fin
anci
al S
tate
men
ts
Management Report Report Supervisory Board Management Board Supervisory BoardConsolidated Financial Statements
Consolidated statement of incomeConsolidated balance sheetConsolidated cash flow statement
Consolidated statement of shareholders’ equitySegment ReportingNotes
Auditor’s Report
Glossary
January 1 to December 31, in million € Note 2008 2007
Cash provided by/used for financing activities
Proceeds from short-term borrowings 21 141 175
Repayments of short-term borrowings 21 -186 -108
Proceeds from long-term debt and liabilities from capital lease obligations 21 2,417 224
Repayments of long-term debt and liabilities from capital lease obligations 21 - 231 -495
Repayments of trust preferred securities ofFresenius Medical Care Capital Trusts 25 - 461 0
Proceeds from liabilities from Senior Notes 22 0 353
Proceeds from the issuance of bearer ordinary shares 27 143 0
Proceeds from the issuance of bearer preference shares 27 146 0
Payments of additional costs of capital increase 27 - 6 0
Proceeds from the issuance of mandatory exchangeable bonds 23 554 0
Changes of accounts receivable facility 21 309 -132
Proceeds from the exercise of stock options 34 43 55
Dividends paid - 245 -205
Change in minority interest 26 - 2 –
Exchange rate effect due to corporate financing 2 11
Cash provided by/used for financing activities 2,624 -122
Effect of exchange rate changes on cash and cash equivalents 4 -16
Net increase in cash and cash equivalents 9 100
Cash and cash equivalents at the beginning of the year 13 361 261
Cash and cash equivalents at the end of the year 13 370 361
The following Notes are an integral part of the Consolidated Financial Statements.
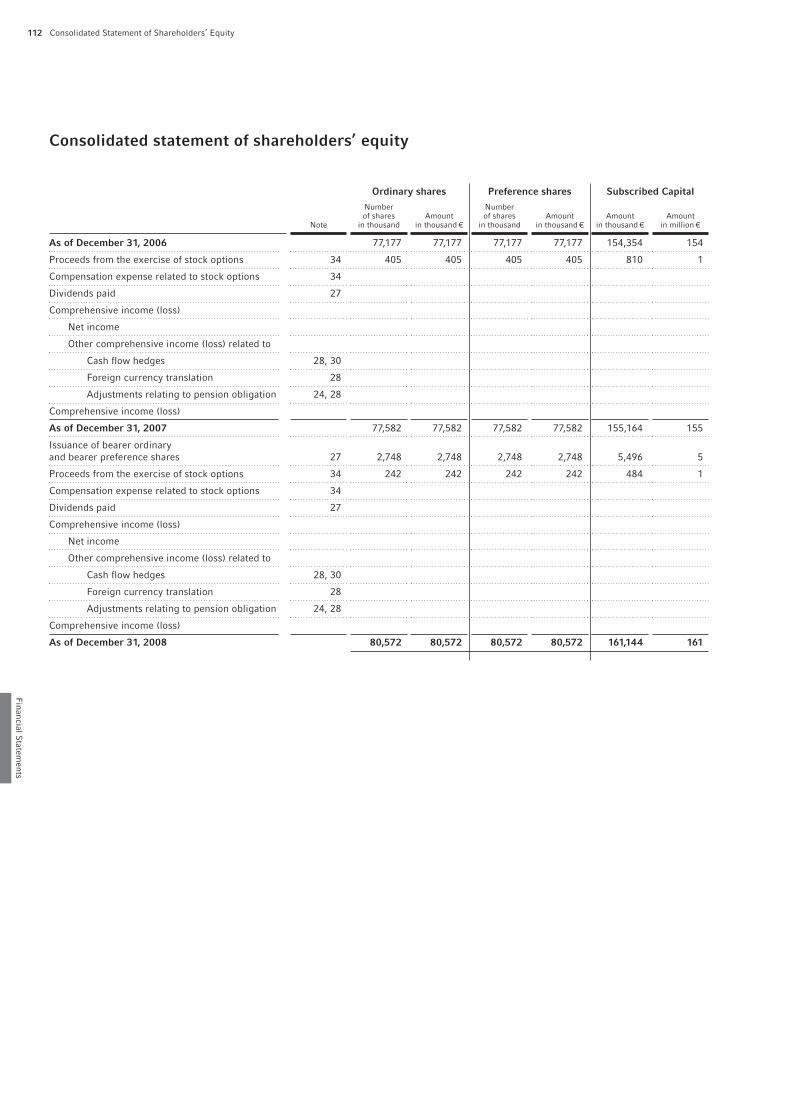
Consolidated Statement of Shareholders’ Equity112
Financial S
tatements
Consolidated statement of shareholders’ equity
Ordinary shares Preference shares Subscribed Capital
Note
Numberof shares
in thousandAmount
in thousand €
Numberof shares
in thousandAmount
in thousand €Amount
in thousand €Amount
in million €
As of December 31, 2006 77,177 77,177 77,177 77,177 154,354 154
Proceeds from the exercise of stock options 34 405 405 405 405 810 1
Compensation expense related to stock options 34
Dividends paid 27
Comprehensive income (loss)
Net income
Other comprehensive income (loss) related to
Cash flow hedges 28, 30
Foreign currency translation 28
Adjustments relating to pension obligation 24, 28
Comprehensive income (loss)
As of December 31, 2007 77,582 77,582 77,582 77,582 155,164 155
Issuance of bearer ordinaryand bearer preference shares 27 2,748 2,748 2,748 2,748 5,496 5
Proceeds from the exercise of stock options 34 242 242 242 242 484 1
Compensation expense related to stock options 34
Dividends paid 27
Comprehensive income (loss)
Net income
Other comprehensive income (loss) related to
Cash flow hedges 28, 30
Foreign currency translation 28
Adjustments relating to pension obligation 24, 28
Comprehensive income (loss)
As of December 31, 2008 80,572 80,572 80,572 80,572 161,144 161

113
Fin
anci
al S
tate
men
ts
Management Report Report Supervisory Board Management Board Supervisory BoardConsolidated Financial Statements
Consolidated statement of incomeConsolidated balance sheetConsolidated cash flow statement
Consolidated statement of shareholders’ equity
Segment ReportingNotes
Auditor’s Report
Glossary
Reserves Other comprehensive income (loss)
Note
Capitalreserve
in million €
Otherreserves
in million €
Foreigncurrrencytranslationin million €
Cash flowhedges
in million €Pensions
in million €Total
in million €
As of December 31, 2006 1,702 1,315 34 30 -67 3,168
Proceeds from the exercise of stock options 34 20 21
Compensation expense related to stock options 34 17 17
Dividends paid 27 -89 -89
Comprehensive income (loss)
Net income 410 410
Other comprehensive income (loss) related to
Cash flow hedges 28, 30 -39 -39
Foreign currency translation 28 -120 -120
Adjustments relating to pension obligation 24, 28 47 47
Comprehensive income (loss) 410 -120 -39 47 298
As of December 31, 2007 1,739 1,636 -86 -9 -20 3,415
Issuance of bearer ordinaryand bearer preference shares 27 278 283
Proceeds from the exercise of stock options 34 12 13
Compensation expense related to stock options 34 19 19
Dividends paid 27 -103 -103
Comprehensive income (loss)
Net income 270 270
Other comprehensive income (loss) related to
Cash flow hedges 28, 30 -95 -95
Foreign currency translation 28 111 111
Adjustments relating to pension obligation 24, 28 -3 -3
Comprehensive income (loss) 270 111 -95 -3 283
As of December 31, 2008 2,048 1,803 25 -104 - 23 3,910
The following Notes are an integral part of the Consolidated Financial Statements.

Segment Reporting114
Financial S
tatements
Fresenius Medical Care Fresenius Kabi
in million € 2008 2007 Change 2008 2007 Change
Sales 7,213 7,093 2% 2,495 2,030 23%
thereof contribution to consolidated sales 7,209 7,089 2% 2,458 1,986 24%
thereof intercompany sales 4 4 0% 37 44 -16%
contribution to consolidated sales 59% 62% 20% 18%
EBITDA 1,419 1,418 0% 544 408 33%
Depreciation and amortization 282 265 6% 101 76 33%
EBIT 1,137 1,153 -1% 443 332 33%
Net interest - 229 -271 15% -145 -49 -196%
Net income 556 523 6% 200 183 9%
Operating cash flow 691 875 -21% 205 179 15%
Cash flow before acquisitions and dividends 233 479 -51% 83 67 24%
Total assets 10,720 9,626 11% 6,240 2,310 170%
Debt 4,123 3,833 8% 4,288 1,121 --
Capital expenditure 467 418 12% 137 116 18%
Acquisitions 220 262 -16% 3,612 178 --
Research and development expenses 55 49 12% 109 86 27%
Employees (per capita on balance sheet date) 68,050 64,662 5% 20,457 16,964 21%
Key figures
EBITDA margin 19.7% 20.0% 21.8% 20.1%
EBIT margin 15.8% 16.3% 17.8% 16.4%
Depreciation and amortization in % of sales 3.9% 3.7% 4.0% 3.7%
Operating cash flow in % of sales 9.6% 12.3% 8.2% 8.8%
ROOA 12.3% 12.5% 8.9%2) 17.7%
1) Prior year’s segment data have been adjusted according to the new company structure as of January 1, 2008.2) The underlying pro-forma EBIT does not include special items from the acquisition of APP Pharmaceuticals, Inc. (APP).3) including special items from the APP acquisition4) before special items from the APP acquisition
Segment Reportingby business segment
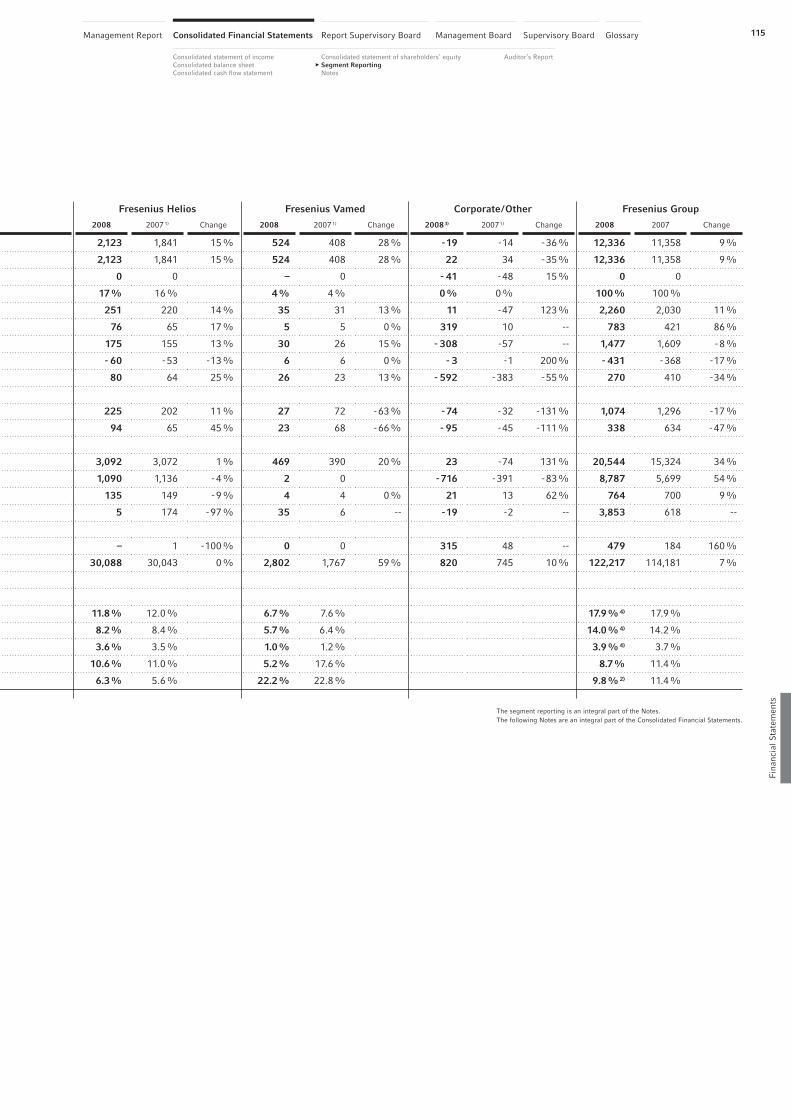
115Management Report Report Supervisory Board Management Board Supervisory BoardConsolidated Financial Statements
Consolidated statement of incomeConsolidated balance sheetConsolidated cash flow statement
Consolidated statement of shareholders’ equitySegment Reporting
Notes
Glossary
Fin
anci
al S
tate
men
ts
Auditor’s Report
Fresenius Helios Fresenius Vamed Corporate/Other Fresenius Group
2008 20071) Change 2008 20071) Change 20083) 20071) Change 2008 2007 Change
2,123 1,841 15% 524 408 28% -19 -14 -36% 12,336 11,358 9%
2,123 1,841 15% 524 408 28% 22 34 -35% 12,336 11,358 9%
0 0 – 0 - 41 -48 15% 0 0
17% 16% 4% 4% 0% 0% 100% 100%
251 220 14% 35 31 13% 11 -47 123% 2,260 2,030 11%
76 65 17% 5 5 0% 319 10 -- 783 421 86%
175 155 13% 30 26 15% - 308 -57 -- 1,477 1,609 -8%
- 60 -53 -13% 6 6 0% - 3 -1 200% - 431 -368 -17%
80 64 25% 26 23 13% - 592 -383 -55% 270 410 -34%
225 202 11% 27 72 -63% - 74 -32 -131% 1,074 1,296 -17%
94 65 45% 23 68 -66% - 95 -45 -111% 338 634 -47%
3,092 3,072 1% 469 390 20% 23 -74 131% 20,544 15,324 34%
1,090 1,136 -4% 2 0 - 716 -391 -83% 8,787 5,699 54%
135 149 -9% 4 4 0% 21 13 62% 764 700 9%
5 174 -97% 35 6 -- -19 -2 -- 3,853 618 --
– 1 -100% 0 0 315 48 -- 479 184 160%
30,088 30,043 0% 2,802 1,767 59% 820 745 10% 122,217 114,181 7%
11.8% 12.0% 6.7% 7.6% 17.9%4) 17.9%
8.2% 8.4% 5.7% 6.4% 14.0%4) 14.2%
3.6% 3.5% 1.0% 1.2% 3.9%4) 3.7%
10.6% 11.0% 5.2% 17.6% 8.7% 11.4%
6.3% 5.6% 22.2% 22.8% 9.8%2) 11.4%
The segment reporting is an integral part of the Notes.The following Notes are an integral part of the Consolidated Financial Statements.
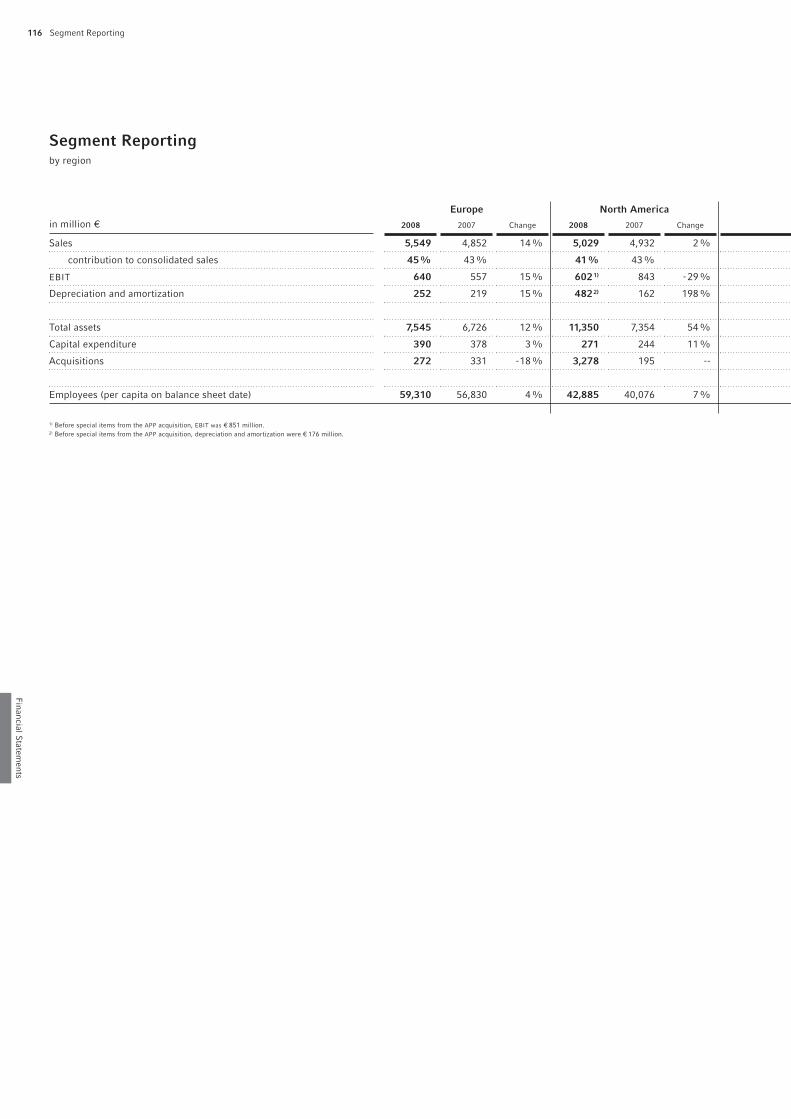
Segment Reporting116
Financial S
tatements
Europe North America
in million € 2008 2007 Change 2008 2007 Change
Sales 5,549 4,852 14% 5,029 4,932 2%
contribution to consolidated sales 45% 43% 41% 43%
EBIT 640 557 15% 6021) 843 -29%
Depreciation and amortization 252 219 15% 4822) 162 198%
Total assets 7,545 6,726 12% 11,350 7,354 54%
Capital expenditure 390 378 3% 271 244 11%
Acquisitions 272 331 -18% 3,278 195 --
Employees (per capita on balance sheet date) 59,310 56,830 4% 42,885 40,076 7%
1) Before special items from the APP acquisition, EBIT was € 851 million.2) Before special items from the APP acquisition, depreciation and amortization were € 176 million.
Segment Reportingby region

117Management Report Report Supervisory Board Management Board Supervisory BoardConsolidated Financial Statements
Consolidated statement of incomeConsolidated balance sheetConsolidated cash flow statement
Consolidated statement of shareholders’ equitySegment Reporting
Notes
Glossary
Fin
anci
al S
tate
men
ts
Auditor’s Report
Asia-Pacific Latin America Africa Fresenius Group
2008 2007 Change 2008 2007 Change 2008 2007 Change 2008 2007 Change
935 802 17% 582 488 19% 241 284 -15% 12,336 11,358 9%
7% 7% 5% 4% 2% 3% 100% 100%
129 119 8% 71 52 37% 35 38 -8% 1,477 1,609 -8%
29 23 26% 17 14 21% 3 3 0% 783 421 86%
1,082 720 50% 493 450 10% 74 74 0% 20,544 15,324 34%
42 33 27% 55 39 41% 6 6 0% 764 700 9%
269 73 -- 34 17 100% 0 2 -100% 3,853 618 --
9,114 6,917 32% 10,021 9,481 6% 887 877 1% 122,217 114,181 7%
The segment reporting is an integral part of the Notes.The following Notes are an integral part of the Consolidated Financial Statements.

CONTENT NOTES
Notes118
145 20. Other liabilities
145 21. Debt and liabilities from capital lease
obligations
152 22. Senior Notes
153 23. Mandatory Exchangeable Bonds
154 24. Pensions and similar obligations
158 25. Trust preferred securities
159 26. Minority interest
159 27. Shareholders’ equity
161 28. Other comprehensive income (loss)
� 162 OTHER NOTES
162 29. Commitments and contingent liabilities
166 30. Financial instruments
170 31. Supplementary information
on capital management
170 32. Supplementary information
on cash flow statement
171 33. Notes on segment reporting
173 34. Stock options
179 35. Related party transactions
179 36. Subsequent events
� 180 NOTES IN ACCORDANCE WITH THE
GERMAN COMMERCIAL CODE (HGB)
180 37. Compensation report
183 38. Information on the Supervisory Board
184 39. D&O Insurance
184 40. Auditor’s fees
185 41. Corporate Governance
185 42. Proposal for the distribution of earnings
186 43. Responsibility statement
� 119 GENERAL NOTES
119 1. Principles
119 I. Group structure
119 II. Basis of presentation
119 III. Summary of significant accounting
policies
128 IV. Critical accounting policies
130 2. Acquisitions and divestitures
� 133 NOTES ON THE CONSOLIDATED
STATEMENT OF INCOME
133 3. Special items relating to acquisitions
133 4. Sales
133 5. Cost of sales
133 6. Cost of materials
133 7. Personnel expenses
134 8. Selling, general and administrative
expenses
134 9. Net interest
134 10. Other financial result
134 11. Taxes
137 12. Earnings per share
� 138 NOTES ON THE CONSOLIDATED
BALANCE SHEET
138 13. Cash and cash equivalents
138 14. Trade accounts receivable
138 15. Inventories
139 16. Prepaid expenses and other current
and non-current assets
139 17. Property, plant and equipment
141 18. Goodwill and other intangible assets
144 19. Other accrued expenses

119
Not
es
Management Report Report Supervisory Board Management Board Supervisory BoardConsolidated Financial Statements
Consolidated statement of incomeConsolidated balance sheetConsolidated cash flow statement
Consolidated statement of shareholders’ equitySegment ReportingNotes
Glossary
Auditor’s Report
General Notes
1. PRINCIPLES
I. GROUP STRUCTURE
Fresenius is a worldwide operating health care group with
products and services for dialysis, the hospital and the medi-
cal care of patients at home. Further areas of activity are
hospital operations as well as engineering and services for
hospitals and other health care facilities. In addition to the
activities of Fresenius SE, the operating activities were split
into the following legally-independent business segments
(subgroups) in the fiscal year 2008:
� Fresenius Medical Care
� Fresenius Kabi
� Fresenius Helios
� Fresenius Vamed
Fresenius Medical Care is the world’s leading provider of
dialysis products and dialysis care for the life-saving treatment
of patients with chronic kidney failure. Fresenius Medical
Care treats 184,086 patients in its 2,388 own dialysis clinics.
Fresenius Kabi is Europe’s leading company in the field
of infusion therapy and clinical nutrition with subsidiaries and
distributors worldwide. Fresenius Kabi’s products are used
in hospitals as well as in out-patient medical care to treat criti-
cally and chronically ill patients. Fresenius Kabi is also a
leading provider of transfusion technology products in Europe.
As of January 1, 2008, Fresenius has reorganized its hos-
pital business. The business segment Fresenius ProServe has
been replaced by the two new business segments, Fresenius
Helios and Fresenius Vamed, which so far have formed
Fresenius ProServe. Fresenius Helios is focused on hospital
operations. Fresenius Vamed offers engineering and services
for hospitals and other health care facilities.
Fresenius SE owned 36.27% of the ordinary voting shares
of Fresenius Medical Care AG & Co. KGaA (FMC-AG & Co. KGaA)
and 35.80% of the total subscribed capital of FMC-AG & Co.
KGaA at the end of the fiscal year 2008. Fresenius Medical
Care Management AG, the general partner of FMC-AG & Co.
KGaA, is a wholly-owned subsidiary of Fresenius SE. Due to
this structure, FMC-AG & Co.KGaA is fully consolidated in the
consolidated financial statements of the Fresenius Group.
Fresenius SE continued to hold 100% of the management com-
panies of the business segments Fresenius Kabi (Fresenius
Kabi AG) as well as Fresenius Helios and Fresenius Vamed
(both held through Fresenius ProServe GmbH) on December
31, 2008. In addition, Fresenius SE holds interests in com-
panies with holding functions regarding real estate, financing
and insurance, as well as in Fresenius Netcare GmbH which
offers services in the field of information technology and in
Fresenius Biotech Beteiligungs GmbH.
The reporting currency in the Fresenius Group is the euro.
In order to make the presentation clearer, amounts are mostly
shown in million euros. Amounts which are lower than € 1
million after they have been rounded are marked with “–”.
II. BASIS OF PRESENTATION
The accompanying consolidated financial statements have
been prepared in accordance with the United States Gener-
ally Accepted Accounting Principles (US GAAP).
Since January 1, 2005, Fresenius SE as a stock exchange
listed company with a domicile in a member state of the
European Union fulfills its obligation to prepare and publish
the consolidated financial statements in accordance with
the International Financial Reporting Standards (IFRS) apply-
ing Section 315a of the German Commercial Code (HGB).
Simultaneously, the Fresenius Group voluntarily prepares and
publishes the consolidated financial statements in accordance
with US GAAP.
In order to improve clarity of presentation, various items
are aggregated in the consolidated balance sheet and state-
ment of income. These items are analyzed separately in the
Notes where this provides useful information to the users of
the consolidated financial statements.
The consolidated balance sheet is classified on the basis
of the liquidity of assets and liabilities; the consolidated state-
ment of income is classified using the cost-of-sales account-
ing format.
III. SUMMARY OF SIGNIFICANT ACCOUNTING
POLICIES
a) Principles of consolidation
The financial statements of consolidated entities have been
prepared using uniform accounting methods.
Capital consolidation is performed according to FAS 141
(Business Combinations) and FAS 142 (Goodwill and Other
Intangible Assets) by offsetting investments in subsidiaries
Notes120
Notes
against the underlying equity at the date of acquisition. The
identifiable assets and liabilities of subsidiaries are recog-
nized at their fair values. Any remaining debit balance is
recognized as goodwill and is tested at least once a year for
impairment.
Associated companies are consolidated under the equity
method according to APB No.18 (The Equity Method of
Accounting for Investments in Common Stock).
All significant intercompany revenues, expenses, income,
receivables and payables are eliminated. Profits and losses on
items of property, plant and equipment and inventory acquired
from other Group entities are also eliminated. Deferred tax
assets and liabilities are recognized on temporary differences
resulting from consolidation procedures.
Minority interest comprises the interest of minority share-
holders in the consolidated equity of Group entities. Profits
and losses attributable to the minority shareholders are sepa-
rately disclosed in the statement of income.
b) Composition of the Group
The consolidated financial statements include all material
companies in which Fresenius SE has legal or effective control.
In addition, the Fresenius Group consolidates variable inter-
est entities (VIEs) for which it is deemed the primary benefi-
ciary. If material, the equity method of accounting is used
for investments in associated companies (usually 20% to
50% of voting rights). All other investments are recorded at
acquisition costs.
Fresenius Medical Care entered into various arrangements
with certain dialysis clinics to provide management services,
financing and product supply. A group of these clinics have
negative equity and are unable to provide their own funding,
therefore Fresenius Medical Care has agreed to fund their
operations for at least a six year period.
The funding carries no interest but Fresenius Medical
Care is entitled to a prorata share of profits, if any, and has a
right of first refusal in the event the owners sell the business
or assets. These clinics are VIEs under FIN 46R (Consolida-
tion of Variable Interest Entities (revised)) in which Fresenius
Medical Care has been determined to be the primary benefi-
ciary and which therefore have been fully consolidated. They
generated approximately € 60 million (US$ 89 million) and
€ 58 million (US$ 79 million) in revenue in 2008 and 2007,
16 companies (2007: 18) were accounted for under the equity
method.
The complete list of the investments of Fresenius SE,
registered office in Bad Homburg v.d.H., will be submitted to
the electronic Federal Gazette and the electronic companies
register.
respectively. Relating to the VIEs, Fresenius Medical Care
consolidated assets in an amount of € 36 million (US$ 50 mil-
lion), liabilities in an amount of € 21 million (US$ 29 million)
and € 15 million (US$ 21 million) in equity. The interest held
by the other shareholders in these consolidated VIEs is
reported as minority interest in the consolidated balance
sheet at December 31, 2008.
Fresenius Vamed participates in long-term project entities
which are set up for long-term defined periods of time and
for the specific purpose of constructing and operating thermal
centers. Some of these project entities qualify as VIEs, in
which Fresenius Vamed is not the primary beneficiary based
on the cash flow analysis of the involved parties. The project
entities generated approximately € 42 million in annual reve-
nue in 2008 (€ 43 million in 2007). The VIEs finance them-
selves mainly through debt, profit participation rights and
investment grants. Assets and liabilities relating to the VIEs
are not material. Fresenius Vamed made no payments to
the VIEs that where not contractually stipulated. From today’s
perspective and due to the contractual situation, Fresenius
Vamed is not exposed to any material risk of loss from these
VIEs.
The consolidated financial statements of 2008 include, in
addition to Fresenius SE, 132 (2007: 133) German and 898
(2007: 854) foreign companies.
The composition of the Group changed as follows:
Germany Abroad Total
December 31, 2007 133 854 987
Additions 11 72 83
of which newly founded 6 38 44
of which acquired 3 28 31
Disposals 12 28 40
of which no longer consolidated 10 23 33
of which merged 2 5 7
December 31, 2008 132 898 1,030

121
Not
es
Management Report Report Supervisory Board Management Board Supervisory BoardConsolidated Financial Statements
Consolidated statement of incomeConsolidated balance sheetConsolidated cash flow statement
Consolidated statement of shareholders’ equitySegment ReportingNotes
Glossary
Auditor’s Report
c) Classifications
Certain items in the consolidated financial statements of 2007
have been reclassified to conform with the presentation in
2008.
d) Sales recognition policy
Sales from services are recognized at amounts estimated to
be received under reimbursement arrangements with third
party payors. Sales are recognized on the date services and
related products are provided and the payor is obligated to pay.
Product sales are recognized when title to the product
passes to the customers, either at the time of shipment, upon
receipt by the customer or upon any other terms that clearly
define passage of title. As product returns are not typical, no
return allowances are established. In the event a return is
required, the appropriate reductions to sales, cost of sales and
accounts receivable are made. Sales are stated net of dis-
counts, allowances and rebates.
In the business segment Fresenius Vamed, sales are recog-
nized for long-term production contracts depending on the
individual agreement and in accordance with the percentage
of completion (PoC) method. The sales to be recognized are
calculated as a percentage of the costs already incurred based
on the estimated total cost of the contract, milestones laid
down in the contract or the percentage of completion. Profits
are only recognized when the outcome of a production con-
tract accounted for using the PoC method can be measured
reliably.
Any tax assessed by a governmental authority that is
incurred as a result of a revenue transaction (e. g. sales tax)
is excluded from revenues and reported on a net basis.
e) Government grants
Public sector grants are not recognized until there is reason-
able assurance that the respective conditions are met and the
grants will be received. At first, the grant is recorded as a
liability and as soon as the asset is acquired it is offset against
the acquisition costs. Expense-related grants are recognized
as income in the periods in which related costs occur.
Name of the company Registered office
Fresenius Kabi
Fresenius HemoCare GmbH Bad Homburg v.d.H.
Fresenius HemoCare Beteiligungs GmbH Frankfurt am Main
Fresenius Kabi AG Frankfurt am Main
Fresenius Kabi Deutschland GmbH Bad Homburg v.d.H.
Hosped GmbH Friedberg
MC Medizintechnik GmbH Alzenau
V. Krütten Medizinische Einmalgeräte GmbH Idstein
Fresenius Helios
D.i.a.-Solution GmbH Erfurt
HELIOS Agnes Karll Krankenhaus GmbH Bad Schwartau
HELIOS Care GmbH Berlin
HELIOS Catering GmbH Berlin
HELIOS Kids in Pflege GmbH Geesthacht
HELIOS Klinik Dresden-Wachwitz GmbH Dresden
HELIOS Klinik Geesthacht GmbH Geesthacht
HELIOS Kliniken GmbH Berlin
HELIOS Kliniken Leipziger Land GmbH Borna
HELIOS Klinikum Bad Saarow GmbH Bad Saarow
HELIOS Klinikum Erfurt GmbH Erfurt
HELIOS Pflege Dresden GmbH Dresden
HELIOS Privatkliniken GmbH Berlin
HELIOS Schlossbergklinik Oberstaufen GmbH Oberstaufen
HELIOS Service GmbH Berlin
HELIOS Versorgungszentren GmbH Berlin
HELIOS Vogtland-Klinikum Plauen GmbH Plauen
HUMAINE Kliniken GmbH Berlin
Poliklinik am HELIOS Klinikum Buch GmbH Berlin
Senioren- und Pflegeheim Erfurt GmbH Erfurt
St. Josefs-Hospital GmbH Bochum
Corporate/Other
Fresenius Biotech GmbH Gräfelfing
Fresenius Biotech Beteiligungs GmbH Frankfurt am Main
Fresenius Immobilien-Verwaltungs-GmbH&Co. Objekt St.Wendel KG Bad Homburg v.d.H.
Fresenius Immobilien-Verwaltungs-GmbH&Co. Objekt Schweinfurt KG Bad Homburg v.d.H.
Fresenius Netcare GmbH Berlin
Fresenius ProServe GmbH Bad Homburg v.d.H.
Fresenius ProServe Beteiligungs GmbH Bad Homburg v.d.H.
FPS Immobilien Verwaltungs GmbH&Co. Reichenbach KG Bad Homburg v.d.H.
ProServe Krankenhaus Beteiligungs-gesellschaft mbH&Co. KG München
In 2008, the following fully consolidated German subsidiaries
of the Fresenius Group applied the exemption provided in
Sections 264 (3) and 264b, respectively, of the German Com-
mercial Code (HGB):

Notes122
Notes
f) Research and development expenses
Research is the original and planned investigation undertaken
with the prospect of gaining new scientific or technical knowl-
edge and understanding. Development is the technical and
commercial implementation of research findings. Research
and development costs are expensed as incurred.
g) Impairment
The Fresenius Group reviews the carrying amount of its prop-
erty, plant and equipment, its intangible assets as well as
other non-current assets for impairment whenever events or
changes in circumstances indicate that the carrying amount
of these assets may not be recoverable in accordance with
FAS 144 (Accounting for the Impairment or Disposal of Long-
Lived Assets). Recoverability of these assets is measured by
a comparison of the carrying amount of an asset to the future
net cash flow directly associated with the asset. If assets are
considered to be impaired, the impairment recognized is the
amount by which the carrying amount exceeds the fair value
of the asset. The Fresenius Group uses a discounted cash
flow approach or other methods, if appropriate, to assess fair
value. In accordance with FAS 144, long-lived assets to be dis-
posed of by sale are reported at the lower of carrying amount
or fair value less cost to sell and depreciation is ceased.
h) Capitalized Interest
The Fresenius Group includes capitalized interest as part of
the cost of the asset if they are directly attributable to the
acquisition, construction or manufacture of qualifying assets
in accordance with FAS 34 (Capitalization of Interest Costs).
For the fiscal years 2008 and 2007, interest of € 6 million
each, based on an average interest rate of 5.52% and 5.60%,
respectively, was recognized as a component of the cost of
assets.
i) Deferred taxes
In accordance with FAS 109 (Accounting for Income Taxes),
deferred tax assets and liabilities are recognized for the
future consequences attributable to temporary differences
between the financial statement carrying amounts of exist-
ing assets and liabilities and their respective tax basis. Fur-
thermore, deferred taxes are recognized on consolidation
procedures affecting net income. Deferred tax assets also
include claims to future tax reductions which arise from the
expected usage of existing tax losses available for carryfor-
ward where future recoverability is more likely than not.
Deferred taxes are computed using enacted or adopted tax
rates in the relevant national jurisdictions when the amounts
are recovered. Tax rates, which will be valid in the future, but
are not adopted till the balance sheet date, are
not considered.
The recoverability of the carrying amount of a deferred tax
asset is reviewed at each balance sheet date. The carrying
amount of a deferred tax asset is reduced to the extent that it
is no longer probable that sufficient taxable profit will be
available to allow the benefit of part or all of that deferred tax
asset to be utilized. The reduction is reversed to the date and
extent that it becomes probable that sufficient taxable profit
will be available.
j) Unrecognized tax benefits
The Fresenius Group adopted FASB Interpretation No. 48 (FIN
48), Accounting for Uncertainty in Income Taxes – an inter-
pretation of FASB Statement No.109, Accounting for Income
Taxes (FAS 109) as of January 1, 2007. This interpretation
clarifies the accounting for uncertainty in income taxes recog-
nized in an enterprise’s financial statements in accordance
with FAS 109. FIN 48 prescribes a two step approach to the
recognition and measurement of all tax positions taken or
expected to be taken in a tax return. The enterprise must deter-
mine whether it is more-likely-than-not that a tax position
will be sustained upon examination, including resolution of
any related appeals or litigation processes, based on the
technical merits of the position. If the threshold is met, the

123
Not
es
Management Report Report Supervisory Board Management Board Supervisory BoardConsolidated Financial Statements
Consolidated statement of incomeConsolidated balance sheetConsolidated cash flow statement
Consolidated statement of shareholders’ equitySegment ReportingNotes
Glossary
Auditor’s Report
tax position is measured at the largest amount of benefit that
is greater than 50% likely of being realized upon ultimate
settlement and is recognized in the financial statements. The
implementation of this interpretation had no impact on the
assets and liabilities of the Fresenius Group.
k) Earnings per ordinary share and preference share
Basic earnings per ordinary share and preference share for
all years presented have been calculated in accordance with
FAS 128 (Earnings per Share) using the two-class method
based upon the weighted-average number of ordinary and
preference shares outstanding. Basic earnings per ordinary
share is computed by dividing net income less preference
amounts by the weighted-average number of ordinary shares
and preference shares outstanding during the year. Basic
earnings per preference share is derived by adding the pref-
erence per preference share to the basic earnings per ordi-
nary share. Diluted earnings per share include the effect of
all potentially dilutive instruments on ordinary shares and
preference shares that would have been outstanding during
the fiscal year. The awards granted under Fresenius’ and
Fresenius Medical Care’s stock option plans can result in a
dilutive effect.
l) Cash and cash equivalents
Cash and cash equivalents comprise cash funds and all short-
term, liquid investments with original maturities of up to three
months.
m) Trade accounts receivable
Trade accounts receivable are stated at their nominal value
less allowance for doubtful accounts. Allowances are estimated
mainly on the basis of payment history to date, the age struc-
ture of balances and the contractual partner involved. In order
to assess the appropriateness of allowances, the Fresenius
Group checks regularly whether there have been any diver-
gences to previous payment history.
n) Inventories
Inventories comprise all assets which are held for sale in the
normal course of business (finished products), in the process
of production for such sale (work in progress) or consumed
in the production process or in the rendering of services (raw
materials and supplies).
Inventories are stated at the lower of acquisition or man-
ufacturing cost (determined by using the average or first-in,
first-out method) or market value. Manufacturing costs com-
prise direct costs, production and material overhead, including
depreciation charges.
o) Property, plant and equipment
Property, plant and equipment are stated at acquisition and
manufacturing cost less accumulated depreciation. Signifi-
cant improvements are capitalized; repair and maintenance
costs that do not extend the useful lives of the assets are
charged to expense as incurred. Depreciation on property,
plant and equipment is calculated using the straight-line
method over the estimated useful lives of the assets ranging
from 4 to 50 years for buildings and improvements (with
a weighted-average life of 17 years) and 3 to 15 years for
machinery and equipment (with a weighted-average life
of 10 years). Internal use platform software that is integral to
the computer equipment it supports is included in property,
plant and equipment.
p) Intangible assets with definite useful lives
In accordance with FAS 142 (Goodwill and Other Intangible
Assets), intangible assets with definite useful lives, for exam-
ple non-compete agreements, technology and licenses to
manufacture, distribute and sell pharmaceutical drugs are
amortized using the straight-line method over their respective
useful lives to their residual values and reviewed for impair-
ment in accordance with FAS 144 (Accounting for Impairment
or Disposal of Long-Lived Assets) (see Note 1. III g, Impair-
ment). Non-compete agreements with definite useful lives
have useful lives ranging from 7 to 25 years with an average
useful life of 8 years. Technology has a useful live of 15 years.

Notes124
Notes
Licenses to manufacture, distribute and sell pharmaceutical
drugs are amortized over the contractual license period based
upon the annual estimated units of sale of the licensed prod-
uct. All other intangible assets are amortized over their individ-
ual estimated useful lives between 3 and 15 years.
Losses in value of a lasting nature are impaired.
q) Goodwill and other intangible assets with indefinite
useful lives
Intangible assets with indefinite useful lives such as product
rights, tradenames and certain qualified management con-
tracts acquired in a purchase method business combination
are recognized and reported apart from goodwill, pursuant
to the criteria specified by FAS 141 (Business Combinations).
They are recorded at acquisition costs. Goodwill and intan-
gible assets with indefinite useful lives are not amortized but
tested for impairment annually or when an event becomes
known that could trigger an impairment (Impairment Test).
To perform the annual impairment test of goodwill, the
Fresenius Group identified several reporting units in accord-
ance with FAS 142 and determined the carrying amount of
each reporting unit by assigning the assets and liabilities,
including the existing goodwill and intangible assets, to those
reporting units. At least once a year, the Fresenius Group
compares the fair value of each reporting unit to the reporting
unit’s carrying amount. The fair value of a reporting unit is
determined using a discounted cash flow approach based
upon the cash flow expected to be generated by the reporting
unit. In case that the fair value of the reporting unit is less
than its carrying amount the difference is at first recorded as
an impairment of the fair value of the goodwill.
To evaluate the recoverability of separable intangible
assets with indefinite useful lives, the Fresenius Group com-
pares the fair values of these intangible assets with their
carrying values. An intangible asset’s fair value is determined
using a discounted cash flow approach and other methods,
if appropriate.
The recoverability of goodwill and other separable intangi-
ble assets with indefinite useful lives recorded in the Group’s
consolidated balance sheet was verified. As a result, the
Fresenius Group did not record any impairment losses in 2008
and 2007.
r) Leases
Leased assets assigned to the Fresenius Group based on the
risk and rewards approach (finance leases) are recognized
as property, plant and equipment in accordance with FAS 13
(Accounting for Leases) and measured on receipt date at
their present values of lease payments as long as their fair
values are not lower. Leased assets are depreciated in straight-
line over their useful lives. If there is doubt as to whether
title to the asset passes at a later stage and there is no oppor-
tune purchase option the asset is depreciated over the lease
term, if this is shorter. An impairment loss is recognized if the
recoverable amount is lower than the amortized cost of the
leased asset.
Finance lease liabilities are measured at the present value
of the future lease payments and are recognized as financial
liability.
Property, plant and equipment, rented by the Fresenius
Group, is accounted at its purchase costs. Its depreciation is
calculated using the straight-line method over the leasing
time and its expected residual value.
s) Financial instruments
Until now the Fresenius Group classified its financial instru-
ments as follows: cash and cash equivalents, assets recognized
at carrying amount, liabilities recognized at carrying amount
and derivatives designated as hedging instruments. According
to new financial instruments in 2008, the Fresenius Group
defined two further classes: assets recognized at fair value and
liabilities recognized at fair value.
The class of assets recognized at carrying amount corre-
sponds to the balance sheet item trade accounts receivable
(including intercompany receivables). The class of assets
recognized at fair value consists of derivative financial instru-
ments embedded in mandatory exchangeable bonds (MEB).
125
Not
es
Management Report Report Supervisory Board Management Board Supervisory BoardConsolidated Financial Statements
Consolidated statement of incomeConsolidated balance sheetConsolidated cash flow statement
Consolidated statement of shareholders’ equitySegment ReportingNotes
Glossary
Auditor’s Report
The embedded derivates are included in the balance sheet
item prepaid expenses and other current assets. Due to their
special character and the difference in valuation, the embed-
ded derivatives are classified separately from other prepaid
expenses and current assets. Liabilities recognized at carry-
ing amount comprise trade accounts payable, short-term
accounts payable to related parties, short-term borrowings
(including intercompany borrowings), the current and non-
current portion of debt and liabilities from capital lease obliga-
tions, Senior Notes, MEB and the current and non-current
portion of trust preferred securities of the Fresenius Medical
Care Capital Trusts (without capital lease obligations). Liabili-
ties recognized at fair value contain Contingent Value Rights
(CVR). The CVR are included in the balance sheet item other
long-term liabilities. Like the embedded derivatives, the CVR
are classified separately from their balance sheet item, because
of their special character and different valuation.
In accordance with FAS 133 (Accounting for Derivative
Instruments and Hedging Activities), derivative financial instru-
ments which primarily include foreign currency forward
contracts and interest rate swaps are recognized as assets or
liabilities at fair value in the balance sheet. Changes in the
fair value of derivative financial instruments classified as
fair value hedges and in the corresponding underlyings are
recognized periodically in earnings. The effective portion
of changes in fair value of cash flow hedges is recognized in
accumulated other comprehensive income (loss) in share-
holders’ equity (see Note 30, Financial instruments). The inef-
fective portion of cash flow hedges is recognized in earnings
immediately.
t) Liabilities
Liabilities are generally stated at present value which normally
corresponds to the value of products or services which are
delivered. As a general policy, short-term liabilities are mea-
sured at their repayment amount.
u) Legal contingencies
In the ordinary course of Fresenius Group’s operations, the
Fresenius Group is subject to litigation, arbitration and in-
vestigations relating to various aspects of its business. The
Fresenius Group regularly analyzes current information
about such claims for probable losses and provides accruals
for such matters, including estimated expenses for legal ser-
vices, as appropriate. The Fresenius Group utilizes its inter-
nal legal department as well as external resources for these
assessments. In making the decision regarding the need for
a loss accrual, the Fresenius Group considers the degree of
probability of an unfavorable outcome and its ability to make
a reasonable estimate of the amount of loss.
The filing of a suit or formal assertion of a claim, or the
disclosure of any such suit or assertion, does not necessarily
indicate that an accrual of a loss is appropriate.
v) Other accrued expenses
In accordance with FAS 5 (Accounting for Contingencies),
accruals for taxes and other obligations are recognized when
there is a present obligation to a third party arising from past
events, it is probable that the obligation will be settled in the
future and the amount can be reliably estimated.
Tax accruals include obligations for the current year and
for prior years.
w) Pension liabilities and similar obligations
The Fresenius Group recognizes the underfunded status of its
defined benefit plans, measured as the difference between
the benefit obligation and plan assets at fair value, as a liabil-
ity. Changes in the funded status of a plan, net of tax, result-
ing from actuarial gains or losses, prior service costs or costs
that are not recognized as components of the net periodic
benefit cost, will be recognized through accumulated other
comprehensive income (loss) in the year in which they occur.
Actuarial gains or losses and prior service costs are subse-
quently recognized as components of net periodic benefit cost
pursuant to the recognition and amortization provisions of
the standards.
Notes126
Notes
x) Debt issuance costs
Debt issuance costs are amortized over the term of the related
obligation.
y) Stock option plans
Effective January 1, 2006, the Fresenius Group adopted the
provisions of Statement of Financial Accounting Standard
No.123R (revised 2004), Share-Based Payment (FAS 123(R))
using the modified prospective transition method. Under this
transition method, compensation cost recognized in 2007
and in 2008 include applicable amounts of: (a) compensation
cost of all stock-based payments granted prior to, but not
yet vested as of, January 1, 2006 (based on the grant-date fair
value estimated in accordance with the original provisions
of FAS 123 and previously presented in Fresenius Group’s pro
forma footnote disclosures); (b) compensation cost for all
stock-based payments subsequent to January 1, 2006 (based
on the grant-date fair value estimated in accordance with the
new provisions of FAS 123(R)).
z) Self-insurance programs
Under the insurance programs for professional, product and
general liability, auto liability and worker’s compensation
claims, the largest subsidiary of the Fresenius Group, located
in North America, is partially self-insured for professional lia-
bility claims. For all other coverages, this subsidiary assumes
responsibility for incurred claims up to predetermined amounts
above which third party insurance applies. Reported liabilities
for the year represent estimated future payments of the
anticipated expense for claims incurred (both reported and
incurred but not reported) based on historical experience
and existing claim activity. This experience includes both the
rate of claims incidence (number) and claim severity (cost)
and is combined with individual claim expectations to estimate
the reported amounts.
aa) Foreign currency translation
The reporting currency is the euro. The Fresenius Group
follows the provisions of FAS 52 (Foreign Currency Transla-
tion). Substantially all assets and liabilities of the foreign sub-
sidiaries are translated at mid-closing rate on balance sheet
date, while revenues and expenses are translated at average
exchange rates. Adjustments due to foreign currency trans-
lation fluctuations are excluded from net earnings and are
reported in accumulated other comprehensive income (loss).
In addition, the translation adjustments of certain intercom-
pany borrowings, which are considered foreign equity invest-
ments, are also reported in accumulated other comprehen-
sive income (loss).
Gains and losses arising from the translation of foreign cur-
rency positions as well as those arising from the elimination
of foreign currency intercompany loans are recorded as gen-
eral and administrative expenses, as far as they are not con-
sidered foreign equity instruments. Besides the gains shown
under Note 3, Special items relating to acquisitions, further
immaterial gains resulted out of this transaction in the fiscal
year 2008.
The exchange rates of the main currencies affecting
foreign currency translation developed as follows:
Year-endexchange rate1)
Dec 31, 2008
Year-endexchange rate 1)
Dec 31, 2007
Averageexchange rate
2008
Averageexchange rate
2007
US-Dollar per € 1.3917 1.4721 1.4713 1.3705
Pound sterling per € 0.9525 0.7334 0.7961 0.6845
Swedish krona per € 10.8700 9.4415 9.6138 9.2507
Chinese renminbi per € 9.4956 10.7524 10.2287 10.4183
Japanese yen per € 126.14 164.93 152.47 161.26
1) mid-closing rate on balance sheet date
127
Not
es
Management Report Report Supervisory Board Management Board Supervisory BoardConsolidated Financial Statements
Consolidated statement of incomeConsolidated balance sheetConsolidated cash flow statement
Consolidated statement of shareholders’ equitySegment ReportingNotes
Glossary
Auditor’s Report
bb) Use of estimates
The preparation of consolidated financial statements in con-
formity with US GAAP requires the management to make esti-
mates and assumptions that affect the reported amounts of
assets and liabilities, the disclosure of contingent assets and
liabilities at the date of consolidated financial statements
and the reported amounts of revenues and expenses during
the reporting period. Actual results could differ from those
estimates.
cc) Receivables management
The entities of the Fresenius Group perform ongoing eval-
uations of the financial situation of their customers and gen-
erally do not require a collateral from the customers for the
supply of products and provision of services. Approximately
21% and 22% of the Fresenius Group’s sales were earned
and subject to the regulations under governmental health
care programs, Medicare and Medicaid, administered by the
United States government in 2008 and 2007, respectively.
dd) Recent pronouncements
In December 2007, the Financial Accounting Standards Board
(FASB) issued Statement No.160, Noncontrolling Interests
in Consolidated Financial Statements – an amendment of ARB
No. 51 (FAS 160), which establishes a framework for reporting
of noncontrolling or minority interests, the portion of equity
in a subsidiary not attributable, directly or indirectly, to a par-
ent. FAS 160 is effective for financial statements issued for
fiscal years beginning on or after December 15, 2008. Earlier
adoption is prohibited. The Fresenius Group will adopt this
standard as of January 1, 2009.
In December 2007, FASB issued Statement No.141 (re-
vised), Business Combinations (FAS 141(R)). This Statement
replaces FASB Statement No.141, Business Combinations
and retains the fundamental requirements in Statement 141
that the acquisition method of accounting (which Statement
141 called the purchase method) be used for all business com-
binations and for an acquirer to be identified for each busi-
ness combination. This Statement defines the acquirer as the
entity that obtains control of one or more businesses in the
business combination and establishes the acquisition date as
the date that the acquirer achieves control.
In general, the main points of this Statement are that the
assets acquired, liabilities assumed and non-controlling inter-
ests in the acquiree are stated at fair value as of the date of
acquisition, that assets acquired and liabilities assumed arising
from contractual contingencies are recognized as of the acqui-
sition date, measured at their acquisition date fair values
and that contingent consideration is recognized at the acqui-
sition date, measured at its fair value at that date.
This Statement applies prospectively to business combina-
tions for which the acquisition date is on or after the begin-
ning of the first annual reporting period beginning on or after
December 15, 2008. An entity may not apply it before that
date. The effective date of this Statement is the same as that
of the related FAS 160. The Fresenius Group will adopt this
standard as of January 1, 2009.
In March 2008, FASB issued Statement No.161, Disclo-
sures about Derivative Instruments and Hedging Activities –
an amendment of FASB Statement No.133 (FAS 161). This
Statement changes the disclosure requirements for deriva-
tive instruments and hedging activities. Entities are required
to provide enhanced disclosures about (a) how and why an
entity uses derivative instruments, (b) how derivative instru-
ments and related hedged items are accounted for under FAS
133 and its related interpretations, and (c) how derivative
instruments and related hedged items affect an entity’s finan-
cial position, financial performance, and cash flows.
The requirements of this Statement are effective for finan-
cial statements issued for fiscal years and interim periods
beginning after November 15, 2008, with early application
encouraged. This Statement encourages comparative disclo-
sures for earlier periods at initial adoption. The Fresenius
Group will adopt this standard as of January 1, 2009 and will
implement its disclosure requirements in 2009.

Notes128
Notes
On December 30, 2008, FASB issued final staff position FSP
FAS 132R-1, Employers’ Disclosures about Postretirement
Benefit Plan Assets (FSP 132R-1). The FSP 132R-1 requires
more disclosure about pension plan assets mainly regarding
the following areas:
� how investment allocation decisions are made, including
the factors that are pertinent to an understanding of invest-
ment policies and strategies,
� the major categories of plan assets,
� the inputs and valuation techniques used to measure the
fair value of plan assets,
� the effect of fair value measurements using significant
unobservable inputs (Level 3) on changes in plan assets
for the period, and
� significant concentrations of risk within plan assets.
The disclosures about plan assets required by this FSP shall
be provided for fiscal years ending after December 15, 2009.
Upon initial application, the provisions of this FSP are not
required for earlier periods that are presented for comparative
purposes. Earlier application of the provisions of this FSP is
permitted. The Fresenius Group will comply with the disclo-
sure requirements of this standard in its report on its con-
solidated financial statements beginning for the fiscal year
ended December 31, 2009.
IV. CRITICAL ACCOUNTING POLICIES
In the opinion of the Management of the Fresenius Group,
the following accounting policies and topics are critical for the
consolidated financial statements in the present economic
environment. The influences and judgments as well as the
uncertainties which affect them are also important factors to
be considered when looking at present and future operating
earnings of the Fresenius Group.
a) Recoverability of goodwill and intangible assets with
indefinite useful lives
The amount of intangible assets, including goodwill, product
rights, tradenames and management contracts, represents a
considerable part of the total assets of the Fresenius Group.
At December 31, 2008 and December 31, 2007, the carrying
amount of goodwill and non-regularly amortizable intangible
assets with indefinite useful lives was € 10,703 million and
€ 7,411 million, respectively. This represented 52% and 48%,
respectively, of total assets.
In accordance with FAS 142 (Goodwill and Other Intangible
Assets), an impairment test of goodwill and non-amortizable
intangible assets with indefinite useful lives is performed at
least once a year, or if events occur or circumstances change
that would indicate the carrying amount might be impaired
(Impairment test).
To comply with the regulations of FAS 142 and determine
possible impairments of these assets, the fair value of the
reporting units determined in accordance with FAS 142 is com-
pared to the reporting units’ carrying amount. The fair value
of each reporting unit is determined using estimated future
cash flows for the unit discounted by a weighted-average cost
of capital (WACC) specific to that reporting unit. Estimating
the discounted future cash flows involves significant assump-
tions, especially regarding future reimbursement rates and
sales prices, number of treatments, sales volumes and costs.
In determining discounted cash flows, the Fresenius Group
utilizes for every reporting unit its three-year budget, pro-
jections for years 4 to 10 and a corresponding growth rate for
all remaining years. These growth rates are 0% to 4% for
Fresenius Medical Care, 2% for Fresenius Kabi and 1% for
Fresenius Helios and for Fresenius Vamed. This discount
factor is determined by the WACC of the respective reporting
unit. Fresenius Medical Care’s WACC consisted of a basic
rate of 6.47% for 2008. This basic rate is then adjusted by a
country specific risk rate within each reporting unit for deter-
mining the reporting unit’s fair value. In 2008, this rate ranged
from 0% to 7%. In the business segments Fresenius Kabi,
Fresenius Helios and Fresenius Vamed, the WACC was 7.28%,
country specific adjustments did not occur. If the fair value
of the reporting unit is less than its carrying amount, the dif-
ference is recorded as an impairment of the fair value of the
goodwill at first. An increase of the WACC by 0.5% would
not have resulted in the recognition of an impairment loss in
2008.

129
Not
es
Management Report Report Supervisory Board Management Board Supervisory BoardConsolidated Financial Statements
Consolidated statement of incomeConsolidated balance sheetConsolidated cash flow statement
Consolidated statement of shareholders’ equitySegment ReportingNotes
Glossary
Auditor’s Report
A prolonged downturn in the health care industry with lower
than expected increases in reimbursement rates and/or higher
than expected costs for providing health care services could
adversely affect the estimated future cash flows of certain
countries or segments. Future adverse changes in a reporting
unit’s economic environment could affect the discount rate.
A decrease in the estimated future cash flows and/or a decline
in the reporting unit’s economic environment could result
in impairment charges to goodwill and other intangible assets
with indefinite lives which could materially and adversely
affect the Group’s future operating results.
b) Legal contingencies
The Fresenius Group is involved in several legal matters aris-
ing from the ordinary course of its business. The outcome
of these matters may have a material effect on the financial
position, results of operations or cash flows of the Fresenius
Group. For details, please see Note 29, Commitments and
contingent liabilities.
The Fresenius Group regularly analyzes current informa-
tion about such claims for probable losses and provides accru-
als for such matters, including estimated expenses for legal
services, as appropriate. The Fresenius Group utilizes its inter-
nal legal department as well as external resources for these
assessments. In making the decision regarding the need for a
loss accrual, the Fresenius Group considers the degree of
probability of an unfavorable outcome and its ability to make
a reasonable estimate of the amount of loss.
The filing of a suit or formal assertion of a claim, or the
disclosure of any such suit or assertion, does not necessarily
indicate that an accrual of a loss is appropriate.
c) Allowance for doubtful accounts
Trade accounts receivable are a significant asset and the allow-
ance for doubtful accounts is a significant estimate made by
the Management. Trade accounts receivable were € 2,477 mil-
lion and € 2,159 million in 2008 and 2007, respectively, net
of allowance. Approximately two thirds of receivables derive
from the business segment Fresenius Medical Care and mainly
relate to the dialysis care business in North America.
The major debtors or debtor groups of trade accounts
receivable were US Medicare and Medicaid health care pro-
grams with 14% as well as private insurers in the US with
16% at December 31, 2008. Other than that, the Fresenius
Group has no significant risk concentration, due to its inter-
national and heterogeneous customer structure.
The allowance for doubtful accounts was € 257 million
and € 223 million as of December 31, 2008 and December 31,
2007, respectively.
Sales are invoiced at amounts estimated to be receivable
under reimbursement arrangements with third party payors.
Estimates for the allowance for doubtful accounts are mainly
based on historic collection experience, taking into account
the aging of accounts receivable and the contract partners.
The Fresenius Group believes that these analyses result in a
well-founded estimate of allowances for doubtful accounts.
From time to time, the Fresenius Group reviews changes in
collection experience to ensure the appropriateness of the
allowances.
Deterioration in the ageing of receivables and collection
difficulties could require that Fresenius Group increases the
estimates of allowances for doubtful accounts. Additional
expenses for uncollectible receivables could have a significant
negative impact on future operating results.
d) Self-insurance programs
Under the insurance programs for professional, product and
general liability, auto liability and worker’s compensation
claims, the largest subsidiary of the Fresenius Group, located
in North America, is partially self-insured for professional
liability claims. For further details regarding the accounting
policies for self-insurance programs, please see Note 1. III z,
self-insurance programs.

Notes130
Notes
2. ACQUISITIONS AND DIVESTITURES
ACQUISITIONS AND DIVESTITURES
The Fresenius Group made acquisitions of € 3,853 million
and € 618 million in 2008 and 2007, respectively. Of this
amount, € 3,053 million were paid in cash and € 800 million
were assumed obligations in 2008.
Fresenius Medical Care
In the year 2008, acquisition spending of Fresenius Medical
Care in an amount of € 220 million related mainly to the pur-
chase of dialysis clinics and license agreements. In July 2008,
Fresenius Medical Care entered into license and distribution
agreements to market and distribute intravenous iron prod-
ucts. For further details on these license and distribution
agreements, please see Note 18, Goodwill and other intangi-
ble assets.
Fresenius Medical Care made acquisitions of € 262 mil-
lion in 2007. The main acquisition took place on November
26, 2007, as Fresenius Medical Care completed the acquisition
of all of the common stock of Renal Solutions, Inc., (RSI),
an Indiana corporation with principal offices in Warrendale,
Pennsylvania, United States. The RSI acquisition agreement
provided for total consideration of up to US$ 204 million,
consisting of US$ 20 million, previously advanced to RSI in the
form of a loan, US$ 100 million paid at closing, US$ 60 mil-
lion paid in November 2008, US$ 3 million receivable related
to a working capital adjustment, which was received in 2008,
and up to US$ 30 million in milestone payments over a three
year period contingent upon the achievement of certain per-
formance criteria, none of which were due or paid in 2008. In
2007, Fresenius Medical Care recorded a liability of US$ 27.4
million representing the net present value of the US$ 30 mil-
lion milestone payments as it was deemed beyond reason-
able doubt that the future performance criteria would be
achieved. Furthermore, acquisitions of €115 million were
mainly attributable to the purchase of dialysis centers.
Fresenius Medical Care sold the perfusion business unit
of Fresenius Medical Care Extracorporeal Alliance (FMCEA)
during the second quarter of 2007. In 2006, FMCEA’s perfusion
business contributed revenue of approximately € 83 million.
The US perfusion business was deconsolidated effective
May 9, 2007.
Fresenius Kabi
Acquisitions in 2008
In the year 2008, Fresenius Kabi spent € 3,612 million which
mainly referred to the acquisitions of APP Pharmaceuticals,
Inc. (APP), United States, and Dabur Pharma Ltd., India.
Acquisition of APP Pharmaceuticals, Inc.
In July 2008, Fresenius Kabi has signed definitive agreements
to acquire 100% of the share capital of APP. APP is a lead-
ing manufacturer of intravenously administered generic drugs
(IV generics) in North America. Through the acquisition
of APP, Fresenius Kabi enters the US pharmaceuticals market
and achieves a leading position in the global IV generics
market. APP focuses on IV generics for hospital use and dis-
tributes its products in the US and Canada. The company
employs around 1,400 people and has modern production
facilities in Illinois, New York and Puerto Rico as well as a dis-
tribution company in Toronto, Canada. In 2008, APP achieved
sales of US$ 777 million and an adjusted EBITDA of US$ 317
million.
After receipt of all necessary regulatory approvals and ful-
fillment of further closing conditions, Fresenius Kabi has
completed the acquisition of APP on September 10, 2008. APP
shareholders received a Cash Purchase Price of US$ 23.00
per share. Based on the Cash Purchase Price, the transaction
values the fully diluted equity capital of APP at approximately
US$ 3.7 billion. Furthermore, the shareholders received a
registered and tradable Contingent Value Right (CVR) that
could deliver up to US$ 6.00 per share additionally, payable in
2011, if APP exceeds a cumulative adjusted EBITDA target
for 2008 to 2010. In addition, US$ 0.9 billion of net debt was
assumed. The net debt was refinanced by the financial instru-
ments described below.
The acquisition was financed with the following mix of
debt and equity:
� Mandatory exchangeable bonds with an aggregate nomi-
nal amount of € 554.4 million (US$ 871 million) (see Note
23, Mandatory Exchangeable Bonds)
� Capital increase in an amount of approximately € 289 mil-
lion (US$ 453 million) (see Note 27, Shareholders’ Equity)
� Senior secured credit facilities in an amount of US$ 2.45
billion (see Note 21, Debt and liabilities from capital lease
obligations)

131
Not
es
Management Report Report Supervisory Board Management Board Supervisory BoardConsolidated Financial Statements
Consolidated statement of incomeConsolidated balance sheetConsolidated cash flow statement
Consolidated statement of shareholders’ equitySegment ReportingNotes
Glossary
Auditor’s Report
� Bridge Credit Agreement of US$ 1.3 billion (see Note 21,
Debt and liabilities from capital lease obligations)
In October 2008, the senior secured credit facilities were
increased by US$ 500 million. These proceeds together with
other available funds were used to reduce the Bridge Credit
Agreement to US$ 650 million. In January 2009, the residual
amount of the Bridge Credit Agreement was redeemed using
the proceeds of new Senior Notes (see Note 36, Subsequent
events).
As of September 1, 2008, the Fresenius Group consolidated
APP for the first time. APP contributed € -233 million to the
net income of the Fresenius Group. Included therein are spe-
cial revenues in an amount of € 75 million resulting from
the valuation of the CVR (see Note 10, Other financial result)
as well as one-time special charges in an amount of € 311
million in connection with the first-time consolidation and the
financing of the acquisition. The one-time special charges
include acquired in-process R & D in an amount of € 272 mil-
lion, which were according to US GAAP fully amortized.
The following table summarizes the fair values of assets
acquired and liabilities assumed at the date of the acquisi-
tion. This allocation of the purchase price is based upon the
best information available to management at present.
Due to the relatively short interval between the closing date
of the acquisition and the balance sheet date, this information
may be incomplete. Any adjustments to the preliminary alloca-
tion, net of related income tax effects, would be recorded
with a corresponding adjustment to goodwill.
The purchase price allocation is as follows:
in million US$
Net working capital and other assets/liabilities 195
Property, plant and equipment 133
In-process research and development 366
Identifiable intangible assets 542
Goodwill 3,670
Total 4,906
The acquisition increased the total assets of the Fresenius
Group by € 3.5 billion. The identifiable intangible assets
acquired in an amount of US$ 542 million (€ 389 million)
mainly comprise product rights and have an average useful
life of 20 years. The capitalized goodwill in an amount of
US$ 3.7 billion (€ 2.6 billion) is not deductible for tax purposes.
The following financial information on a pro forma basis
reflects the consolidated results of operations as if the acqui-
sition of APP had been consummated at the beginning of
2008 and 2007, respectively. To achieve better comparability,
special items were solely adjusted in 2008. The pro forma
information includes adjustments mainly for interest expense
on acquisition debt and income taxes. The pro forma finan-
cial information is not necessarily indicative of the results of
operations as it would have been had the acquisition of APP
been consummated at the beginning of the respective periods.
2008 2007
in million € as reported pro forma as reported pro forma
Sales 12,336 12,641 11,358 11,825
Adjusted net income1) 450 412 410 321
Net income 270 232 410 321
Basic earnings per ordinary share in € 1.71 1.46 2.64 2.07
Fully diluted earning per ordinary share in € 1.58 1.50 2) 2.61 2.10 2)
Basic earnings per preference share in € 1.72 1.47 2.65 2.08
Fully diluted earning per preference share in € 1.59 1.512) 2.62 2.11 2)
1) Before special items relating to the APP acquisition (for details see Note 3, Special items relating to acquisitions)2) Under consideration of dilution effects which positively influence the earnings per share
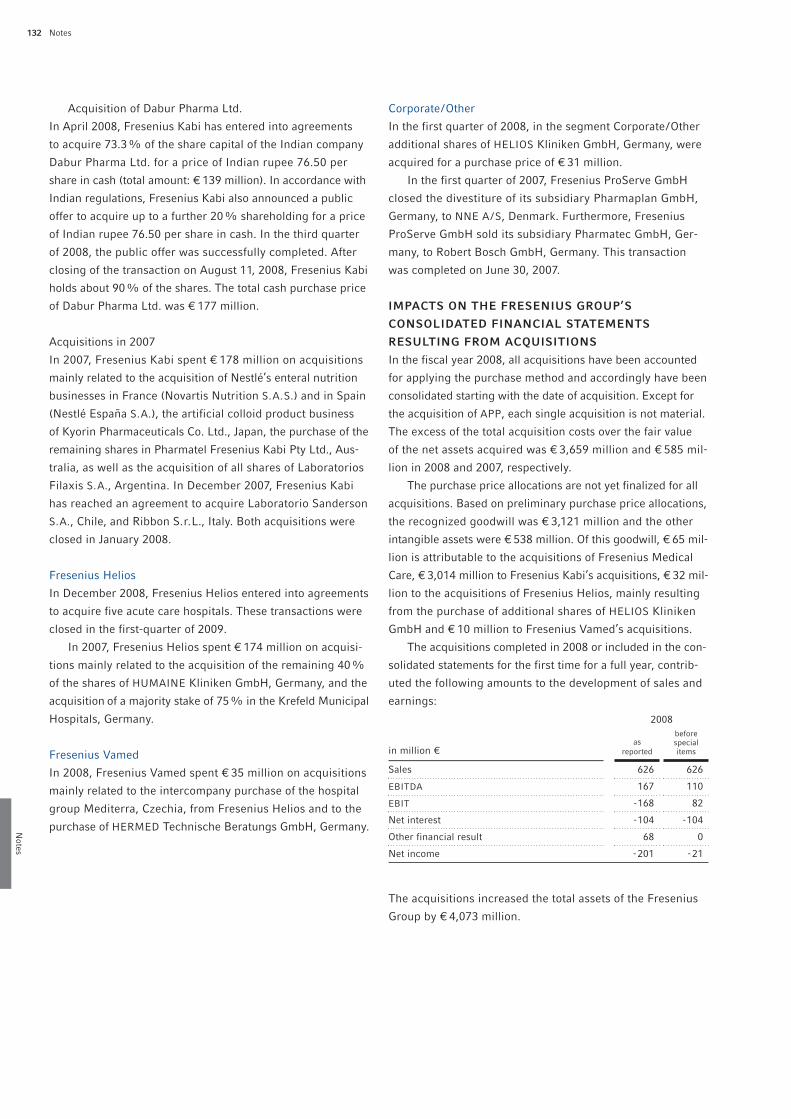
Notes132
Notes
Acquisition of Dabur Pharma Ltd.
In April 2008, Fresenius Kabi has entered into agreements
to acquire 73.3% of the share capital of the Indian company
Dabur Pharma Ltd. for a price of Indian rupee 76.50 per
share in cash (total amount: € 139 million). In accordance with
Indian regulations, Fresenius Kabi also announced a public
offer to acquire up to a further 20% shareholding for a price
of Indian rupee 76.50 per share in cash. In the third quarter
of 2008, the public offer was successfully completed. After
closing of the transaction on August 11, 2008, Fresenius Kabi
holds about 90% of the shares. The total cash purchase price
of Dabur Pharma Ltd. was € 177 million.
Acquisitions in 2007
In 2007, Fresenius Kabi spent € 178 million on acquisitions
mainly related to the acquisition of Nestlé’s enteral nutrition
businesses in France (Novartis Nutrition S.A.S.) and in Spain
(Nestlé España S.A.), the artificial colloid product business
of Kyorin Pharmaceuticals Co. Ltd., Japan, the purchase of the
remaining shares in Pharmatel Fresenius Kabi Pty Ltd., Aus-
tralia, as well as the acquisition of all shares of Laboratorios
Filaxis S.A., Argentina. In December 2007, Fresenius Kabi
has reached an agreement to acquire Laboratorio Sanderson
S.A., Chile, and Ribbon S.r.L., Italy. Both acquisitions were
closed in January 2008.
Fresenius Helios
In December 2008, Fresenius Helios entered into agreements
to acquire five acute care hospitals. These transactions were
closed in the first-quarter of 2009.
In 2007, Fresenius Helios spent € 174 million on acquisi-
tions mainly related to the acquisition of the remaining 40%
of the shares of HUMAINE Kliniken GmbH, Germany, and the
acquisition of a majority stake of 75% in the Krefeld Municipal
Hospitals, Germany.
Fresenius Vamed
In 2008, Fresenius Vamed spent € 35 million on acquisitions
mainly related to the intercompany purchase of the hospital
group Mediterra, Czechia, from Fresenius Helios and to the
purchase of HERMED Technische Beratungs GmbH, Germany.
2008
in million €as
reported
before specialitems
Sales 626 626
EBITDA 167 110
EBIT -168 82
Net interest -104 -104
Other financial result 68 0
Net income -201 -21
Corporate/Other
In the first quarter of 2008, in the segment Corporate/Other
additional shares of HELIOS Kliniken GmbH, Germany, were
acquired for a purchase price of € 31 million.
In the first quarter of 2007, Fresenius ProServe GmbH
closed the divestiture of its subsidiary Pharmaplan GmbH,
Germany, to NNE A/S, Denmark. Furthermore, Fresenius
ProServe GmbH sold its subsidiary Pharmatec GmbH, Ger-
many, to Robert Bosch GmbH, Germany. This transaction
was completed on June 30, 2007.
IMPACTS ON THE FRESENIUS GROUP’S
CONSOLIDATED FINANCIAL STATEMENTS
RESULTING FROM ACQUISITIONS
In the fiscal year 2008, all acquisitions have been accounted
for applying the purchase method and accordingly have been
consolidated starting with the date of acquisition. Except for
the acquisition of APP, each single acquisition is not material.
The excess of the total acquisition costs over the fair value
of the net assets acquired was € 3,659 million and € 585 mil-
lion in 2008 and 2007, respectively.
The purchase price allocations are not yet finalized for all
acquisitions. Based on preliminary purchase price allocations,
the recognized goodwill was € 3,121 million and the other
intangible assets were € 538 million. Of this goodwill, € 65 mil-
lion is attributable to the acquisitions of Fresenius Medical
Care, € 3,014 million to Fresenius Kabi’s acquisitions, € 32 mil-
lion to the acquisitions of Fresenius Helios, mainly resulting
from the purchase of additional shares of HELIOS Kliniken
GmbH and € 10 million to Fresenius Vamed’s acquisitions.
The acquisitions completed in 2008 or included in the con-
solidated statements for the first time for a full year, contrib-
uted the following amounts to the development of sales and
earnings:
The acquisitions increased the total assets of the Fresenius
Group by € 4,073 million.

133
Not
es
Management Report Report Supervisory Board Management Board Supervisory BoardConsolidated Financial Statements
Consolidated statement of incomeConsolidated balance sheetConsolidated cash flow statement
Consolidated statement of shareholders’ equitySegment ReportingNotes
Glossary
Auditor’s Report
2008 2007
Production and service 95,610 86,898
Administration 13,858 12,965
Sales and marketing 7,931 7,429
Research and development 1,269 970
Total employees (per capita) 118,668 108,262
in million € 2008 2007
Wages and salaries 3,508 3,252
Social security contributions, cost of retirementpensions and social assistance 824 800
thereof retirement pensions 99 103
Personnel expenses 4,332 4,052
in million € 2008 2007
Costs of raw materials, supplies and purchased components 3,668 3,266
Cost of purchased services 536 503
Cost of materials 4,204 3,769
in million € 2008 2007
Costs of services 5,771 5,489
Manufacturing cost of products and related goods 2,353 1,965
Cost of long-term production contracts 284 226
Other cost of sales – –
Cost of sales 8,408 7,680
Notes on the consolidated statement of income
3. SPECIAL ITEMS RELATING TO ACQUISITIONS
The consolidated statement of income for the year 2008
includes special items relating to the acquisition of APP.
The table below reconciles adjusted EBIT and adjusted net
income to earnings according to US GAAP.
Acquired in-process R & D activities have to be fully depre-
ciated at the closing under US GAAP accounting principles
valid at balance sheet date.
The inventory step-up reflects the excess of fair value
over book value of acquired semi-finished and finished
products. The amount is realized in line with the sale of the
respective products.
4. SALES
Sales by activity were as follows:
in million € 2008 2007
Sales of services 7,614 7,293
Sales of products and related goods 4,380 3,786
Sales from long-term production contracts 341 278
Other sales 1 1
Sales 12,336 11,358
A sales analysis by business segment and region is shown in
the segment information on pages 114 to 117.
5. COST OF SALES
Cost of sales comprised the following:
6. COST OF MATERIALS
Cost of materials comprised cost of raw materials, supplies
and purchased components and of purchased services as
follows:
7. PERSONNEL EXPENSES
Cost of sales, selling, general and administrative expenses
and expenses on research and development included per-
sonnel expenses of € 4,332 million and € 4,052 million in
2008 and 2007, respectively.
Personnel expenses comprised the following:
in million € EBIT
Otherfinancial
resultNet
income
Earnings, adjusted 1,727 450
Purchase accounting adjustments
In-process R & D -272 -272
Inventory step-up -35 -22
Foreign exchange gain 57 41
Other financial result
MEB(mark-to-market) 28 20
CVR (mark-to-market) 75 75
One-time financing expenses -35 -22
Earnings according to US GAAP 1,477 68 270
The Fresenius Group’s annual average number of employees
by function is shown below:
Notes134
Notes
in million € 2008 2007
Germany 463 264
International 651 977
Total 1,114 1,241
8. SELLING, GENERAL AND ADMINISTRATIVE
EXPENSES
Selling expenses were € 513 million (2007: € 467 million) and
mainly included expenditures for sales personnel of € 250
million (2007: € 223 million).
General and administrative expenses amounted to € 1,459
million (2007: € 1,418 million) and are related to expendi-
tures for administrative functions not attributable to research
and development, production or selling.
9. NET INTEREST
The net interest expenses of € 431 million included interest
expenses of € 456 million and interest income of € 25 million.
Interest expenses resulted from the Fresenius Group’s finan-
cial liabilities (see Note 30, Financial instruments).
10. OTHER FINANCIAL RESULT
The item other financial result includes the following special
charges and revenues with regard to the acquisition of APP
and its financing:
The registered and tradable Contingent Value Rights (CVR)
awarded to the APP shareholders are traded at the NASDAQ
Stock Exchange in the United States. The corresponding
liability is therefore valued with the current stock exchange
price at the reporting date. This valuation resulted in a reve-
nue of € 75 million as of December 31, 2008.
Due to its contractual definition, the issued Mandatory
Exchangeable Bonds (MEB) include derivative financial instru-
ments that have to be measured at fair value. This measure-
ment resulted in a revenue of € 28 million as of December 31,
2008. However, this measurement does not cause a change
of the MEB’s nominal amount of € 554.4 million that has to be
settled in ordinary shares of Fresenius Medical Care AG &Co.
KGaA (FMC-AG &Co.KGaA) upon maturity, but mainly reflects
the share price development of these shares (see Note 23,
Mandatory Exchangeable Bonds).
Furthermore, in the year 2008, the Fresenius Group
incurred one-time financing expenses in an amount of € 35
million relating to the APP acquisition.
in million €Currenttaxes
Deferredtaxes
Incometaxes
2007
Germany 112 6 118
International 324 6 330
Total 436 12 448
2008
Germany 69 61 130
International 258 52 310
Total 327 113 440
Income tax expenses (benefits) for 2008 and 2007 consisted
of the following:
In 2007, Fresenius SE was subject to German federal corpo-
ration income tax at a base rate of 25% plus a solidarity sur-
charge of 5.5% on federal corporation taxes payable.
The German Business Tax Reform Act (Unternehmensteu-
erreformgesetz 2008) was enacted in the third quarter of
2007 resulting in a reduction of the corporate income tax rate
from 25% to 15% (plus a solidarity surcharge of 5.5% on
federal corporation taxes) for German companies. This reduc-
tion together with technical changes to trade tax rules has
reduced Fresenius Group’s German entities’ combined corpo-
rate income tax rate effective as of January 1, 2008. Deferred
tax assets and liabilities for German entities expected to be
realized in 2008 and beyond were revalued in 2007 to reflect
the changes in the enacted tax rate. The revaluation of deferred
tax assets and liabilities resulted in deferred tax expenses
of € 5 million which have been included in operations for the
year 2007.
A reconciliation between the expected and actual income
tax expense is shown below. The expected corporate income
tax expense is computed by applying the German corporation
tax rate (including the solidarity surcharge) and the effective
11. TAXES
INCOME TAXES
Earnings before income taxes and minority interest was
attributable to the following geographic regions:

135
Not
es
Management Report Report Supervisory Board Management Board Supervisory BoardConsolidated Financial Statements
Consolidated statement of incomeConsolidated balance sheetConsolidated cash flow statement
Consolidated statement of shareholders’ equitySegment ReportingNotes
Glossary
Auditor’s Report
in million € 2008 2007
Computed “expected” income tax expense 323 472
Increase (reduction) in income taxes resulting from:
Items not recognized for tax purposes 88 10
Foreign tax rate differential 27 -35
Tax-free income - 29 -41
Taxes for prior years 33 36
Changes in valuation allowances on deferred tax assets 19 4
Change of German tax rate 0 5
Other - 21 -3
Income tax 440 448
Effective tax rate 39.5% 36.1%
DEFERRED TAXES
The tax effects of the temporary differences that gave rise
to deferred tax assets and liabilities at December 31 are pre-
sented below:
in million € 2008 2007
Deferred tax assets
Accounts receivable 33 35
Inventories 52 47
Other current assets 19 23
Other non-current assets 46 52
Accrued expenses 218 213
Other short-term liabilities 76 35
Other liabilities 27 11
Benefit obligations 36 28
Losses carried forward from prior years 138 108
Deferred tax assets, before valuation
allowance 645 552
less valuation allowance 87 68
Deferred tax assets 558 484
Deferred tax liabilities
Accounts receivable 9 11
Inventories 7 8
Other current assets 66 28
Other non-current assets 439 321
Accrued expenses 68 29
Other short-term liabilities 7 2
Other liabilities 16 6
Deferred tax liabilities 612 405
Accumulated deferred taxes - 54 79
In the balance sheet, the accumulated amounts of deferred
tax assets and liabilities are included as follows:
As of December 31, 2008, Fresenius Medical Care has not
recognized a deferred tax liability on approximately € 1.1
billion of undistributed earnings of its foreign subsidiaries,
because those earnings are intended to be indefinitely rein-
vested.
NET OPERATING LOSSES
The expiration of net operating losses is as follows:
for the fiscal years in million €
2009 19
2010 4
2011 12
2012 15
2013 19
2014 7
2015 9
2016 11
2017 8
2018 63
Thereafter 16
Total 183
The total remaining operating losses of € 363 million can
mainly be carried forward for an unlimited period.
In assessing the realizability of deferred tax assets, the
Management considers whether it is more likely than not
that some portion or all of the deferred tax assets will be real-
ized. The ultimate realization of deferred tax assets is depen-
dent upon the generation of future taxable income during the
periods in which those temporary differences become deduct-
ible. The Management considers the scheduled reversal of
deferred tax liabilities and projected future taxable income in
making this assessment. Based upon the level of historical
taxable income and projections for future taxable income over
the periods in which the deferred tax assets are deductible,
2008 2007
in million €thereof
long-termthereof
long-term
Deferred tax assets 465 156 417 132
Deferred tax liabilities 519 449 338 312
Accumulated
deferred taxes - 54 - 293 79 -180
trade tax rate on income before income taxes and minority
interest. The respective combined tax rates were 29.00% for
the fiscal year 2008 and 38.05% for the fiscal year 2007.
Notes136
Notes
tax audit in the United States for the years 2002 through 2004
has been completed and the IRS has issued its report. The
audit report includes disallowance of a material amount of
deductions taken during the audit period for interest expense
related to intercompany mandatorily redeemable preferred
securities. Fresenius Medical Care has filed a protest over the
disallowed deductions and will avail itself of all remedies.
An adverse determination with respect to any of the disputed
disallowances could have a material adverse effect on Fresenius
Group’s cash flows, tax expenses, net income and earnings
per share. Fiscal years 2005 and 2006 are currently under
audit, 2007 and 2008 are open to audit. There are a number of
state audits in progress and various years are open to audit in
other states. All expected results have been recognized in the
consolidated financial statements.
Subsidiaries of Fresenius SE in a number of countries out-
side of Germany and the United States are also subject to
tax audits. The Fresenius Group estimates that the tax effects
of such audits are not material to the consolidated financial
statements.
Upon adoption of FIN 48 in 2007, the Fresenius Group
had € 250 million of unrecognized tax benefits including the
amounts relating to the tax audit items for Germany and the
United States noted before.
The following table shows the changes to unrecognized
tax benefits during the year 2008:
Included in the balance at December 31, 2008 are € 323
million of unrecognized tax benefits, which would affect the
effective tax rate if recognized. The Fresenius Group is cur-
rently not in a position to forecast the timing and magnitude
of changes in the unrecognized tax benefits.
the Management of Fresenius Group believes it is more likely
than not that the Fresenius Group will realize the benefits
of these deductible differences, net of the existing valuation
allowances at December 31, 2008.
UNRECOGNIZED TAX BENEFITS
Fresenius SE and its subsidiaries are subject to tax audits on
a regular basis.
In Germany, the tax audit for the years 1998 until 2001 has
been finalized, except for Fresenius Helios. With respect to
Fresenius Helios, the tax audit for the fiscal year 2001 has not
been finalized yet. All results of the completed tax audits are
already sufficiently recognized in the financial statements as
of December 31, 2007. The fiscal years 2002 to 2005 are cur-
rently under audit. All further fiscal years are open to tax
audits. Fresenius Medical Care filed a lawsuit against the deci-
sion of the tax authority regarding the disallowance of certain
deductions taken for fiscal year 1997 and has included the
related unrecognized tax benefit in the total unrecognized tax
benefit noted on the following page. An adverse determina-
tion in this litigation could have a material adverse effect on
Fresenius Medical Care’s results of operations and liquidity
in the relevant reporting period.
In the United States, Fresenius Medical Care filed claims
for refunds contesting the Internal Revenue Service’s (IRS)
disallowance of FMCH’s deductions of civil settlement pay-
ments in prior year tax returns. As a result of a settlement
agreement with the IRS to resolve the appeal of the IRS’s dis-
allowance of deductions for the civil settlement payments
made to qui tam relators in connection with the resolution of
the 2000 investigation, Fresenius Medical Care received a
refund in September 2008 of US$ 37 million, inclusive of inter-
est. The settlement agreement preserves the right to con-
tinue to pursue claims in the US Federal courts for refund of all
other disallowed deductions. The unrecognized tax benefit
relating to these deductions is included in the total unrecog-
nized tax benefit noted on the following page. The Federal
in million € 2008
Balance at January 1, 2008 269
Increase in unrecognized tax benefits prior periods 32
Decrease in unrecognized tax benefits prior periods -25
Increase in unrecognized tax benefits current periods 20
Changes related to settlements with tax authorities -1
Foreign currency translation 28
Balance at December 31, 2008 323

137
Not
es
Management Report Report Supervisory Board Management Board Supervisory BoardConsolidated Financial Statements
Consolidated statement of incomeConsolidated balance sheetConsolidated cash flow statement
Consolidated statement of shareholders’ equitySegment ReportingNotes
Glossary
Auditor’s Report
It is Fresenius Group’s policy to recognize interest and pen-
alties related to its tax positions as income tax expense.
During the fiscal year 2008, the Fresenius Group recognized
€ 12 million in interest and penalties. Fresenius Group had
€ 73 million for the payment of interest and penalties accrued
at December 31, 2008.
12. EARNINGS PER SHARE
The following table shows the earnings per ordinary and pref-
erence share including and excluding the dilutive effect from
stock options issued and the MEB.
2008 2007
Numerators in million €
Net income 270 410
less preferenceon preference shares 1 1
less effect from dilution due toFresenius Medical Care sharesand MEB 17 1
Income available toall classes of shares 252 408
Denominators in number of shares
Weighted-average number ofordinary shares outstanding 78,855,197 77,394,080
Weighted-average number ofpreference shares outstanding 78,855,197 77,394,080
Weighted-average number ofshares outstanding of all classes 157,710,394 154,788,160
Potentially dilutiveordinary shares 592,526 792,851
Potentially dilutivepreference shares 592,526 792,851
Weighted-average numberof ordinary shares outstandingassuming dilution 79,447,723 78,186,931
Weighted-average numberof preference shares outstandingassuming dilution 79,447,723 78,186,931
Weighted-average number ofshares outstanding of all classesassuming dilution 158,895,446 156,373,862
Basic earnings per
ordinary share in € 1.71 2.64
Preference per preference share in € 0.01 0.01
Basic earnings per
preference share in € 1.72 2.65
Fully diluted earnings
per ordinary share in € 1.58 2.61
Preference per preference share in € 0.01 0.01
Fully diluted earnings
per preference share in € 1.59 2.62
The owners of preference shares are entitled to a preference
of € 0.01 per bearer preference share per fiscal year.

Notes138
Notes
Notes on the consolidated balance sheet
13. CASH AND CASH EQUIVALENTS
As of December 31, cash and cash equivalents were as
follows:
in million € 2008 2007
Cash 361 349
Securities (with a maturity of up to 90 days) 9 12
Total cash and cash equivalents 370 361
As of December 31, 2008 and December 31, 2007, commit-
ted funds of € 78 million and € 65 million, respectively, were
included in cash and cash equivalents.
in million € 2008 2007
Trade accounts receivable 2,734 2,382
less allowance for doubtful accounts 257 223
Trade accounts receivable, net 2,477 2,159
14. TRADE ACCOUNTS RECEIVABLE
As of December 31, trade accounts receivable were as
follows:
in million € 2008 2007
Allowance for doubtful accounts at the
beginning of the year 223 218
Change in valuation allowances as recorded in the consolidated statement of income 159 152
Write-offs and recoveries of amounts previously written-off -129 -132
Foreign currency translation 4 -15
Allowance for doubtful accounts at the end
of the year 257 223
The following table shows the ageing analysis of trade accounts receivable and
their allowance for doubtful accounts:
in million €not
overdue
up to 3monthsoverdue
3 to 6monthsoverdue
6 to 12monthsoverdue
more than12 months
overdue Total
Trade accounts receivable 1,566 459 233 188 288 2,734
less allowance for doubtful accounts 8 28 31 42 148 257
Trade accounts receivable, net 1,558 431 202 146 140 2,477
in million € 2008 2007
Raw materials and purchased components 289 209
Work in process 180 129
Finished goods 713 579
less reserves 55 42
Inventories, net 1,127 875
15. INVENTORIES
As of December 31, inventories consisted of the following:
The companies of the Fresenius Group are obliged to purchase
approximately € 1,940 million of raw materials and purchased
components under fixed terms, of which € 344 million was
committed at December 31, 2008 for 2009. The terms of these
agreements run one to ten years. Advance payments from
customers of € 83 million (2007: € 6 million) have been offset
against inventories.
Inventories as of December 31, 2008 and December 31,
2007 included approximately € 25 million and approximately
€ 21 million, respectively, of the product Erythropoietin (EPO),
All trade accounts receivable are due within one year.
The following table shows the development of the allow-
ance for doubtful accounts during the fiscal year:

139
Not
es
Management Report Report Supervisory Board Management Board Supervisory BoardConsolidated Financial Statements
Consolidated statement of incomeConsolidated balance sheetConsolidated cash flow statement
Consolidated statement of shareholders’ equitySegment ReportingNotes
Glossary
Auditor’s Report
which is supplied by a single source supplier in the United
States. Delays, stoppages, or interruptions in the supply of
EPO could adversely affect the operating results of Fresenius
Medical Care. In October 2006, Fresenius Medical Care
entered into a five-year exclusive sourcing and supply agree-
ment with its EPO supplier. Revenues from EPO accounted
for approximately 7% and 8% of total sales of the Fresenius
Group in 2008 and 2007, respectively.
2008 2007
in million €thereof
short-termthereof
short-term
Tax receivables 170 164 116 113
Accounts receivable resulting from German “Krankenhausfinanzierungsgesetz” 128 101 150 120
Capitalized debt financing costs 116 7 49 2
Investments and long-term loans 98 3 52 0
Derivative financial instruments 87 74 18 17
Prepaid expenses 39 13 77 16
Advances made 32 32 20 20
Re-insurance claims 27 0 29 0
Accounts receivable from management contracts in clinics 10 10 10 10
Other assets 508 378 383 312
Prepaid expenses and other assets, gross 1,215 782 904 610
less allowances 9 9 11 7
Prepaid expenses and other assets, net 1,206 773 893 603
The receivables resulting from the German “Krankenhaus-
finanzierungsgesetz” primarily contain approved but not yet
received earmarked subsidies of the Fresenius Helios opera-
tions. The approval is evidenced in a letter written by the
granting authorities that Fresenius Helios has already received.
Depreciations on other non-current assets in an amount of
€ 2 million and € 5 million were recognized in the fiscal years
2008 and 2007, respectively. In 2008 as well as in 2007, there
were no reclassifications to other non-current assets.
16. PREPAID EXPENSES AND OTHER CURRENT AND NON-CURRENT ASSETS
As of December 31, prepaid expenses and other current and non-current assets comprised the following:
17. PROPERTY, PLANT AND EQUIPMENT
As of December 31, the acquisition and manufacturing costs as well as accumulated depreciation
of property, plant and equipment consisted of the following:
Acquisition and manufacturing costs
in million €
As ofJanuary 1,
2008
Foreigncurrency
translation
Changes inentities
consolidated AdditionsReclassifi-
cations Disposals
As ofDecember 31,
2008
Land and land facilities 168 0 26 6 0 1 199
Buildings and improvements 2,108 19 60 201 51 15 2,424
Machinery and equipment 2,598 -19 129 321 95 101 3,023
Machinery, equipment and rentalequipment under capital leases 137 1 0 4 0 4 138
Construction in progress 300 -2 22 217 -189 2 346
Property, plant and equipment 5,311 -1 237 749 -43 123 6,130

Notes140
Notes
Depreciation
in million €
As ofJanuary 1,
2008
Foreigncurrency
translation
Changes inentities
consolidated AdditionsReclassifi-
cations Disposals
As ofDecember 31,
2008
Land and land facilities 2 0 0 0 0 0 2
Buildings and improvements 752 11 9 136 0 10 898
Machinery and equipment 1,526 -11 44 276 -2 89 1,744
Machinery, equipment and rentalequipment under capital leases 59 0 0 9 0 3 65
Construction in progress 1 0 0 0 0 0 1
Property, plant and equipment 2,340 0 53 421 -2 102 2,710
Acquisition and manufacturing costs
in million €
As ofJanuary 1,
2007
Foreigncurrency
translation
Changes inentities
consolidated AdditionsReclassifi-
cations Disposals
As ofDecember 31,
2007
Land and land facilities 171 -1 0 9 -9 2 168
Buildings and improvements 1,837 -81 60 170 195 73 2,108
Machinery and equipment 2,405 -94 50 297 118 178 2,598
Machinery, equipment and rentalequipment under capital leases 135 0 0 6 1 5 137
Construction in progress 412 -13 3 217 -314 5 300
Property, plant and equipment 4,960 -189 113 699 -9 263 5,311
Depreciation
in million €
As ofJanuary 1,
2007
Foreigncurrency
translation
Changes inentities
consolidated AdditionsReclassifi-
cations Disposals
As ofDecember 31,
2007
Land and land facilities 0 0 0 2 0 0 2
Buildings and improvements 709 -34 1 130 0 54 752
Machinery and equipment 1,483 -47 11 242 0 163 1,526
Machinery, equipment and rentalequipment under capital leases 55 1 0 8 0 5 59
Construction in progress 1 0 0 0 0 0 1
Property, plant and equipment 2,248 -80 12 382 0 222 2,340
Carrying amounts
in million €December 31,
2008December 31,
2007
Land and land facilities 197 166
Buildings and improvements 1,526 1,356
Machinery and equipment 1,279 1,072
Machinery, equipment and rental equipment under capital leases 73 78
Construction in progress 345 299
Property, plant and equipment 3,420 2,971
Depreciation on property, plant and equipment for the years
2008 and 2007 was € 421 million and € 382 million, respec-
tively. They are allocated within cost of sales, selling, general
and administrative expenses and research and development
expenses, depending upon the area in which the asset is used.
LEASING
Machinery and equipment as of December 31, 2008 and 2007
included peritoneal dialysis cycler machines which Fresenius
Medical Care leases to customers with end-stage renal dis-
ease on a month-to-month basis and hemodialysis machines
which Fresenius Medical Care leases to physicians under
operating leases in an amount of € 215 million and € 187 mil-
lion, respectively.
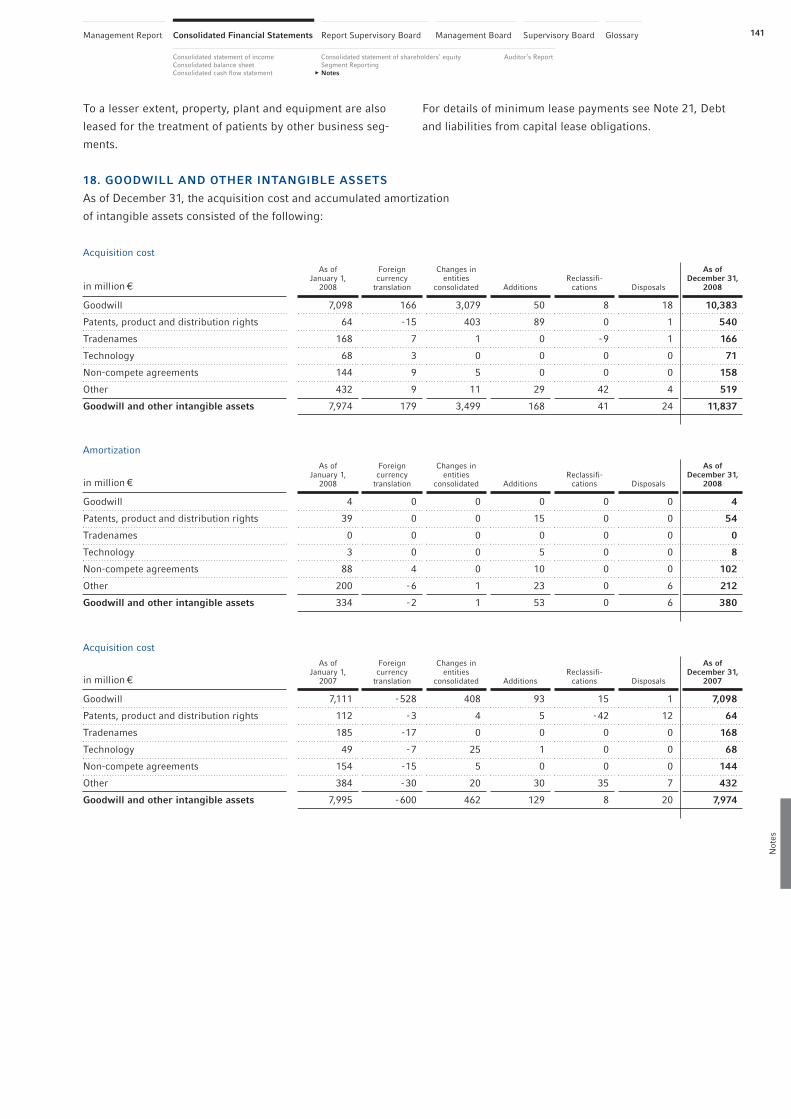
141
Not
es
Management Report Report Supervisory Board Management Board Supervisory BoardConsolidated Financial Statements
Consolidated statement of incomeConsolidated balance sheetConsolidated cash flow statement
Consolidated statement of shareholders’ equitySegment ReportingNotes
Glossary
Auditor’s Report
Acquisition cost
in million €
As ofJanuary 1,
2008
Foreigncurrency
translation
Changes inentities
consolidated AdditionsReclassifi-
cations Disposals
As ofDecember 31,
2008
Goodwill 7,098 166 3,079 50 8 18 10,383
Patents, product and distribution rights 64 -15 403 89 0 1 540
Tradenames 168 7 1 0 -9 1 166
Technology 68 3 0 0 0 0 71
Non-compete agreements 144 9 5 0 0 0 158
Other 432 9 11 29 42 4 519
Goodwill and other intangible assets 7,974 179 3,499 168 41 24 11,837
Amortization
in million €
As ofJanuary 1,
2008
Foreigncurrency
translation
Changes inentities
consolidated AdditionsReclassifi-
cations Disposals
As ofDecember 31,
2008
Goodwill 4 0 0 0 0 0 4
Patents, product and distribution rights 39 0 0 15 0 0 54
Tradenames 0 0 0 0 0 0 0
Technology 3 0 0 5 0 0 8
Non-compete agreements 88 4 0 10 0 0 102
Other 200 -6 1 23 0 6 212
Goodwill and other intangible assets 334 -2 1 53 0 6 380
18. GOODWILL AND OTHER INTANGIBLE ASSETS
As of December 31, the acquisition cost and accumulated amortization
of intangible assets consisted of the following:
To a lesser extent, property, plant and equipment are also
leased for the treatment of patients by other business seg-
ments.
Acquisition cost
in million €
As ofJanuary 1,
2007
Foreigncurrency
translation
Changes inentities
consolidated AdditionsReclassifi-
cations Disposals
As ofDecember 31,
2007
Goodwill 7,111 -528 408 93 15 1 7,098
Patents, product and distribution rights 112 -3 4 5 -42 12 64
Tradenames 185 -17 0 0 0 0 168
Technology 49 -7 25 1 0 0 68
Non-compete agreements 154 -15 5 0 0 0 144
Other 384 -30 20 30 35 7 432
Goodwill and other intangible assets 7,995 -600 462 129 8 20 7,974
For details of minimum lease payments see Note 21, Debt
and liabilities from capital lease obligations.
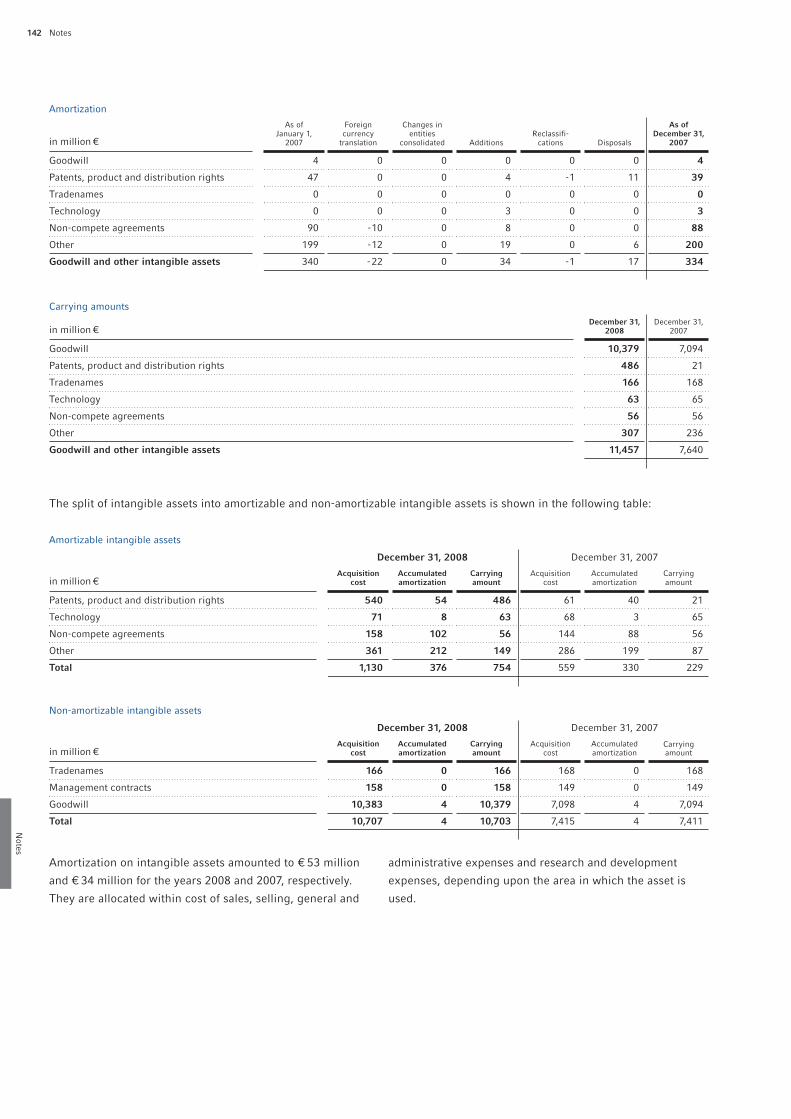
Notes142
Notes
The split of intangible assets into amortizable and non-amortizable intangible assets is shown in the following table:
Amortization
in million €
As ofJanuary 1,
2007
Foreigncurrency
translation
Changes inentities
consolidated AdditionsReclassifi-
cations Disposals
As ofDecember 31,
2007
Goodwill 4 0 0 0 0 0 4
Patents, product and distribution rights 47 0 0 4 -1 11 39
Tradenames 0 0 0 0 0 0 0
Technology 0 0 0 3 0 0 3
Non-compete agreements 90 -10 0 8 0 0 88
Other 199 -12 0 19 0 6 200
Goodwill and other intangible assets 340 -22 0 34 -1 17 334
Carrying amounts
in million €December 31,
2008December 31,
2007
Goodwill 10,379 7,094
Patents, product and distribution rights 486 21
Tradenames 166 168
Technology 63 65
Non-compete agreements 56 56
Other 307 236
Goodwill and other intangible assets 11,457 7,640
Non-amortizable intangible assets
December 31, 2008 December 31, 2007
in million €Acquisition
costAccumulatedamortization
Carryingamount
Acquisitioncost
Accumulatedamortization
Carryingamount
Tradenames 166 0 166 168 0 168
Management contracts 158 0 158 149 0 149
Goodwill 10,383 4 10,379 7,098 4 7,094
Total 10,707 4 10,703 7,415 4 7,411
administrative expenses and research and development
expenses, depending upon the area in which the asset is
used.
Amortization on intangible assets amounted to € 53 million
and € 34 million for the years 2008 and 2007, respectively.
They are allocated within cost of sales, selling, general and
Amortizable intangible assets
December 31, 2008 December 31, 2007
in million €Acquisition
costAccumulatedamortization
Carryingamount
Acquisitioncost
Accumulatedamortization
Carryingamount
Patents, product and distribution rights 540 54 486 61 40 21
Technology 71 8 63 68 3 65
Non-compete agreements 158 102 56 144 88 56
Other 361 212 149 286 199 87
Total 1,130 376 754 559 330 229

143
Not
es
Management Report Report Supervisory Board Management Board Supervisory BoardConsolidated Financial Statements
Consolidated statement of incomeConsolidated balance sheetConsolidated cash flow statement
Consolidated statement of shareholders’ equitySegment ReportingNotes
Glossary
Auditor’s Report
in million € 2009 2010 2011 2012 2013
Estimated amortization expenses 72 69 65 61 58
The carrying amount of goodwill has developed as follows:
in million €
Carrying amount as of January 1, 2008 7,094
Additions 3,129
Disposals -18
Reclassifications 8
Foreign currency translation 166
Carrying amount as of December 31, 2008 10,379
The increase of the carrying amount mainly results from the
addition of the goodwill from the acquisition of APP.
LICENSE AND DISTRIBUTION AGREEMENTS
In July 2008, Fresenius Medical Care entered into two separate
licence and distribution agreements, one for the US (with
Galenica Ltd. and Luitpold Pharmaceuticals Inc., the US Agree-
ment) and one for certain countries in Europe and the Middle
East (with Galenica AG and Vifor International AG, the Inter-
national Agreement), to market and distribute Galenica Ltd.’s
and Luitpold Pharmaceuticals, Inc.’s intravenous iron prod-
ucts, such as Venofer® and Ferinject® for dialysis treatment.
In North America, the license agreement among Fresenius
Medical Care’s subsidiary, FUSA Manufacturing Inc. (FMI),
Luitpold Pharmaceuticals Inc., American Regent, Inc. and Vifor
(International), Inc. provides FMI with exclusive rights to
manufacture and distribute Venofer® to freestanding (non-
hospital based) US dialysis facilities. In addition, it grants FMI
similar rights for Injectafer® (ferric carboxymaltose), a pro-
posed new intravenous iron medication currently under clinical
study in the US. The US license agreement has a term of ten
years, includes FMI extension options, and requires payment
by FMI over the ten year term of approximately US$ 2 billion,
which Fresenius Medical Care will expense as incurred (based
upon the annual estimated units of sale of the licensed prod-
uct), subject to certain early termination provisions.
In addition to these payments, Fresenius Medical Care will
pay a total of approximately US$ 47 million over a four year
period for the US Agreement of which US$ 22 million (€15
million) was paid in 2008. Fresenius Medical Care recorded a
liability of US$ 23 million (€ 17 million) for the balance. The
cost of the US Agreement and related transaction costs of
US$ 6 million will be amortized over their 10-year expected
useful life (based upon the annual estimated units of sale of
the licensed product). Fresenius Medical Care paid US$ 15
million (€ 10 million) upon signing of the International Agree-
ment in 2008 and could pay up to € 40 million more upon
certain milestones being met. The International Agreement
costs will be amortized over their expected 20-year useful life.
Milestone payments will be capitalized and amortized over
their useful lives at the time the milestone payments are made.
Estimated regular amortization expenses of intangible assets for the next five years are shown in the following table:
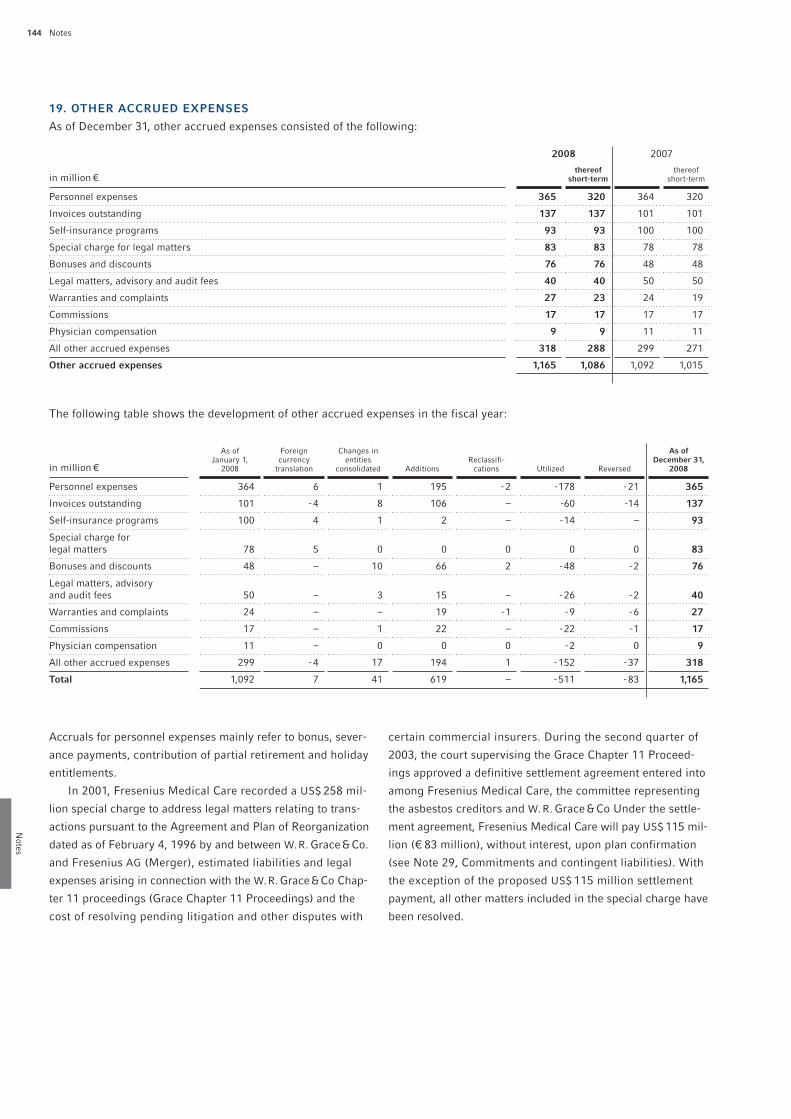
Notes144
Notes
19. OTHER ACCRUED EXPENSES
As of December 31, other accrued expenses consisted of the following:
2008 2007
in million €thereof
short-termthereof
short-term
Personnel expenses 365 320 364 320
Invoices outstanding 137 137 101 101
Self-insurance programs 93 93 100 100
Special charge for legal matters 83 83 78 78
Bonuses and discounts 76 76 48 48
Legal matters, advisory and audit fees 40 40 50 50
Warranties and complaints 27 23 24 19
Commissions 17 17 17 17
Physician compensation 9 9 11 11
All other accrued expenses 318 288 299 271
Other accrued expenses 1,165 1,086 1,092 1,015
The following table shows the development of other accrued expenses in the fiscal year:
in million €
As ofJanuary 1,
2008
Foreigncurrency
translation
Changes inentities
consolidated AdditionsReclassifi-
cations Utilized Reversed
As ofDecember 31,
2008
Personnel expenses 364 6 1 195 -2 -178 -21 365
Invoices outstanding 101 -4 8 106 – -60 -14 137
Self-insurance programs 100 4 1 2 – -14 – 93
Special charge forlegal matters 78 5 0 0 0 0 0 83
Bonuses and discounts 48 – 10 66 2 -48 -2 76
Legal matters, advisoryand audit fees 50 – 3 15 – -26 -2 40
Warranties and complaints 24 – – 19 -1 -9 -6 27
Commissions 17 – 1 22 – -22 -1 17
Physician compensation 11 – 0 0 0 -2 0 9
All other accrued expenses 299 -4 17 194 1 -152 -37 318
Total 1,092 7 41 619 – -511 -83 1,165
Accruals for personnel expenses mainly refer to bonus, sever-
ance payments, contribution of partial retirement and holiday
entitlements.
In 2001, Fresenius Medical Care recorded a US$ 258 mil-
lion special charge to address legal matters relating to trans-
actions pursuant to the Agreement and Plan of Reorganization
dated as of February 4, 1996 by and between W.R. Grace&Co.
and Fresenius AG (Merger), estimated liabilities and legal
expenses arising in connection with the W.R. Grace&Co Chap-
ter 11 proceedings (Grace Chapter 11 Proceedings) and the
cost of resolving pending litigation and other disputes with
certain commercial insurers. During the second quarter of
2003, the court supervising the Grace Chapter 11 Proceed-
ings approved a definitive settlement agreement entered into
among Fresenius Medical Care, the committee representing
the asbestos creditors and W.R. Grace&Co Under the settle-
ment agreement, Fresenius Medical Care will pay US$ 115 mil-
lion (€ 83 million), without interest, upon plan confirmation
(see Note 29, Commitments and contingent liabilities). With
the exception of the proposed US$ 115 million settlement
payment, all other matters included in the special charge have
been resolved.

145
Not
es
Management Report Report Supervisory Board Management Board Supervisory BoardConsolidated Financial Statements
Consolidated statement of incomeConsolidated balance sheetConsolidated cash flow statement
Consolidated statement of shareholders’ equitySegment ReportingNotes
Glossary
Auditor’s Report
2008 2007
in million €thereof
short-termthereof
short-term
Derivative financial instruments 239 100 34 10
Accounts payable resulting from German “Krankenhausfinanzierungsgesetz” 187 174 187 172
Interest liabilities 98 98 75 75
Tax liabilities 96 93 99 96
Accounts receivable credit balance 95 23 83 24
Personnel liabilities 73 70 66 64
Advance payments from customers 69 32 82 57
All other liabilities 582 453 505 384
Other liabilities 1,439 1,043 1,131 882
The payables resulting from the German “Krankenhausfi-
nanzierungsgesetz” primarily contain earmarked subsidies
received but not yet spent appropriately by Fresenius Helios.
The amount not yet spent appropriately is classified as liability.
Of the total amount of other non-current liabilities € 396
million at December 31, 2008, € 315 million were due between
one and five years and € 81 million were due later than five
years. The balance sheet line item long-term accrued expenses
and other long-term liabilities of € 475 million also included
long-term accrued expenses of € 79 million as of December 31,
2008.
21. DEBT AND LIABILITIES FROM CAPITAL LEASE
OBLIGATIONS
SHORT-TERM DEBT
Borrowings
Short-term borrowings of € 729 million and € 362 million at
December 31, 2008, and 2007, respectively, consisted of € 342
million borrowed by certain subsidiaries of the Fresenius
Group under lines of credit with commercial banks and € 387
million outstanding short-term borrowings under the accounts
receivable facility described on the next page. The average
interest rates on these borrowings (excluding the accounts re-
ceivable facility) at December 31, 2008 and 2007 were 5.17%
and 5.15%, respectively.
The rise of short-term borrowings mainly refers to the
increase of Fresenius Medical Care’s short-term borrowings
under its accounts receivable facility. Fresenius Medical Care
used the proceeds, together with borrowings under its other
existing long-term credit facilities, to redeem its trust pre-
ferred securities that became due on February 1, 2008.
Accounts receivable facility
Fresenius Medical Care has an asset securitization facility
(accounts receivable facility), which is typically renewed in
October of each year and was renewed most recently in Octo-
ber 2008. Under the accounts receivable facility, certain
receivables are sold to NMC Funding Corp. (NMC Funding),
a wholly-owned subsidiary of Fresenius Medical Care. NMC
Funding then assigns percentage ownership interests in the
accounts receivable to certain bank investors. Under the terms
of the accounts receivable facility, NMC Funding retains the
right to recall all transferred interests in the accounts receiv-
able assigned to the banks under the facility. As Fresenius
Medical Care has the right at any time to recall the then out-
standing interests, the receivables remain on the consoli-
dated balance sheet and the proceeds from the transfer of
percentage ownership interests are recorded as short-term
borrowings.
At December 31, 2008, there were outstanding short-term
borrowings under the accounts receivable facility of US$ 539
million (€ 387 million). NMC Funding pays interest to the bank
investors, calculated based on the commercial paper rates
for the particular tranches selected. The average interest rate
at December 31, 2008 was 3.89%. Annual refinancing fees,
which include legal costs and bank fees (if any), are amortized
over the term of the facility.
20. OTHER LIABILITIES
As of December 31, other liabilities consisted of the following:

Notes146
Notes
LONG-TERM DEBT AND LIABILITIES FROM CAPITAL LEASE OBLIGATIONS
As of December 31, long-term debt and liabilities from capital lease obligations consisted of the following:
in million € 2008 2007
Fresenius Medical Care 2006 Senior Credit Agreement 2,419 2,151
2008 Senior Credit Agreement 1,896 0
Bridge Credit Agreement 467 0
Euro Notes 800 440
European Investment Bank Agreements 309 169
Capital lease obligations 42 42
Other 214 200
Subtotal 6,147 3,002
less current portion 431 115
Long-term debt and liabilities from capital lease obligations, less current portion 5,716 2,887
Maturities of long-term debt and liabilities from capital lease obligations are shown in the following table:
in million €up to 1 year
1 to 5 years
more than 5 years
Fresenius Medical Care 2006 Senior Credit Agreement 96 2,323 0
2008 Senior Credit Agreement 67 816 1,013
Bridge Credit Agreement 0 0 467
Euro Notes 200 300 300
European Investment Bank Agreements 8 163 138
Capital lease obligations 8 24 10
Other 52 104 58
Long-term debt and liabilities from capital lease obligations 431 3,730 1,986
Aggregate annual repayments applicable to the above listed
long-term debt and liabilities from capital lease obligations for
the five years subsequent to December 31, 2008 are:
for the fiscal years in million €
2009 431
2010 269
2011 1,299
2012 1,378
2013 784
Subsequent years 1,986
Total 6,147

147
Not
es
Management Report Report Supervisory Board Management Board Supervisory BoardConsolidated Financial Statements
Consolidated statement of incomeConsolidated balance sheetConsolidated cash flow statement
Consolidated statement of shareholders’ equitySegment ReportingNotes
Glossary
Auditor’s Report
Fresenius Medical Care 2006 Senior Credit Agreement
Fresenius Medical Care entered into a US$ 4.6 billion syndi-
cated credit agreement (Fresenius Medical Care 2006 Senior
Credit Agreement) with Bank of America, N.A. (BofA); Deut-
sche Bank AG New York Branch; The Bank of Nova Scotia;
Credit Suisse, Cayman Islands Branch; JP Morgan Chase Bank,
National Association; and certain other lenders (collectively
the Lenders) on March 31, 2006 which replaced a prior credit
agreement.
The following table shows the available and outstanding
amounts under the Fresenius Medical Care 2006 Senior Credit
Agreement at December 31:
Maximum amountavailable
Balanceoutstanding
in million US$ 2008 2007 2008 2007
Revolving Credit 1,000 1,000 305 38
Term Loan A 1,491 1,550 1,491 1,550
Term Loan B 1,570 1,578 1,570 1,578
Total 4,061 4,128 3,366 3,166
through December 31, 2010. The remaining amount out-
standing is due on March 31, 2011. As a result of the
voluntary repayment made in July 2007 from the proceeds
of the issuance of Senior Notes (see Note 22, Senior
Notes), which reduced the principal balance outstanding,
the quarterly payments were reduced to US$ 29 million
beginning with the payment for September 30, 2008.
� A 7-year term loan facility (Term Loan B) of US$ 1,750 mil-
lion scheduled to mature on March 31, 2013. The terms
of the Fresenius Medical Care 2006 Senior Credit Agree-
ment require 28 quarterly payments on Term Loan B
that permanently reduce the term loan facility. The repay-
ment began June 30, 2006. The first 24 quarterly pay-
ments are US$ 4.4 million and payments 25 through 28 are
US$ 411 million with the final payment of the remaining
balance due on March 31, 2013, subject to an early repay-
ment requirement on March 1, 2011 if the Trust Preferred
Securities due June 15, 2011 are not repaid or refinanced
or their maturity is not extended prior to that date. As a
result of the voluntary repayment made in July 2007 from
the proceeds of the issuance of senior notes (see note 22,
Senior Notes) the balance of the remaining payments of
US$ 4.4 million were reduced to US$ 4.0 million beginning
with the September 30, 2008 payment and payments 25
through 28 were reduced to US$ 379 million.
Interest on these facilities will be, at Fresenius Medical Care’s
option, depending on the interest periods chosen, at a rate
equal to either LIBOR plus an applicable margin or the higher
of (a) BofA’s prime rate or (b) the Federal Funds rate plus
0.5%, plus an applicable margin.
The applicable margin is variable and depends on Fresenius
Medical Care’s consolidated leverage ratio which is a ratio
of its consolidated funded debt (less up to US$ 30 million cash
and cash equivalents) to consolidated EBITDA (as these terms
are defined in the Fresenius Medical Care 2006 Senior Credit
Agreement).
For a large portion of the floating rate borrowings
under the Fresenius Medical Care 2006 Senior Credit Agree-
ment, interest rate hedges have been arranged (see Note 30,
Financial instruments).
In addition, at December 31, 2008, US$ 112 million and at
December 31, 2007, US$ 87 million were utilized as letters
of credit which are not included as part of the balances out-
standing at those dates.
The Fresenius Medical Care 2006 Senior Credit Agree-
ment consists of:
� A 5-year US$ 1 billion revolving credit facility (of which
up to US$ 250 million is available for letters of credit, up
to US$ 300 million is available for borrowings in certain
non-US currencies, up to US$ 150 million is available as
swing line loans in US dollars, up to US$ 250 million is
available as a competitive loan facility and up to US$ 50
million is available as swing line loans in certain non-US
currencies, the total of which cannot exceed US$ 1 billion
which will be due and payable on March 31, 2011.
� A 5-year term loan facility (Term Loan A) of US$ 1,850
million, also scheduled to mature on March 31, 2011.
The Fresenius Medical Care 2006 Senior Credit Agree-
ment requires 19 quarterly payments on Term Loan A
of US$ 30 million each that permanently reduce the term
loan facility which began June 30, 2006 and continue

Notes148
Notes
deemed the amount in default immaterial, it took no action to
amend the Fresenius Medical Care 2006 Senior Credit Agree-
ment to replace the defaulting bank. Fresenius Medical Care
believes it has enough availability under this agreement and
other credit facilities to meet its immediate needs.
In July 2007, Fresenius Medical Care voluntarily repaid
portions of the term loans outstanding utilizing a portion of
the proceeds from the issuance of Senior Notes (see Note
22, Senior Notes). Under the terms of the Fresenius Medical
Care 2006 Senior Credit Agreement, advance payments on
the term loans are applied first against the next four quarterly
payments due with any amounts in excess of the four quar-
terly payments applied on a pro-rata basis against any remain-
ing payments. As a result of the advance payments on the
Term Loans, no payments were made or were due for either
Term Loan A or B until the third quarter of 2008.
In June 2007, the Fresenius Medical Care 2006 Senior
Credit Agreement was amended in order to enable Fresenius
Medical Care to issue US$ 500 million in Senior Notes (see
Note 22, Senior Notes). Furthermore, on January 31, 2008,
it was amended to increase certain types of permitted borrow-
ings and to remove all limitations on capital expenditures.
2008 Senior Credit Agreement
In connection with the acquisition of APP, the Fresenius Group
entered into a US$ 2.45 billion syndicated credit agreement
(2008 Senior Credit Agreement) on August 20, 2008.
The 2008 Senior Credit Agreement consists of:
� five-year Term Loan A Facilities (Term Loan A) in the
aggregate principal amount of US$ 1 billion (of which
US$ 500 million is available to Fresenius US Finance I,
Inc., a wholly-owned subsidiary of Fresenius SE, and
US$ 500 million is available to APP Pharmaceuticals, LLC).
Term Loan A amortizes and is repayable in 10 unequal
semi-annual installments commencing on June 10, 2009
with a final maturity date on September 10, 2013;
In addition to scheduled principal payments, indebtedness
outstanding under the Fresenius Medical Care 2006 Senior
Credit Agreement will be reduced by mandatory prepayments
utilizing portions of the net cash proceeds from certain sales
of assets, securitization transactions other than Fresenius
Medical Care’s existing accounts receivable facility, the issu-
ance of subordinated debt other than certain intercompany
transactions, certain issuances of equity and excess cash flow.
The obligations under the Fresenius Medical Care 2006
Senior Credit Agreement are secured by pledges of capital
stock of certain material subsidiaries in favor of the lenders.
The Fresenius Medical Care 2006 Senior Credit Agreement
contains affirmative and negative covenants with respect to
Fresenius Medical Care and its subsidiaries and other payment
restrictions. Certain of the covenants limit indebtedness of
Fresenius Medical Care and investments by Fresenius Medical
Care, and require Fresenius Medical Care to maintain certain
financial ratios defined in the agreement. Additionally, the
Fresenius Medical Care 2006 Senior Credit Agreement pro-
vides for a limitation on dividends and other restricted pay-
ments which is US$ 280 million for dividends paid in 2009, and
increases in subsequent years. Fresenius Medical Care paid
dividends of US$ 252 million (€ 160 million) in May of 2008
which was in compliance with the restrictions set forth in the
Fresenius Medical Care 2006 Senior Credit Agreement. In
default, the outstanding balance under the Fresenius Medical
Care 2006 Senior Credit Agreement becomes immediately
due and payable at the option of the Lenders. As of December
31, 2008, Fresenius Medical Care was in compliance with
all covenants under the Fresenius Medical Care 2006 Senior
Credit Agreement.
Fresenius Medical Care incurred fees of approximately
US$ 86 million in conjunction with the Fresenius Medical Care
2006 Senior Credit Agreement which are being amortized over
the life of this agreement.
During the fourth quarter of 2008, one of the participating
banks defaulted on its obligation to provide funds under the
terms of the revolving facility of the Fresenius Medical Care
2006 Senior Credit Agreement. As Fresenius Medical Care
149
Not
es
Management Report Report Supervisory Board Management Board Supervisory BoardConsolidated Financial Statements
Consolidated statement of incomeConsolidated balance sheetConsolidated cash flow statement
Consolidated statement of shareholders’ equitySegment ReportingNotes
Glossary
Auditor’s Report
� six-year Term Loan B Facilities (Term Loan B) in the aggre-
gate principal amount of US$ 1 billion (of which US$ 502.5
million is available to Fresenius US Finance I, Inc. and
US$ 497.5 million is available to APP Pharmaceuticals, LLC).
Term Loan B amortizes and is repayable in 11 substan-
tially equal semi-annual installments commencing on June
10, 2009 with a final bullet payment equal to 94.25% of
such loans on September 10, 2014; and
� five-year Revolving Credit Facilities in the aggregate prin-
cipal amount of US$ 450 million (of which US$ 150 mil-
lion is available to APP Pharmaceuticals, LLC and US$ 300
million is available as multicurrency facility to Fresenius
Finance I S.A., a wholly-owned subsidiary of Fresenius SE).
The interest rate on each borrowing under the 2008 Senior
Credit Agreement is a rate per annum equal to the aggregate
of (a) the applicable margin (as described below) and (b)
LIBOR or, in relation to any loan in euro, EURIBOR for the rel-
evant interest period, subject, in the case of Term Loan B,
to a minimum LIBOR or EURIBOR of 3.25%. The applicable
margin for Term Loan A and the Revolving Credit Facilities
is variable and depends on the Leverage Ratio as defined in
the 2008 Senior Credit Agreement.
To hedge part of the interest rate risk connected with the
floating rate borrowings under the 2008 Senior Credit Agree-
ment, the Fresenius Group entered into interest rate hedges
(see Note 30, Financial instruments).
In addition to scheduled principal payments, indebtedness
outstanding under the 2008 Senior Credit Agreement will
be reduced by mandatory prepayments in some events. This
means especially portions of the net cash proceeds from
certain sales of assets, incurrence of additional indebtedness,
equity issuances and certain intercompany loan repayments.
The 2008 Senior Credit Agreement is guaranteed by
Fresenius SE, Fresenius ProServe GmbH and Fresenius Kabi
AG. The obligations of APP Pharmaceuticals, LLC under the
2008 Senior Credit Agreement that refinance outstanding
indebtedness under the former APP credit facility are secured
by the assets of APP and its subsidiaries and guaranteed by
APP’s subsidiaries on the same basis as the former APP
credit facility. All lenders also benefit from indirect security
through pledges over the shares of certain subsidiaries of
Fresenius Kabi AG and pledges over certain intercompany
loans.
The 2008 Senior Credit Agreement contains a number of
customary affirmative and negative covenants and other pay-
ment restrictions. These covenants include, among others,
limitations on liens, sale of assets, incurrence of debt, invest-
ments and acquisitions and restrictions on the payment of
dividends. The 2008 Senior Credit Agreement also includes
financial covenants – as defined in the agreement – that re-
quire Fresenius SE and its subsidiaries (other than Fresenius
Medical Care and its subsidiaries) to maintain a maximum
leverage ratio, a minimum fixed charge coverage ratio, a
minimum interest coverage ratio and limits amounts spent on
capital expenditure. As of December 31, 2008, Fresenius SE
was in compliance with all covenants under the 2008 Senior
Credit Agreement.
In October 2008, the 2008 Senior Credit Agreement was
amended to increase Term Loan B available to Fresenius US
Finance I, Inc. by US$ 210.5 million and € 200 million (US$ 273
million). The proceeds were used for the repayment of the
bridge credit agreement described in the following. In Novem-
ber 2008, Fresenius SE agreed with the lenders upon an
increase of the revolving credit facility available to Fresenius
Finance I S.A. by US$ 100 million.
Notes150
Notes
The following table shows the available and outstanding amounts
under the 2008 Senior Credit Agreement at December 31, 2008:
Bridge Credit Agreement
On August 20, 2008, the Fresenius Group entered into a
Bridge Credit Agreement of US$ 1.3 billion to fund part of the
purchase price of APP. The facility was available to Fresenius
US Finance II, Inc., a wholly-owned subsidiary of Fresenius
SE, and was fully drawn down on September 10, 2008. Under
certain conditions, the availability of the facility extended to
September 10, 2015. In October 2008, the Bridge Credit Agree-
ment was reduced to US$ 650 million using proceeds of the
increase of Term Loan B under the 2008 Senior Credit Agree-
ment and funds obtained under other existing credit facilities.
The Bridge Credit Agreement was guaranteed on a senior
basis by Fresenius SE, Fresenius Kabi AG and Fresenius
ProServe GmbH and contained covenants substantially iden-
tical to those contained in the 2008 Senior Credit Agree-
ment. Interest on the initial loans was variable and based on
LIBOR plus applicable margin.
On January 21, 2009, the residual amount of the Bridge
Credit Agreement was redeemed using the proceeds of new
Senior Notes (see Note 36, Subsequent events).
Maximum amount available Balance outstanding
in million € in million €
Revolving Credit Facilities US$ 550 million 395 US$ 150 million 108
Term Loan A US$ 1,000 million 718 US$ 1,000 million 718
Term Loan B (in US$) US$ 1,211 million 870 US$ 1,211 million 870
Term Loan B (in €) € 200 million 200 € 200 million 200
Total 2,183 1,896
Euro Notes
As of December 31, 2008, Euro Notes (Schuldscheindarlehen) of the Fresenius Group consisted of the following:
Maturity Interest rateBook valuein million €
Fresenius Finance B.V. 2007/2012 July 2, 2012 5.51% 26
Fresenius Finance B.V. 2007/2012 July 2, 2012 variable 74
Fresenius Finance B.V. 2007/2014 July 2, 2014 5.75% 38
Fresenius Finance B.V. 2007/2014 July 2, 2014 variable 62
Fresenius Finance B.V. 2008/2012 April 2, 2012 5.59% 62
Fresenius Finance B.V. 2008/2012 April 2, 2012 variable 138
Fresenius Finance B.V. 2008/2014 April 2, 2014 5.98% 112
Fresenius Finance B.V. 2008/2014 April 2, 2014 variable 88
FMC Finance S.à.r.l. Luxembourg IV 2005/2009 July 27, 2009 4.57% 126
FMC Finance S.à.r.l. Luxembourg IV 2005/2009 July 27, 2009 variable 74
Euro Notes 800
The nominal amount of the Euro Notes equals the book value.
151
Not
es
Management Report Report Supervisory Board Management Board Supervisory BoardConsolidated Financial Statements
Consolidated statement of incomeConsolidated balance sheetConsolidated cash flow statement
Consolidated statement of shareholders’ equitySegment ReportingNotes
Glossary
Auditor’s Report
In April 2008, Fresenius Finance B.V., a wholly-owned sub-
sidiary of Fresenius SE, issued Euro Notes in an amount of
€ 400 million in four tranches with four and six year terms.
The proceeds from the issuance of the Euro Notes were mainly
utilized to finance acquisitions as well as for the repayment
of short-term debt and to redeem Euro Notes of € 40 million
that were due in May 2008.
In July 2007, Fresenius Finance B.V. issued Euro Notes of
€ 200 million.
The Euro Notes of Fresenius Finance B.V. are guaranteed
by Fresenius SE. The Euro Notes of FMC Finance S.à.r.l.
Luxembourg IV are guaranteed by FMC-AG & Co. KGaA.
The Euro Notes issued by FMC Finance S.à.r.l. Luxembourg
IV are shown as current portion of long-term debt and liabili-
ties from capital lease obligations in the balance sheet.
Interest of the floating-rate tranches of the Euro Notes is
based on EURIBOR plus applicable margin. For a large por-
tion of these tranches interest rate swaps have been arranged
(see Note 30, Financial instruments). Only the floating-rate
tranche of the Euro Notes of FMC Finance S.à.r.l. Luxembourg
IV in an amount of € 74 million is exposed to the risk of inter-
est rate increases.
Maximum amountavailable in million € Maturity
Book valuein million €
Fresenius SE 96 2013 96
FMC-AG & Co. KGaA 221 2013/2014 125
HELIOS Kliniken GmbH 88 2019 88
Loans from EIB 405 309
The EIB is the not-for-profit long-term lending institution of
the European Union and loans funds at favorable rates for
the purpose of capital investment and research and develop-
ment projects. The facilities were granted to refinance certain
research and development projects, to invest in expansion
and the optimization of existing production facilities in Ger-
many and for the construction of a hospital.
Repayment of the loan of HELIOS Kliniken GmbH already
started in December 2007 and will continue through Decem-
ber 2019 with constant half-yearly payments.
Some advances under these agreements can be denomi-
nated in certain foreign currencies including US dollar. Accord-
ingly, the liabilities of FMC-AG & Co. KGaA comprise loans of
US$ 49 million and € 90 million. FMC-AG & Co. KGaA borrowed
this € 90 million loan under a credit agreement with the EIB
which was entered into in December 2006. This facility was
fully drawn down on February 1, 2008. The loan matures on
February 1, 2014.
The above mentioned loans bear variable interest rates
that change quarterly. As of December 31, 2008, the US dol-
lar borrowings of FMC-AG & Co. KGaA and the euro borrow-
ings of FMC-AG & Co. KGaA bore an interest rate of 2.026%
and 4.767%, respectively. The borrowings of Fresenius SE
and HELIOS Kliniken GmbH had an interest rate of 3.349%.
To some extent, the borrowers may opt to convert those inter-
est rates into fixed rates. The loans under these EIB Agree-
ments are secured by bank guarantees and have customary
covenants.
European Investment Bank Agreements
Various subsidiaries of the Fresenius Group maintain credit facilities with the European Investment Bank (EIB).
The following table shows the outstanding amounts under the EIB facilities as of December 31, 2008:

Notes152
Notes
Capital lease obligations
Details of capital lease obligations are given below:
CREDIT LINES
In addition to the financial liabilities described before, the
Fresenius Group maintains additional credit facilities which
have not been utilized, or have only been utilized in part as
of reporting date. As of December 31, 2008, the additional
financial cushion resulting from unutilized credit facilities was
approximately € 1.1 billion.
Syndicated credit facilities accounted for € 706 million.
This portion comprises the Fresenius Medical Care 2006 Senior
Credit Agreement in the amount of US$ 583 million (€ 419
million) and the 2008 Senior Credit Agreement in the amount
of US$ 400 million (€ 287 million). Furthermore, bilateral
facilities of approximately € 400 million were available. They
include the already described credit facilities with the EIB
and credit facilities which subsidiaries of the Fresenius
Group have arranged with commercial banks. These credit
facilities are used for general corporate purposes and are
usually unsecured.
In addition, Fresenius SE has a commercial paper program
under which up to € 250 million in short-term notes can be
issued. As of December 31, 2008, no commercial papers were
outstanding.
Additional financing of up to US$ 550 million can be pro-
vided using the Fresenius Medical Care accounts receiv-
able facility which had been utilized by US$ 539 million as of
December 31, 2008.
in million € 2008
Capital lease obligations (minimum lease payments) 48
due within one year 10
due between one and five years 27
due later than five years 11
Interest component included in future minimum lease payments 6
due within one year 2
due between one and five years 3
due later than five years 1
Present value of capital lease obligations (minimum lease payments) 42
due within one year 8
due between one and five years 24
due later than five years 10
Notional amount Maturity Interest rateBook valuein million €
Fresenius Finance B.V. 2003/2009 € 100 million April 30, 2009 7.50% 100
Fresenius Finance B.V. 2006/2013 € 500 million Jan 31, 2013 5.00% 500
Fresenius Finance B.V. 2006/2016 € 500 million Jan 31, 2016 5.50% 500
FMC Finance III S.A. 2007/2017 US$ 500 million July 15, 2017 67/8% 354
Senior Notes 1,454
22. SENIOR NOTES
As of December 31, 2008, Senior Notes of the Fresenius Group consisted of the following:
The Senior Notes issued by Fresenius Finance B.V. which
mature on April 30, 2009 are shown as current portion of
Senior Notes in the balance sheet. The Senior Notes of
Fresenius Finance B.V. maturing in 2016 may be redeemed
at the option of the issuer from January 31, 2011 onwards.
The respective redemption prices have already been fixed at
the date of issuance in the indentures.
All Senior Notes of Fresenius Finance B.V. are guaranteed
by Fresenius SE, Fresenius Kabi AG and Fresenius ProServe
GmbH. Fresenius SE has agreed to a number of covenants to

153
Not
es
Management Report Report Supervisory Board Management Board Supervisory BoardConsolidated Financial Statements
Consolidated statement of incomeConsolidated balance sheetConsolidated cash flow statement
Consolidated statement of shareholders’ equitySegment ReportingNotes
Glossary
Auditor’s Report
provide protection to the bondholders, which, under certain
circumstances, partly restrict the scope of action of Fresenius
SE and its subsidiaries (excluding FMC-AG & Co. KGaA and its
subsidiaries). These covenants include, amongst other things,
restrictions on further debt that can be raised, the payment
of dividends, the volume of capital expenditure, the redemp-
tion of subordinated liabilities and the mortgaging or sale
of assets. Some of these restrictions are lifted automatically
when the rating of Fresenius SE reaches investment grade.
In the event of non-compliance with the terms of the Senior
Notes, the bond-holders (owning in aggregate more than
25% of the outstanding Senior Notes) are entitled to call the
Senior Notes and demand immediate repayments plus inter-
est. As of December 31, 2008, the Fresenius Group was in
compliance with all of its covenants.
In July 2007, FMC Finance III S.A., a wholly-owned sub-
sidiary of FMC-AG & Co. KGaA, issued US$ 500 million aggre-
gate principal amount of 67/8% Senior Notes due 2017 at a
discount resulting in an effective interest rate of 71/8%. The
Senior Notes are guaranteed on a senior basis jointly and
severally by FMC-AG & Co. KGaA and by its subsidiaries FMCH
and Fresenius Medical Care Deutschland GmbH (FMC D-
GmbH). Fresenius Medical Care may redeem the Senior Notes
at any time at 100% of principal amount plus accrued inter-
est and a premium calculated pursuant to the terms of the
indenture. The holders have a right to request that Fresenius
Medical Care repurchases the Senior Notes at 101% of prin-
cipal amount plus accrued interest upon the occurrence of
a change of control followed by a decline in the rating of the
Senior Notes.
23. MANDATORY EXCHANGEABLE BONDS
To finance the acquisition of APP, Mandatory Exchangeable
Bonds (MEB) in an aggregate nominal amount of € 554.4
million were launched. Fresenius Finance B.V. subscribed for
these MEB issued by Fresenius Finance (Jersey) Ltd. at
100% of their principal amount. Afterwards, the MEB were
on-lent to Fresenius SE who placed the MEB in the market.
The bonds carry a coupon of 55/8% per annum and will
mature on August 14, 2011. Upon maturity, the bonds will be
mandatorily exchangeable into ordinary shares of FMC-AG
& Co. KGaA with a maximum of 16.80 million and a minimum
of 14.24 million shares being deliverable, subject to anti-
dilution adjustments with respect to FMC-AG & Co. KGaA
(e.g. in case of corporate actions). The MEB are not redeem-
able in cash.
The initial minimum exchange price was set to € 33.00 and
the initial maximum exchange price was set to € 38.94
(i.e. 118% of the initial minimum exchange price). Pursuant
to the terms and conditions of the MEB, both the holder
and the issuer may procure for the exchange of the bonds
before maturity. In principal, the issuer, Fresenius Finance
(Jersey) Ltd., may procure the exchange of all of the outstand-
ing MEB for shares of FMC-AG & Co. KGaA at the maximum
exchange ratio calculated on the relevant exchange date plus
payment of any accrued and unpaid interest and a make-
whole amount. Furthermore, the MEB shall be mandatorily
exchangeable at the maximum exchange ratio plus such
payments if the corporate credit ratings of Fresenius SE fall
below certain benchmarks and such benchmarks are sub-
sequently not reinstated. Moreover, in the event of a change
of control of Fresenius SE or FMC-AG &Co. KGaA, each holder
of the MEB may elect to exchange its MEB at the maximum
exchange ratio plus such payments. Each holder of the MEB
may also exchange his MEB at the minimum exchange ratio
calculated on the relevant exchange date without payment of
accrued interest or any make-whole amount.
Fresenius SE guarantees in favor of Fresenius Finance
(Jersey) Ltd. the payment of certain interest payments by
Fresenius Finance B.V. Furthermore, it secures the delivery
of the underlying shares of FMC-AG & Co. KGaA for exchange
via a pledge agreement. In addition, Fresenius SE has under-
taken to the holders of the bonds that neither it nor any of its
material subsidiaries provides any security of its assets for
certain capital market indebtedness, without at the same time
having the holders share equally and rateably in such security.
The derivative financial instruments embedded in the MEB
are measured at fair value and are shown separately under
the balance sheet item prepaid expenses and other current
assets.

Notes154
Notes
In the case of Fresenius Group’s funded plans, the defined
benefit obligation is offset against the fair value of plan assets.
A pension liability is recognized in the balance sheet if the
defined benefit obligation exceeds the fair value of plan assets.
An asset is recognized and reported under other assets in
the balance sheet if the fair value of plan assets exceeds the
defined benefit obligation and if the Fresenius Group has a
right of reimbursement against the fund or a right to reduce
future payments to the fund.
Under defined contribution plans, the Fresenius Group
pays defined contributions during the employee’s service life
which satisfies all obligations of the Fresenius Group to the
employee. The Fresenius Group has a main defined contribu-
tion plan in North America.
DEFINED BENEFIT PENSION PLANS
At December 31, 2008, the benefit obligation (PBO) of the
Fresenius Group of € 505 million (2007: € 498 million) includ-
ed € 213 million (2007: € 219 million) funded by plan assets
and € 292 million (2007: € 279 million) covered by pension
provisions. The current portion of the pension liability in an
amount of € 10 million is recognized in the balance sheet as
short-term accrued expenses and other short-term liabilities.
The non-current portion of € 282 million is recorded as pen-
sion liability.
66% of the pension liabilities in an amount of € 292 mil-
lion relate to the “Versorgungsordnung der Fresenius-
Unternehmen” established in 1988 (Pension plan 1988),
which applies for most of the German entities of the Fresenius
Group except Fresenius Helios. The rest of the pension
liabilities relates to individual plans from Fresenius Helios
entities in Germany and non-German Group entities.
Plan benefits are generally based on an employee’s years
of service and final salary. Consistent with predominant prac-
tice in Germany, the benefit obligations of the German entities
of the Fresenius Group are unfunded. The German Pension
plan 1988 does not have a separate pension fund.
FMCH, a subsidiary of Fresenius Medical Care, has a
defined benefit pension plan for its employees in the United
States and supplemental executive retirement plans. Dur-
ing the first quarter of 2002, FMCH curtailed these pension
24. PENSIONS AND SIMILAR OBLIGATIONS
GENERAL
The Fresenius Group recognizes pension costs and related pen-
sion liabilities for current and future benefits to qualified cur-
rent and former employees of the Fresenius Group. Fresenius
Group’s pension plans are structured differently according
to the legal, economic and fiscal circumstances in each coun-
try. The Fresenius Group currently has two types of plans,
defined benefit and defined contribution plans. In general,
plan benefits in defined benefit plans are based on all or a por-
tion of the employees’ years of services and final salary. Plan
benefits in defined contribution plans are determined by the
amount of contribution by the employee and the employer,
both of which may be limited by legislation, and the returns
earned on the investment of those contributions.
Upon retirement under defined benefit plans, the Fresenius
Group is required to pay defined benefits to former employ-
ees when the defined benefits become due. Defined benefit
plans may be funded or unfunded. The Fresenius Group has
funded defined benefit plans in particular in the United States,
Norway, the United Kingdom, the Netherlands and Austria.
Unfunded defined benefit plans are located in Germany and
France.
Actuarial assumptions generally determine benefit obliga-
tions under defined benefit plans. The actuarial calculations
require the use of estimates. The main factors used in the actu-
arial calculations affecting the level of the benefit obligations
are: assumptions on life expectancy, the discount rate, salary
and pension level trends. Under Fresenius Group’s funded
plans, assets are set aside to meet future payment obligations.
An estimated return on the plan assets is recognized as income
in the respective period. Actuarial gains and losses are gen-
erated when there are variations in the actuarial assumptions
and differences between the actual and the estimated return
on plan assets for that year. A company’s pension liability is
impacted by these actuarial gains or losses.

155
Not
es
Management Report Report Supervisory Board Management Board Supervisory BoardConsolidated Financial Statements
Consolidated statement of incomeConsolidated balance sheetConsolidated cash flow statement
Consolidated statement of shareholders’ equitySegment ReportingNotes
Glossary
Auditor’s Report
plans. Under the curtailment amendment for substantially
all employees eligible to participate in the plan, benefits have
been frozen as of the curtailment date and no additional
defined benefits for future services will be earned. FMCH has
retained all employee benefit obligations as of the curtail-
ment date. Each year FMCH contributes at least the minimum
amount required by the Employee Retirement Income Secu-
rity Act of 1974, as amended. There was no minimum fund-
ing requirement for FMCH for the defined benefit plan in the
year 2008. FMCH voluntarily contributed US$ 0.7 million
(€ 0.5 million) during the year 2008. Expected funding for
2009 is US$ 0.8 million (€ 0.6 million).
The Fresenius Group’s benefit obligations relating to fully
or partly funded pension plans were € 242 million. Benefit
obligations relating to unfunded pension plans were € 263
million.
The following table shows the changes in benefit obliga-
tions, the changes in plan assets and the funded status of
the pension plans. Benefits paid as shown in the changes in
benefit obligations represent payments made from both the
funded and unfunded plans while the benefits paid as shown
in the changes in plan assets include only benefit payments
from Fresenius Group’s funded benefit plans.
The funded status has developed as follows:
in million € 2008 2007
Benefit obligations at the beginning
of the year 498 553
Changes in entities consolidated 0 1
Foreign currency translation 2 -21
Service cost 15 17
Prior service cost 2 2
Interest cost 28 27
Contributions by plan participants 1 1
Transfer of plan participants – –
Curtailments/settlements -1 -3
Actuarial losses/gains - 25 -60
Benefits paid -15 -19
Amendments – –
Benefit obligations at the end of the year 505 498
thereof vested 437 427
Fair value of plan assets at the beginning
of the year 226 235
Changes in entities consolidated 1 –
Foreign currency translation 1 -21
Actual return on plan assets -15 14
Contributions by the employer 6 8
Contributions by plan participants 1 1
Settlements -1 0
Transfers – –
Benefits paid - 6 -11
Fair value of plan assets at the end
of the year 213 226
Funded status as of December 31 292 272
As of December 31, 2007, the fair value of plan assets
relating to the North American pension plan exceeded the
corresponding benefit obligations. The resulting amount of
€ 7 million was recognized as an asset. For all the remaining
pension plans of the Fresenius Group, the benefit obliga-
tions exceeded the fair value of plan assets and resulted in a
total amount of € 279 million recognized as a pension liability.
The discount rates for all plans are based upon yields of
portfolios of equity and highly rated debt instruments with
maturities that mirror the plan’s benefit obligation. Fresenius
Group’s discount rate is the weighted average of these plans
based upon their benefit obligations.

Notes156
Notes
The following weighted average assumptions were utilized in
determining benefit obligations as of December 31:
in % 2008 2007
Discount rate 6.21 5.80
Rate of compensation increase 3.56 3.66
Rate of pension increase 1.94 1.80
in million € 2008 2007
Projected benefit obligation (PBO) 505 350
Accumulated benefit obligation (ABO) 444 283
Fair value of plan assets 213 71
At December 31, 2008, the accumulated benefit obligations for
all defined benefit pension plans were € 471 million (2007:
€ 430 million).
The following table relates to pension plans with projected
benefit obligations and accumulated benefit obligations in
excess of plan assets:
The pre-tax changes of other comprehensive income (loss) relating to pension liabilities during the years 2008 and 2007
are provided in the following tables:
in million €As of
January 1, 2008 Releases1) Additions
Foreign currency
translation
As ofDecember 31,
2008
Actuarial gains and losses -47 2 -6 -2 - 53
Prior service cost 7 1 -2 – 6
Transition obligation -1 – 0 – -1
Adjustments related to pension liabilities -41 3 -8 -2 - 48
1) effects recognized in the consolidated statement of income
in million €As of
January 1, 2007 Releases1) Additions
Foreign currency
translation
As ofDecember 31,
2007
Actuarial gains and losses -112 5 57 3 - 47
Prior service cost 6 1 – 0 7
Transition obligation -1 – – 0 -1
Adjustments related to pension liabilities -107 6 57 3 - 41
1) effects recognized in the consolidated statement of income
in million € 2009
Actuarial gains and losses 5
Prior service cost –
Transition obligation –
For the tax effects on other comprehensive income at Decem-
ber 31, 2008 see Note 28, Other comprehensive income (loss).
The Fresenius Group expects the following amounts to be
amortized from other comprehensive income into net periodic
pension cost in the year 2009:

157
Not
es
Management Report Report Supervisory Board Management Board Supervisory BoardConsolidated Financial Statements
Consolidated statement of incomeConsolidated balance sheetConsolidated cash flow statement
Consolidated statement of shareholders’ equitySegment ReportingNotes
Glossary
Auditor’s Report
Defined benefit pension plans’ net periodic benefit costs of
€ 28 million (2007: € 35 million) were comprised of the follow-
ing components for each of the years ended December 31:
in million € 2008 2007
Service cost 15 17
Interest cost 28 27
Expected return on plan assets -15 -16
Amortization of unrealized actuarial losses, net -1 5
Amortization of prior service costs 1 1
Amortization of transition obligations – –
Settlement loss – 1
Net periodic benefit cost 28 35
Net periodic benefit cost is allocated as personnel expense
within cost of sales or selling, general and administrative
expenses as well as research and development expenses. The
allocation depends upon the area in which the beneficiary
is employed.
The following weighted-average assumptions were used
in determining net periodic benefit cost for the year ended
December 31:
in % 2008 2007
Discount rate 5.80 5.02
Expected return of plan assets 7.06 7.03
Rate of compensation increase 3.66 3.75
Changes in the discount factor, inflation and mortality assump-
tions used for the actuarial computation resulted in actuarial
losses in 2008 which increased the fair value of the defined
benefit obligation. Unrecognized actuarial losses outside the
10% corridor for each defined benefit plan were € 53 mil-
lion (2007: € 47 million).
for the fiscal years in million €
2009 17
2010 18
2011 19
2012 21
2013 23
2014 bis 2018 139
Total expected benefit payments 237
The Fresenius Group uses December 31, 2008 as the mea-
surement date in determining the funded status of all plans.
Pension liabilities at December 31, related to the follow-
ing geographical regions:
in million € 2008 2007
Germany 238 244
Europe (excluding Germany) 31 34
North America 22 0
Asia-Pacific 0 –
Latin America 1 1
Africa 0 0
Total pension liabilities 292 279
Approximately two thirds of the beneficiaries are located in
North America, one quarter in Germany and the remainder
throughout the rest of Europe and other continents.
Plan investment policy and strategy
For the North American funded plan, the Fresenius Group
periodically reviews the assumptions for long-term expected
return on pension plan assets. As part of the assumptions
review, a range of reasonable expected investment returns
for the pension plan as a whole was determined based on
an analysis of expected future returns for each asset class
weighted by the allocation of the assets. The range of returns
developed relies both on forecasts, which include the actu-
arial firm’s expected long-term rates of return for each signifi-
cant asset class or economic indicator, and on broad-market
historical benchmarks for expected return, correlation, and
volatility for each asset class. As a result, the expected rate of
return on pension plan assets of the North American pension
plan was 7.5% for the year 2008.
The following table shows the expected benefit payments for
the next ten years:

Notes158
Notes
The overall expected long-term rate of return on assets of
the Fresenius Group amounts to 7.08% compounded annu-
ally. Contributions to plan assets for the fiscal year 2009 are
expected to amount to € 5 million.
DEFINED CONTRIBUTION PLANS
Fresenius Group’s total expense under defined contribution
plans for 2008 was € 22 million (2007: € 20 million). The
main part relates to the North American savings plan, which
employees of FMCH can join. Employees can deposit up to
75% of their pay up to an annual maximum of US$ 15,500 if
under 50 years old (US$ 20,500 if 50 or over) under this sav-
ings plan. Fresenius Medical Care will match 50% of the
employee deposit up to a maximum Company contribution
of 3% of the employee’s pay. Fresenius Medical Care’s total
expense under this defined contribution plan for the years
ended December 31, 2008 and 2007 was € 18 million and € 17
million, respectively.
The investment policy, utilizing a revised target investment
allocation of 31% equity and 69% long-term US bonds, con-
siders that there will be a time horizon for invested funds
of more than five years. The total portfolio will be measured
against a policy index that reflects the asset class bench-
marks and the target asset allocation. The plan policy does not
allow investments in securities of FMC-AG & Co. KGaA or other
related party securities. The performance benchmarks for
the separate asset classes include: S & P 500 Index, Russell
2000 Growth Index, MSCI EAFE Index, Barclays Capital Long
Term Government Credit Index and Barclays Capital US Strips
20+ Year Index.
The following schedule describes Fresenius Group’s
allocation for its funded plans.
in %Allocation
2008Allocation
2007Target
allocation
Equity securities 34.27 36.20 33.22
Debt securities 61.94 60.81 63.70
Real estate 1.63 0.41 1.75
Other 2.16 2.58 1.33
Total 100.00 100.00 100.00
25. TRUST PREFERRED SECURITIES
Fresenius Medical Care issued trust preferred securities
through Fresenius Medical Care Capital Trusts, statutory trusts
organized under the laws of the State of Delaware, United
States. FMC-AG & Co. KGaA owns all of the common securi-
ties of these trusts. The sole asset of each trust is a senior
subordinated note of FMC-AG & Co. KGaA or a wholly-owned
subsidiary of FMC-AG & Co. KGaA. FMC-AG & Co. KGaA,
FMC D-GmbH and FMCH have guaranteed payment and per-
formance of the senior subordinated notes to the respective
Fresenius Medical Care Capital Trusts. The trust preferred
securities are guaranteed by FMC-AG & Co. KGaA through a
series of undertakings by Fresenius Medical Care and FMCH
and FMC D-GmbH.
The trust preferred securities entitle the holders to distri-
butions at a fixed annual rate of the stated amount and are
mandatorily redeemable after ten years. Earlier redemption
at the option of the holders may also occur upon a change
of control followed by a rating decline or defined events of
default including a failure to pay interest. Upon liquidation
of the trusts, the holders of trust preferred securities are enti-
tled to a distribution equal to the stated amount. The trust
preferred securities do not hold voting rights in the trust except
under limited circumstances.
The indentures governing the notes held by the Fresenius
Medical Care Capital Trusts contain affirmative and nega-
tive covenants with respect to Fresenius Medical Care and its
subsidiaries and other payment restrictions. Some of the cov-
enants limit Fresenius Medical Care’s indebtedness and its
investments, and require Fresenius Medical Care to maintain
certain ratios defined in the agreement. As of December 31,
2008, Fresenius Medical Care was in compliance with all
financial covenants under all trust preferred securities agree-
ments.
159
Not
es
Management Report Report Supervisory Board Management Board Supervisory BoardConsolidated Financial Statements
Consolidated statement of incomeConsolidated balance sheetConsolidated cash flow statement
Consolidated statement of shareholders’ equitySegment ReportingNotes
Glossary
Auditor’s Report
The trust preferred securities outstanding as of December 31, 2008 and 2007 were as follows:
Year issued Stated amount Interest rateMandatory
redemption date2008
in million €2007
in million €
Fresenius Medical Care Capital Trust II 1998 US$ 450 million 77/8% Feb 1, 2008 0 301
Fresenius Medical Care Capital Trust III 1998 DM 300 million 73/8% Feb 1, 2008 0 154
Fresenius Medical Care Capital Trust IV 2001 US$ 225 million 77/8% Jun 15, 2011 156 149
Fresenius Medical Care Capital Trust V 2001 € 300 million 73/8% Jun 15, 2011 299 297
Trust preferred securities 455 901
The trust preferred securities of Fresenius Medical Care
Capital Trust II und III were due on February 1, 2008 and are
therefore classified as a short-term liability and shown as
current portion in an amount of € 455 million at December 31,
2007. Fresenius Medical Care used existing credit facilities
for the repayment on February 1, 2008.
26. MINORITY INTEREST
As of December 31, minority interest in the Group was as
follows:
in million € 2008 2007
Minority interest in FMC-AG &Co. KGaA 2,751 2,426
Minority interest in HELIOS Kliniken GmbH 4 8
Minority interest in VAMED AG 30 25
Minority interest in the business segments
Fresenius Medical Care 115 72
Fresenius Kabi 32 27
Fresenius Helios 99 85
Fresenius Vamed 2 1
Corporate/Other – –
Total minority interest 3,033 2,644
27. SHAREHOLDERS’ EQUITY
SUBSCRIBED CAPITAL
Development of subscribed capital
On August 15, 2008, Fresenius SE successfully closed a capital
increase to finance part of the acquisition of APP. In connec-
tion with the capital increase, 2,748,057 new ordinary shares
were issued at a price of € 52.00 and 2,748,057 new prefer-
ence shares were issued at a price of € 53.00. The transaction
has generated gross proceeds of approximately € 289 mil-
lion and increased the subscribed capital by € 5.5 million. The
new shares have full dividend entitlement for the fiscal year
2008.
During the fiscal year 2008, 482,850 stock options were
exercised.
Accordingly, at December 31, 2008, the subscribed capital
of Fresenius SE was divided into 80,571,867 bearer ordinary
shares and 80,571,867 non-voting bearer preference shares.
The shares are issued as non-par value shares. The propor-
tionate amount of the subscribed capital is € 1.00 per share.
Notification by shareholders
The contents of the notifications disclosed in accordance
with Section 26 (1) of the German Securities Trading Act
(WpHG) by the balance sheet date are set out below. These
reflect the most recent notifications made to Fresenius SE
about the level of investments held:
The Else Kröner-Fresenius-Stiftung notified Fresenius
SE on December 14, 2008, that it holds 46,871,154 ordinary
shares of Fresenius SE representing 58.17% of the voting
rights.
On May 28, 2008, FIL Limited, Hamilton, Bermuda,
crossed above the threshold of 5% of the voting rights in
Fresenius SE, Else-Kröner-Strasse 1, 61352 Bad Homburg
v.d.H., Germany. On that date, FIL Limited held 5.19% of
Minority interest increased in 2008 by € 389 million to € 3,033
million. The change resulted from the minorities’ share of
profit of € 404 million, dividend payments of € -142 million
and from negative currency effects as well as first-time con-
solidations in a total amount of € 127 million.

Notes160
Notes
the voting rights in Fresenius SE arising from 4,028,297 voting
rights. All voting rights in Fresenius SE were attributed to FIL
Limited pursuant to Section 22 (1) sentence 1 No. 6 WpHG.
Furthermore, Fidelity International, with its registered
office in Great Britain, Kingswood Fields, Millfield Lane, Lower
Kingswood, Tadworth, Surrey KT20 6RB, notified Fresenius
SE in the name of and on behalf of Fidelity Investment Trust,
Boston, Massachusetts, United States, pursuant to Section
21 (1) WpHG of the following: On January 22, 2008, Fidelity
Investment Trust exceeded the threshold of 3% of voting
rights in Fresenius SE, Else-Kröner-Strasse 1, 61352 Bad Hom-
burg v.d.H., Germany. On that date, Fidelity Investment
Trust held 3.02% of the voting rights in Fresenius SE arising
from 2,341,614 voting rights.
Artio Global Management LLC, with its registered office in
New York, United States, has notified Fresenius SE pursuant
to Section 21 (1) WpHG that on December 16, 2008 its voting
rights in Fresenius SE, Else-Kröner-Strasse 1, 61352 Bad
Homburg v.d.H., Germany, crossed below the threshold of
3% and amounted to 2.97% (equivalent to 2,396,313 vot-
ing rights) in relation to the total number of voting rights of
the issuer. The voting rights in the amount of 2.97% (equiv-
alent to 2,396,313 voting rights) are entirely attributable to
Artio Global Management LLC, pursuant to Section 22 (1) sen-
tence 1 No. 6 WpHG.
All notifications by shareholders in the fiscal year 2008 are
published on the website of the Company www.fresenius.com
under Investor Relations/The Fresenius Shares/Shareholder
Structure.
APPROVED CAPITAL
By resolution of the Annual General Meeting on May 10, 2006,
the previous Approved Capital II was revoked. The Manage-
ment Board of Fresenius SE was authorized, with the approval
of the Supervisory Board, until May 9, 2011,
� to increase Fresenius SE’s subscribed capital by a nomi-
nal total amount of up to € 12,800,000.00 through a single
or multiple issue of new bearer ordinary shares and/or
non-voting bearer preference shares against cash contri-
butions (Approved Capital I). A subscription right must
be granted to shareholders.
� to increase Fresenius SE’s subscribed capital by a nominal
total amount of up to € 6,400,000.00 through a single or
multiple issue of new bearer ordinary shares and/or non-
voting bearer preference shares against cash contributions
and/or contributions in kind (Approved Capital II). The
Management Board is authorized, with the consent of
the Supervisory Board, to decide on the exclusion of the
shareholders’ subscription right (§§ 203 (2), 186 (3) sen-
tence 4 of the German Stock Corporation Act (AktG)). As
of December 31, 2008, the Approved Capital II decreased
by € 5,496,114.00 to € 1.20 due to the capital increase
in connection with the acquisition of APP. In 2006, it was
already reduced by € 903,884.80 due to the payment
in shares in connection with the acquisition of HUMAINE
Kliniken GmbH.
CONDITIONAL CAPITAL
Corresponding to the stock option plans, the Conditional
Capital of Fresenius SE is divided into Conditional Capital I,
Conditional Capital II and Conditional Capital III which exist
to secure the subscription rights in connection with already
issued stock options on bearer ordinary shares and bearer
preference shares of the stock option plans of 1998, 2003 and
2008 (see Note 34, Stock options).
Due to the capital increase from the Company’s funds
enacted on December 4, 2006, the Conditional Capital
increased in the same proportion as the subscribed capital
by operation of law (cf. Section 218 sentence 1 of the Ger-
man Stock Corporation Act (AktG)). After the registration of
the share split in the commercial register on January 24,
2007, the Conditional Capital I amounted to € 1,971,966.00
(as of December 31, 2006: € 1,682,744.32), divided into
985,983 bearer ordinary and bearer preference shares,
and the Conditional Capital II amounted to € 5,104,962.00
(as of December 31, 2006: € 4,356,234.24), divided into
2,552,481 bearer ordinary and bearer preference shares.
On May 21, 2008, Fresenius SE’s Annual General Meeting
has resolved upon the Fresenius SE Stock Option Plan 2008
(2008 Plan) by authorizing the granting of subscription rights
to members of the Management Board and managerial
employees of Fresenius SE and affiliated companies. To fulfill
the subscription rights under the 2008 Plan, the subscribed
capital of Fresenius SE was increased conditionally by up to
€ 6.2 million through the issue of up to 3.1 million no par
value bearer ordinary shares and 3.1 million no par value
bearer preference shares (Conditional Capital III). The change
in Fresenius SE’s Articles of Association with regard to the
Conditional Capital III became effective after its registration
in the commercial register on July 11, 2008.

161
Not
es
Management Report Report Supervisory Board Management Board Supervisory BoardConsolidated Financial Statements
Consolidated statement of incomeConsolidated balance sheetConsolidated cash flow statement
Consolidated statement of shareholders’ equitySegment ReportingNotes
Glossary
Auditor’s Report
The following table shows the development of the Conditional Capital:
in € Ordinary shares Preference shares Total
Conditional Capital I Fresenius AG Stock Option Plan 1998 768,306.00 768,306.00 1,536,612.00
Conditional Capital II Fresenius AG Stock Option Plan 2003 2,364,711.00 2,364,711.00 4,729,422.00
Total Conditional Capital as of January 1, 2008 3,133,017.00 3,133,017.00 6,266,034.00
Fresenius AG Stock Option Plan 1998 – options exercised -85,839.00 -85,839.00 -171,678.00
Fresenius AG Stock Option Plan 2003 – options exercised -155,586.00 -155,586.00 -311,172.00
Conditional Capital III, approved on May 21, 2008 3,100,000.00 3,100,000.00 6,200,000.00
Total Conditional Capital as of December 31, 2008 5,991,592.00 5,991,592.00 11,983,184.00
CAPITAL RESERVES
Capital reserves comprise the premium paid on the issue of
shares and the exercise of stock options (additional paid-in
capital).
In the third quarter of 2008, the capital reserves increased
by € 284 million in connection with Fresenius SE’s capital
increase to finance part of the acquisition of APP. The accrued
expenses in an amount of € 6 million were charged against
the capital reserves.
OTHER RESERVES
Other reserves comprise earnings generated by Group
entities in prior years to the extent that they have not been
distributed.
DIVIDENDS
Under the German Stock Corporation Act (AktG), the amount
of dividends available for distribution to shareholders is based
upon the unconsolidated retained earnings of Fresenius SE
as reported in its balance sheet determined in accordance with
the German Commercial Code (HGB).
At the Annual General Meeting in May 2008, a resolution
was passed to pay a dividend of € 0.66 per bearer ordinary
share and € 0.67 per bearer preference share, i.e. a total divi-
dend of € 103 million was resolved and paid.
28. OTHER COMPREHENSIVE INCOME (LOSS)
Other comprehensive income (loss) comprises all amounts
recognized directly in equity (net of tax) resulting from the
currency translation of foreign subsidiaries’ financial state-
ments and the effects of measuring financial instruments at
their fair value as well as the change in benefit obligation.
Changes in the components of other comprehensive income
(loss) in 2008 and 2007 were as follows:
2008 2007
in million €Amount
before taxes Tax effectAmount
after taxesAmount
before taxes Tax effectAmount
after taxes
Changes in unrealized gains/losses onderivative financial instruments -147 52 - 95 -65 26 -39
Change in unrealized gains/losses -146 52 -94 -62 25 -37
Realized gains/losses due to reclassifications -1 – -1 -3 1 -2
Benefit obligation adjustment - 7 4 - 3 66 -19 47
Foreign currency translation adjustment 111 0 111 -120 0 -120
Other comprehensive income (loss) - 43 56 13 -119 7 -112

Notes162
Notes
Other notes
29. COMMITMENTS AND CONTINGENT
LIABILITIES
OPERATING LEASES AND RENTAL PAYMENTS
Fresenius Group’s subsidiaries lease office and manufac-
turing buildings as well as machinery and equipment under
various lease agreements expiring on dates through 2101.
Rental expense recorded for operating leases for the years
ended December 31, 2008 and 2007 was € 379 million and
€ 372 million, respectively.
Future minimum rental payments under non-cancellable
operating leases for the years subsequent to December 31,
2008 are:
As of December 31, 2008, future investment commitments
existed up to the year 2014 from the acquisition contracts for
hospitals at projected costs of up to € 173 million. Thereof
€ 39 million relate to the year 2009.
Besides the above mentioned contingent liabilities, the
amount of other commitments is immaterial.
LEGAL PROCEEDINGS
The Fresenius Group is routinely involved in numerous claims,
lawsuits, regulatory and tax audits, investigations and other
legal matters arising, for the most part, in the ordinary course
of its business of providing healthcare services and products.
The outcome of litigation and other legal matters is always
difficult to accurately predict and outcomes that are not
consistent with the Fresenius Group’s view of the merits can
occur. The Fresenius Group believes that it has valid defenses
to the legal matters pending against it and is defending itself
vigorously. Nevertheless, it is possible that resolution of one
or more of the legal matters currently pending or threatened
could have a material adverse effect on its business, results
of operations and financial condition.
Commercial litigation
Fresenius Medical Care was originally formed as a result of
a series of transactions pursuant to the Agreement and Plan of
Reorganization dated as of February 4, 1996 by and between
W.R. Grace&Co. and Fresenius SE (formerly: Fresenius AG)
(the Merger). At the time of the Merger, a W.R. Grace&Co.
subsidiary known as W.R. Grace&Co.-Conn. had, and con-
tinues to have, significant liabilities arising out of product-
liability related litigation (including asbestos-related actions),
pre-Merger tax claims and other claims unrelated to National
Medical Care, Inc. (NMC), which was W.R. Grace & Co.’s
dialysis business prior to the Merger. In connection with the
Merger, W.R. Grace &Co.-Conn. agreed to indemnify Fresenius
Medical Care, Fresenius Medical Care Holdings, Inc. (FMCH)
and NMC against all liabilities of W.R. Grace & Co., whether
relating to events occurring before or after the Merger, other
than liabilities arising from or relating to NMC’s operations.
W.R. Grace & Co. and certain of its subsidiaries filed for reor-
ganization under Chapter 11 of the U.S. Bankruptcy Code
(the Grace Chapter 11 Proceedings) on April 2, 2001.
Prior to and after the commencement of the Grace Chap-
ter 11 Proceedings, class action complaints were filed against
W.R. Grace & Co. and FMCH by plaintiffs claiming to be credi-
tors of W.R. Grace & Co.-Conn., and by the asbestos creditors’
committees on behalf of the W.R. Grace & Co. bankruptcy
estate in the Grace Chapter 11 Proceedings, alleging among
other things that the Merger was a fraudulent conveyance,
violated the uniform fraudulent transfer act and constituted a
conspiracy. All such cases have been stayed and transferred
to or are pending before the U.S. District Court as part of the
Grace Chapter 11 Proceedings.
In 2003, Fresenius Medical Care reached agreement
with the asbestos creditors’ committees on behalf of the
W.R. Grace & Co. bankruptcy estate and W.R. Grace & Co.
in the matters pending in the Grace Chapter 11 Proceedings
for the fiscal years in million €
2009 329
2010 284
2011 242
2012 195
2013 158
Thereafter 550
Total 1,758
163Management Report Report Supervisory Board Management Board Supervisory BoardConsolidated Financial Statements
Consolidated statement of incomeConsolidated balance sheetConsolidated cash flow statement
Consolidated statement of shareholders’ equitySegment ReportingNotes
Glossary
Not
es
Auditor’s Report
for the settlement of all fraudulent conveyance and tax claims
against it and other claims related to Fresenius Medical Care
that arise out of the bankruptcy of W.R. Grace & Co. Under the
terms of the settlement agreement as amended (Settlement
Agreement), fraudulent conveyance and other claims raised on
behalf of asbestos claimants will be dismissed with prejudice
and Fresenius Medical Care will receive protection against
existing and potential future W.R. Grace & Co. related claims,
including fraudulent conveyance and asbestos claims, and
indemnification against income tax claims related to the non-
NMC members of the W.R. Grace & Co. consolidated tax group
upon confirmation of a W.R. Grace & Co. bankruptcy reorga-
nization plan that contains such provisions. Under the Settle-
ment Agreement, Fresenius Medical Care will pay a total of
US$ 115 million without interest to the W.R. Grace & Co. bank-
ruptcy estate, or as otherwise directed by the Court, upon
plan confirmation.
No admission of liability has been or will be made. The
Settlement Agreement has been approved by the U.S. District
Court. Subsequent to the Merger, W.R. Grace & Co. was in-
volved in a multi-step transaction involving Sealed Air Corpo-
ration (Sealed Air, formerly: Grace Holding, Inc.). Fresenius
Medical Care is engaged in litigation with Sealed Air to con-
firm its entitlement to indemnification from Sealed Air for
all losses and expenses incurred by Fresenius Medical Care
relating to pre-Merger tax liabilities and Merger-related
claims. Under the Settlement Agreement, upon confirmation
of a plan that satisfies the conditions of Fresenius Medical
Care’s payment obligation, this litigation will be dismissed
with prejudice.
On April 4, 2003, FMCH filed a suit in the U.S. District
Court for the Northern District of California, styled Fresenius
USA, Inc., et al., v. Baxter International, Inc., et al., Case
No. C 03-1431, seeking a declaratory judgment that FMCH
does not infringe patents held by Baxter International, Inc.
and its subsidiaries and affiliates (Baxter), that the patents
are invalid, and that Baxter is without right or authority to
threaten or maintain suit against FMCH for alleged infringe-
ment of Baxter’s patents. In general, the alleged patents
concern the use of touch screen interfaces for hemodialysis
machines. Baxter filed counterclaims against FMCH seeking
more than US$ 140 million in monetary damages and injunc-
tive relief, and alleging that FMCH willfully infringed on Baxter’s
patents. On July 17, 2006, the court entered judgment on
a jury verdict in favor of FMCH finding that all the asserted
claims of the Baxter patents are invalid as obvious and/or
anticipated in light of prior art. On February 13, 2007, the
court granted Baxter’s motion to set aside the jury’s verdict
in favor of FMCH and reinstated the patents and entered
judgment of infringement. Following a trial on damages, the
court entered judgment on November 6, 2007 in favor of
Baxter on a jury award of US$ 14.3 million. On April 4, 2008,
the court denied Baxter’s motion for a new trial, established
a royalty payable to Baxter of 10% of the sales price for con-
tinuing sales of FMCH’s 2008K hemodialysis machines and
7% of the sales price of related disposables, parts and service
beginning November 7, 2007, and enjoined sales of the 2008K
machine effective January 1, 2009. Fresenius Medical Care
appealed the court’s rulings to the Court of Appeals for the
Federal Circuit. Fresenius Medical Care is confident that it
will prevail on appeal or as a result of the pending U.S. Patent
and Trademark Office re-examinations of the underlying
Baxter patents and has made no provision in its financial state-
ments for any potential liability in this matter. If Fresenius
Medical Care is unsuccessful on all appeals, including any
appeal of the royalty, the royalties payable to Baxter on the
machines and disposable supplies that are subject to the court’s
order will be approximately US$ 56 million for sales through
December 31, 2008 and are estimated to be in the range of
US$ 2 million to US$ 3 million per month thereafter. In the
interim period until its appeal is decided, Fresenius Medical
Care is funding a court-approved escrow account at the
royalty rates noted above. If Fresenius Medical Care wins the
appeal, the escrowed funds will be returned to it with inter-
est. In October 2008, Fresenius Medical Care completed
design modifications to the 2008K machine that Fresenius
Medical Care expects will eliminate any incremental hemo-
dialysis machine royalty payment exposure under the court
order and permit the continued sale of the modified machine
in compliance with the injunction, irrespective of the out-
come of Fresenius Medical Care’s appeal.

Notes164
Notes
On April 28, 2008, Baxter filed suit in the U.S. District Court
for the Northern District of Illinois, Eastern Division (Chicago),
styled Baxter International, Inc. and Baxter Healthcare
Corporation v. Fresenius Medical Care Holdings, Inc. and
Fresenius USA, Inc., Case No. CV 2389, asserting that FMCH’s
hemodialysis machines infringe four recently issued patents
(late 2007-2008), all of which are based on one of the patents
at issue in the April 2003 Baxter case described above. The
new patents expire in April 2011 and relate to trend charts
shown on touch screen interfaces and the entry of ultrafiltra-
tion profiles (ultrafiltration is the removing of liquid from a
patient’s body using pressure). The court has stayed the case
pending the outcome of the appeal in the April 2003 Baxter
case. Fresenius Medical Care believes that its hemodialysis
machines do not infringe any valid claims of the Baxter
patents at issue.
On October 17, 2006, Baxter and Deka Products Ltd.
(Deka) filed suit in the U.S. District Court for the Eastern Dis-
trict of Texas which was subsequently transferred to the
Northern District of California, styled Baxter Healthcare Cor-
poration and DEKA Products Limited Partnership v. Fresenius
Medical Care Holdings, Inc. d/b/a Fresenius Medical Care
North America and Fresenius USA, Inc., Case No. CV 438 TJW.
The complaint alleges that FMCH’s Liberty peritoneal cyclers
infringe certain patents owned by or licensed to Baxter. Sales
of the Liberty cyclers commenced in July 2008. Fresenius
Medical Care believes that the Liberty peritoneal cycler does
not infringe any valid claims of the Baxter/DEKA patents.
Two patent infringement actions have been pending in
Germany between Gambro Industries (Gambro) on the one
side and FMC D-GmbH, one of Fresenius Medical Care’s
German subsidiaries, and FMC-AG &Co. KGaA on the other
side (hereinafter collectively: Fresenius Medical Care).
Gambro herein alleged patent infringements by Fresenius
Medical Care concerning a patent on a device for the pre-
paration of medical solutions. The first case was dismissed as
being unfounded. Such decision has already become final.
In the second case, the District Court of Mannheim rendered
a judgment on June 27, 2008 deciding in favor of Gambro
and declaring that Fresenius Medical Care has infringed a
patent claim. Accordingly, the court ordered Fresenius
Medical Care to pay compensation (to be determined in a
separate court proceeding) for alleged infringement and
to stop offering the alleged patent infringing technology in
its original form in Germany. FMC D-GmbH brought an
invalidity action in the Federal German Patent Court (BPatG)
against Gambro’s patent. This case is currently pending with
the Federal Court of Justice as the court of appeal. Fresenius
Medical Care has also filed an appeal against the District
Court’s verdict. On January 5, 2009, Gambro enforced such
verdict provisionally by way of security to be deposited by
Gambro. However, preceding such enforcement Fresenius
Medical Care had already developed design modifications,
as an alternative technical solution, and replaced the alleged
patent infringing technology in nearly all of the affected
devices. In view of the pending appeal against BPatG’s ver-
dict and Fresenius Medical Care’s appeal against the District
Court’s verdict, Fresenius Medical Care continues to believe
that the alleged patent infringing technology does not infringe
any valid patent claims of Gambro.
Other litigation and potential exposures
Renal Care Group, Inc. (RCG) was named as a nominal defend-
ant in a second amended complaint filed September 13,
2006, in the Chancery Court for the State of Tennessee Twen-
tieth Judicial District at Nashville against former officers and
directors of RCG which purports to constitute a class action
and derivative action relating to alleged unlawful actions
and breaches of fiduciary duty in connection with Fresenius
Medical Care’s acquisition of RCG (the RCG acquisition)
and in connection with alleged improper backdating and/or
timing of stock option grants. The amended complaint was
styled Indiana State District Council of Laborers and Hod
Carriers Pension Fund, on behalf of itself and all others
similarly situated and derivatively on behalf of RCG, Plaintiff,
vs. RCG, Gary Brukardt, William P. Johnston, Harry R.
Jacobson, Joseph C. Hutts, William V. Lapham, Thomas A.
Lowery, Stephen D. McMurray, Peter J. Grua, C. Thomas

165Management Report Report Supervisory Board Management Board Supervisory BoardConsolidated Financial Statements
Consolidated statement of incomeConsolidated balance sheetConsolidated cash flow statement
Consolidated statement of shareholders’ equitySegment ReportingNotes
Glossary
Not
es
Auditor’s Report
Smith, Ronald Hinds, Raymond Hakim, and R. Dirk Allison,
Defendants. The complaint sought damages against former
officers and directors and did not state a claim for money
damages directly against RCG. On August 30, 2007, this suit
was dismissed by the trial court without leave to amend.
Plaintiff subsequently appealed and the matter remains pend-
ing in the appellate court of Tennessee.
FMCH and its subsidiaries, including RCG (prior to the
RCG acquisition), received subpoenas from the U.S. Depart-
ment of Justice, Eastern District of Missouri, in connection
with a joint civil and criminal investigation. FMCH received
its subpoena in April 2005. RCG received its subpoena in
August 2005. The subpoenas require production of a broad
range of documents relating to FMCH’s and RCG’s opera-
tions, with specific attention to documents related to clinical
quality programs, business development activities, medical
director compensation and physician relationships, joint ven-
tures, and anemia management programs, RCG’s supply
company, pharmaceutical and other services that RCG pro-
vides to patients, RCG’s relationships to pharmaceutical
companies, and RCG’s purchase of dialysis equipment from
FMCH. The Office of the Inspector General of the U.S. Depart-
ment of Health and Human Services and the U.S. Attorney’s
office for the Eastern District of Texas have also confirmed
that they are participating in the review of the anemia man-
agement program issues raised by the U.S. Attorney’s office
for the Eastern District of Missouri. On July 17, 2007, the U.S.
Attorney’s office filed a civil complaint against RCG and
FMCH in its capacity as RCG’s current corporate parent in the
United States District Court, Eastern District of Missouri.
The complaint seeks monetary damages and penalties with
respect to issues arising out of the operation of RCG’s
Method II supply company through 2005, prior to the date
of FMCH’s acquisition of RCG. The complaint is styled
United States of America ex rel. Julie Williams et al. vs. Renal
Care Group, Renal Care Group Supply Company and FMCH.
Fresenius Medical Care believes that RCG’s operation of its
Method II supply company was in compliance with applica-
ble law and will defend this litigation vigorously. Fresenius
Medical Care will continue to cooperate in the ongoing inves-
tigation.
On November 27, 2007, the United States District Court
for the Western District of Texas (El Paso) unsealed and per-
mitted service of two complaints previously filed under seal
by a qui tam relator, a former FMCH local clinic employee
(Qui tam is a legal provision under the United States False
Claims Act, which allows for private individuals to bring suit
on behalf of the U.S. federal government, as far as such
individuals believe to have knowledge of presumable fraud
committed by third parties). The first complaint alleges
that a nephrologist unlawfully employed in his practice an
assistant to perform patient care tasks that the assistant
was not licensed to perform and that Medicare billings by
the nephrologist and FMCH therefore violated the False
Claims Act. The second complaint alleges that FMCH unlaw-
fully retaliated against the relator by discharging her from
employment constructively. The United States Attorney for
the Western District of Texas declined to intervene and
to prosecute on behalf of the United States. Counsel for
the nephrologist asserted that a criminal investigation of the
relator’s allegations was in process and therefore moved
the Court to stay all activity in the qui tam until the alleged
criminal investigation concluded. The Court denied the
nephrologist’s motion to stay and the litigation is processing.
In the ordinary course of Fresenius Group’s operations,
the Fresenius Group is subject to litigation, arbitration and
investigations relating to various aspects of its business. The
Fresenius Group regularly analyzes current information
about such claims for probable losses and provides accruals
for such matters, including estimated expenses for legal
services, as appropriate.
Accrued special charge of Fresenius Medical Care
for legal matters
At December 31, 2001, Fresenius Medical Care recorded a
pre-tax special charge of US$ 258 million to reflect anticipated
expenses associated with the defense and resolution of

Notes166
Notes
pre-Merger tax claims, Merger-related claims, and commer-
cial insurer claims. The costs associated with the Settlement
Agreement and settlements with insurers have been charged
against this accrual. With the exception of the proposed
US$ 115 million (€ 83 million) payment under the Settlement
Agreement, all other matters included in the special charge
have been resolved. While Fresenius Medical Care believes
that its remaining accrual reasonably estimates its currently
anticipated costs related to the continued defense and resolu-
tion of this matter, no assurances can be given that its actual
costs incurred will not exceed the amount of this accrual.
30. FINANCIAL INSTRUMENTS
VALUATION OF FINANCIAL INSTRUMENTS
Fair value of financial instruments
In September 2006, the Financial Accounting Standards Board
(FASB) issued Statement of Financial Accounting Standards
No. 157, Fair Value Measurements (FAS 157), which estab-
lishes a framework for reporting fair value and expands dis-
closures about fair value measurements. FAS 157 is effective
for financial statements issued for fiscal years beginning
after November 15, 2007, and interim periods within those
fiscal years. FASB Staff Position No. 157-2 (FSP 157-2)
issued February 12, 2008, delayed application of this State-
ment for non-financial assets and non-financial liabilities,
except for items that are recognized or disclosed at fair value
in the consolidated financial statements on a recurring basis
(at least annually), until fiscal years beginning after November
15, 2008, and interim periods within those fiscal years. FAS
157 establishes a three-tier value hierarchy, which prioritizes
the inputs used in estimating fair value: (i) Level 1 is defined
as observable inputs, such as quoted prices in active markets,
(ii) Level 2 is defined as inputs other than quoted prices in
active markets, that are directly or indirectly observable, and
(iii) Level 3 is defined as unobservable inputs for which little
or no market data exists, therefore requiring the Fresenius
Group to develop its own assumptions. The Fresenius Group
adopted this standard, except for those sections affected by
FSP 157-2, as of January 1, 2008.
The Fresenius Group holds interest rate swaps and foreign
exchange contracts which are carried at fair value initially
and on a recurring basis. The fair value of interest rate swaps
is calculated by discounting the future cash flows on the
basis of the market interest rates applicable for the remaining
term of the contract as of the balance sheet date. To deter-
mine the fair value of foreign exchange forward contracts, the
contracted forward rate is compared to the current forward
rate for the remaining term of the contract as of the balance
sheet date. The result is then discounted on the basis of the
market interest rates prevailing at the balance sheet date for
the respective currency. Under FAS 157, the Fresenius
Group is now required to take into account credit risks when
measuring the fair value of derivative financial instruments.
In accordance with these requirements, the Fresenius Group’s
own credit risk is incorporated in the fair value estimation
of interest rate derivatives that are liabilities. However, for
foreign exchange forward derivatives that are liabilities,
due to the relatively short term of the contracts, the Fresenius
Group did not take into account its own credit risk in the fair
value estimation. Counterparty credit-risk adjustments are
negligible due to the high credit ratings of the counterparties
and is therefore not factored into the valuation of derivatives
that are assets.
The following table presents the carrying amounts
and fair values of the Group’s financial instruments as of
December 31:
in million €2008 2007
Carrying amount Fair value Carrying amount Fair value
Cash and cash equivalents 370 370 361 361
Assets recognized at carrying amount 2,499 2,499 2,167 2,167
Assets recognized at fair value 8 8 0 0
Liabilities recognized at carrying amount 9,903 9,793 6,147 6,118
Liabilities recognized at fair value 41 41 0 0
Derivatives designated as hedging instruments -160 -160 -16 -16

167Management Report Report Supervisory Board Management Board Supervisory BoardConsolidated Financial Statements
Consolidated statement of incomeConsolidated balance sheetConsolidated cash flow statement
Consolidated statement of shareholders’ equitySegment ReportingNotes
Glossary
Not
es
Auditor’s Report
For the fair value measurement of derivatives and derivative
financial instruments embedded in the MEB, significant other
observable inputs are used. Therefore, they are classified as
Level 2 in accordance with FAS 157. The valuation of the CVR
is based on the current stock exchange price at the US stock
exchange, they are therefore classified as Level 1. Derivatives
designated as hedging instruments as well as derivatives
embedded in the MEB were recognized at gross values as
other current assets in an amount of € 87 million and other
liabilities in an amount of € 239 million.
Estimation of fair values of financial instruments
The significant methods and assumptions used to estimate
the fair values of financial instruments are as follows:
Cash and cash equivalents are stated at nominal value
which equals the fair value.
Short-term financial instruments like accounts receivable
and payable and short-term borrowings are valued at their
carrying amounts, which are reasonable estimates of the fair
value due to the relatively short period to maturity of these
instruments.
The fair values of senior notes and trust preferred securi-
ties are based on market prices and quotes as of the balance
sheet date. The fair values of other fixed-rate financial liabili-
ties, for which market quotes are not available, are calculated
as present value of the respective future cash flows. To deter-
mine these present values, the prevailing interest rates and
credit spreads for the Fresenius Group as of the balance
sheet date are used.
The fair values of financial liabilities with floating interest
rates approximate their carrying amounts as the interest rates
for these liabilities are predominantly updated every three
months with interest rates reflecting actual market conditions
at the time of update.
The fair values of derivative financial instruments em-
bedded in the MEB and the CVR correspond with their carry-
ing amounts. The CVR are traded at the stock exchange in
the United States and are therefore valued with the current
stock exchange price at the reporting date. The embedded
derivatives have to be measured at fair value, which is esti-
mated based on a Black-Scholes model.
The estimation of the fair value of derivatives is described
on the previous page in connection with the description of
FAS 157 under fair value of financial instruments.
Effects of non-derivative financial instruments recorded in
the consolidated statement of income
The effects of non-derivative financial instruments recorded
in the consolidated statements of income consisted of interest
income of € 25 million, interest expenses of € 456 million,
as well as allowance for doubtful accounts in an amount of
€ 159 million and revenues in an amount of € 75 million
resulting from the fair value measurement of the CVR.
MARKET RISK
General
The Fresenius Group is exposed to effects related to foreign
exchange fluctuations in connection with its international
business activities that are denominated in various currencies.
In order to finance its business operations, the Fresenius
Group issues senior notes, trust preferred securities and com-
mercial papers and enters into mainly long-term credit
agreements and Euro Notes (Schuldscheindarlehen) with
banks. Due to these financing activities, the Fresenius
Group is exposed to interest risk caused by changes in vari-
able interest rates and the risk of changes in the fair value
of balance sheet items bearing fixed interest rates.
In order to manage the risks of interest rate and foreign
exchange rate fluctuations, the Fresenius Group enters into
certain hedging transactions with highly rated financial insti-
tutions as authorized by the Management Board. Derivative
financial instruments are not used for trading purposes.
In general, the Fresenius Group conducts its derivative
financial instrument activities under the control of a single
centralized department. The Fresenius Group has established
guidelines derived from best practice standards in the bank-
ing industry for risk assessment procedures and supervision
concerning the use of financial derivatives. These guidelines
require amongst other things a clear segregation of duties in
the areas of execution, administration, accounting and con-
trolling.
The Fresenius Group defines benchmarks for individual
exposures in order to quantify interest and foreign exchange
risks. The benchmarks are derived from achievable and
reasonable market rates. Depending on the individual bench-
marks, hedging strategies are determined and implemented.
Earnings of the Fresenius Group were not materially
affected by hedge ineffectiveness in the reporting period since
the critical terms of the interest and foreign exchange deriv-
atives mainly matched the critical terms of the underlying
exposures.

Notes168
Notes
Derivative financial instruments
Foreign exchange risk management
The Fresenius Group has determined the euro as its financial
reporting currency. Therefore, foreign exchange translation
risks resulting from the fluctuation of exchange rates between
the euro and the local currencies in which the financial state-
ments of the foreign subsidiaries are prepared have an impact
on results of operations and financial positions reported in
the consolidated financial statements.
Besides translation risks, foreign exchange transaction
risks exist, which mainly relate to transactions such as pur-
chases and sales as well as engineering and services provided
by Fresenius Group which are denominated in foreign cur-
rencies. A major part of transaction risks arise from products
manufactured in Fresenius Group’s worldwide production
sites which are usually denominated in the local currency of
the respective manufacturer and are delivered worldwide to
various Fresenius Group entities. These intragroup sales are
mainly denominated in euros, US dollars and yens. There-
fore, Group companies are exposed to changes of the foreign
exchange rates between the invoicing currencies and the
local currencies in which they conduct their businesses. Solely
for the purpose of hedging existing and foreseeable foreign
exchange transaction exposures, the Fresenius Group enters
into foreign exchange forward contracts and, on a small
scale, foreign exchange options.
As of December 31, 2008, the notional amounts of foreign
exchange contracts totaled € 1,493 million with a fair value
of € 31 million. These foreign exchange contracts included
foreign exchange options with a nominal value of € 6 million
and a market value of € 0 million. The foreign exchange con-
tracts have been entered into to hedge risks from opera-
tional business and in connection with intercompany loans in
foreign currency. The predominant part of the foreign ex-
change forward contracts to hedge risks from operational
business was recognized as cash flow hedge.
The hedge-effective portion of changes in the fair value
of foreign exchange forward contracts that are designated
and qualified as cash flow hedges of forecasted product pur-
chases and sales is reported in accumulated other com-
prehensive income (loss). These amounts are subsequently
reclassified into earnings as a component of cost of sales
or as selling, general and administrative expenses as well as
interest income or expenses in the same period in which
the hedged transaction affects earnings. After-tax gains of
€ 13 million (€ 20 million pre-tax) for the year ended Decem-
ber 31, 2008 are deferred in accumulated other comprehensive
income and will mainly be reclassified into earnings during
2009. During 2008, the Fresenius Group reclassified after-
tax unrealized gains of € 2 million (€ 3 million pre-tax) from
accumulated other comprehensive income (loss) into the
profit and loss statement.
As of December 31, 2008, the Fresenius Group was party
to foreign exchange contracts with a maximum maturity of
34 months.
In order to estimate and quantify the transaction risks from
foreign currencies, the Fresenius Group considers the cash
flows reasonably expected for the following three months as
the relevant assessment basis for a sensitivity analysis. For
this analysis, the Fresenius Group assumes that all foreign
exchange rates in which the Group had unhedged positions
as of reporting date would be negatively impacted by 10%.
By multiplying the calculated unhedged risk positions with
this factor, the maximum possible negative impact of the for-
eign exchange transaction risks on the Group’s results of
operations would be € 12 million.
Interest rate risk management
Fresenius Group’s interest rate risks mainly arise from money
market and capital market transactions of the Group for financ-
ing its business activities.
The Fresenius Group enters into interest rate swaps and,
on a small scale, into interest rate options in order to hedge
against interest rate exposures arising from long-term borrow-
ings at variable rates by swapping them into fixed rates.
In addition, the Fresenius Group used interest rate swaps to
hedge against changes of the fair value of the underlying
fixed rate financial liabilities.
For purposes of analyzing the impact of changes in the
relevant reference interest rates on Fresenius Group’s results
of operations, the Group calculates the portion of financial
debt which bears variable interest rate and which has not been
hedged by means of interest rate swaps or options against
rising interest rates. For this particular part of its liabilities,
the Fresenius Group assumes an increase in the reference
rates of 0.5% compared to the actual rates as of the balance
sheet date. The corresponding additional annual interest

169Management Report Report Supervisory Board Management Board Supervisory BoardConsolidated Financial Statements
Consolidated statement of incomeConsolidated balance sheetConsolidated cash flow statement
Consolidated statement of shareholders’ equitySegment ReportingNotes
Glossary
Not
es
Auditor’s Report
expense is then compared to the Group net income. This
analysis shows that an increase of 0.5% in the relevant
reference rates would have an effect of less than 1.5% on the
Group’s consolidated net income and shareholders’ equity.
Cash Flow Hedge
The Fresenius Group enters into interest rate swaps that
are designated as cash flow hedges effectively converting
certain variable interest rate payments, resulting from exist-
ing loans and Euro Notes (Schuldscheindarlehen) mainly
denominated in US dollars or euros, into fixed interest rate
payments. The US dollar interest rate swaps with a notional
volume of US$ 4,250 million (€ 3,054 million) and a fair value
of US$ -241 million (€ -173 million) expire at various dates
between 2009 and 2014. These interest rate derivatives include
interest rate swaps with a notional amount of US$ 1.4 billion
entered into in connection with the acquisition of APP. The
Euro interest rate swaps with a notional volume of € 416 mil-
lion and a fair value of € -18 million expire between 2011
and 2014. The US dollar interest rate swaps bear an average
interest rate of 4.21% and the Euro interest rate swaps bear
an average interest rate of 4.34%.
At December 31, 2008, pre-tax losses of € 184 million
(2007: € 26 million), were recognized in accumulated other
comprehensive income (loss). The equivalent amounts of
after-tax losses were € 117 million and € 16 million, respec-
tively. Interest payables and interest receivables in connec-
tion with the swap agreements are accrued and recorded as
an adjustment to the interest expense at each reporting date.
Fair Value Hedge
Fresenius Medical Care entered into US dollar interest rate
swaps designated as fair value hedges to hedge the risk of
changes in the fair value of parts of its US dollar fixed rate
borrowings. At December 31, 2007, US dollar interest rate
swaps at Fresenius Medical Care had a notional volume of
US$ 450 million. On February 1, 2008, the fair value hedges
of Fresenius Medical Care expired together with the manda-
tory redemption of the underlying debt. These interest rate
swaps effectively converted the fixed interest payments on
Fresenius Medical Care Capital Trust II trust preferred secu-
rities denominated in US dollars into variable interest rate
payments and were reported at fair value in the balance sheet.
The reported amount of the hedged portion of fixed rate
trust preferred securities includes an adjustment representing
the change in fair value attributable to the interest rate
risk being hedged. The effect of hedged underlyings recog-
nized in the income statement amounted to € -4 million
(2007: € -7 million) and was mainly offset by the effect of
the hedging instruments recognized in the income state-
ment in an amount of € 4 million (2007: € 7 million). At
December 31, 2008, no fair value hedges existed within
the Fresenius Group.
CREDIT RISK
The Fresenius Group is exposed to potential losses in the
event of non-performance by counterparties to derivative
financial instruments. With respect to derivative financial
instruments it is not expected that any counterparty fails to
meet its obligations as the counterparties are highly rated
financial institutions. The maximum credit exposure of deriv-
atives is represented by the fair value of those contracts
with a positive fair value amounting to € 0 million for interest
rate derivatives and € 79 million for foreign exchange deri-
vatives at December 31, 2008. The maximum credit risk result-
ing from the use of non-derivative financial instruments is
defined as the total amount of all receivables. In order to con-
trol this credit risk, the Management of the Fresenius Group
performs an ageing analysis of trade accounts receivable. For
details on the ageing analysis and on the allowance for doubt-
ful accounts, please see Note 14, Trade accounts receivable.
LIQUIDITY RISK
The liquidity risk is defined as the risk that a company is
potentially unable to meet its financial obligations. The
Management of the Fresenius Group manages the liquidity
of the Group by means of effective working capital and
cash management as well as an anticipatory evaluation of
refinancing alternatives. The Management of the Fresenius
Group believes that existing credit facilities as well as the
cash generated by operating activities and additional short-
term borrowings are sufficient to meet the Company’s fore-
seeable demand for liquidity (see Note 21, Debt and liabilities
from capital lease obligations).
Notes170
Notes
31. SUPPLEMENTARY INFORMATION ON CAPITAL
MANAGEMENT
Fresenius has a solid financial profile. Capital management
includes both equity and debt. A principal objective of
Fresenius Group’s capital management is to optimize the
weighted average cost of capital. Further, it is sought to
achieve a balanced mix of equity and debt. To secure growth
on a long-term basis the use of a capital increase may also
be considered in exceptional cases, for instance to finance a
major acquisition.
Due to the Company’s diversification within the health
care sector and the strong market positions of the business
segments in global, growing and non-cyclical markets, high,
stable, predictable and sustainable cash flows are generated.
They allow a reasonable proportion of debt, i.e. the employ-
ment of an extensive mix of financial liabilities. Moreover,
Fresenius Group’s customers are almost invariably of high
credit quality.
Equity and debt have developed as follows:
Assuring financial flexibility is the top priority in the Group’s
financing strategy. This flexibility is achieved through a wide
range of financing instruments and a high degree of diversifi-
cation of the investors. The Fresenius Group’s maturity pro-
file displays a broad spread of maturities with a high propor-
tion of medium and long-term financings. In the choice of
financing instruments, market capacity, investor diversifica-
tion, flexibility, credit conditions and the existing maturity
profile are taken into account.
A key financial performance indicator for the Fresenius
Group is the net debt/EBITDA ratio, which is measured on the
basis of US GAAP figures. This ratio was 3.6 as of December
31, 2008 including the EBITDA of APP for the full year 2008.
The aim is to reduce this further. To achieve this goal,
Fresenius Group’s focus is primarily on earnings growth and
sustained strong cash flows as well as debt reduction. The
Fresenius Group expects this ratio to be in the range of 2.5
to 3.0 by 2010.
Fresenius Group’s financing strategy is reflected in its
credit ratings. Fresenius is covered by the rating agencies
Moody’s, Standard&Poor’s and Fitch.
The following table shows the company rating of
Fresenius SE:
Shareholders’ equity
in million €December 31,
2008December 31,
2007
Shareholders’ equity including minority interest 6,943 6,059
Total assets 20,544 15,324
Equity ratio 33.80% 39.54%
Debt
in million €December 31,
2008December 31,
2007
Debt 8,787 5,699
Total assets 20,544 15,324
Debt ratio 42.77% 37.19%
Standard&Poor’s Moody’s Fitch
Company rating BB Ba1 BB
Outlook negative negative negative
in million € 2008 2007
Interest paid 410 388
Income taxes paid 359 323
Fresenius SE is not subject to any capital requirements pro-
vided for in its Articles of Association. Fresenius SE has obli-
gations to issue shares out of the Conditional Capital relating
to the exercise of stock options and convertible bonds on the
basis of the existing 1998, 2003 and 2008 stock option plans
(see Note 34, Stock options).
According to the definitions in the underlying agreements,
the MEB and the CVR are not categorized as debt.
32. SUPPLEMENTARY INFORMATION ON CASH
FLOW STATEMENT
The cash flow statements of the Fresenius Group for the fiscal
years 2008 and 2007 are shown on pages 110 to 111.
Cash funds reported in the cash flow statement and in the
balance sheet comprise cash on hand, checks, securities and
cash at bank which are readily convertible within three months
and are subject to insignificant risk of changes in value.
The following summaries provide additional information
with regard to the consolidated cash flow statement:
171Management Report Report Supervisory Board Management Board Supervisory BoardConsolidated Financial Statements
Consolidated statement of incomeConsolidated balance sheetConsolidated cash flow statement
Consolidated statement of shareholders’ equitySegment ReportingNotes
Glossary
Not
es
Auditor’s Report
33. NOTES ON SEGMENT REPORTING
GENERAL
The segment reporting tables shown on pages 114 to 117 of
this annual report are an integral part of the Notes.
The Fresenius Group has identified the business segments
Fresenius Medical Care, Fresenius Kabi, Fresenius Helios
and Fresenius Vamed which corresponds to the internal orga-
nizational and reporting structures (Management Approach)
at December 31, 2008.
The key data disclosed in conjunction with segment report-
ing correspond to the key data of the internal reporting sys-
tem of the Fresenius Group. Internal and external reporting
and accounting correspond to each other; the same key data
and definitions are used.
Sales and proceeds between the segments are indicative
of the actual sales and proceeds agreed with third parties.
Administrative services are billed in accordance with service
level agreements.
The business segments were identified in accordance
with FAS 131 (Disclosures about Segments of an Enterprise
and Related Information), which defines the segment report-
ing requirements in the annual financial statements and
interim reports with regard to the operating business, prod-
uct and service businesses and regions. The business seg-
ments of the Fresenius Group are as follows:
Fresenius Medical Care is the world’s leading provider
of dialysis products and dialysis care for the life-saving treat-
ment of patients with chronic kidney failure. Fresenius
in million € 2008 2007
Assets acquired 4,238 779
Liabilities assumed - 421 -135
Minority interest 2 -9
Notes assumed in connection with acquisitions - 767 -169
Cash paid 3,052 466
Cash acquired -105 -22
Cash paid for acquisitions, net 2,947 444
Cash paid for acquisitions (without investments in licenses)
consisted of the following:
Medical Care treats 184,086 patients in its 2,388 own dialy-
sis clinics.
Fresenius Kabi is Europe’s leading company in the field
of infusion therapy and clinical nutrition with subsidiaries and
distributors worldwide. Fresenius Kabi’s products are used
in hospitals as well as in out-patient medical care to treat criti-
cally and chronically ill patients. Fresenius Kabi is also a
leading provider of transfusion technology products in Europe.
As of January 1, 2008, Fresenius has reorganized its hos-
pital business. The business segment Fresenius ProServe has
been replaced by the two new business segments, Fresenius
Helios and Fresenius Vamed, which so far have formed
Fresenius ProServe. Fresenius Helios is focused on hospital
operations. Fresenius Vamed offers engineering and services
for hospitals and other health care facilities.
The segment Corporate/Other mainly comprises the hold-
ing functions of Fresenius SE as well as Fresenius Netcare
GmbH, which provides services in the field of information
technology as well as Fresenius Biotech, which does not
fulfill the characteristics of a reportable segment. In addition,
the segment Corporate/Other includes intersegment con-
solidation adjustments as well as special items regarding
the acquisition of APP.
Segment reporting by region takes account of geographi-
cal factors and the similarity of markets in terms of opportu-
nities and risks. The allocation to a particular region is based
on the domicile of the customers.
NOTES ON THE BUSINESS SEGMENTS
The key figures used by the Management Board to assess
segment performance, have been selected in such a way that
they include all items of income and expenses which fall
under the area of responsibility of the business segments.
The Management Board is convinced that the most suitable
performance indicator is the operating income (EBIT). The
Management Board believes that, in addition to the operating
income, the figure for earnings before interest, taxes and
depreciation/amortization (EBITDA) can also help investors
to assess the ability of the Fresenius Group to generate cash
flows and to meet its financial obligations. The EBITDA figure
is also the basis for assessing Fresenius Group’s compliance
with the terms of its credit agreements (e.g. the Fresenius
Medical Care 2006 Senior Credit Agreement or the 2008 Senior
Credit Agreement).

Notes172
Notes
Depreciation and amortization is presented for property,
plant and equipment, intangible assets with definite useful
lives of the respective business segment.
Net interest comprises interest expenses and interest
income.
Net income is defined as earnings after income taxes
and minority interest.
The operating cash flow is the cash provided by/used
for operating activities.
The cash flow before acquisitions and dividends is the
operating cash flow less net capital expenditure.
Debt comprises bank loans, senior notes, trust preferred
securities, liabilities from capital lease obligations, liabilities
relating to outstanding acquisitions as well as intercompany
liabilities. The MEB and the CVR are not categorized as
debt (see Note 31, Supplementary information on capital
management).
Capital expenditure mainly includes additions to prop-
erty, plant and equipment.
Acquisitions refer to the purchase of shares in legally-
independent companies and the acquisition of business
divisions and intangible assets (e.g. licenses). The key fig-
ures shown with regard to acquisitions present the con-
tractual purchase prices comprising amounts paid in cash
(less cash acquired), debts assumed and the issuance of
shares, whereas for the purposes of the cash flow statement,
only cash purchase price components less acquired cash
and cash equivalents are reported.
The EBITDA margin is calculated as a ratio of EBITDA
to sales.
The EBIT margin is calculated as a ratio of EBIT to sales.
The return on operating assets (ROOA) is defined as the
ratio of EBIT to average operating assets. Operating assets
are defined as total assets less deferred tax assets, trade
accounts payable and advance payments from customers as
well as guaranteed subsidies.
In addition, the key indicators “Depreciation and amor-
tization in % of sales” and “Operating cash flow in % of
sales” are also disclosed.
Reconciliation of key figures to consolidated earnings
in million € 2008 2007
Total EBITDA of reporting segments 2,249 2,077
Depreciation and amortization - 783 -421
General corporate expenses Corporate/Other(EBITDA) 11 -47
Interest expenses - 456 -395
Interest income 25 27
Other financial result 68 0
Total earnings before income taxes and
minority interest 1,114 1,241
Total EBIT of reporting segments 1,785 1,666
General corporate expenses Corporate/Other(EBIT) - 308 -57
Interest expenses - 456 -395
Interest income 25 27
Other financial result 68 0
Total earnings before income taxes and
minority interest 1,114 1,241
Depreciation and amortization of reporting segments 464 411
Depreciation and amortization Corporate/Other 319 10
Total depreciation and amortization 783 421
Reconciliation of net debt with the consolidated balance sheet
in million €December 31,
2008December 31,
2007
Short-term borrowings 729 362
Short-term liabilities and loans from related parties 2 –
Current portion of long-term debt andliabilities from capital lease obligations 431 115
Current portion of Senior Notes 100 0
Current portion of trust preferred securities of Fresenius Medical CareCapital Trusts 0 455
Long-term debt and liabilities from capital lease obligations, less current portion 5,716 2,887
Senior Notes, less current portion 1,354 1,434
Trust preferred securities of Fresenius Medical Care Capital Trusts,less current portin 455 446
Debt 8,787 5,699
less cash and cash equivalents 370 361
Net debt 8,417 5,338

173Management Report Report Supervisory Board Management Board Supervisory BoardConsolidated Financial Statements
Consolidated statement of incomeConsolidated balance sheetConsolidated cash flow statement
Consolidated statement of shareholders’ equitySegment ReportingNotes
Glossary
Not
es
Auditor’s Report
The following table shows the non-current assets by geo-
graphical region:
in million €December 31,
2008December 31,
2007
Germany 3,052 2,711
Europe (excluding Germany) 1,893 1,838
North America 9,459 5,765
Asia-Pacific 641 358
Latin America 221 192
Africa 31 36
Total non-current assets1) 15,297 10,900
1) The aggregate amount of net non-current assets is the sum of non-current assets less deferred tax assets and derivative financial instruments.
In 2008, the Fresenius Group generated sales of € 2,793 million
(2007: € 2,476 million) in Germany.
34. STOCK OPTIONS
COMPENSATION COST IN CONNECTION WITH THE
STOCK OPTION PLANS OF THE FRESENIUS GROUP
The Fresenius Group recognized compensation cost in an
amount of € 33 million for stock options granted since 2004.
For stock incentive plans which are performance based, the
Fresenius Group recognizes compensation cost over the vest-
ing periods, based on the then current market values of the
underlying stock.
FAIR VALUE OF STOCK OPTIONS
The Fresenius Group elected to adopt FAS123(R) prospectively.
The Fresenius Group uses a binomial option pricing model
in determining the fair value of stock options granted under
the stock option plans of Fresenius SE and Fresenius Medical
Care. Option valuation models require the input of highly
subjective assumptions including expected stock price volatil-
ity. Fresenius Group’s assumptions are based upon its past
experiences, market trends and the experiences of other enti-
ties of the same size and in similar industries. To incorporate
the effects of expected early exercise in the model, an early
exercise of vested options was assumed as soon as the share
price exceeds 150% of the exercise price. Fresenius Group’s
stock options have characteristics that vary significantly
from traded options and changes in subjective assumptions
can materially affect the fair value of the option.
The weighted-average assumptions for the calculation of the
fair value of grants of Fresenius SE stock option plans made
during the years 2008 and 2007 are as follows:
The expected volatility results from the historical volatility
calculated over the expected life of options. The volatility was
determined when the fair value of stock options was calcu-
lated for the first time and since then has been controlled every
year upon issuance of a new tranche.
FRESENIUS SE STOCK OPTION PLANS
Description of the Fresenius SE stock option plans in place
On December 31, 2008, Fresenius SE had three stock option
plans in place; the Fresenius AG stock option based plan of
1998 (1998 Plan), the Fresenius AG Stock Option Plan 2003
(2003 Plan) which is based on convertible bonds and the
new stock option based Fresenius SE Stock Option Plan 2008
(2008 Plan). The latter is the only plan under which stock
options were granted during 2008.
Stock Option Plan 2008
On May 21, 2008, Fresenius SE’s Annual General Meeting has
resolved upon the Fresenius SE Stock Option Plan 2008
(2008 Plan) by authorizing the granting of subscription rights
to members of the Management Board and managerial
employees of the Company and affiliated companies. To fulfill
the subscription rights under the 2008 Plan, the subscribed
capital of Fresenius SE was increased conditionally by up to
€ 6.2 million through the issue of up to 3.1 million no par
value bearer ordinary shares and 3.1 million no par value
bearer preference shares.
2008 2007
DecemberGrant
AugustGrant
Expected dividend yield 2.39% 1.63% 0.94%
Risk-free interest rate 2.88% 4.20% 4.48%
Expected volatility 28.91% 27.82% 29.06%
Life of options 7 years 7 years 10 years
Exercise price per option in € 43.52 53.56 56.74
Notes174
Notes
Under the 2008 Plan, up to 6.2 million options can be issued,
which carry entitlement to obtain 3.1 million ordinary shares
and 3.1 million preference shares. Up to 1.2 million options
are designated for members of the Management Board of
Fresenius SE, up to 3.2 million options are designated for
members of the management of directly or indirectly affil-
iated companies (except for Fresenius Medical Care) and up
to 1.8 million options are designated for managerial staff
members of Fresenius SE and its affiliated companies (except
for Fresenius Medical Care). With respect to the members
of Fresenius SE’s Management Board, the Supervisory Board
has sole authority to grant stock options and administer the
2008 Plan. The Management Board of Fresenius SE has such
authority with respect to all other participants in the 2008
Plan. The options can be granted in five tranches with effect
as of the first bank working day in July and/or the first bank
working day in December. The exercise price of options shall
be the average closing price of Fresenius SE’s ordinary
shares and preference shares, respectively, on the Frankfurt
Stock Exchange during the 30 trading days immediately
prior to each grant date. For participants in the United States,
the exercise price may be the average closing price of both
classes of shares during the 30 calendar days immediately
prior to the grant date, if these are higher. Options granted
have a seven-year term but can be exercised only after a three-
year vesting period. The vesting of options granted is man-
datorily subject to the condition, in each case, that the annual
success target within the three-year vesting period is achieved.
For each such year, the success target is achieved if the con-
solidated net income of the Fresenius Group, adjusted for
extraordinary effects, has increased by at least 8% compared
to the respective adjusted net income of the previous fiscal
year. For each year in which the success target has not been
met, one-third of the options granted shall forfeit. The adjusted
net income shall be calculated on the basis of the calculation
method of the accounting principles according to US GAAP.
For the purposes of the 2008 Plan, the adjusted net income
is determined and will be verified bindingly by Fresenius SE’s
auditor during the audit of the consolidated financial state-
ments. The performance target for 2008 is met. Upon exercise
of vested options, Fresenius SE has the right to grant treasury
shares or a cash payment in lieu of increasing capital by the
issuance of new shares. If all conditions are fulfilled, stock
options may be exercised throughout the year with the excep-
tion of certain pre-determined black-out periods.
Stock Option Plan 2003
During 2003, Fresenius AG adopted the 2003 Plan for mem-
bers of the Management Board and executive employees.
This incentive plan which is based on convertible bonds was
replaced by the 2008 Plan and no options have been granted
since 2008. Under the 2003 Plan, eligible employees have the
right to acquire ordinary and preference shares of Fresenius
SE. The bonds expire in ten years and one third of them can
be exercised beginning after two, three and four years after
the grant date, respectively. Bonds which were not financed
by a note from Fresenius SE are recognized as a liability on
Fresenius Group’s consolidated balance sheet. Upon issuance
of the option, the employees have the right to choose options
with or without a stock price target. The conversion price of
options subject to a stock price target corresponds to the stock
exchange quoted price of the ordinary or preference shares
upon the first time the stock exchange quoted price exceeds
the initial value (after the share split 1/3 of the initial value)
by at least 25%. If converted after the share split the conver-
sion price which entitles to three ordinary shares or prefer-
ence shares, respectively, is equal to the triple of one third
of the initial value. The initial value is the joint average stock
exchange price of bearer ordinary shares and non-voting
bearer preference shares during the last 30 trading days prior
to the date of grant. The conversion price of options without
a stock price target is the initial value. In the case of options
not subject to a stock price target, the number of convertible
bonds awarded to the eligible employee would be 15% less
than if the employee elected options subject to the stock
price target. Each convertible bond granted after the share
split entitles to subscribe one ordinary or preference share,
subject to payment of the conversion price. Bonds granted
and converted prior to the share split were entitled to sub-
scribe one ordinary or preference share, conversion after the
share split entitles to three ordinary or preference shares.

175Management Report Report Supervisory Board Management Board Supervisory BoardConsolidated Financial Statements
Consolidated statement of incomeConsolidated balance sheetConsolidated cash flow statement
Consolidated statement of shareholders’ equitySegment ReportingNotes
Glossary
Not
es
Auditor’s Report
Stock Option Plan 1998
During 1998, Fresenius AG adopted the 1998 Plan for mem-
bers of the Management Board and executive employees.
This stock incentive plan was replaced by the 2003 Plan and
no options have been granted since 2003. Under the 1998
Plan, eligible employees have the right to acquire ordinary
and preference shares of Fresenius SE. Options granted
under this plan have a ten-year term, and one third of them
vest on each of the second, third and fourth anniversary of
the grant date. Prior to the share split, one ordinary or one
preference share could be acquired for each option. After
the share split in 2007, each option entitles to acquire three
ordinary or preference shares. The maximum number of
ordinary or preference shares to be issued to the members
of the Management Board or executive employees has been
adjusted accordingly.
Transactions during the year 2008
In 2008, Fresenius SE awarded 1,099,102 stock options,
including 180,600 options to members of the Management
Board of Fresenius SE, at a weighted-average exercise
price of € 52.63, a weighted-average fair value of € 15.15
each and a total fair value of € 17 million, one third of which
will be amortized evenly over three years.
During the fiscal year 2008, Fresenius SE received cash
of € 13 million from the exercise of 482,850 stock options.
The average stock price at the exercise date was € 57.63 for
ordinary shares and € 54.25 for preference shares. The in-
trinsic value of options exercised in 2008 was € 14 million.
At December 31, 2008, out of 644,154 outstanding and
exercisable options issued under the 1998 Plan, 25,800 were
held by the members of the Fresenius SE Management Board.
The number of outstanding stock options issued under the
2003 Plan was 2,997,342, of which 1,258,814 were exercis-
able. The members of the Fresenius SE Management Board
held 514,500 options. Out of 1,099,102 outstanding stock
options issued under the 2008 Plan, 180,600 were held by
the members of the Fresenius SE Management Board.
Stock option transactions are summarized as follows:
Ordinary shares December 31
Number ofoptions
Weighted-average
exercise price in €
Number ofoptions
exercisable
Balance 2006 2,090,406 27.97 855,960
Granted 456,710 56.90
Exercised 405,447 23.90
Forfeited 19,673 32.51
Balance 2007 2,121,996 34.93 822,094
Granted 549,551 53.48
Exercised 241,425 26.31
Forfeited 59,823 37.62
Balance 2008 2,370,299 40.05 951,484
Preference shares December 31
Number ofoptions
Weighted-average
exercise price in €
Number ofoptions
exercisable
Balance 2006 2,090,406 29.21 855,960
Granted 456,710 56.58
Exercised 405,447 25.68
Forfeited 19,673 33.10
Balance 2007 2,121,996 35.74 822,094
Granted 549,551 51.78
Exercised 241,425 27.75
Forfeited 59,823 38.88
Balance 2008 2,370,299 40.21 951,484

Notes176
Notes
Options for ordinary shares
Options outstanding Options exercisable
Range of exercise price in € Number of options
Weighted-averageremaining
contractual lifein years
Weighted-averageexercise price
in € Number of options
Weighted-averageremaining
contractual lifein years
Weighted-averageexercise price
in €
10.01–15.00 129,807 4.50 13.65 129,807 4.50 13.65
15.01–20.00 122,874 3.59 19.64 122,874 3.59 19.64
20.01–25.00 191,878 4.62 22.04 191,878 4.62 22.04
25.01–30.00 312,017 6.45 28.55 190,547 6.41 28.49
30.01–35.00 176,946 2.18 30.74 176,946 2.18 30.74
35.01–40.00 431,706 7.39 39.26 135,439 7.31 38.91
40.01–45.00 50,765 6.92 41.62 0
45.01–50.00 10,662 7.50 48.81 3,993 7.50 48.81
50.01–55.00 498,786 6.58 54.69 0
55.01–60.00 430,706 8.50 56.43 0
70.01–75.00 14,152 8.50 70.54 0
2,370,299 6.33 40.05 951,484 4.77 26.01
The following tables provide a summary of fully vested options outstanding and exercisable for both preference and ordinary
shares at December 31, 2008:
At December 31, 2008, the aggregate intrinsic value of exercis-
able options for ordinary shares and preference shares was
€ 10 million and € 14 million, respectively.
At December 31, 2008, total unrecognized compensation
costs related to non-vested options granted under the 2003
Plan and the 2008 Plan were € 22 million. These costs are
expected to be recognized over a weighted-average period
of 2.2 years.
Options for preference shares
Options outstanding Options exercisable
Range of exercise price in € Number of options
Weighted-averageremaining
contractual lifein years
Weighted-averageexercise price
in € Number of options
Weighted-averageremaining
contractual lifein years
Weighted-averageexercise price
in €
10.01–15.00 141,162 4.50 12.04 141,162 4.50 12.04
15.01–20.00 158,266 5.50 19.00 158,266 5.50 19.00
20.01–25.00 111,519 3.50 21.13 111,519 3.50 21.13
25.01–30.00 345,629 5.87 28.95 224,159 5.53 28.67
30.01–35.00 110,676 2.58 34.73 110,676 2.58 34.73
35.01–40.00 45,552 6.50 38.52 25,402 6.50 38.52
40.01–45.00 452,424 6.62 40.78 176,307 5.24 41.14
45.01–50.00 50,765 6.92 45.40 0
50.01–55.00 509,448 6.60 52.44 3,993 7.50 53.01
55.01–60.00 430,706 8.50 56.11 0
70.01–75.00 14,152 8.50 70.14 0
2,370,299 6.33 40.21 951,484 4.77 27.09
177Management Report Report Supervisory Board Management Board Supervisory BoardConsolidated Financial Statements
Consolidated statement of incomeConsolidated balance sheetConsolidated cash flow statement
Consolidated statement of shareholders’ equitySegment ReportingNotes
Glossary
Not
es
Auditor’s Report
FRESENIUS MEDICAL CARE AG & CO. KGAA
STOCK OPTION PLANS
Stock Option Plan 2006
On May 9, 2006, as amended on May 15, 2007, the Fresenius
Medical Care AG &Co. KGaA Stock Option Plan 2006 (2006
Plan) was established by resolution of FMC-AG & Co. KGaA’s
Annual General Meeting with a conditional capital increase
up to € 15 million subject to the issue of up to 15 million no
par value bearer ordinary shares with a nominal value of
€ 1.00 each. Under the 2006 Plan, up to 15 million options can
be issued, each of which can be exercised to obtain one
ordinary share, with up to three million options designated
for members of the Management Board of Fresenius Medical
Care Management AG (FMC Management AG), the General
Partner, up to three million options designated for members
of management boards of direct or indirect subsidiaries of
FMC-AG & Co. KGaA and up to nine million options designated
for managerial staff members of FMC-AG & Co. KGaA and
such subsidiaries. With respect to participants who are mem-
bers of the FMC Management AG’s Management Board, its
Supervisory Board has sole authority to grant stock options
and exercise other decision making powers under the 2006
Plan (including decisions regarding certain adjustments and
forfeitures). The FMC Management AG’s Management
Board has such authority with respect to all other partici-
pants in the 2006 Plan.
Options under the 2006 Plan can be granted the last Mon-
day in July and/or the first Monday in December. The exer-
cise price of options granted under the 2006 Plan shall be the
average closing price on the Frankfurt Stock Exchange of
FMC-AG & Co. KGaA’s ordinary shares during the 30 calendar
days immediately prior to each grant date. Options granted
under the 2006 Plan have a seven-year term but can be exer-
cised only after a three-year vesting period. The vesting of
options granted is subject to achievement of performance tar-
gets, measured over a three-year period from the grant
date. For each such year, the performance target is achieved
if FMC-AG & Co. KGaA’s adjusted basic income per ordinary
share (EPS), as calculated in accordance with the 2006 Plan,
increases by at least 8% year over year during the vesting
period, beginning with EPS for the year of grant as compared
to EPS for the year preceding such grant. Calculation of EPS
under the 2006 Plan excluded, among other items, the costs
of the transformation of Fresenius Medical Care’s legal form
and the conversion of preference shares into ordinary shares.
For each grant, one-third of the options granted are forfeited
for each year in which EPS does not meet or exceed the 8%
target. The performance targets for 2008 and 2007 were
met. Vesting of the portion or portions of a grant for a year or
years in which the performance target is met does not occur
until completion of the entire three-year vesting period. Upon
exercise of vested options, FMC-AG & Co. KGaA has the right
to reissue treasury shares or issue new shares.
Options granted under the 2006 Plan to US participants
are non-qualified stock options under the United States Inter-
nal Revenue Code of 1986, as amended. Options under the
2006 Plan are not transferable by a participant or a partici-
pant’s heirs, and may not be pledged, assigned, or other-
wise disposed of.
2001 International Stock Option Plan
Under the Fresenius Medical Care 2001 International Stock
Incentive Plan (2001 Plan), options in the form of convertible
bonds with a principal of up to € 12 million were issued to the
members of the Management Board and other employees of
FMC-AG & Co. KGaA representing grants for up to 12 million
non-voting preference shares. The convertible bonds have a
par value of € 1.00 and bear interest at a rate of 5.5%. Except
for the members of the Management Board, eligible employ-
ees may purchase the bonds by issuing a non-recourse note
with terms corresponding to the terms of and secured by the
bond. FMC-AG & Co. KGaA has the right to offset its obligation
on a bond against the employee’s obligation on the related
note; therefore, the convertible bond obligations and employee
note receivables represent stock options issued by FMC-
AG & Co. KGaA and are not reflected in the consolidated finan-
cial statements. The options expire ten years from issuance
and can be exercised beginning two, three or four years after
issuance. Compensation costs related to awards granted
under this plan are amortized on a straight-line basis over

Notes178
Notes
the vesting period for each separately vesting portion of the
awards. Bonds issued to Management Board members who
did not issue a note to FMC-AG & Co. KGaA are recognized as
a liability on the Group’s balance sheet.
Upon issuance of the option, the employees had the right
to choose options with or without a stock price target. The
conversion price of options subject to a stock price target cor-
responds to the stock exchange quoted price of the prefer-
ence shares upon the first time the stock exchange quoted
price exceeds the initial value by at least 25%. The initial
value is the average price of the preference shares during the
last 30 trading days prior to the date of grant. In the case of
options not subject to a stock price target, the number of con-
vertible bonds awarded to the eligible employee would be
15% less than if the employee elected options subject to the
stock price target. The conversion price of the options with-
out a stock price target is the initial value. Each option entitles
the holder thereof, upon payment of the respective conver-
sion price, to acquire one preference share. Effective May
2006, no further grants can be issued under the 2001 Plan
and no options were granted under the 2001 Plan after 2005.
Transactions during the year 2008
During 2008, Fresenius Medical Care awarded 2,523,729
options, including 398,400 to members of the Management
Board of FMC Management AG, at a weighted-average
exercise price of € 35.48, a weighted-average fair value of
€ 9.77 each and a total fair value of € 25 million, which will
be amortized on a straight-line basis over the three-year vest-
ing period.
During 2008, FMC-AG & Co. KGaA received cash of € 25
million from the exercise of stock options and € 5 million
from a related tax benefit. The intrinsic value of options exer-
cised in 2008 was € 18 million.
At December 31, 2008, the Management Board members
of the FMC Management AG, held 2,159,720 stock options
for ordinary shares and employees of FMC-AG & Co. KGaA held
9,120,123 stock options for ordinary shares and 241,776
stock options for preference shares under the various stock-
based compensation plans of Fresenius Medical Care.
The table below provides reconciliations for options
outstanding at December 31, 2008 as compared to Decem-
ber 31, 2007.
Number ofoptions
in thousand
Weighted-average
exercise price in €
Balance at December 31, 2007
(options for ordinary shares) 9,973 26.64
Granted 2,524 35.48
Exercised 1,145 21.27
Forfeited 72 29.82
Balance at December 31, 2008
(options for ordinary shares) 11,280 29.15
Balance at December 31, 2007
(options for preference shares) 275 16.16
Exercised 32 16.01
Forfeited 1 16.42
Balance at December 31, 2008
(options for preference shares) 242 16.18
Numberof options
in thousand
Weighted-average remaining
contractual lifein years
Weighted-averageexercise price
in €
Aggregateintrinsic value
in million €
Options for ordinary shares 3,470 4.50 21.24 42
Options for preference shares 217 3.21 15.49 4
The following table provides a summary of fully vested options outstanding and exercisable for both preference and ordinary
shares at December 31, 2008:

179Management Report Report Supervisory Board Management Board Supervisory BoardConsolidated Financial Statements
Consolidated statement of incomeConsolidated balance sheetConsolidated cash flow statement
Consolidated statement of shareholders’ equitySegment ReportingNotes
Glossary
Not
es
Auditor’s Report
At December 31, 2008, total unrecognized compensation costs
related to non-vested options granted under all plans were
€ 36 million. These costs are expected to be recognized over
a weighted-average period of 1.6 years.
35. RELATED PARTY TRANSACTIONS
Dr.Gerhard Rupprecht, a member of the Supervisory Board
of Fresenius SE, is a member of the management board of
Allianz SE and the chairman of the management board of
Allianz Deutschland AG. Dr. Gerd Krick, chairman of the Super-
visory Board of Fresenius SE, and Dr. Franceso De Meo,
member of the Management Board of Fresenius SE, have been
members of the supervisory board of Allianz Private Kranken-
versicherungs-AG in 2008. In 2008, the Fresenius Group
paid € 7 million for insurance premiums to Allianz. Further-
more, the Fresenius Group paid € 2 million for services in
connection with the commitment relating to the financing for
the APP acquisition to Dresdner Bank. The Dresdner Bank
has been a wholly-owned subsidiary of Allianz until it was
acquired by Commerzbank in January 2009. Moreover, the
Fresenius Group keeps business accounts under customary
conditions with Dresdner Bank.
Dr. Dieter Schenk, deputy chairman of the Supervisory
Board of Fresenius SE, is a partner in the law firm Nörr
Stiefenhofer Lutz that provides legal services to the Fresenius
Group. In 2008, the Fresenius Group paid this law firm € 1
million for services rendered.
Prof. Dr. h. c. Roland Berger, a member of the Supervisory
Board of Fresenius SE, is the chairman of the supervisory
board of Roland Berger Strategy Consultants. In the year 2008,
the Fresenius Group paid this company € 4 million for con-
sulting services rendered.
Klaus-Peter Müller, a member of the Supervisory Board
of Fresenius SE, is the chairman of the supervisory board of
Commerzbank AG. In the year 2008, the Fresenius Group
paid € 2 million for services in connection with the commit-
ment relating to the financing for the APP acquisition to
Commerzbank. Furthermore, the Fresenius Group keeps busi-
ness accounts with Commerzbank under customary conditions.
36. SUBSEQUENT EVENTS
Fresenius US Finance II, Inc. has successfully issued unse-
cured Senior Notes on January 21, 2009.
The Notes comprise separate euro and US dollar tranches.
The euro tranche of € 275 million principal amount has
been issued at a price of 93.024% and has a coupon of 8.75%,
resulting in a yield to maturity of 10.25%. The US dollar
tranche of US$ 500 million principal amount has been issued
at a price of 93.076% and has a coupon of 9.00%, resulting
in a yield to maturity of 10.50%. Both tranches will mature
in 2015 and are non-callable.
Proceeds of the Senior Notes offering in an amount of
approximately US$ 800 million will be used to repay the bridge
credit agreement (see Note 21, Debt and liabilities from
capital lease obligations), to repay other debt and for general
corporate purposes.
With this transaction, the financing of the APP acquisition
is completed.
Other than that, there were no significant changes in the
Group position or environment sector since the end of the
year of 2008. At present, the Fresenius Group is not planning
to carry out any significant changes in its structure, adminis-
tration or legal form or in the area of personnel.

Notes180
Notes
In the fiscal year 2008, stock options based on the Fresenius SE
Stock Option Plan 2008 and the Fresenius Medical Care
AG & Co. KGaA Stock Option Plan 2006 were granted as
components with long-term incentive effects. The principles
of both plans are described in more detail in Note 34, Stock
options.
Notes in accordance with the GermanCommercial Code (HGB)
37. COMPENSATION REPORT
The compensation report of Fresenius SE summarizes the
principles applied for the determination of the compensation
of the members of the Management Board of Fresenius SE
and explains the amounts and structure of the Management
Board compensation. The compensation report is based on
the recommendations of the German Corporate Governance
Code and also includes the disclosures in accordance with
the German Commercial Code extended by the German Act
on the Disclosure of Management Board Compensation.
COMPENSATION OF THE MANAGEMENT BOARD
OF FRESENIUS SE
The personnel committee of the Supervisory Board determines
the compensation of the Management Board. The personnel
committee is composed of the Supervisory Board members
Dr. Gerd Krick, Dr. Karl Schneider and Wilhelm Sachs.
The objective of the compensation system is to enable
the members of the Management Board to participate in the
development of the business relative to their duties and per-
formance and the successes in managing the economic and
the financial position of the Company taking into account its
comparable environment.
The compensation of the Management Board is, as a whole,
performance oriented and consisted of three elements in the
fiscal year 2008:
� non-performance-related compensation (basic salary)
� performance-related compensation (variable bonus)
� components with long-term incentive effects (stock options)
Furthermore, three members of the Management Board had
pension commitments in the reporting period.
The design of the individual components is based on the
following criteria:
The non-performance-related compensation was paid in
twelve monthly installments as basic salary in the fiscal year
2008. In addition, the members of the Management Board
received additional benefits consisting mainly of insurance
premiums, the private use of company cars, special pay-
ments such as rent supplements and reimbursement of cer-
tain other charges as well as contributions to pension and
health insurance.
The performance-related compensation will also be granted
for the fiscal year 2008 as a variable bonus. The amount of
the bonus in each case depends on the achievement of the
individual targets relating to the net income of the Fresenius
Group and its segments. For the total performance-related
compensation, the maximum achievable bonus is fixed.
For the fiscal years 2008 and 2007, the amount of cash
payment of the Management Board of Fresenius SE consisted
of the following:
Non-performance-related compensation
Performance-relatedcompensation
Cash compensation(without long-term
incentive components)
Salary Other1) Bonus
in thousand € 2008 2007 2008 2007 2008 2007 2008 2007
Dr. Ulf M. Schneider 800 800 39 41 1,165 952 2,004 1,793
Rainer Baule 425 425 40 38 900 801 1,365 1,264
Dr. Francesco De Meo (since January 1, 2008) 425 18 490 933
Andreas Gaddum (until December 31, 2007) 325 86 501 912
Dr. Jürgen Götz (since July 1, 2007) 325 162 29 10 360 157 714 329
Dr. Ben Lipps2) 816 766 202 230 963 1,647 1,981 2,643
Stephan Sturm 425 425 84 86 850 701 1,359 1,212
Dr. Ernst Wastler (since January 1, 2008) 375 17 390 782
Total 3,591 2,903 429 491 5,118 4,759 9,138 8,153
1) Includes insurance premiums, private use of company cars, contributions to pension and health insurance as well as other benefits.
2) Dr. Ben Lipps receives his compensation only from Fresenius Medical Care, of which Fresenius SE
held 35.80% of the total subscribed capital. As Dr. Ben Lipps is a member of the Management Board of Fresenius SE, his compensation has to be included in the compensation report of the Fresenius Group.

181Management Report Report Supervisory Board Management Board Supervisory BoardConsolidated Financial Statements
Consolidated statement of incomeConsolidated balance sheetConsolidated cash flow statement
Consolidated statement of shareholders’ equitySegment ReportingNotes
Glossary
Not
es
Auditor’s Report
share of Fresenius Medical Care and has a three years vesting
period.
At the end of the fiscal year 2008, the members of the
Management Board held a total of 720,900 (2007: 540,300)
stock options and convertible bonds of Fresenius SE and
818,411 (2007: 824,280) stock options and convertible bonds
of FMC-AG &Co.KGaA.
The development and the status of the stock options of the
Management Board in the fiscal year 2008 are shown in the
following table:
The stated values of the stock options granted to members of
the Management Board in the fiscal year 2008 correspond to
their fair value at the time of grant, namely a value of € 15.80
(2007: € 19.11) per stock option of Fresenius SE and € 9.80
(2007: € 9.71) per stock option of FMC-AG & Co.KGaA.
As the financial targets of the year 2008 were achieved,
Dr. Ben Lipps is entitled to a stock-based compensation in
an amount of € 425 thousand (2007: € 910 thousand). The
entitlement is based on the development of the ordinary
Long-term incentive components
Stock options and convertible bonds1)
Number Value in thousand €
2008 2007 2008 2007
Dr. Ulf M. Schneider 51,600 43,860 815 838
Rainer Baule 25,800 21,930 408 419
Dr. Francesco De Meo (since January 1, 2008) 25,800 408
Andreas Gaddum (until December 31, 2007) 21,930 419
Dr. Jürgen Götz (since July 1, 2007) 25,800 21,930 408 419
Dr. Ben Lipps 99,600 99,600 976 967
Stephan Sturm 25,800 21,930 408 419
Dr. Ernst Wastler (since January 1, 2008) 25,800 408
Total 280,200 231,180 3,831 3,481
1) Stock options and convertible bonds that were granted in 2008 and 2007 under the stock option plans of Fresenius SE.Dr. Ben Lipps received stock options under the Fresenius Medical Care stock option plan.
For the fiscal years 2008 and 2007, the number and value of convertible bonds and stock options issued is shown in the
following table:
Dr. Ulf M.Schneider
RainerBaule
Dr. FrancescoDe Meo
Dr. JürgenGötz
Dr. BenLipps1)
StephanSturm
Dr. ErnstWastler Total 2)
Options outstanding on January 1, 2008
number 219,300 135,450 30,000 36,930 824,280 87,720 30,900 540,300
average exercise price in € 32.62 30.30 49.13 48.86 22.31 39.52 42.05 35.72
Options granted during fiscal year
number 51,600 25,800 25,800 25,800 99,600 25,800 25,800 180,600
average exercise price in € 53.56 53.56 53.56 53.56 35.49 53.56 53.56 53.56
Options exercised during fiscal year
number 0 0 0 0 105,469 0 0 0
average exercise price in € 17.25
average stock price in € 35.60
Options outstanding on December 31, 2008
number 270,900 161,250 55,800 62,730 818,411 113,520 56,700 720,900
average exercise price in € 36.61 34.02 51.18 50.79 24.57 42.71 47.29 40.19
average remaining life in years 6.5 6.0 7.4 7.4 3.7 7.1 7.0 6.7
range of exercise prices in €13.59
to 57.2713.59
to 57.2740.98
to 57.2729.92
to 57.2714.47
to 35.4929.92
to 57.2721.33
to 57.2713.59
to 57.27
Exercisable options on December 31, 2008
number 131,574 91,584 4,998 6,000 519,611 36,546 10,098 280,800
average exercise price in € 22.84 22.17 40.98 35.45 19.55 32.13 30.94 24.72
1) Dr. Ben Lipps holds stock options under the Fresenius Medical Care stock option plans2) Only stock options and convertible bonds of Fresenius SE, excluding stock options of Dr. Ben Lipps

Notes182
Notes
The following table shows the total compensation for the years 2008 and 2007:
The components with long-term incentive effect can be exer-
cised only after the expiry of the specified vesting period.
Their value is recognized over the vesting period as expense
in the respective fiscal year. The expenses attributable to the
fiscal years 2008 and 2007 are stated in the following table.
Cash compensation (without long-term
incentive components)Long-term
incentive components
Total compensation (including long-term
incentive components)
in thousand € 2008 2007 2008 2007 2008 2007
Dr. Ulf M. Schneider 2,004 1,793 815 838 2,819 2,631
Rainer Baule 1,365 1,264 408 419 1,773 1,683
Dr. Francesco De Meo (since January 1, 2008) 933 408 1,341
Andreas Gaddum (until December 31, 2007) 912 419 1,331
Dr. Jürgen Götz (since July 1, 2007) 714 329 408 419 1,122 748
Dr. Ben Lipps 1,981 2,643 1,401 1,877 3,382 4,520
Stephan Sturm 1,359 1,212 408 419 1,767 1,631
Dr. Ernst Wastler (since January 1, 2008) 782 408 1,190
Total 9,138 8,153 4,256 4,391 13,394 12,544
Expenses for long-term incentive components
in thousand € 2008 2007
Dr. Ulf M. Schneider 714 597
Rainer Baule 357 298
Dr. Francesco De Meo (since January 1, 2008) 68
Andreas Gaddum (until December 31, 2007) 334
Dr. Jürgen Götz (since July 1, 2007) 219 75
Dr. Ben Lipps 1,348 837
Stephan Sturm 383 334
Dr. Ernst Wastler (since January 1, 2008) 68
Total 3,157 2,475
The non-performance related compensation components and
the basic structures of the performance-related compensation
components are agreed in the service agreements with the
individual Management Board members. The stock options
are granted on an annual basis by the personnel committee
of the Supervisory Board to the Management Board.
COMMITMENTS TO MEMBERS OF
THE MANAGEMENT BOARD FOR THE EVENT OF
THE TERMINATION OF THEIR APPOINTMENT
There are individual contractual pension commitments for the
Management Board members Dr. Ulf M. Schneider, Rainer
Baule and Stephan Sturm based on their service agreements.
With regard to these pension commitments, the Fresenius
183Management Report Report Supervisory Board Management Board Supervisory BoardConsolidated Financial Statements
Consolidated statement of incomeConsolidated balance sheetConsolidated cash flow statement
Consolidated statement of shareholders’ equitySegment ReportingNotes
Glossary
Not
es
Auditor’s Report
Group had pension obligations of € 2,787 thousand as of
December 31, 2008 (2007: € 2,028 thousand). The additions
to pension liability in the fiscal year 2008 amounted to
€ 759 thousand (2007: € 275 thousand). Each of the pension
commitments provides a pension and survivor benefit,
depending on the amount of the most recent basic salary,
from the 63rd year of life, or, in the case of termination
because of professional or occupational incapacity, from
the time of ending active work. The starting percentage
of 30% increases with every year of service by 1.5 percent-
age points, 45% being the attainable maximum. 30% of
the gross amount of any later income from an occupation
of the Management Board member is set-off against the
pension.
With the Management Board member Dr. Ben Lipps,
there is an individual agreement, instead of a pension pro-
vision, to the effect that, taking account of a competitive
restriction after the ending of the service agreement between
him and FMC Management AG, he can, for a period of ten
years, act in a consultative capacity for the Company. The
consideration to be granted annually by FMC Management
AG in return would amount to approximately 33% of the
non-performance related compensation components paid to
him in the fiscal year 2008.
The service agreements of the members of the Manage-
ment Board contain no express provisions for the case of
a change of control and for the event of the ending of their
service agreement.
MISCELLANEOUS
In the fiscal year 2008, no loans or advance payments of
future compensation components were made to members of
the Management Board of Fresenius SE.
As far as legally permitted, Fresenius SE undertook to
indemnify the members of the Management Board against
claims against them arising out of their work for the Com-
pany and its affiliates, if such claims exceed their responsi-
bilities under German law. To secure such obligations, the
Company concluded a Directors’&Officers’ insurance with an
appropriate excess. The indemnity applies for the time in
which each member of the Management Board is in office
and for claims in this connection after the ending of the
membership of the Management Board in each case.
At December 31, 2007, Andreas Gaddum resigned from the
Management Board of Fresenius SE. Until the expiration of
his service agreement on June 30, 2008, he received his stip-
ulated non-performance-related compensation in an amount
of € 162,500 as well as related benefits and a performance-
related compensation on a pro rata basis according to the ser-
vice agreement. For the period from July 1, 2008 to June 30,
2009, Andreas Gaddum will obtain a waiting allowance of
€ 262,500 for the agreed non-competition clause.
Based on these agreements and on pension commitments,
to former members of the Management Board and their
surviving dependents, € 1,386 thousand and € 483 thousand
were paid in the years 2008 and 2007, respectively. The
benefit obligation for these persons amounted to € 10,056
thousand in 2008 (2007: € 9,870 thousand).
38. INFORMATION ON THE SUPERVISORY BOARD
The Supervisory Board appoints the members of the Manage-
ment Board and supervises and advises the Management
Board in managing the Company. However, the Supervisory
Board is fundamentally prohibited from managing the
Company in any way. The compensation of the Supervisory
Board is determined by the Annual General Meeting and
is subject to the provisions contained in Section 14 of the
Articles of Association of Fresenius SE. Each member of
the Supervisory Board shall receive a fixed compensation of
€ 13 thousand. The members of the Audit Committee and
the Personnel Committee of the Supervisory Board receive
an additional € 10 thousand each and the Chairman of the
committee a further € 10 thousand. For each full fiscal year,
the remuneration increases by 10% for each percentage
point that the dividend paid on each ordinary share for that
year (gross dividend according to the resolution of the
Annual General Meeting) exceeds 3.6% of the amount equal
to the subscribed capital divided by the number of non-
par value shares; residual amounts are interpolated. The
Chairman receives twice this amount and the deputies
to the Chairman one and a half times the amount of a Super-
visory Board member. All members of the Supervisory
Board receive appropriate compensation for costs of travel
and accommodation incurred in connection with their
duties as members of the Supervisory Board. Fresenius SE
provides to the members of the Supervisory Board insur-
ance coverage in an adequate amount (relating to their func-
tion) and on an adequate excess amount basis.

Notes184
Notes
39. D & O INSURANCE
Fresenius SE has concluded a consequential loss liability
insurance policy (D & O insurance), on an excess amount basis,
for the members of the Management Board and the Super-
visory Board of Fresenius SE and for all representative bodies
of affiliates in Germany and elsewhere. The D&O policy applies
throughout the world and runs until the end of June 2009.
Fixed compensation
Compensation forcommitee services
Variablecompensation
Total compensation
in thousand € 2008 2007 2008 2007 2008 2007 2008 2007
Dr. Gerd Krick 26 26 30 25 173 162 229 213
Dr. Dieter Schenk 20 16 0 0 129 100 149 116
Niko Stumpfögger (since July 16, 2007) 20 8 0 0 129 49 149 57
Prof. Dr. h. c. Roland Berger (since May 21, 2008) 8 0 12 0 53 0 73 0
Gerhard Herres (until July 13, 2007) 0 7 0 0 0 43 0 50
Dario Ilossi (since July 16, 2007) 13 6 0 0 86 38 99 44
Konrad Kölbl (since July 16, 2007) 13 6 10 3 86 38 109 47
Dr. Gabriele Kröner (until May 21, 2008) 5 13 0 0 33 81 38 94
Dr. Bernd Mathieu (until July 13, 2007) 0 7 0 0 0 43 0 50
Klaus-Peter Müller (since May 21, 2008) 8 0 0 0 53 0 61 0
Christel Neumann (until July 13, 2007) 0 7 0 0 0 43 0 50
Ilona Oesterle (until July 13, 2007) 0 7 0 0 0 43 0 50
Dr. Gerhard Rupprecht 13 13 0 0 86 81 99 94
Wilhelm Sachs 13 13 10 3 86 80 109 96
Dr. Karl Schneider 13 13 20 11 86 81 119 105
Stefan Schubert (since July 16, 2007) 13 6 0 0 86 38 99 44
Rainer Stein (since July 16, 2007) 13 6 10 3 86 38 109 47
Volker Weber (until July 13, 2007) 0 10 0 11 0 64 0 85
Dr. Bernhard Wunderlin (until May 21, 2008) 5 13 8 16 33 81 46 110
Total 183 177 100 72 1,205 1,103 1,488 1,352
For the years 2008 and 2007, the compensation for the members of the Supervisory Board of Fresenius SE were as follows:
The policy covers the legal defense costs of a member of a
representative body when a claim is made and, where relevant,
any damages to be paid which are covered by the policy.
40. AUDITOR’S FEES
In 2008 and 2007, fees for the auditor KPMG AG Wirtschafts-
prüfungsgesellschaft were expensed as follows:
2008 2007
in million € Total Germany Total Germany
Audit fees 13 5 11 4
Audit-related fees 2 2 1 –
Tax consulting fees 1 – – –
Other fees – 0 – –
Total auditor’s fees 16 7 12 4
185Management Report Report Supervisory Board Management Board Supervisory BoardConsolidated Financial Statements
Consolidated statement of incomeConsolidated balance sheetConsolidated cash flow statement
Consolidated statement of shareholders’ equitySegment ReportingNotes
Glossary
Not
es
Auditor’s Report
in €
Payment of a dividend of € 0.70 per bearer ordinary share on the 80,571,867 ordinary sharesentitled to dividend 56,400,306.90
Payment of a dividend of € 0.71 per bearer prefe-rence share on the 80,571,867 preference sharesentitled to dividend 57,206,025.57
Additions to other reserves 88,161,179.56
Balance to be carried forward 42,730.64
Retained earnings 201,810,242.67
41. CORPORATE GOVERNANCE
The Management and Supervisory Boards of Fresenius SE
have issued a Declaration of Conformity pursuant to §161 of
the German Stock Corporation Act (AktG) and have made it
available to shareholders. On May 21, 2008 the Management
Board and the Supervisory Board of Fresenius SE declared
in their Declaration of Conformity pursuant to §161 of the
German Stock Corporation Act that the recommendations of
the German Commission on the German Corporate Gover-
nance Code of June 14, 2007, published by the Federal Min-
istry of Justice in the official section of the electronic Federal
Gazette, have been and are being met. The Management
Board and the Supervisory Board of Fresenius SE also intend
to follow the recommendations of the Code in future.
42. PROPOSAL FOR THE DISTRIBUTION
OF EARNINGS
The Management Board of Fresenius SE proposes to
the Annual General Meeting that the earnings for 2008 of
Fresenius SE be distributed as follows:

Notes186
Notes
43. RESPONSIBILITY STATEMENT
“To the best of our knowledge, and in accordance with the applicable reporting principles, the consolidated financial
statements give a true and fair view of the assets, liabilities, financial position and profit or loss of the Group, and the Group
management report includes a fair review of the development and performance of the business and the position of the
Group, together with a description of the principal opportunities and risks associated with the expected development of
the Group.”
Bad Homburg v.d.H., February 26, 2009
The Management Board
Dr. U. M. Schneider R. Baule Dr. F. De Meo
Dr. J. Götz Dr. B. Lipps S. Sturm Dr. E. Wastler

187Management Report Report Supervisory Board Management Board Supervisory BoardConsolidated Financial Statements
Consolidated statement of incomeConsolidated balance sheetConsolidated cash flow statement
Consolidated statement of shareholders’ equitySegment ReportingNotes
Glossary
Aud
itor
’s R
epor
t
Auditor’s Report
AUDITOR’S REPORT
To the Fresenius Societas Europaea, Bad Homburg v.d.Höhe
We have audited the consolidated financial statements prepared by the Fresenius Societas Europaea, Bad Homburg v.d.Höhe,
comprising the balance sheet, the income statement, statement of changes in equity, cash flow statement and the notes to
the consolidated financial statements for the business year from January 1 to December 31, 2008. The preparation of the con-
solidated financial statements in accordance with Accounting Principles Generally Accepted in the United States of America
(US GAAP) are the responsibility of the parent company’s management. Our responsibility is to express an opinion on the con-
solidated financial statements based on our audit. In addition, we have been engaged to express an opinion as to whether
the voluntarily prepared group management report is in agreement with the group management report of Fresenius Societas
Europaea, Bad Homburg v.d.Höhe, prepared in accordance with § 290 and § 315 HGB [Handelsgesetzbuch “German Com-
mercial Code“] apart from appropriate incorporation of US GAAP financial data.
We conducted our audit of the consolidated financial statements in accordance with § 317 HGB and German generally
accepted standards for the audit of financial statements promulgated by the Institut der Wirtschaftsprüfer (IDW). Those
standards require that we plan and perform the audit such that misstatements materially affecting the presentation of the
net assets, financial position and results of operations in the consolidated financial statements in accordance with the
applicable financial reporting framework and in the group management report are detected with reasonable assurance.
Knowledge of the business activities and the economic and legal environment of the Group and expectations as to possible
misstatements are taken into account in the determination of audit procedures. The effectiveness of the accounting-related
internal control system and the evidence supporting the disclosures in the consolidated financial statements and the group
management report are examined primarily on a test basis within the framework of the audit. The audit includes assessing
the annual financial statements of those entities included in consolidation, the determination of entities to be included in
consolidation, the accounting and consolidation principles used and significant estimates made by management, as well as
evaluating the overall presentation of the consolidated financial statements. We believe that our audit provides a reasonable
basis for our opinion.
Our audit has not led to any reservations.
In our opinion, based on the findings of our audit, the consolidated financial statements comply with US GAAP and give
a true and fair view of the net assets, financial position and results of operations of the Group in accordance with these
requirements. The voluntarily prepared group management report is consistent with the consolidated financial statements
prepared in accordance with US GAAP and is, apart from appropriate incorporation of US GAAP financial data, in agree-
ment with the group management report of Fresenius Societas Europaea prepared in accordance with § 290 and § 315 HGB,
on which we issued an unqualified statutory audit opinion. Based on this, the group management report as a whole
provides a suitable view of the Group’s position and suitably presents the opportunities and risks of future development.
Frankfurt am Main, February 26, 2009
KPMG AG
Wirtschaftsprüfungsgesellschaft
(former
KPMG Deutsche Treuhand-Gesellschaft
Aktiengesellschaft
Wirtschaftsprüfungsgesellschaft)
Hölzl Hommel
German Public Auditor German Public Auditor
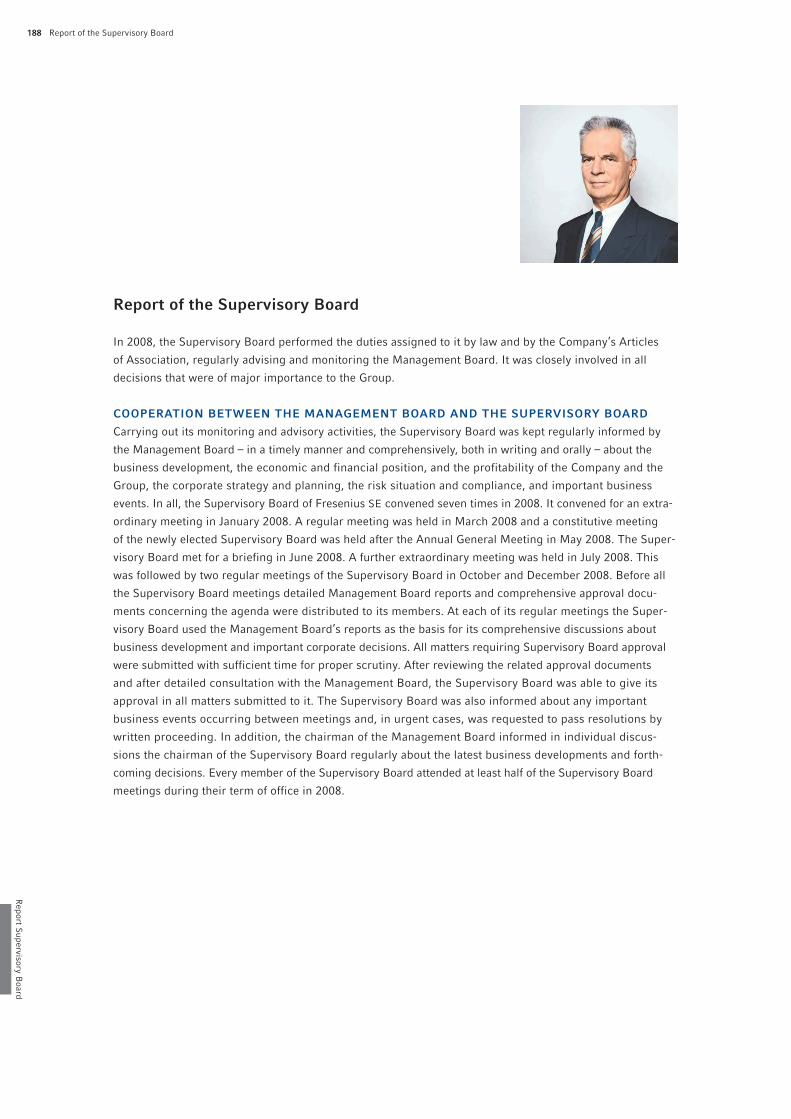
Report of the Supervisory Board188
Report S
upervisory Board
Report of the Supervisory Board
In 2008, the Supervisory Board performed the duties assigned to it by law and by the Company’s Articles
of Association, regularly advising and monitoring the Management Board. It was closely involved in all
decisions that were of major importance to the Group.
COOPERATION BETWEEN THE MANAGEMENT BOARD AND THE SUPERVISORY BOARD
Carrying out its monitoring and advisory activities, the Supervisory Board was kept regularly informed by
the Management Board – in a timely manner and comprehensively, both in writing and orally – about the
business development, the economic and financial position, and the profitability of the Company and the
Group, the corporate strategy and planning, the risk situation and compliance, and important business
events. In all, the Supervisory Board of Fresenius SE convened seven times in 2008. It convened for an extra-
ordinary meeting in January 2008. A regular meeting was held in March 2008 and a constitutive meeting
of the newly elected Supervisory Board was held after the Annual General Meeting in May 2008. The Super-
visory Board met for a briefing in June 2008. A further extraordinary meeting was held in July 2008. This
was followed by two regular meetings of the Supervisory Board in October and December 2008. Before all
the Supervisory Board meetings detailed Management Board reports and comprehensive approval docu-
ments concerning the agenda were distributed to its members. At each of its regular meetings the Super-
visory Board used the Management Board’s reports as the basis for its comprehensive discussions about
business development and important corporate decisions. All matters requiring Supervisory Board approval
were submitted with sufficient time for proper scrutiny. After reviewing the related approval documents
and after detailed consultation with the Management Board, the Supervisory Board was able to give its
approval in all matters submitted to it. The Supervisory Board was also informed about any important
business events occurring between meetings and, in urgent cases, was requested to pass resolutions by
written proceeding. In addition, the chairman of the Management Board informed in individual discus-
sions the chairman of the Supervisory Board regularly about the latest business developments and forth-
coming decisions. Every member of the Supervisory Board attended at least half of the Supervisory Board
meetings during their term of office in 2008.

189
Rep
ort
Sup
ervi
sory
Boa
rd
Management Report Report Supervisory Board Management Board Supervisory BoardConsolidated Financial Statements Glossary
MAIN FOCUS OF THE SUPERVISORY BOARD’S ACTIVITIES
The Supervisory Board’s monitoring and advisory activities were mainly centred on overall business opera-
tions as well as on business segment investments and acquisitions, and any related financing. A focus was
the acquisition of Dabur Pharma in India and APP Pharmaceuticals in the United States. The Supervisory
Board discussed these strategically important acquisitions in detail with the Management Board and care-
fully considered the opportunities and risks. The financing of the APP acquisition through an issue of shares
from authorized capital, an issue of mandatory exchangeable bonds convertible into ordinary shares of
Fresenius Medical Care &Co. KGaA and debt was also discussed with the Management Board and was
approved by the Supervisory Board. After detailed consultations and discussions the Supervisory Board
also approved the 2008 stock option plan for the Management Board and other executive officers.
The Supervisory Board thoroughly reviewed and discussed all other significant business activities with
the Management Board. It approved the budget for 2009 and the Fresenius Group’s medium-term planning,
following a detailed review and discussions with the Management Board. At its regular meetings and within
the Audit Committee, the Supervisory Board also kept itself informed about the Group’s risk situation and
risk management activities as well as compliance.
CORPORATE GOVERNANCE
Further development of corporate governance at Fresenius was reviewed by the Supervisory Board. On
May 21, 2008, the Management Board and the Supervisory Board jointly issued a Declaration of Conformity
in accordance with the German Corporate Governance Code in its version as of June 14, 2007.
For more information on corporate governance at Fresenius, please see the Corporate Governance
Report issued jointly by the Management and Supervisory Boards on pages 22 to 25 of this Annual Report.
WORK OF THE COMMITTEES
The Personnel Committee, which is responsible, among other things, for concluding, amending, and termi-
nating employment contracts with the members of the Management Board, held two meetings and one
conference call.
The Audit Committee held four meetings. There was also one conference call. The main focus of its
activities was on the preliminary audit of the annual financial statements of Fresenius SE and the Group for
2007 and discussions with the auditors about their report and the terms of reference of the audit. The Audit
Committee also reviewed the 2008 quarterly reports and the risk management system, an audit plan as well
as the audit results of the internal audit department and a controlling report on the development of the
acquisitions. The Audit Committee also discussed in detail the effects on the accounting resulting from the
acquisition of APP Pharmaceuticals.

Report of the Supervisory Board190
Report S
upervisory Board
The Supervisory Board delegated the resolutions on the terms of the financing of the APP Pharmaceuticals
acquisition, especially the exercise of the Supervisory Board’s rights of consultation and approval with
regard to the use of the authorized capital pursuant to § 4 (5) of the Articles of Association (Authorized Capital II),
to the special “Transaction Financing APP Pharmaceuticals, Inc.” Committee set up for this purpose.
This committee held several conference calls.
The chairmen of the committees reported regularly to the next Supervisory Board meeting on the work
of the committees.
The Nomination Committee convened and deliberated on the Supervisory Board’s proposals to the
General Meeting for the appointment of the Supervisory Board. The Nomination Committee held three
meetings and several conference calls.
The Mediation Committee has ceased to exist as the German Co-determination Act (MitbestG), which
provided for this committee, does not apply to Fresenius SE.
Information on the present composition of the committees can be found on pages 193 and 194 of this
Annual Report.
PERSONNEL – NOMINATION OF THE MANAGEMENT BOARD AND SUPERVISORY BOARD
The mandates of all members of the Supervisory Board of Fresenius SE ended at the close of the Annual
General Meeting of Fresenius SE on May 21, 2008. We wish to thank the members who left the Supervisory
Board for their valuable work.
The Annual General Meeting elected the members of the Supervisory Board of Fresenius SE anew on
May 21, 2008. The shareholder representatives on the Supervisory Board are Prof. Dr. h. c. Roland Berger,
Dr. Gerd Krick, Klaus-Peter Müller, Dr. Gerhard Rupprecht, Dr. Dieter Schenk and Dr. Karl Schneider. The
employee representatives on the Supervisory Board are Mr. Dario Ilossi, Mr. Konrad Kölbl, Mr.Wilhelm
Sachs, Mr. Stefan Schubert, Mr. Rainer Stein and Mr. Niko Stumpfögger.
At its constitutive meeting on May 21, 2008 the Supervisory Board elected Dr. Gerd Krick as chairman of
the Supervisory Board of Fresenius SE. Dr. Dieter Schenck, nominated by the shareholder representatives,
and Mr. Niko Stumpfögger, nominated by the employee representatives, were elected as deputy chairmen of
the Supervisory Board.
FINANCIAL STATEMENTS AND CONSOLIDATED FINANCIAL STATEMENTS
The accounting records, the financial statements prepared according to the German Commercial Code (HGB)
and the Management Report of Fresenius SE for 2008 were audited by KPMG AG Wirtschaftsprüfungs-
gesellschaft (formerly KPMG Deutsche Treuhand-Gesellschaft Aktiengesellschaft Wirtschaftsprüfungsgesell-
schaft), Berlin. They were elected as auditors at Fresenius SE’s Annual General Meeting on May 21, 2008
and were subsequently commissioned by the Supervisory Board. The auditors issued their unqualified audit
opinion for these statements. The same applies to the consolidated financial statements of Fresenius SE
prepared according to IFRS accounting principles and to the consolidated financial statements of Fresenius
SE prepared voluntarily according to US GAAP.

191
Rep
ort
Sup
ervi
sory
Boa
rd
Management Report Report Supervisory Board Management Board Supervisory BoardConsolidated Financial Statements Glossary
Management Reports were added to the consolidated financial statements. The financial statements, the
consolidated financial statements, the Management Reports, and the auditors’ reports were submitted to each
member of the Supervisory Board of Fresenius SE within the required time. The Supervisory Board noted
and approved the auditors’ findings. The Supervisory Board’s own review found no objections to the finan-
cial statements of Fresenius SE or the consolidated financial statements. The Supervisory Board agrees
with the Management Reports and the statements contained therein with respect to future development.
At its meeting on March 13, 2009, the Supervisory Board approved the financial statements of Fresenius
SE for 2008 as presented by the Management Board, thereby adopting them as official. The Supervisory
Board also approved the consolidated financial statements of Fresenius SE prepared according to IFRS stan-
dards and the consolidated financial statements for 2008 prepared voluntarily according to US GAAP.
The auditors delivered a detailed report on the results of the audit during this meeting. They attended all
meetings of the Supervisory Board and the Audit Committee.
The Supervisory Board concurs with the proposal by the Management Board on the appropriation of the
2008 retained earnings.
The Supervisory Board would like to thank the Management Board and all employees for their out-
standing achievements in a difficult economic environment.
Bad Homburg v.d.H., March 13, 2009
The Supervisory Board
Dr. Gerd Krick
Chairman

Management Board192
MANAGEMENT BOARD
Dr. Ulf M. Schneider
Frankfurt am Main
Chairman
Corporate OfficesSupervisory BoardEufets AG (Chairman)Fresenius HemoCare Netherlands B.V., NetherlandsFresenius Kabi AG (Chairman)Fresenius Kabi Austria GmbH, AustriaFresenius Kabi España S.A., SpainFresenius Medical Care Groupe France S.A.S., France(Chairman)Fresenius Medical Care Management AG (Chairman)HELIOS Kliniken GmbH (Chairman)
Board of DirectorsAPP Pharmaceuticals, Inc., USA (since September 10, 2008)FHC (Holdings), Ltd., Great BritainFresenius Kabi Pharmaceuticals Holding, Inc., USA (since August 14, 2008; Chairman since September 8, 2008)
Rainer Baule
Ettlingen
Business Segment Fresenius Kabi
Corporate OfficesSupervisory BoardCalea Ltd., CanadaFresenius HemoCare Netherlands B.V., Netherlands(Chairman)Fresenius Kabi Austria GmbH, Austria (Chairman)Fresenius Kabi España S.A., SpainLabesfal – Laboratórios Almiro, S.A., Portugal
Administrative BoardFresenius Kabi Groupe France S.A., FranceFresenius Kabi Italia S.p.A., Italy (since January 15, 2008)
Board of DirectorsAPP Pharmaceuticals, Inc., USA (since September 10, 2008)FHC (Holdings) Ltd., Great Britain
Dr. Francesco De Meo
Petersberg
Business Segment Fresenius Helios
Corporate OfficesSupervisory BoardHELIOS Klinikum Bad Saarow GmbH (Chairman)HELIOS Klinikum Emil von Behring GmbH (Chairman)HELIOS Kliniken Krefeld GmbH (since February 1, 2008)HELIOS Kliniken Schwerin GmbH (Chairman)
OfficesSupervisory BoardAllianz Private Krankenversicherungs-AG(since April 16, 2008)
Dr. Jürgen Götz
Bad Soden am Taunus
Chief Legal and Compliance Officer, and
Labor Relations Director
Corporate OfficesSupervisory BoardHELIOS Kliniken GmbH Wittgensteiner Kliniken GmbH (Chairman)
Dr. Ben Lipps
Boston, Massachusetts (USA)
Business Segment Fresenius
Medical Care
Corporate OfficesManagement BoardFresenius Medical Care Management AG (Chairman)
Stephan Sturm
Hofheim am Taunus
Chief Financial Officer
Corporate Offices Supervisory BoardFresenius HemoCare Netherlands B.V., NetherlandsFresenius Kabi AG (Deputy Chairman)Fresenius Kabi España S.A., SpainHELIOS Kliniken GmbHLabesfal – Laboratórios Almiro, S.A., PortugalVAMED AG, Österreich (since March 17, 2008; Deputy Chairman since June 5, 2008)Wittgensteiner Kliniken GmbH
Board of DirectorsFHC (Holdings) Ltd., Great Britain
Dr. Ernst Wastler
Linz, Austria
Business Segment Fresenius Vamed
Corporate OfficesSupervisory BoardCharité CFM Facility Management GmbH (Deputy Chairman)VAMED-KMB Krankenhausmanagement undBetriebsführungsges. m.b.H., Austria (Chairman)

193Management Report Report Supervisory Board Management Board Supervisory BoardConsolidated Financial Statements Glossary
SUPERVISORY BOARD
Dr. Gerd Krick
Königstein
Former Chairman of the
Management Board of Fresenius SE
Chairman
Member of the Audit CommitteeChairman of the Nomination CommitteeChairman of the Personnel Committee
OfficesSupervisory BoardAllianz Private Krankenversicherungs-AG(until April 16, 2008)Fresenius Medical Care AG &Co. KGaA (Chairman)Fresenius Medical Care Management AGVAMED AG, Austria (Chairman)
Advisory BoardHDI Haftpflichtverband der deutschen Industrie V.a.G.(until December 31, 2008)
Prof. Dr. h. c. Roland Berger
(since May 21, 2008)
Munich
Management Consultant
Chairman of the Audit Committee (since May 21, 2008)
OfficesSupervisory BoardHELIOS Kliniken GmbH (until April 30, 2008)Indatex Services for Finance and Insurance AG(until April 8, 2008)Live Holding AG (since June 4, 2008; Deputy Chairman)Prime Office AG (Chairman)Roland Berger Strategy Consultants Holding GmbH(Chairman)Schuler AGSenator Entertainment AGWilhelm von Finck AG (Deputy Chairman)WMP EuroCom AG (Chairman)
Administrative BoardWittelsbacher Ausgleichsfonds
Board of DirectorsFiat S.p.A., ItalyRoland Berger AG, Switzerland (Chairman)Special Purpose Acquisition Company (SPAC) Germany 1Acquisition Limited, Guernsey (since July 21, 2008; Co-Chairman)Telecom Italia S.p.A., Italy (since April 14, 2008)
Dario Anselmo Ilossi
Rome, Italy
Trade Union Officer FEMCA Cisl –
Energy, Fashion and Chemicals
Konrad Kölbl
Hof am Laithagebirge, Austria
Full-time Works Council member
Member of the Manual Workers’ Works
Council VAMED-KMB Krankenhausmana-
gement und Betriebsführungsges. m.b.H.
Chairman of the Group Works Council
VAMED AG
Member of the SE -Works Council
of Fresenius SE
Member of the Audit Committee
Corporate OfficesSupervisory BoardVAMED-KMB Krankenhausmanagement undBetriebsführungsges. m.b.H., Austria
Dr. Gabriele Kröner
(until May 21, 2008)
Berg
Doctor
Klaus-Peter Müller
(since May 21, 2008)
Bad Homburg v.d.H.
Chairman of the Supervisory Board of
Commerzbank AG
OfficesSupervisory BoardCommerzbank AG (since May 15, 2008; Chairman)Eurohypo AG (until November 11, 2008; Chairman)Fraport AG (since May 28, 2008)Linde AGSteigenberger Hotels AG
Administrative BoardAssicurazioni Generali S.p.A., ItalyCommerzbank International S.A., Luxembourg (until April 9, 2008; President)KfW Kreditanstalt für Wiederaufbau Liquiditäts-Konsortialbank GmbH
Board of DirectorsParker Hannifin Corporation, USA
Dr. Gerhard Rupprecht
Gerlingen
Member of the Management Board
Allianz SE
Chairman of the Management Board
Allianz Deutschland AG
OfficesSupervisory BoardAllianz Beratungs- und Vertriebs-AG (Chairman)Allianz Elementar Versicherungs-AG (since February 7, 2008;Chairman since March 3, 2008)Allianz Elementar Lebensversicherungs-AG(since February 7, 2008; Chairman since March 3, 2008)Allianz First Life Insurance Co. Ltd., Korea (until December 31, 2007)Allianz Investmentbank AG (since February 7, 2008; Deputy Chairman since March 3, 2008)Allianz Lebensversicherungs-AG (Chairman)Allianz Private Krankenversicherungs-AG (Chairman)Allianz Suisse Lebensversicherungs-AG, Switzerland (since January 1, 2008)Allianz Suisse Versicherungs-AG, Switzerland (since January 1, 2008)Allianz Versicherungs-AG (Chairman)Heidelberger Druckmaschinen AG
Wilhelm Sachs
Friedrichsdorf
Full-time Works Council member
Deputy Chairman of the Works Council
Friedberg plant
Member of the Joint Works Council
Fresenius SE/Friedberg plant
Chairman of the General Works Council
Fresenius SE
Member of the SE-Works Council of
Fresenius SE
Member of the Personnel Committee

Supervisory Board194
Dr. Dieter Schenk
Munich
Lawyer and tax consultant
Deputy Chairman
Member of the Nomination Committee
OfficesSupervisory BoardFresenius Medical Care AG &Co. KGaA (Deputy Chairman)Fresenius Medical Care Management AG(Deputy Chairman)Gabor Shoes AG (Chairman)Greiffenberger AG (Deputy Chairman)NSL Consulting AG (until September 12, 2008; Chairman)TOPTICA Photonics AG (Chairman)
Administrative BoardElse Kröner-Fresenius-Stiftung (Chairman)
Dr. Karl Schneider
Mannheim
Former Spokesman Südzucker AG
Member of the Audit Committee Member of the Nomination CommitteeMember of the Personnel Committee
OfficesAdministrative BoardElse Kröner-Fresenius-Stiftung (Deputy Chairman)
Stefan Schubert
Limburg-Staffel
Hospital nurse and full-time Works
Council member
Chairman of the Works Council of
HELIOS Klinik Bad Schwalbach,
HELIOS Klinik Idstein and Kreisalten-
zentrum Bad Schwalbach
Chairman of the Group Works Council
of Wittgensteiner Kliniken GmbH
Member of the SE-Works Council of
Fresenius SE
Corporate OfficesSupervisory BoardWittgensteiner Kliniken GmbH
Rainer Stein
Berlin
Full-time Works Council member
Chairman of the Group Works Council
HELIOS Kliniken GmbH
Chairman of the SE-Works Council of
Fresenius SE
Member of the Audit Committee
Corporate OfficesSupervisory BoardHELIOS Kliniken GmbH
Niko Stumpfögger
Zeuthen
Secretary of the Trade Union ver.di,
Betriebs- und Branchenpolitik im
Bereich Gesundheit und Soziales
Deputy Chairman
OfficesSupervisory BoardHELIOS Kliniken GmbH
Dr. Bernhard Wunderlin
(until May 21, 2008)
Bad Homburg v.d.H.
Former Managing Director Harald
Quandt Holding GmbH
Chairman of the Audit Committee (until May 21, 2008)
OfficesSupervisory BoardEquita Management GmbH
Advisory BoardMarsh&McLennan Deutschland GmbHVon Rautenkranz Nachfolger GbR
SUPERVISORY BOARD
195Management Report Report Supervisory Board Management Board Supervisory BoardConsolidated Financial Statements Glossary
GLOSSARY
Health care terms
Administrative data
Data transmitted to sickness funds as part of thebilling process or to federal agencies like theGerman Federal Statistics Office due to legalrequirements. In Germany, this includes informa-tion about coded diagnoses and procedures.
Adsorber systems
These are treatments for selective blood purifica-tion. A housing filled with a specific material (powder/gel) is passed through blood or plasma.The material consists of a solid carrier materialwith a big surface bound to active groups/mole-cules which selectively bind/adsorb harmful sub-stances/pathogens from the blood/plasma.
Albumin
A protein that can be used to monitor a patient’snutritional condition.
Ambix® activ
Infusion pump for the application of parenteralnutrition, which is specially designed for the needsin outpatient care. It offers patients and those caring for them maximum independence thanks to its easy and safe handling.
Antibodies
Antibodies are proteins that bind specifically to aparticular substance, its antigen. Antibodies areknown collectively as immunoglobulins. They areproduced by B-lymphocytes and plasma cells inresponse to infection or immunization, and bind to and neutralize pathogens, thus preparing themfor uptake and destruction of phagocytes.
AOK
Allgemeine Ortskrankenkasse; The AOK isGermany’s largest public health insurance company.
Apheresis
Process of obtaining blood from a donor or patientto separate or remove certain components (throm-bocytes plasma) before re-infuding the remainder.
Ascites
Accumulation of excess fluid in the abdomen dueto disturbed balance of influx and efflux as a resultof a malignant disease.
Blood volume replacement
Infusion solution to compensate blood loss.
CHMP
The Committee for Medicinal Products for HumanUse (CHMP) is responsible for preparing the EMEA’sopinions on all questions concerning medicinalproducts for human use.
Colloids
Blood and plasma substitutes.
Compounding
Mixing of different solutions or components for IVor parental nutrition therapy.
CompoDock Data Management
CompoDock is a device for the sterile connection oftwo PVC blood bag tubes. Sterile means that theclosed system of each bag is maintained during theconnection process, thus no contamination entersfrom the outside. The data management feature, asoftware, allows automatic documentation of thissterile connection process in terms of GMP.
Dialysis
A type of renal replacement therapy where a semi-permeable membrane – in peritoneal dialysis theperitoneum of the patient, and in hemodialysis themembrane of the dialyzer – is used for selectivesolute removal.
Dialysis machine
The hemodialysis process is controlled by a dialy-sis machine which pumps blood, adds anticoagu-lants, regulates the cleansing process, and controlsthe mixture of dialysate and its flow rate throughthe system.
Dialysis solution
Fluid used in the process of dialysis
Dialyzer
Special filter used in hemodialysis for removingtoxic substances and excess water from the blood.
Enteral nutrition
Application of liquid nutrition as a tube or sip feedvia the gastrointestinal tract.
EPO (Erythropoietin)
Hormone that stimulates red blood cell production.Recombinant (i.e. artificially produced) human EPO
is commonly prescribed to patients on dialysis whosuffer from anemia.
Extracorporeal
Taking place outside the body.
Graft-versus-Host-Disease (aGvHD)
Rejection of a transplanted organ, caused by T-cells in the donor graft that attack the hostorganism.
Glossary196
GLOSSARY
HACCP Concept (Hazard Analysis
Critical Control Point)
A process that proves conformity with valid norms.
Hemodiafiltration (HDF)
Special mode of ESRD (end-stage renal disease)treatment, combining advantages of hemodialysisand hemofiltration, i.e. high elimination rates forsmall and large molecular weight substances viadiffusive and convective mechanisms, respectively.
Hemodialysis (HD)
A treatment method for dialysis patients where theblood of the patient is cleansed by a dialyzer. The solute exchange between blood and dialysateis dominated by diffusive processes.
Immunosuppressive agent
Drug that artificially suppresses or weakens theimmune reaction of the organism. It is used in thetreatment of autoimmune diseases or to preventtransplanted organs being rejected.
Infusion disposables
Single-use medical devices for the administrationof infusion solutions or IV drugs to a patient.
Infusion management system
A modular infusion system, consisting of infusionand syringe pumps, which allows the simultaneousadministration of different intravenously adminis-tered drugs and infusion solutions and at the sametime records the infused volume.
INN (International non-proprietary name)
Official non-proprietary or generic name given to a pharmaceutical substance, as designated by theWorld Health Organization (WHO).
Intraperitoneal
Administration of a drug directly into the peritonealcavity.
KabiPac®
The KabiPac® plastic bottle is a new primary con-tainer for infusion solutions. It is designed for safeand easy handling, and is light, break-proof andimpermeable to oxygen and air. Other advantagesare offered by the two separate ports. As both theinfusion port and the injection port are sterileinside, the ports do not need to be disinfectedbefore they are used for the first time.
Lipid emulsions
Lipid emulsions are elements of parenteral nutritionand primarily provide energy and essential fattyacids.
Parenteral nutrition
Application of nutrients directly into the blood-stream of the patient (intravenously).
Peritoneal dialysis (PD)
Dialysis treatment method using the patient’speritoneum as a “filter” to cleanse his blood.
Polyclonal antibodies
Antibodies that recognize one specific structure,but are produced by different cell clones.
Port
A fully implantable subcutaneous small housingwith membrane and catheter for chemotherapy,infusion therapy, parenteral nutrition etc.
Prevalence
The prevalence of a disease in a statistical popula-tion is defined as the total number of cases of thedisease in the population at a given time, or thetotal number of cases in the population, divided bythe number of individuals in the population.
Single-use dialyzer
Dialyzer which is not used several times (re-use)but only one single time.
Trifunctional antibodies
Antibodies that bind to three different cell types inparallel (e. g. tumor cells, T-cells and accessorycells) resulting in a tumor-specific immune reaction.
Triglyceride
Fats made up of one glycerine molecule and threefatty acids.
Volumetric pumps
Electronic pumps for intravenous infusion of fluidsand drugs for parental nutrition with high accuracy(volumetric-based)
Health care terms

197
Beta factor
The beta factor shows the correlation of a share to a specific index. ß > 1 means: the share is fluctuating more than the index.ß = 1 means: the share movements are in line with the index.ß < 1 means: the share is fluctuating less than the index.
Commercial paper program
Is short-term unsecured promissory notes issuedby corporations in need of short-term loans.Typically commercial paper maturities range froma few days up to under two years.
EBIT
Earnings before interest and income taxes.
EBITDA
Earnings before interest, income taxes, deprecia-tion and amortization.
Gearing
Net debt to equity ratio, including minority interest.
ROE (Return on Equity)
The ROE measures a corporation’s profitability thatreveals how much profit a company generates withthe money shareholders have invested.ROE = fiscal year’s net income/total equity x 100.
ROIC (Return on Invested Capital)
Calculated by:(EBIT – taxes): Invested capitalInvested capital = total assets + amortization ofgoodwill (accumulated) – deferred tax assets –cash and cash equivalents – trade accountspayable – accruals (without pension accruals) –other liabilities not bearing interest.
ROOA (Return on Operating Assets)
Calculated by:EBIT x 100: operating assets (average)Operating assets = total assets – deferred tax
assets – trade accounts payable – paymentsreceived on account – approved subsidies.
SE (Societas Europaea)
The SE is the legal form of a European stock cor-poration. The supranational legal entity is basedon the European Community law. Subject to the European regulations, the SE is treated in allmember states of the European Union as a stockcorporation according to the national law of themember state in which the SE is incorporated.
US GAAP
United States Generally Accepted AccountingPrinciples.
Working Capital
Current assets (including deferred assets) –accruals – trade accounts payable – other liabilities – deferred charges.
Products and services
Management Report Report Supervisory Board Management Board Supervisory BoardConsolidated Financial Statements Glossary
Financial terms
ATG-Fresenius (anti T-lymphocyte globulin)
Protein which suppresses T-lymphocytes.
FX-class dialyzer
A new generation of dialyzers with increasedperformance and outstanding biocompatibility.Helixone® capillaries with their special three-dimensional microwave structure are built in high capillary density into a specifically-designed
housing which, among other benefits, leads to an optimized flow distribution within the dialyzer.
Three chamber bag
The three chamber bag contains all the macronu-trients like – amino acids, glucose, lipids and aswell electrolytes in three separate chambers. Onebag includes concentrated solutions covering apatient’s daily nutritional requirements. Immediately
before infusion all nutrients are mixed thoroughlywithin the bag simply by opening individual cham-bers. This reduces the risk of contamination andsaves time when preparing the infusions.

Index198
A
Accounting and valuation principles 119 ff.Acquisitions 34 f., 40 f., 80 f., 130 ff.Analyst recommendation 19Annual General Meeting 22Antibody therapies 53 ff.Approved capital 160Asset and capital structure 81 f.Asset and liabilities 81 f.Articles of association 61 ff.
B
Balance sheet structure 15, 81 ff.Business activity 59 ff.Business development 65 ff.
C
Cancer 34 f., 53 f., 105Capital 61 f.Capital increase 18, 61 f., 78, 159Cash and cash equivalents 108, 138Cash flow 15, 80, 110 f., 170 f.Cash flow statement 80, 110 f. Clinical nutrition 36 f., 51 ff.Compensation of Management Board and Supervisory Board 180 ff.Conditional capital 160 f.Corporate Governance 22 ff., 185, 189Corporate performance criteria 62 f.Currency and interest risk management 83, 168 f.Currency translation 60 f., 72 f., 126Current assets 81 f., 108
D
Dialysis care 27 f.Dialysis products 28 f.Distribution of earnings 185Dividend 19, 20, 80, 161
E
Earnings 14, 74 f.Earnings per share 20, 137Employees 47 ff., 83 f., 133Employee participation 49Enteral nutrition 36 f., 52 f., 195
Entities to be consolidated 120 f.Environment 54 ff.Equity ratio 15, 82, 170
F
Financial position 77 ff.Financing 77 ff., 166 ff.Fresenius Biotech 53 ff.
G
Group structure 59 ff., 119
H
Hemodialysis 50Health care industry 67 ff.
I
Infusion therapy 35 f., 51 f.Interest result 14, 76, 134Inventories 138 f.Investments 80Investor Relations 20 f.
M
Management Board 22, 192Market capitalization 18, 20Minority interest 109, 159
N
Net income 14, 74, 107Net interest 14, 76, 134Non-current assets 81, 108
O
Operating cash flow 15, 80, 110 f., 114 f.Opportunities management 90Outlook 97 ff.
P
Parenteral nutrition 36 f., 52 f., 196Pensions 109, 112 f., 154 ff.Peritoneal dialysis 29, 51Personnel expenses 84, 133Procurement 84 ff.
Q
Quality management 86 ff.
R
Rating 96Renal pharmaceuticals 29 f.Research and development 50 ff., 64 f., 105Risk management/risk areas 90 ff.ROE - Return on equity InsideROIC - Return on invested capital cover, ROOA - Return on operating assets 62, 197Results of operations 72 ff.
S
Sales 14, 72 ff., 102 f., 133SE Conversion 59, 105Segment reporting 114, 171Single-use dialyzer 28, 196Share 16Shareholder structure 19Share price development 17 f.Stock option plan 49, 173 ff.Strategy 62 ff.Subsequent events 97Supervisory Board 22 f., 183 f., 193 f.Supervisory Board Committees 23 f., 193 f.
T
Training 49 Transfusion technology 33 ff.Transplantation 54
V
Value added 76 f.Vocational training 49
W
Working capital 80, 197
INDEX
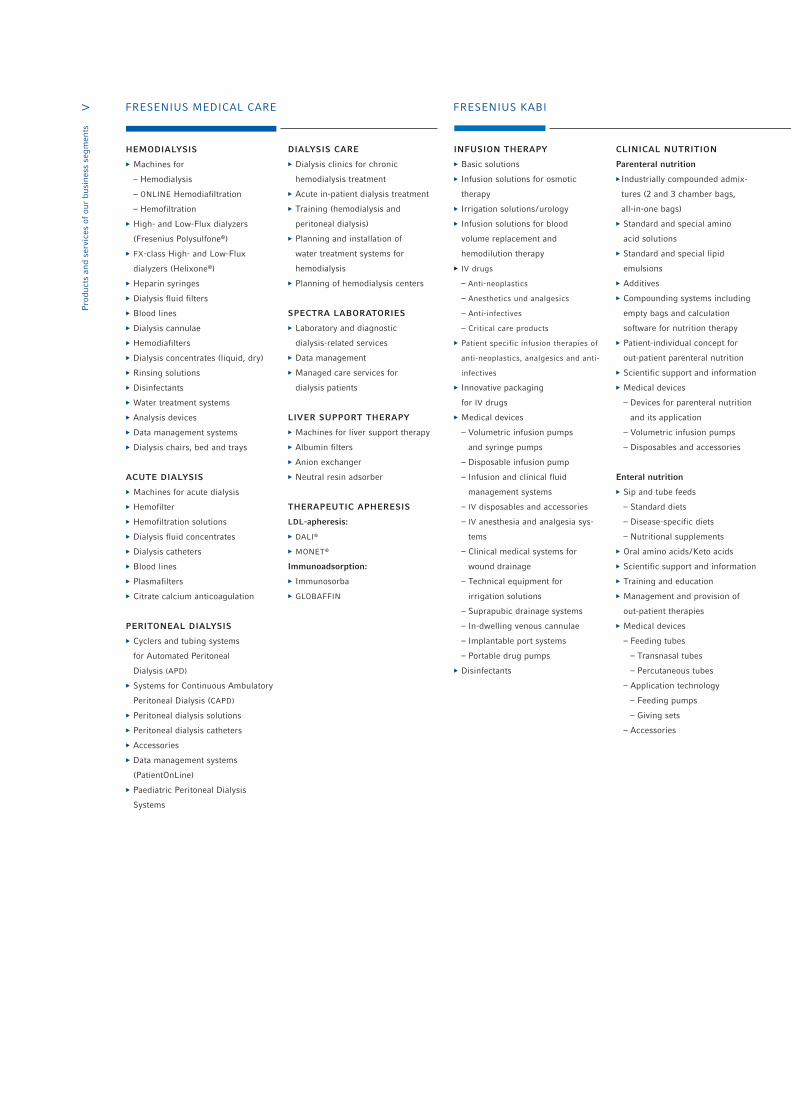
>
Pro
duct
s an
d se
rvic
es o
f ou
r bu
sine
ss s
egm
ents
FRESENIUS MEDICAL CARE FRESENIUS KABI
HEMODIALYSIS
� Machines for
– Hemodialysis
– ONLINE Hemodiafiltration
– Hemofiltration
� High- and Low-Flux dialyzers
(Fresenius Polysulfone®)
� FX-class High- and Low-Flux
dialyzers (Helixone®)
� Heparin syringes
� Dialysis fluid filters
� Blood lines
� Dialysis cannulae
� Hemodiafilters
� Dialysis concentrates (liquid, dry)
� Rinsing solutions
� Disinfectants
� Water treatment systems
� Analysis devices
� Data management systems
� Dialysis chairs, bed and trays
ACUTE DIALYSIS
� Machines for acute dialysis
� Hemofilter
� Hemofiltration solutions
� Dialysis fluid concentrates
� Dialysis catheters
� Blood lines
� Plasmafilters
� Citrate calcium anticoagulation
PERITONEAL DIALYSIS
� Cyclers and tubing systems
for Automated Peritoneal
Dialysis (APD)
� Systems for Continuous Ambulatory
Peritoneal Dialysis (CAPD)
� Peritoneal dialysis solutions
� Peritoneal dialysis catheters
� Accessories
� Data management systems
(PatientOnLine)
� Paediatric Peritoneal Dialysis
Systems
DIALYSIS CARE
� Dialysis clinics for chronic
hemodialysis treatment
� Acute in-patient dialysis treatment
� Training (hemodialysis and
peritoneal dialysis)
� Planning and installation of
water treatment systems for
hemodialysis
� Planning of hemodialysis centers
SPECTRA LABORATORIES
� Laboratory and diagnostic
dialysis-related services
� Data management
� Managed care services for
dialysis patients
LIVER SUPPORT THERAPY
� Machines for liver support therapy
� Albumin filters
� Anion exchanger
� Neutral resin adsorber
THERAPEUTIC APHERESIS
LDL-apheresis:
� DALI®
� MONET®
Immunoadsorption:
� Immunosorba
� GLOBAFFIN
INFUSION THERAPY
� Basic solutions
� Infusion solutions for osmotic
therapy
� Irrigation solutions/urology
� Infusion solutions for blood
volume replacement and
hemodilution therapy
� IV drugs
– Anti-neoplastics
– Anesthetics und analgesics
– Anti-infectives
– Critical care products
� Patient specific infusion therapies of
anti-neoplastics, analgesics and anti-
infectives
� Innovative packaging
for IV drugs
� Medical devices
– Volumetric infusion pumps
and syringe pumps
– Disposable infusion pump
– Infusion and clinical fluid
management systems
– IV disposables and accessories
– IV anesthesia and analgesia sys-
tems
– Clinical medical systems for
wound drainage
– Technical equipment for
irrigation solutions
– Suprapubic drainage systems
– In-dwelling venous cannulae
– Implantable port systems
– Portable drug pumps
� Disinfectants
CLINICAL NUTRITION
Parenteral nutrition
� Industrially compounded admix-
tures (2 and 3 chamber bags,
all-in-one bags)
� Standard and special amino
acid solutions
� Standard and special lipid
emulsions
� Additives
� Compounding systems including
empty bags and calculation
software for nutrition therapy
� Patient-individual concept for
out-patient parenteral nutrition
� Scientific support and information
� Medical devices
– Devices for parenteral nutrition
and its application
– Volumetric infusion pumps
– Disposables and accessories
Enteral nutrition
� Sip and tube feeds
– Standard diets
– Disease-specific diets
– Nutritional supplements
� Oral amino acids/Keto acids
� Scientific support and information
� Training and education
� Management and provision of
out-patient therapies
� Medical devices
– Feeding tubes
– Transnasal tubes
– Percutaneous tubes
– Application technology
– Feeding pumps
– Giving sets
– Accessories

TRANSFUSION TECHNOLOGY
� Blood bags
� Blood bag systems with in-line
filters
� Leukocyte filters
� Cryopreservation systems
� Mixing devices
� Cooling and transportation systems
� Automatic blood component
processing systems
� Sealing devices
� Sterile docking devices
� Platelet shakers
� Hemoglobin measuring device
� Blood cell separators for
– Hemapheresis
– Therapeutic apheresis
� Stem cell bags
� Solutions
� Autotransfusion
HELIOS KLINIKEN GROUP
� Group of clinics with acute care
hospitals for all medical disciplines
� High quality medical treatment
of patients at all levels of care, up
to maximum care
� Operation and management of
postacute care hospitals
VAMED GROUP
Worldwide projects and services
for health facilities:
� Feasibility studies
� Operational and organisational
planning
� IT planning
� Architectural planning
� Planning of medical-technical
equipment
� Complete medical-technical and
technical equipment/packages
� Medical-technical maintenance
� Building technology planning
� Facility management
� Project development and
management
� Turn-key projects
� Financial engineering
� PPP projects
� General and technical management
of health facilities
BIOTECHNOLOGY
� Immunosuppressive agent
ATG-Fresenius S
� Fluids and disposables for organ
perfusion and preservation
� Cell and gene therapy products for
research and clinical development
� Vector production gene therapy
FRESENIUS HELIOS FRESENIUS VAMED FRESENIUS BIOTECH

Report on 1st quarter 2009
Conference call
Live webcast April 30, 2009
Annual General Meeting, Frankfurt am Main, Germany May 8, 2009
Payment of dividend* May 11, 2009
Report on 1st half 2009
Conference call
Live webcast August 4, 2009
Report on 1st –3rd quarters 2009
Conference call
Live webcast November 3, 2009
* subject to the prior approval by the Annual General Meeting
Design concept /Realization: Hilger&Boie Design, Wiesbaden, GermanyPrint: Ziegler GmbH&Co KG, Neckarbischofsheim, Germany
Ordinary share Preference share
Securities identification no. 578 560 578 563
Ticker symbol FRE FRE3
ISIN DE0005785604 DE0005785638
Bloomberg symbol FRE GR FRE3 GR
Reuters symbol FREG.de FREG_p.de
Main trading location Frankfurt /Xetra Frankfurt /Xetra
FINANCIAL CALENDAR
FRESENIUS SHARE INFORMATION
Fresenius SE’s Annual Report was published on March 18, 2009 at our website http://www.fresenius.com.
Corporate Head Office
Else-Kröner-Straße 1Bad Homburg v. d. H.Germany
Postal address
Fresenius SE
61346 Bad Homburg v. d. H.Germany
Contact for shareholders
Investor RelationsTelephone: ++ 496172 608-2637Telefax: ++ 496172 608-2488e-mail: [email protected]
Contact for journalists
Corporate CommunicationsTelephone: ++ 496172 608-2302Telefax: ++ 496172 608-2294e-mail: [email protected]
Commercial Register: Amtsgericht Bad Homburg v.d.H.; HRB 10660 Management Board: Dr. Ulf M. Schneider (President and CEO), Rainer Baule, Dr. Francesco De Meo, Dr. Jürgen Götz, Dr. Ben Lipps, Stephan Sturm, Dr. Ernst Wastler Chairman of the Supervisory Board: Dr. Gerd Krick
The German version of this Annual Report is legally binding.
The financial statements of Fresenius SE and the consolidated statements in accordance with IFRS accounting principles are available on our websiteand may be obtained upon request at Investor Relations.You will find further information and current news about our company on our website at: http://www.fresenius.com
Forward-looking statements:This Annual Report contains forward-looking statements. These statements represent assessments which we have made on the basis of the informationavailable to us at the time. Should the assumptions on which the statements are based on not occur, or if risks should arise – as mentioned in the riskreport and the SEC filings of Fresenius Medical Care AG & Co.KGaA and Fresenius Kabi Holdings, Inc. – the actual results could differ materially from theresults currently expected.