Seismotectonics of the Zagros (Iran) from orogen-wide earthquake...
25
Final Project Report, NSF Award 1524815 Seismotectonics of the Zagros (Iran) from orogen-wide earthquake relocations Edwin Nissen 1,2 & Ezgi Karas¨ ozen 2 1 School of Earth and Ocean Sciences, University of Victoria, Victoria, BC, Canada 2 Department of Geophysics, Colorado School of Mines, Golden, CO 03/15/2016–02/28/2019 Note: this final report is modifed and abridged from our recent paper: Karas¨ ozen, E., Nissen, E., Bergman, E. A., and Ghods, A. (2019). Seismotectonics of the Zagros (Iran) From Orogen-Wide, Calibrated Earthquake Relocations. Journal of Geophysical Research: Solid Earth, https://doi.org/10.1029/2019JB017336. This related paper was also supported directly through this NSF award: Nissen, E., Ghods, A., Karas¨ ozen, E., Elliott, J. R., Barnhart, W. D., Bergman, E. A., Hayes, G. P., Jamal-Reyhani, M., Nemati, M., Tan, F., Abdulnaby, W., Benz, H. M., Shahvar, M. P., Talebian, M., and Chen, L. (2019). The 12 November 2017 M w 7.3 Ezgeleh-Sarpolzahab (Iran) earthquake and active tectonics of the Lurestan arc. Journal of Geophysical Research: Solid Earth, 124, 2124-2152. Summary We use calibrated earthquake relocations to reassess the distribution and kinematics of faulting in the Zagros range, southwestern Iran. This is amongst the most seismically-active fold-and- thrust belts globally, but knowledge of its active faulting is hampered by large errors in reported epicenters and controversy over earthquake depths. Mapped coseismic surface faulting is extremely rare, with most seismicity occurring on blind reverse faults buried beneath or within a thick, folded sedimentary cover. Therefore, the distribution of earthquakes provides vital information about the location of active faulting at depth. Using an advanced multi-event relocation technique we relocate ∼2500 earthquakes across the Zagros mountains spanning the ∼70 year instrumental record. Relocated events have epicentral uncertainties of 2–5 km; for ∼1100 of them we also constrain origin time and focal depth, often to better than 5 km. Much of the apparently diffuse catalog seismicity now collapses into discrete trends highlighting major active faults. This reveals several zones of unmapped faulting, including possible conjugate left-lateral faults in the central Zagros. It also confirms the activity of faults mapped previously on the basis of geomorphology, including oblique (dextral-normal) faulting in the NW Zagros. We observe a primary difference between the Lurestan arc, where seismicity is focused close to the topographic range front, and the Fars arc, where out-of-sequence thrusting is evident over a width of ∼100–200 km. We establish a focal depth range of 4–25 km, confirming earlier suggestions that earthquakes are restricted to the upper crust but nucleate both within and beneath the sedimentary cover. 1
Transcript of Seismotectonics of the Zagros (Iran) from orogen-wide earthquake...

Final Project Report, NSF Award 1524815
Seismotectonics of the Zagros (Iran) from orogen-wide earthquakerelocations
Edwin Nissen1,2 & Ezgi Karasozen2
1 School of Earth and Ocean Sciences, University of Victoria, Victoria, BC, Canada2 Department of Geophysics, Colorado School of Mines, Golden, CO
03/15/2016–02/28/2019
Note: this final report is modifed and abridged from our recent paper:
Karasozen, E., Nissen, E., Bergman, E. A., and Ghods, A. (2019). Seismotectonics of the Zagros(Iran) From Orogen-Wide, Calibrated Earthquake Relocations. Journal of Geophysical Research:Solid Earth, https://doi.org/10.1029/2019JB017336.
This related paper was also supported directly through this NSF award:
Nissen, E., Ghods, A., Karasozen, E., Elliott, J. R., Barnhart, W. D., Bergman, E. A., Hayes,G. P., Jamal-Reyhani, M., Nemati, M., Tan, F., Abdulnaby, W., Benz, H. M., Shahvar, M. P.,Talebian, M., and Chen, L. (2019). The 12 November 2017 Mw 7.3 Ezgeleh-Sarpolzahab (Iran)earthquake and active tectonics of the Lurestan arc. Journal of Geophysical Research: Solid Earth,124, 2124-2152.
Summary
We use calibrated earthquake relocations to reassess the distribution and kinematics of faultingin the Zagros range, southwestern Iran. This is amongst the most seismically-active fold-and-thrust belts globally, but knowledge of its active faulting is hampered by large errors in reportedepicenters and controversy over earthquake depths. Mapped coseismic surface faulting is extremelyrare, with most seismicity occurring on blind reverse faults buried beneath or within a thick,folded sedimentary cover. Therefore, the distribution of earthquakes provides vital informationabout the location of active faulting at depth. Using an advanced multi-event relocation techniquewe relocate ∼2500 earthquakes across the Zagros mountains spanning the ∼70 year instrumentalrecord. Relocated events have epicentral uncertainties of 2–5 km; for ∼1100 of them we alsoconstrain origin time and focal depth, often to better than 5 km. Much of the apparently diffusecatalog seismicity now collapses into discrete trends highlighting major active faults. This revealsseveral zones of unmapped faulting, including possible conjugate left-lateral faults in the centralZagros. It also confirms the activity of faults mapped previously on the basis of geomorphology,including oblique (dextral-normal) faulting in the NW Zagros. We observe a primary differencebetween the Lurestan arc, where seismicity is focused close to the topographic range front, and theFars arc, where out-of-sequence thrusting is evident over a width of ∼100–200 km. We establish afocal depth range of 4–25 km, confirming earlier suggestions that earthquakes are restricted to theupper crust but nucleate both within and beneath the sedimentary cover.
1
1 Major goals
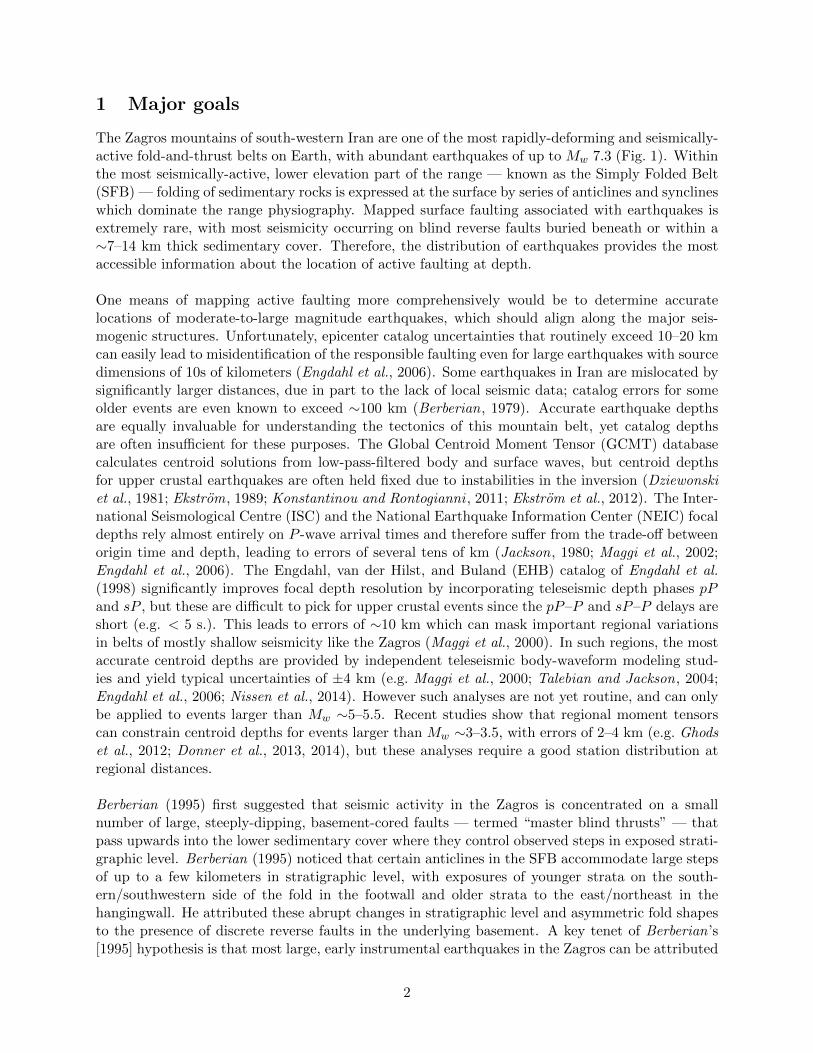
The Zagros mountains of south-western Iran are one of the most rapidly-deforming and seismically-active fold-and-thrust belts on Earth, with abundant earthquakes of up to Mw 7.3 (Fig. 1). Withinthe most seismically-active, lower elevation part of the range — known as the Simply Folded Belt(SFB) — folding of sedimentary rocks is expressed at the surface by series of anticlines and synclineswhich dominate the range physiography. Mapped surface faulting associated with earthquakes isextremely rare, with most seismicity occurring on blind reverse faults buried beneath or within a∼7–14 km thick sedimentary cover. Therefore, the distribution of earthquakes provides the mostaccessible information about the location of active faulting at depth.
One means of mapping active faulting more comprehensively would be to determine accuratelocations of moderate-to-large magnitude earthquakes, which should align along the major seis-mogenic structures. Unfortunately, epicenter catalog uncertainties that routinely exceed 10–20 kmcan easily lead to misidentification of the responsible faulting even for large earthquakes with sourcedimensions of 10s of kilometers (Engdahl et al., 2006). Some earthquakes in Iran are mislocated bysignificantly larger distances, due in part to the lack of local seismic data; catalog errors for someolder events are even known to exceed ∼100 km (Berberian, 1979). Accurate earthquake depthsare equally invaluable for understanding the tectonics of this mountain belt, yet catalog depthsare often insufficient for these purposes. The Global Centroid Moment Tensor (GCMT) databasecalculates centroid solutions from low-pass-filtered body and surface waves, but centroid depthsfor upper crustal earthquakes are often held fixed due to instabilities in the inversion (Dziewonskiet al., 1981; Ekstrom, 1989; Konstantinou and Rontogianni , 2011; Ekstrom et al., 2012). The Inter-national Seismological Centre (ISC) and the National Earthquake Information Center (NEIC) focaldepths rely almost entirely on P -wave arrival times and therefore suffer from the trade-off betweenorigin time and depth, leading to errors of several tens of km (Jackson, 1980; Maggi et al., 2002;Engdahl et al., 2006). The Engdahl, van der Hilst, and Buland (EHB) catalog of Engdahl et al.(1998) significantly improves focal depth resolution by incorporating teleseismic depth phases pPand sP , but these are difficult to pick for upper crustal events since the pP–P and sP–P delays areshort (e.g. < 5 s.). This leads to errors of ∼10 km which can mask important regional variationsin belts of mostly shallow seismicity like the Zagros (Maggi et al., 2000). In such regions, the mostaccurate centroid depths are provided by independent teleseismic body-waveform modeling stud-ies and yield typical uncertainties of ±4 km (e.g. Maggi et al., 2000; Talebian and Jackson, 2004;Engdahl et al., 2006; Nissen et al., 2014). However such analyses are not yet routine, and can onlybe applied to events larger than Mw ∼5–5.5. Recent studies show that regional moment tensorscan constrain centroid depths for events larger than Mw ∼3–3.5, with errors of 2–4 km (e.g. Ghodset al., 2012; Donner et al., 2013, 2014), but these analyses require a good station distribution atregional distances.
Berberian (1995) first suggested that seismic activity in the Zagros is concentrated on a smallnumber of large, steeply-dipping, basement-cored faults — termed “master blind thrusts” — thatpass upwards into the lower sedimentary cover where they control observed steps in exposed strati-graphic level. Berberian (1995) noticed that certain anticlines in the SFB accommodate large stepsof up to a few kilometers in stratigraphic level, with exposures of younger strata on the south-ern/southwestern side of the fold in the footwall and older strata to the east/northeast in thehangingwall. He attributed these abrupt changes in stratigraphic level and asymmetric fold shapesto the presence of discrete reverse faults in the underlying basement. A key tenet of Berberian’s[1995] hypothesis is that most large, early instrumental earthquakes in the Zagros can be attributed
2
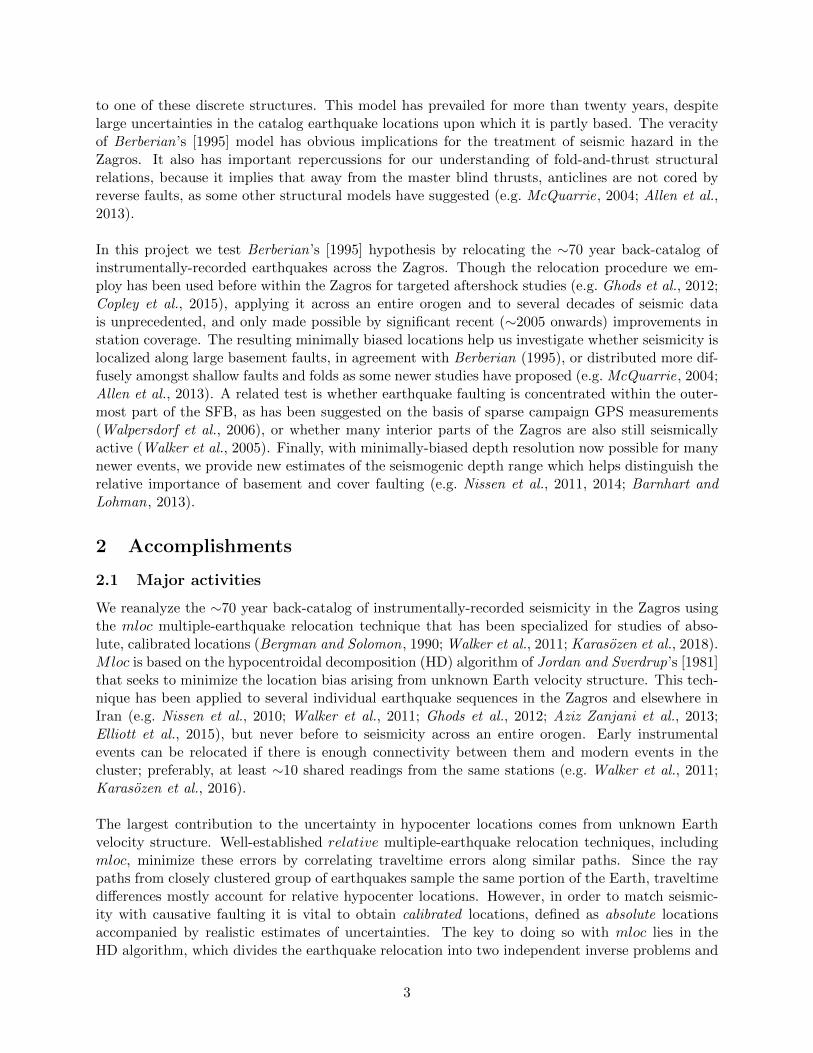
to one of these discrete structures. This model has prevailed for more than twenty years, despitelarge uncertainties in the catalog earthquake locations upon which it is partly based. The veracityof Berberian’s [1995] model has obvious implications for the treatment of seismic hazard in theZagros. It also has important repercussions for our understanding of fold-and-thrust structuralrelations, because it implies that away from the master blind thrusts, anticlines are not cored byreverse faults, as some other structural models have suggested (e.g. McQuarrie, 2004; Allen et al.,2013).
In this project we test Berberian’s [1995] hypothesis by relocating the ∼70 year back-catalog ofinstrumentally-recorded earthquakes across the Zagros. Though the relocation procedure we em-ploy has been used before within the Zagros for targeted aftershock studies (e.g. Ghods et al., 2012;Copley et al., 2015), applying it across an entire orogen and to several decades of seismic datais unprecedented, and only made possible by significant recent (∼2005 onwards) improvements instation coverage. The resulting minimally biased locations help us investigate whether seismicity islocalized along large basement faults, in agreement with Berberian (1995), or distributed more dif-fusely amongst shallow faults and folds as some newer studies have proposed (e.g. McQuarrie, 2004;Allen et al., 2013). A related test is whether earthquake faulting is concentrated within the outer-most part of the SFB, as has been suggested on the basis of sparse campaign GPS measurements(Walpersdorf et al., 2006), or whether many interior parts of the Zagros are also still seismicallyactive (Walker et al., 2005). Finally, with minimally-biased depth resolution now possible for manynewer events, we provide new estimates of the seismogenic depth range which helps distinguish therelative importance of basement and cover faulting (e.g. Nissen et al., 2011, 2014; Barnhart andLohman, 2013).
2 Accomplishments
2.1 Major activities
We reanalyze the ∼70 year back-catalog of instrumentally-recorded seismicity in the Zagros usingthe mloc multiple-earthquake relocation technique that has been specialized for studies of abso-lute, calibrated locations (Bergman and Solomon, 1990; Walker et al., 2011; Karasozen et al., 2018).Mloc is based on the hypocentroidal decomposition (HD) algorithm of Jordan and Sverdrup’s [1981]that seeks to minimize the location bias arising from unknown Earth velocity structure. This tech-nique has been applied to several individual earthquake sequences in the Zagros and elsewhere inIran (e.g. Nissen et al., 2010; Walker et al., 2011; Ghods et al., 2012; Aziz Zanjani et al., 2013;Elliott et al., 2015), but never before to seismicity across an entire orogen. Early instrumentalevents can be relocated if there is enough connectivity between them and modern events in thecluster; preferably, at least ∼10 shared readings from the same stations (e.g. Walker et al., 2011;Karasozen et al., 2016).
The largest contribution to the uncertainty in hypocenter locations comes from unknown Earthvelocity structure. Well-established relative multiple-earthquake relocation techniques, includingmloc, minimize these errors by correlating traveltime errors along similar paths. Since the raypaths from closely clustered group of earthquakes sample the same portion of the Earth, traveltimedifferences mostly account for relative hypocenter locations. However, in order to match seismic-ity with causative faulting it is vital to obtain calibrated locations, defined as absolute locationsaccompanied by realistic estimates of uncertainties. The key to doing so with mloc lies in theHD algorithm, which divides the earthquake relocation into two independent inverse problems and
3
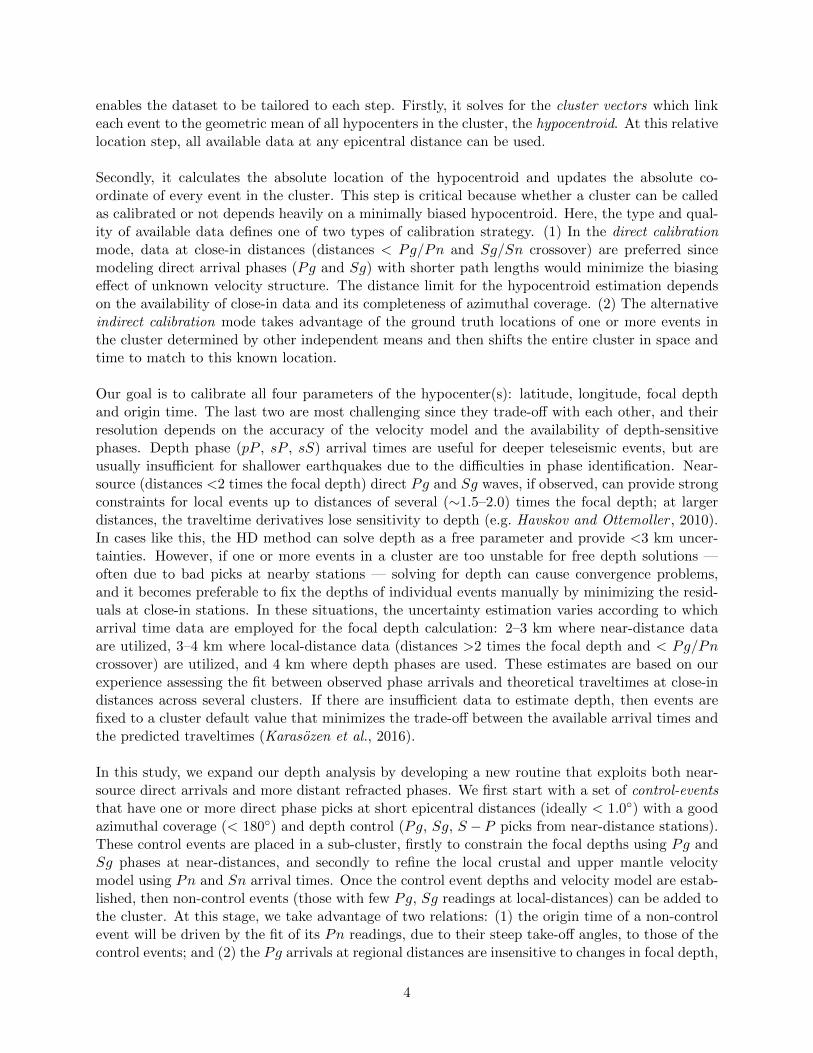
enables the dataset to be tailored to each step. Firstly, it solves for the cluster vectors which linkeach event to the geometric mean of all hypocenters in the cluster, the hypocentroid. At this relativelocation step, all available data at any epicentral distance can be used.
Secondly, it calculates the absolute location of the hypocentroid and updates the absolute co-ordinate of every event in the cluster. This step is critical because whether a cluster can be calledas calibrated or not depends heavily on a minimally biased hypocentroid. Here, the type and qual-ity of available data defines one of two types of calibration strategy. (1) In the direct calibrationmode, data at close-in distances (distances < Pg/Pn and Sg/Sn crossover) are preferred sincemodeling direct arrival phases (Pg and Sg) with shorter path lengths would minimize the biasingeffect of unknown velocity structure. The distance limit for the hypocentroid estimation dependson the availability of close-in data and its completeness of azimuthal coverage. (2) The alternativeindirect calibration mode takes advantage of the ground truth locations of one or more events inthe cluster determined by other independent means and then shifts the entire cluster in space andtime to match to this known location.
Our goal is to calibrate all four parameters of the hypocenter(s): latitude, longitude, focal depthand origin time. The last two are most challenging since they trade-off with each other, and theirresolution depends on the accuracy of the velocity model and the availability of depth-sensitivephases. Depth phase (pP , sP , sS) arrival times are useful for deeper teleseismic events, but areusually insufficient for shallower earthquakes due to the difficulties in phase identification. Near-source (distances <2 times the focal depth) direct Pg and Sg waves, if observed, can provide strongconstraints for local events up to distances of several (∼1.5–2.0) times the focal depth; at largerdistances, the traveltime derivatives lose sensitivity to depth (e.g. Havskov and Ottemoller , 2010).In cases like this, the HD method can solve depth as a free parameter and provide <3 km uncer-tainties. However, if one or more events in a cluster are too unstable for free depth solutions —often due to bad picks at nearby stations — solving for depth can cause convergence problems,and it becomes preferable to fix the depths of individual events manually by minimizing the resid-uals at close-in stations. In these situations, the uncertainty estimation varies according to whicharrival time data are employed for the focal depth calculation: 2–3 km where near-distance dataare utilized, 3–4 km where local-distance data (distances >2 times the focal depth and < Pg/Pncrossover) are utilized, and 4 km where depth phases are used. These estimates are based on ourexperience assessing the fit between observed phase arrivals and theoretical traveltimes at close-indistances across several clusters. If there are insufficient data to estimate depth, then events arefixed to a cluster default value that minimizes the trade-off between the available arrival times andthe predicted traveltimes (Karasozen et al., 2016).
In this study, we expand our depth analysis by developing a new routine that exploits both near-source direct arrivals and more distant refracted phases. We first start with a set of control-eventsthat have one or more direct phase picks at short epicentral distances (ideally < 1.0◦) with a goodazimuthal coverage (< 180◦) and depth control (Pg, Sg, S − P picks from near-distance stations).These control events are placed in a sub-cluster, firstly to constrain the focal depths using Pg andSg phases at near-distances, and secondly to refine the local crustal and upper mantle velocitymodel using Pn and Sn arrival times. Once the control event depths and velocity model are estab-lished, then non-control events (those with few Pg, Sg readings at local-distances) can be added tothe cluster. At this stage, we take advantage of two relations: (1) the origin time of a non-controlevent will be driven by the fit of its Pn readings, due to their steep take-off angles, to those of thecontrol events; and (2) the Pg arrivals at regional distances are insensitive to changes in focal depth,
4

but are affected by changes in origin time. For example, if the assumed depth of a non-controlevent is greater than its true depth, then the residual of its Pg reading will be negative because itsorigin time must be later to fit its Pn arrivals with shorter ray paths. With this new procedure,and by exploiting recent improvements in local arrival time data, we can reduce uncertainties infocal depths to ∼4 km or better for well-recorded events.
2.2 Specific objectives
Our Zagros clusters are focused in areas containing well-recorded recent earthquakes. Each clustercan have at most 200 events; mloc is ill-suited for larger numbers due to the higher computationaldemands of singular value decomposition required for the inversion. We focus the make-up of eachcluster on larger events and their aftershock sequences — especially those with published focalmechanisms from several first motions or body-waveform modelling studies or from the GCMTcatalog — so long as they are sufficiently well-recorded (>15 readings, azimuthal gap <180◦).Cluster dimensions are also limited to ∼200 km; from our experience working in complex tectonicsettings like the Zagros, at larger distances the hypocentroid is prone to biases arising from lateralvelocity heterogeneities. A few of our clusters are colocated with ones published previously, butin these instances we are able to improve epicentral and focal depth constraints and extend theanalysis in time by incorporating new data. Our priority is to generate robust calibrated epicenterswhere feasible, rather than trying to relocate every last event, and so our clusters are naturallyconcentrated in areas with good local station coverage and active seismicity. Consequently, our re-located seismicity maps should be interpreted more as indicating where earthquakes have occurredthan where they have not. Significant gaps where we were unable to calibrate any seismicity in-clude (1) the southern Dezful embayment between the Farsan and Karbaas clusters, (2) the centralinterior Fars arc north of the Ahel cluster, and (3) part of the coastal Fars arc between the Aheland Fin-Tiab clusters (Fig. 1b, Fig. 2b, Fig. 3)). Rarely, there are events common to a pair ofoverlapping clusters. In these instances, we find that the 90% confidence bounds on the commonevent epicenter overlap, but we present only the location with the better azimuthal coverage andlower uncertainty.
We gathered data from local catalogs including the Iranian National Seismograph Network (INSN),the Iranian Building and Housing Research Network (BHRC), the Iranian Seismological Center(IRSC), as well as temporary deployments in Iran and neighboring countries. The station coor-dinates are corrected according to the issues documented by (Syracuse et al., 2017). To improveconnectivity at regional and teleseismic distances, we also included data from the ISC Bulletin (in-cluding both reviewed and unreviewed events) and from the USGS NEIC. The distance limit overwhich the hypocentroid is calculated depends upon data availability and azimuthal coverage, andtherefore varies between clusters. In most cases it approximates or exceeds 1.0◦, but in cases like theDehloran cluster it was selected as 0.6◦, allowing us to avoid difficulties introduced by incorporatingPn and Sn readings. In cases where calibration is made difficult by limited availability of regionaldata, large open azimuths (>220◦), or strong lateral velocity heterogeneity, events can be relocatedusing both the direct and indirect calibration techniques. We chose to use indirect calibration forthe recent Ezgeleh-Sarpolzahab sequence and for the Shushtar and Fin-Tiab clusters, though innone of these cases do we rely upon InSAR-derived finite fault models (cf. Copley et al. (2015)).
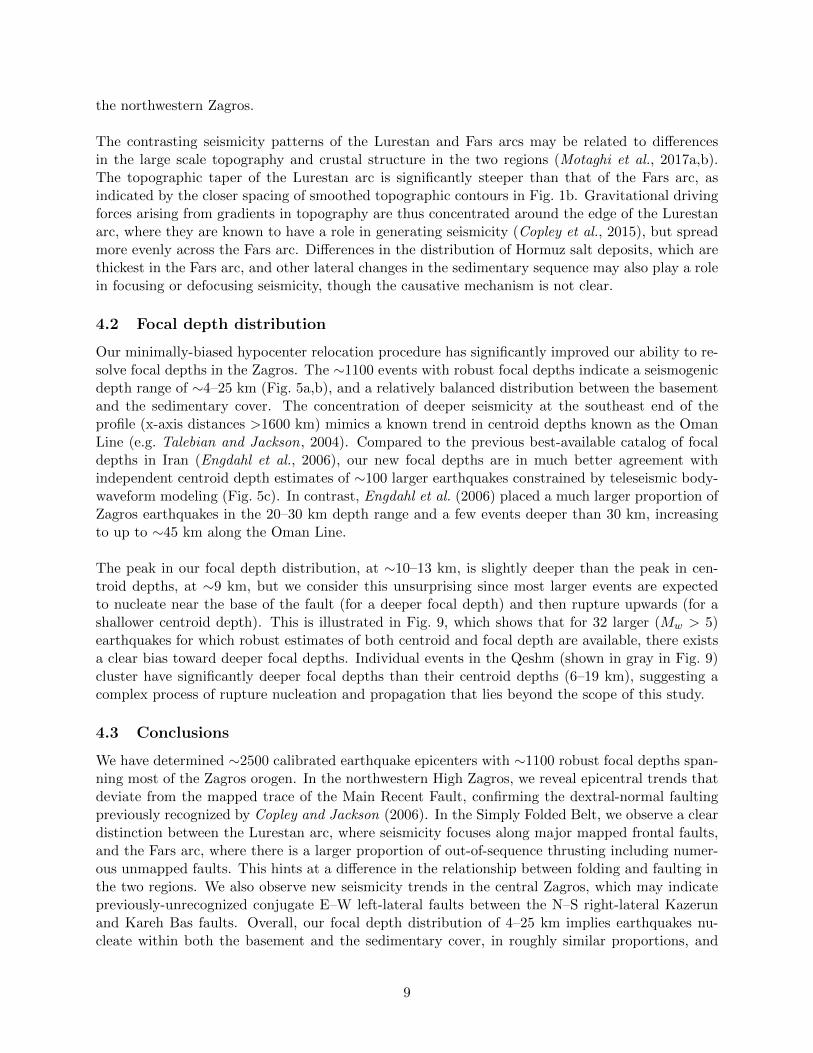
For each cluster we developed a custom crustal model by fitting P and S waves to the avail-able arrival data in the source region (Fig. 4). Although the effect of unknown velocity model isminimized for the calculation of cluster vectors, the subset of theoretical traveltimes used to esti-
5
mate the hypocentroid can potentially bias our locations, and hence requires further adjustment.This is done by fitting close-in, shorter (and preferably direct) ray paths from multiple eventswith fixed relative locations. As long as the azimuthal coverage is good at this distance range,the hypocentroid will remain stable even with variations in the local crustal model, and a stablevelocity structure can be obtained. Once direct phases (Pg, Sg) are adjusted, crustal thicknessand then lower crustal velocities can be determined by fitting Pn and Sn arrival times. The ak1351-D average global model (Kennett et al., 1995) is used for regional and teleseismic distances. Thefit to the model at these distances (Fig.S2e,f-17e,f) does not affect calibration of the cluster sincethese data are only used for relative location calculations. Our 1-D local models are composed oftwo to three layered crust with average P and S wave velocities of 5.5 km s−1 and 3.1 km s−1 forthe upper crust and 6.2 km s−1 and 3.6 km s−1 for the lower crust (Fig. 4), in close agreementwith values obtained from local microseismic studies (Nissen et al., 2010, 2011; Hatzfeld et al.,2003; Tatar et al., 2004; Yamini-Fard et al., 2012). Moho depths range from 44 km to 55 km,with slightly thicker average values in the northwestern Zagros (∼50 km) than in the southeasternZagros (∼46 km). Although our estimates of crustal thickness are averaged over ∼100 km lengthscales, they broadly agree with the local crustal thickness estimates of 42–58 km determined fromreceiver function studies (Hatzfeld et al., 2003; Paul et al., 2010; Afsari et al., 2011; Tatar andNasrabadi , 2013).
3 Significant results
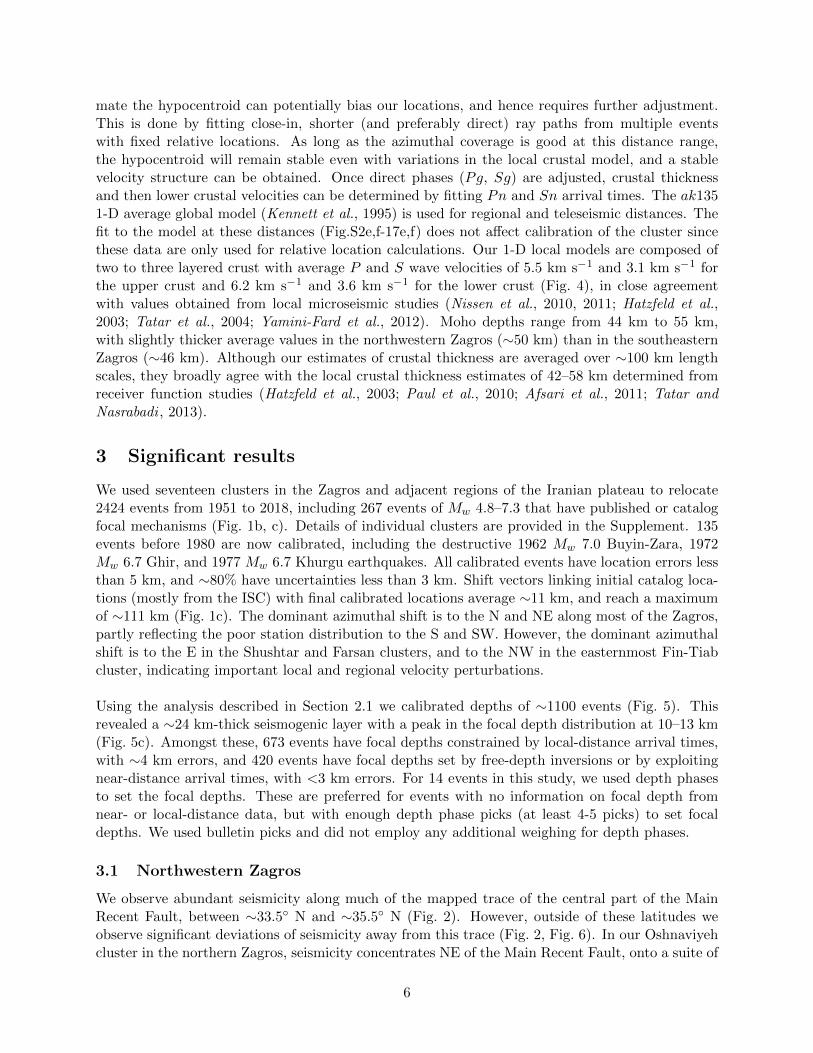
We used seventeen clusters in the Zagros and adjacent regions of the Iranian plateau to relocate2424 events from 1951 to 2018, including 267 events of Mw 4.8–7.3 that have published or catalogfocal mechanisms (Fig. 1b, c). Details of individual clusters are provided in the Supplement. 135events before 1980 are now calibrated, including the destructive 1962 Mw 7.0 Buyin-Zara, 1972Mw 6.7 Ghir, and 1977 Mw 6.7 Khurgu earthquakes. All calibrated events have location errors lessthan 5 km, and ∼80% have uncertainties less than 3 km. Shift vectors linking initial catalog loca-tions (mostly from the ISC) with final calibrated locations average ∼11 km, and reach a maximumof ∼111 km (Fig. 1c). The dominant azimuthal shift is to the N and NE along most of the Zagros,partly reflecting the poor station distribution to the S and SW. However, the dominant azimuthalshift is to the E in the Shushtar and Farsan clusters, and to the NW in the easternmost Fin-Tiabcluster, indicating important local and regional velocity perturbations.
Using the analysis described in Section 2.1 we calibrated depths of ∼1100 events (Fig. 5). Thisrevealed a ∼24 km-thick seismogenic layer with a peak in the focal depth distribution at 10–13 km(Fig. 5c). Amongst these, 673 events have focal depths constrained by local-distance arrival times,with ∼4 km errors, and 420 events have focal depths set by free-depth inversions or by exploitingnear-distance arrival times, with <3 km errors. For 14 events in this study, we used depth phasesto set the focal depths. These are preferred for events with no information on focal depth fromnear- or local-distance data, but with enough depth phase picks (at least 4-5 picks) to set focaldepths. We used bulletin picks and did not employ any additional weighing for depth phases.
3.1 Northwestern Zagros
We observe abundant seismicity along much of the mapped trace of the central part of the MainRecent Fault, between ∼33.5◦ N and ∼35.5◦ N (Fig. 2). However, outside of these latitudes weobserve significant deviations of seismicity away from this trace (Fig. 2, Fig. 6). In our Oshnaviyehcluster in the northern Zagros, seismicity concentrates NE of the Main Recent Fault, onto a suite of
6
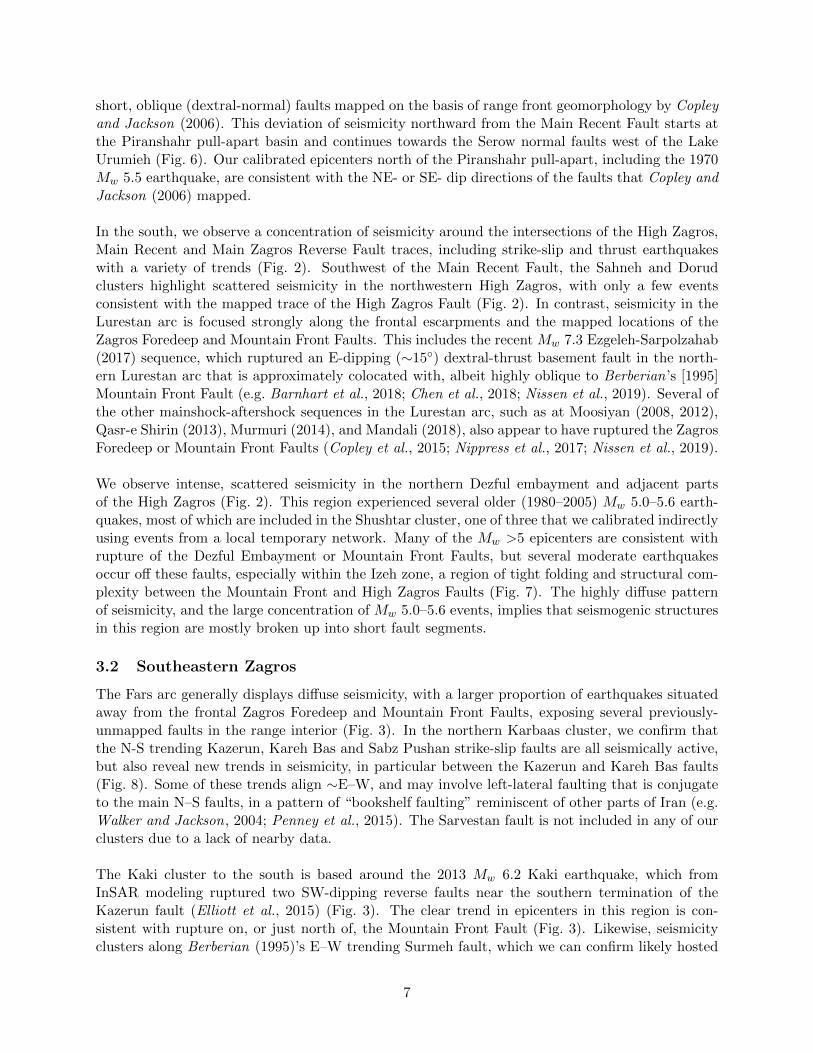
short, oblique (dextral-normal) faults mapped on the basis of range front geomorphology by Copleyand Jackson (2006). This deviation of seismicity northward from the Main Recent Fault starts atthe Piranshahr pull-apart basin and continues towards the Serow normal faults west of the LakeUrumieh (Fig. 6). Our calibrated epicenters north of the Piranshahr pull-apart, including the 1970Mw 5.5 earthquake, are consistent with the NE- or SE- dip directions of the faults that Copley andJackson (2006) mapped.
In the south, we observe a concentration of seismicity around the intersections of the High Zagros,Main Recent and Main Zagros Reverse Fault traces, including strike-slip and thrust earthquakeswith a variety of trends (Fig. 2). Southwest of the Main Recent Fault, the Sahneh and Dorudclusters highlight scattered seismicity in the northwestern High Zagros, with only a few eventsconsistent with the mapped trace of the High Zagros Fault (Fig. 2). In contrast, seismicity in theLurestan arc is focused strongly along the frontal escarpments and the mapped locations of theZagros Foredeep and Mountain Front Faults. This includes the recent Mw 7.3 Ezgeleh-Sarpolzahab(2017) sequence, which ruptured an E-dipping (∼15◦) dextral-thrust basement fault in the north-ern Lurestan arc that is approximately colocated with, albeit highly oblique to Berberian’s [1995]Mountain Front Fault (e.g. Barnhart et al., 2018; Chen et al., 2018; Nissen et al., 2019). Several ofthe other mainshock-aftershock sequences in the Lurestan arc, such as at Moosiyan (2008, 2012),Qasr-e Shirin (2013), Murmuri (2014), and Mandali (2018), also appear to have ruptured the ZagrosForedeep or Mountain Front Faults (Copley et al., 2015; Nippress et al., 2017; Nissen et al., 2019).
We observe intense, scattered seismicity in the northern Dezful embayment and adjacent partsof the High Zagros (Fig. 2). This region experienced several older (1980–2005) Mw 5.0–5.6 earth-quakes, most of which are included in the Shushtar cluster, one of three that we calibrated indirectlyusing events from a local temporary network. Many of the Mw >5 epicenters are consistent withrupture of the Dezful Embayment or Mountain Front Faults, but several moderate earthquakesoccur off these faults, especially within the Izeh zone, a region of tight folding and structural com-plexity between the Mountain Front and High Zagros Faults (Fig. 7). The highly diffuse patternof seismicity, and the large concentration of Mw 5.0–5.6 events, implies that seismogenic structuresin this region are mostly broken up into short fault segments.
3.2 Southeastern Zagros
The Fars arc generally displays diffuse seismicity, with a larger proportion of earthquakes situatedaway from the frontal Zagros Foredeep and Mountain Front Faults, exposing several previously-unmapped faults in the range interior (Fig. 3). In the northern Karbaas cluster, we confirm thatthe N-S trending Kazerun, Kareh Bas and Sabz Pushan strike-slip faults are all seismically active,but also reveal new trends in seismicity, in particular between the Kazerun and Kareh Bas faults(Fig. 8). Some of these trends align ∼E–W, and may involve left-lateral faulting that is conjugateto the main N–S faults, in a pattern of “bookshelf faulting” reminiscent of other parts of Iran (e.g.Walker and Jackson, 2004; Penney et al., 2015). The Sarvestan fault is not included in any of ourclusters due to a lack of nearby data.
The Kaki cluster to the south is based around the 2013 Mw 6.2 Kaki earthquake, which fromInSAR modeling ruptured two SW-dipping reverse faults near the southern termination of theKazerun fault (Elliott et al., 2015) (Fig. 3). The clear trend in epicenters in this region is con-sistent with rupture on, or just north of, the Mountain Front Fault (Fig. 3). Likewise, seismicityclusters along Berberian (1995)’s E–W trending Surmeh fault, which we can confirm likely hosted
7
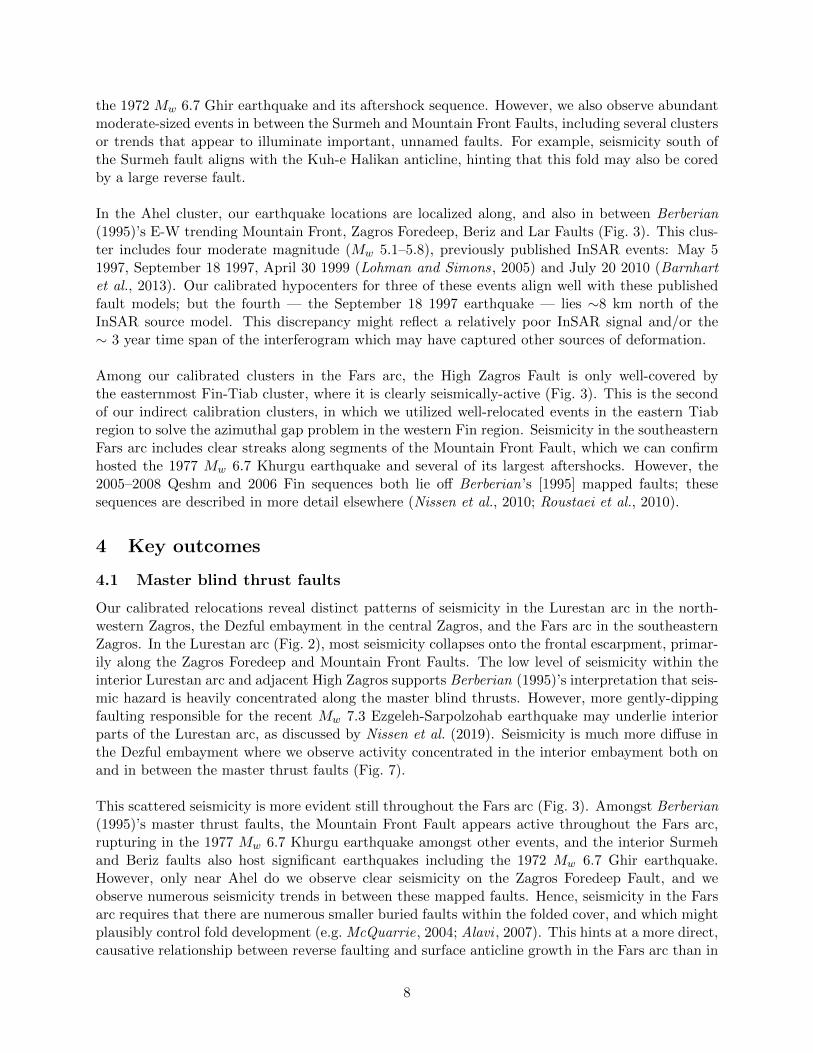
the 1972 Mw 6.7 Ghir earthquake and its aftershock sequence. However, we also observe abundantmoderate-sized events in between the Surmeh and Mountain Front Faults, including several clustersor trends that appear to illuminate important, unnamed faults. For example, seismicity south ofthe Surmeh fault aligns with the Kuh-e Halikan anticline, hinting that this fold may also be coredby a large reverse fault.
In the Ahel cluster, our earthquake locations are localized along, and also in between Berberian(1995)’s E-W trending Mountain Front, Zagros Foredeep, Beriz and Lar Faults (Fig. 3). This clus-ter includes four moderate magnitude (Mw 5.1–5.8), previously published InSAR events: May 51997, September 18 1997, April 30 1999 (Lohman and Simons, 2005) and July 20 2010 (Barnhartet al., 2013). Our calibrated hypocenters for three of these events align well with these publishedfault models; but the fourth — the September 18 1997 earthquake — lies ∼8 km north of theInSAR source model. This discrepancy might reflect a relatively poor InSAR signal and/or the∼ 3 year time span of the interferogram which may have captured other sources of deformation.
Among our calibrated clusters in the Fars arc, the High Zagros Fault is only well-covered bythe easternmost Fin-Tiab cluster, where it is clearly seismically-active (Fig. 3). This is the secondof our indirect calibration clusters, in which we utilized well-relocated events in the eastern Tiabregion to solve the azimuthal gap problem in the western Fin region. Seismicity in the southeasternFars arc includes clear streaks along segments of the Mountain Front Fault, which we can confirmhosted the 1977 Mw 6.7 Khurgu earthquake and several of its largest aftershocks. However, the2005–2008 Qeshm and 2006 Fin sequences both lie off Berberian’s [1995] mapped faults; thesesequences are described in more detail elsewhere (Nissen et al., 2010; Roustaei et al., 2010).
4 Key outcomes
4.1 Master blind thrust faults
Our calibrated relocations reveal distinct patterns of seismicity in the Lurestan arc in the north-western Zagros, the Dezful embayment in the central Zagros, and the Fars arc in the southeasternZagros. In the Lurestan arc (Fig. 2), most seismicity collapses onto the frontal escarpment, primar-ily along the Zagros Foredeep and Mountain Front Faults. The low level of seismicity within theinterior Lurestan arc and adjacent High Zagros supports Berberian (1995)’s interpretation that seis-mic hazard is heavily concentrated along the master blind thrusts. However, more gently-dippingfaulting responsible for the recent Mw 7.3 Ezgeleh-Sarpolzohab earthquake may underlie interiorparts of the Lurestan arc, as discussed by Nissen et al. (2019). Seismicity is much more diffuse inthe Dezful embayment where we observe activity concentrated in the interior embayment both onand in between the master thrust faults (Fig. 7).
This scattered seismicity is more evident still throughout the Fars arc (Fig. 3). Amongst Berberian(1995)’s master thrust faults, the Mountain Front Fault appears active throughout the Fars arc,rupturing in the 1977 Mw 6.7 Khurgu earthquake amongst other events, and the interior Surmehand Beriz faults also host significant earthquakes including the 1972 Mw 6.7 Ghir earthquake.However, only near Ahel do we observe clear seismicity on the Zagros Foredeep Fault, and weobserve numerous seismicity trends in between these mapped faults. Hence, seismicity in the Farsarc requires that there are numerous smaller buried faults within the folded cover, and which mightplausibly control fold development (e.g. McQuarrie, 2004; Alavi , 2007). This hints at a more direct,causative relationship between reverse faulting and surface anticline growth in the Fars arc than in
8
the northwestern Zagros.
The contrasting seismicity patterns of the Lurestan and Fars arcs may be related to differencesin the large scale topography and crustal structure in the two regions (Motaghi et al., 2017a,b).The topographic taper of the Lurestan arc is significantly steeper than that of the Fars arc, asindicated by the closer spacing of smoothed topographic contours in Fig. 1b. Gravitational drivingforces arising from gradients in topography are thus concentrated around the edge of the Lurestanarc, where they are known to have a role in generating seismicity (Copley et al., 2015), but spreadmore evenly across the Fars arc. Differences in the distribution of Hormuz salt deposits, which arethickest in the Fars arc, and other lateral changes in the sedimentary sequence may also play a rolein focusing or defocusing seismicity, though the causative mechanism is not clear.
4.2 Focal depth distribution
Our minimally-biased hypocenter relocation procedure has significantly improved our ability to re-solve focal depths in the Zagros. The ∼1100 events with robust focal depths indicate a seismogenicdepth range of ∼4–25 km (Fig. 5a,b), and a relatively balanced distribution between the basementand the sedimentary cover. The concentration of deeper seismicity at the southeast end of theprofile (x-axis distances >1600 km) mimics a known trend in centroid depths known as the OmanLine (e.g. Talebian and Jackson, 2004). Compared to the previous best-available catalog of focaldepths in Iran (Engdahl et al., 2006), our new focal depths are in much better agreement withindependent centroid depth estimates of ∼100 larger earthquakes constrained by teleseismic body-waveform modeling (Fig. 5c). In contrast, Engdahl et al. (2006) placed a much larger proportion ofZagros earthquakes in the 20–30 km depth range and a few events deeper than 30 km, increasingto up to ∼45 km along the Oman Line.
The peak in our focal depth distribution, at ∼10–13 km, is slightly deeper than the peak in cen-troid depths, at ∼9 km, but we consider this unsurprising since most larger events are expectedto nucleate near the base of the fault (for a deeper focal depth) and then rupture upwards (for ashallower centroid depth). This is illustrated in Fig. 9, which shows that for 32 larger (Mw > 5)earthquakes for which robust estimates of both centroid and focal depth are available, there existsa clear bias toward deeper focal depths. Individual events in the Qeshm (shown in gray in Fig. 9)cluster have significantly deeper focal depths than their centroid depths (6–19 km), suggesting acomplex process of rupture nucleation and propagation that lies beyond the scope of this study.
4.3 Conclusions
We have determined ∼2500 calibrated earthquake epicenters with ∼1100 robust focal depths span-ning most of the Zagros orogen. In the northwestern High Zagros, we reveal epicentral trends thatdeviate from the mapped trace of the Main Recent Fault, confirming the dextral-normal faultingpreviously recognized by Copley and Jackson (2006). In the Simply Folded Belt, we observe a cleardistinction between the Lurestan arc, where seismicity focuses along major mapped frontal faults,and the Fars arc, where there is a larger proportion of out-of-sequence thrusting including numer-ous unmapped faults. This hints at a difference in the relationship between folding and faulting inthe two regions. We also observe new seismicity trends in the central Zagros, which may indicatepreviously-unrecognized conjugate E–W left-lateral faults between the N–S right-lateral Kazerunand Kareh Bas faults. Overall, our focal depth distribution of 4–25 km implies earthquakes nu-cleate within both the basement and the sedimentary cover, in roughly similar proportions, and
9
is broadly consistent with the centroid depth distribution of ∼100 larger earthquakes previouslyconstrained by teleseismic body-waveform modeling. In contrast with previous hypocenter catalogsin the Zagros, we see no evidence for foci deeper than ∼30 km.
Acknowledgments
We acknowledge the work of our colleagues Eric Bergman and Abdolreza Ghods, who are co-authors on our paper in Journal of Geophysical Research: Solid Earth. E. N. acknowledges addi-tional support from the Natural Sciences and Engineering Research Council of Canada (NSERC)through Discovery Grant 2017-04029, the Canada Foundation for Innovation (CFI), the BritishColumbia Knowledge Development Fund (BCKDF), and the Canada Research Chair program.We are grateful to two anonymous reviewers for their thorough and thoughtful reviews of ourJournal of Geophysical Research: Solid Earth manuscript. Local network data used in this workbelong to the Institute for Advanced Studies in Basic Sciences (IASBS) and the Geological Sur-vey of Iran. Phase arrival time data, most of which are freely available, were gathered from theIranian National Seismograph Network (INSN, http://www.iiees.ac.ir/en/), the Iranian Build-ing and Housing Research Network (BHRC, https://https://ismn.bhrc.ac.ir/en/), the Ira-nian Seismological Center (IRSC, http://irsc.ut.ac.ir/), the United States Geological Survey(USGS, https://earthquake.usgs.gov/earthquakes/), and the International Seismological Cen-tre (ISC, http://www.isc.ac.uk/iscbulletin/search/bulletin/). Most of the local-distancephase arrivals were picked by Abdolreza Ghods and his research group at the Department ofEarth Sciences, IASBS. We also used phase arrival time data from temporary networks deployedby Farzam Yamini-Fard and Mohammad Tatar (IIEES). All of the calibrated locations in thisstudy are available in the Global Catalog of Calibrated Earthquake Locations (GCCEL) website(https://www.sciencebase.gov/catalog/item/59fb91fde4b0531197b16ac7). Most of the fig-ures were plotted using Generic Mapping Tools (Wessel et al., 2013).
References
Abdollahie-Fard, I., A. Braathen, M. Mokhtari, and S. A. Alavi (2006), Interaction of the ZagrosFold–Thrust Belt and the Arabian-type, deep-seated folds in the Abadan Plain and the DezfulEmbayment, SW Iran, Petr. Geosci., 12 (4), 347–362.
Afsari, N., F. Sodoudi, F. T. Farahmand, and M. R. Ghassemi (2011), Crustal structure of northwestzagros (Kermanshah) and central iran (Yazd and Isfahan) using teleseismic PS converted phases,J. Seismol., 15 (2), 341–353.
Alavi, M. (2007), Structures of the Zagros fold-thrust belt in Iran, Amer. J. Sci., 307, 1064–1095.
Allen, M. B., C. Saville, E. J.-P. Blanc, M. Talebian, and E. Nissen (2013), Orogenic plateau growth:Expansion of the Turkish-Iranian Plateau across the Zagros fold-and-thrust belt, Tectonics, 32,1–20.
Aziz Zanjani, A., A. Ghods, F. Sobouti, E. Bergman, G. Mortezanejad, K. Priestley, and M. Mada-nipour, S. andd Rezaeian (2013), Seismicity in the western coast of the South Caspian Basin andthe Talesh Mountains, Geophys. J. Int., 195, 799–814.
Barnhart, W. D., and R. B. Lohman (2013), Phantom earthquakes and triggered aseismic creep:Vertical partitioning of strain during earthquake sequences in Iran, Geophys. Res. Lett., 40 (5),819–823.
10
Barnhart, W. D., R. B. Lohman, and R. J. Mellors (2013), Active accommodation of plate conver-gence in Southern Iran: Earthquake locations, triggered aseismic slip, and regional strain rates,J. Geophys. Res., 118 (10), 5699–5711.
Barnhart, W. D., C. M. J. Brengman, S. Li, and K. E. Peterson (2018), Ramp-flat basementstructures of the Zagros Mountains inferred from co-seismic slip and afterslip of the 2017 Mw7.3Darbandikhan, Iran/Iraq earthquake, Earth Planet. Sci. Lett., 496, 96–107, doi:10.1016/j.epsl.2018.05.036.
Berberian, M. (1979), Earthquake faulting and bedding thrust associated with the Tabas-e-Golshan(Iran) earthquake of September 16, 1978, Bull. Seismol. Soc. Am., 69, 1861–1887.
Berberian, M. (1995), Master blind thrust faults hidden under the Zagros folds: active basementtectonics and surface morphotectonics, Tectonophys., 241, 193–224.
Bergman, E. A., and S. C. Solomon (1990), Earthquake swarms on the Mid-Atlantic Ridge -Products of magmatism or extensional tectonics?, J. Geophys. Res., 95, 4943–4965.
Blanc, E. J.-P., M. B. Allen, S. Inger, and H. Hassani (2003), Structural styles in the Zagros SimpleFolded Zone, Iran, J. Geol. Soc. London, 160, 401–412.
Casciello, E., J. Verges, E. Saura, G. Casini, N. Fernandez, E. Blanc, S. Homke, and D. W. Hunt(2009), Fold patterns and multilayer rheology of the Lurestan Province, Zagros Simply FoldedBelt (Iran), J. Geol. Soc. London, 166, 947–959.
Chen, K., W. Xu, P. M. Mai, H. Gao, L. Zhang, and X. Ding (2018), The 2017 Mw 7.3 SarpolZahab Earthquake, Iran: A compact blind shallow-dipping thrust event in the mountain frontfault basement, Tectonophys., 747, 108–114, doi:10.1016/j.tecto.2018.09.015.
Copley, A., and J. Jackson (2006), Active tectonics of the Turkish-Iranian Plateau, Tectonophys.,25, TC6006, doi:10.1029/2005TC001906.
Copley, A., E. Karasozen, B. Oveisi, J. R. Elliott, S. Samsonov, and E. Nissen (2015), Seismogenicfaulting of the sedimentary sequence and laterally variable material properties in the ZagrosMountains (Iran) revealed by the August 2014 Murmuri (E. Dehloran) earthquake sequence,Geophys. J. Int., 203, 1436–1459, doi:10.1093/gji/ggv365.
Donner, S., D. Roßler, F. Kruger, A. Ghods, and M. R. Strecker (2013), Segmented seismicity of theM w 6.2 Baladeh earthquake sequence (Alborz Mountains, Iran) revealed from regional momenttensors, J. Seismol., 17, 925–959.
Donner, S., F. Kruger, D. Roßler, and A. Ghods (2014), Combined Inversion of Broadband andShort-Period Waveform Data for Regional Moment Tensors: A Case Study in the Alborz Moun-tains, Iran, Bull. Seismol. Soc. Am., 104 (3), 1358–1373.
Dziewonski, A. M., T. A. Chou, and J. H. Woodhouse (1981), Determination of earthquake sourceparameters from waveform data for studies of global and regional seismicity, J. Geophys. Res.,86, 2825–2852.
Ekstrom, G. (1989), A very broad band inversion method for the recovery of earthquake sourceparameters, Tectonophys., 166, 73–100, doi:10.1016/0040-1951(89)90206-0.
11
Ekstrom, G., M. Nettles, and A. M. Dziewonski (2012), The global CMT project 2004-2010:Centroid-moment tensors for 13,017 earthquakes, Phys. Earth Planet. Inter., 200, 1–9, doi:10.1016/j.pepi.2012.04.002.
Elliott, J. R., E. A. Bergman, A. C. Copley, A. R. Ghods, E. K. Nissen, B. Oveisi, M. Tatar, R. J.Walters, and F. Yamini-Fard (2015), The 2013 Mw 6.2 Khaki-Shonbe (Iran) earthquake: Insightsinto seismic and aseismic shortening of the Zagros sedimentary cover, Earth Space. Sci., 2 (11),435–471, doi:10.1002/2015EA000098.
Engdahl, E. R., R. D. van der Hilst, and R. Buland (1998), Global teleseismic earthquake relocationfrom improved travel times and procedures for depth determination, Bull. Seismol. Soc. Am.,88, 722–743.
Engdahl, R. E., J. A. Jackson, S. C. Myers, E. A. Bergman, and K. Priestley (2006), Relocationand assessment of seismicity in the Iran region, Geophys. J. Int., 167, 761–778.
Ghods, A., M. Rezapour, E. Bergman, G. Mortezanejad, and M. Talebian (2012), Relocation ofthe 2006 Mw 6.1 Silakhour, Iran, Earthquake Sequence: Details of Fault Segmentation on theMain Recent Fault, Bull. Seismol. Soc. Am., 102, 398–416.
Hatzfeld, D., M. Tatar, K. Priestley, and M. Ghafory-Ashtiany (2003), Seismological constraints onthe crustal structure beneath the Zagros Mountain belt (Iran), Geophys. J. Int., 155, 403–410.
Havskov, J., and L. Ottemoller (2010), Location, in Routine Data Processing in Earthquake Seis-mology), pp. 101–149, Springer, Dordrecht, doi:{https://doi.org/10.1007/978-90-481-8697-6}.
Jackson, J. A. (1980), Reactivation of basement faults and crustal shortening in orogenic belts,Nature, 283, 343–346.
Jordan, T. H., and K. A. Sverdrup (1981), Teleseismic location techniques and their application toearthquake clusters in the South-Central Pacific, Bull. Seismol. Soc. Am., 71, 1105–1130.
Karasozen, E., E. Nissen, E. A. Bergman, K. L. Johnson, and R. J. Walters (2016), Normalfaulting in the Simav graben of western Turkey reassessed with calibrated earthquake relocations,J. Geophys. Res., 121, 4553–4574.
Karasozen, E., E. Nissen, P. Buyukakpınar, M. Cambaz, M. Kahraman, E. Kalkan-Ertan, B. Ab-garmi, E. Bergman, A. Ghods, and A. Ozacar (2018), The 2017 July 20 Mw 6.6 Bodrum–Kosearthquake illuminates active faulting in the Gulf of Gokova, SW Turkey, Geophys. J. Int.,214 (1), 185–199.
Kennett, B. L. N., E. R. Engdahl, and R. Buland (1995), Constraints on seismic velocities in theEarth from traveltimes, Geophys. J. Int., 122, 108–124.
Konstantinou, K., and S. Rontogianni (2011), A Comparison of Teleseismic and Regional seismicMoment Estimates in the European-Mediterranean Region, Seismol. Res. Lett., 82 (2), 189, doi:10.1785/gssrl.82.2.188.
Lohman, R. B., and M. Simons (2005), Locations of selected small earthquakes in the Zagrosmountains, Geochem. Geophys. Geosyst., 6, Q03001.
Maggi, A., J. A. Jackson, K. Priestley, and C. Baker (2000), A re-assessment of focal depth distri-butions in southern Iran, the Tien Shan and northern India: do earthquakes really occur in thecontinental mantle?, Geophys. J. Int., 143, 629–661.
12
Maggi, A., K. Priestley, and J. Jackson (2002), Focal Depths of Moderate and Large Size Earth-quakes in Iran, J. Seismol. Earthquake Eng., 4 (2–3), 1–10.
McQuarrie, N. (2004), Crustal scale geometry of the Zagros fold-thrust belt, Iran, J. Struct. Geol.,26, 519–535.
Molinaro, M., P. Leturmy, J.-C. Guezou, D. Frizon de Lamotte, and S. A. Eshraghi (2005), Thestructure and kinematics of the southeastern Zagros fold-thrust belt, Iran: From thin-skinned tothick-skinned tectonics, Tectonics, 24, TC3007.
Motaghi, K., E. Shabanian, and F. Kalvandi (2017a), Underplating along the northern portion ofthe Zagros suture zone, Iran, Geophys. J. Int., 210, 375–389, doi:10.1093/gji/ggx168.
Motaghi, K., E. Shabanian, M. Tatar, M. Cuffaro, and C. Doglioni (2017b), The south Zagrossuture zone in teleseismic images, Tectonophys., 694, 292–301, doi:10.1016/j.tecto.2016.11.012.
Mouthereau, F., J. Tensi, N. Bellahsen, O. Lacombe, T. De Boisgrollier, and S. Kargar (2007), Ter-tiary sequence of deformation in a thin-skinned/thick-skinned collision belt: The Zagros FoldedBelt (Fars, Iran), Tectonics, 26, TC5006.
Nippress, S., R. Heyburn, and R. Walters (2017), The 2008 and 2012 moosiyan earthquake se-quences: Rare insights into the role of strike slip and thrust faulting within the simply foldedbelt (iran), Bull. Seismol. Soc. Am., 107 (4), 1625–1641.
Nissen, E., F. Yamini-Fard, M. Tatar, A. Gholamzadeh, E. Bergman, J. R. Elliott, J. A. Jackson,and B. Parsons (2010), The vertical separation of mainshock rupture and microseismicity atQeshm island in the Zagros Simply Folded Belt, Iran, Earth Planet. Sci. Lett., 296, 181–194.
Nissen, E., M. Tatar, J. A. Jackson, and M. B. Allen (2011), New views on earthquake faulting inthe Zagros fold-and-thrust belt of Iran, Geophys. J. Int., 186, 928–944.
Nissen, E., J. Jackson, S. Jahani, and M. Tatar (2014), Zagros “phantom earthquakes” reassessed— The interplay of seismicity and deep salt flow in the Simply Folded Belt?, J. Geophys. Res.,119 (4), 3561–3583.
Nissen, E., A. Ghods, E. Karasozen, W. D. Barnhart, E. A. Bergman, J. R. Elliott, G. P. Hayes,F. Tan, W. Abdulnaby, H. M. Benz, L. Chen, M. Jamal-Reyhani, M. Nemati, and M. Talebian(2019), The 12 November 2017 Mw 7.3 Ezgeleh-Sarpol-e Zahab (Iran) earthquake and activetectonics of the Lurestan arc, J. Geophys. Res., p. 4 pp.
Oveisi, B., J. Lave, P. van der Beek, J. Carcaillet, L. Benedetti, and C. Aubourg (2009), Thick-and thin-skinned deformation rates in the central Zagros simple folded zone (Iran) indicated bydisplacement of geomorphic surfaces, Geophys. J. Int., 176, 627–654.
Paul, A., D. Hatzfeld, A. Kaviani, M. Tatar, and C. Pequegnat (2010), Seismic imaging of thelithospheric structure of the Zagros mountain belt (Iran), Geol. Soc. London Spec. Publ., 330,5–18.
Penney, C., A. Copley, and B. Oveisi (2015), Subduction tractions and vertical axis rotationsin the Zagros-Makran transition zone, SE Iran: the 2013 May 11 Mw 6.1 Minab earthquake,Geophys. J. Int., 202, 1122–1136, doi:10.1093/gji/ggv202.
13
Roustaei, M., E. Nissen, M. Abbassi, A. Gholamzadeh, M. Ghorashi, M. Tatar, F. Yamini-Fard,E. Bergman, J. Jackson, and B. Parsons (2010), The 25 March 2006 Fin earthquakes (Iran) –insights into the vertical extents of faulting in the Zagros Simply Folded Belt, Geophys. J. Int.,181, 1275–1291.
Sherkati, S., M. Molinaro, D. Frizon de Lamotte, and J. Letouzey (2005), Detachment folding inthe Central and Eastern Zagros fold-belt (Iran): salt mobility, multiple detachments and latebasement control, J. Struct. Geol., 27, 1680–1696.
Syracuse, E. M., W. S. Phillips, M. Maceira, and M. L. Begnaud (2017), Identifying and CorrectingTiming Errors at Seismic Stations in and around Iran, Seismol. Res. Lett., 88 (6), 1472–1479.
Talebian, M., and J. Jackson (2004), A reappraisal of earthquake focal mechanisms and activeshortening in the Zagros mountains of Iran, Geophys. J. Int., 156, 506–526.
Tatar, M., and A. Nasrabadi (2013), Crustal thickness variations in the zagros continental collisionzone Iran) from joint inversion of receiver functions and surface wave dispersion, J. Seismol.,17 (4), 1321–1337.
Tatar, M., D. Hatzfeld, and M. Ghafory-Ashtiany (2004), Tectonics of the Central Zagros (Iran)deduced from microearthquake seismicity, Geophys. J. Int., 156, 255–266.
Vernant, P., F. Nilforoushan, D. Hatzfeld, M. R. Abbassi, C. Vigny, F. Masson, H. Nankali, J. Mar-tinod, A. Ashtiani, R. Bayer, F. Tavakoli, and J. Chery (2004), Present-day crustal deformationand plate kinematics in the Middle East constrained by GPS measurements in Iran and northernOman, Geophys. J. Int., 157, 381–398.
Walker, R., and J. Jackson (2004), Active tectonics and late Cenozoic strain distribution in centraland eastern Iran, Tectonics, 23, TC5010.
Walker, R. T., M. J. Andalibi, M. R. Gheitanchi, J. A. Jackson, S. Karegar, and K. Priestley (2005),Seismological and field observations from the 1990 November 6 Furg (Hormozgan) earthquake:a rare case of surface rupture in the Zagros mountains of Iran, Geophys. J. Int., 163, 567–579.
Walker, R. T., E. A. Bergman, W. Szeliga, and E. J. Fielding (2011), Insights into the 1968-1997 Dasht-e-Bayaz and Zirkuh earthquake sequences, eastern Iran, from calibrated relocations,InSAR and high-resolution satellite imagery, Geophys. J. Int., 187, 1577–1603.
Walpersdorf, A., D. Hatzfeld, H. Nankali, F. Tavakoli, F. Nilforoushan, M. Tatar, P. Vernant,J. Chery, and F. Masson (2006), Difference in the GPS deformation pattern of North and CentralZagros (Iran), Geophys. J. Int., 167, 1077–1088.
Wessel, P., W. H. F. Smith, R. Scharroo, J. Luis, and F. Wobbe (2013), Generic Mapping Tools:Improved Version Released, Eos Trans. AGU, 94, 409–410.
Yamini-Fard, F., M. Tatar, K. Hessami, A. Gholamzadeh, and E. A. Bergman (2012), Aftershockanalysis of the 2005 November 27 (Mw 5.8) Qeshm Island earthquake (Zagros-Iran): Triggeringof strike-slip faults at the basement, J. Geodynamics, 61, 138–147.
14

Figure 1: Caption on next page.
15
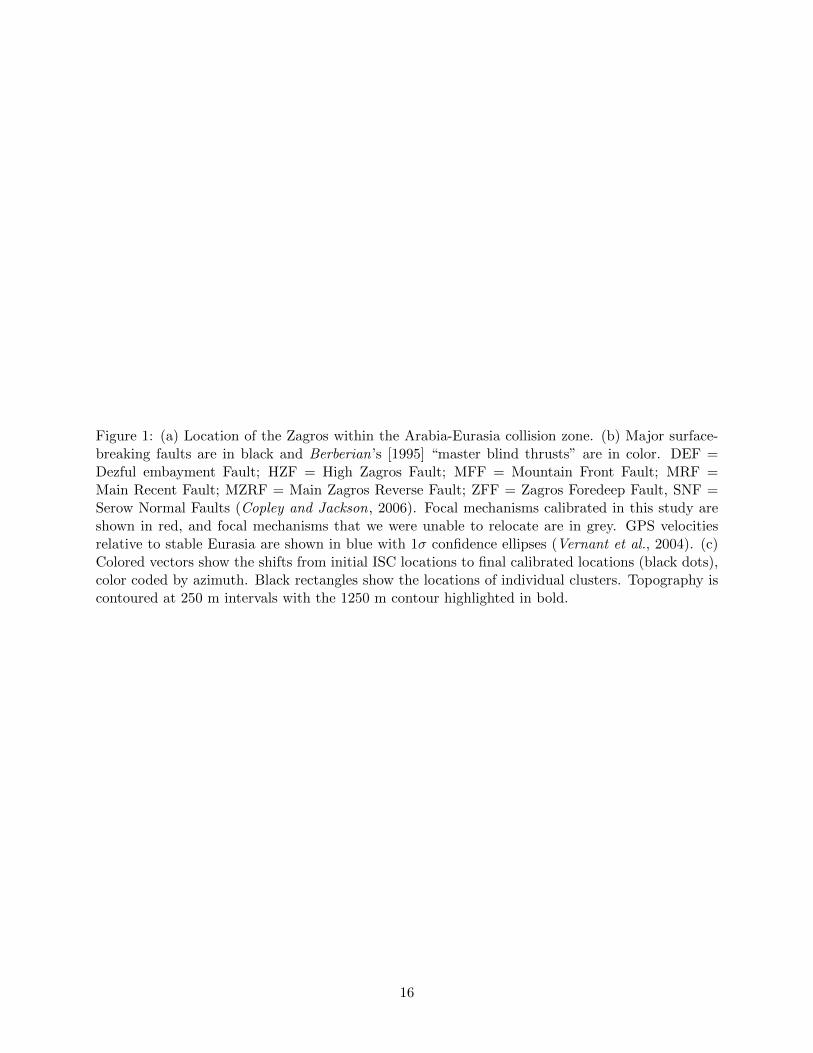
Figure 1: (a) Location of the Zagros within the Arabia-Eurasia collision zone. (b) Major surface-breaking faults are in black and Berberian’s [1995] “master blind thrusts” are in color. DEF =Dezful embayment Fault; HZF = High Zagros Fault; MFF = Mountain Front Fault; MRF =Main Recent Fault; MZRF = Main Zagros Reverse Fault; ZFF = Zagros Foredeep Fault, SNF =Serow Normal Faults (Copley and Jackson, 2006). Focal mechanisms calibrated in this study areshown in red, and focal mechanisms that we were unable to relocate are in grey. GPS velocitiesrelative to stable Eurasia are shown in blue with 1σ confidence ellipses (Vernant et al., 2004). (c)Colored vectors show the shifts from initial ISC locations to final calibrated locations (black dots),color coded by azimuth. Black rectangles show the locations of individual clusters. Topography iscontoured at 250 m intervals with the 1250 m contour highlighted in bold.
16

46˚44˚ 50˚48˚ 52˚
36˚
38˚
32˚
34˚
sahneh
dorud
polzohab
shushtar
farsan
avaj
qom
ZFF
MFF
ZFF
ZFF
MFF
MFF
DEF
HZF
MRF
HZF
MZRF
Lu
r e s t a n A r c
Izeh Zone
SNF
1950 1970 1990 2010
20 km<3.03.0 - 4.04.0 - 5.05.0 - 6.06.0 - 7.0
>7.0
Mw 7.0
2018 Manda
2002 ChangurehMw 6.4
2007 Qom Mw 5.7
2017 Ezgeleh-SarpolzohabMw 7.3
Mw 5.5
Figure 2: Calibrated epicentral locations in the northwestern Zagros and adjacent central Iranianplateau, colored by time and scaled by magnitude. Where they are available, teleseismic focalmechanisms are plotted at their relocated epicenters using the same scaling and coloring. Whiteshaded regions show the extend of individual clusters as in Fig. 1c. Major surface-breaking faultsare in black and Berberian’s [1995] “master blind thrusts” are in color. DEF = Dezful embaymentFault; HZF = High Zagros Fault; MFF = Mountain Front Fault; MRF = Main Recent Fault;MZRF = Main Zagros Reverse Fault; ZFF = Zagros Foredeep Fault, SNF = Serow Normal Faults.
17

56˚
30˚
28˚
26˚54˚52˚ 58˚
karbaaskarbaas
ahel
qeshm
1950 1970 1990 2010
20 km<3.03.0 - 4.04.0 - 5.05.0 - 6.06.0 - 7.0
>7.0
HZF
Kareh Bas F.
Lar F.
Surmeh F.
MZRF
ZFFKazerun F.
ZFF
MFF
MFF
MZendan F.
P e r s a
u l f
Gn
F a r s A r c
Sabz
Pushan F.
Sarvestan F.
Oman
Mw 6.7
1977 Khurgu Mw 6.7
Mw 5.7
2005 - 2008Qeshm
2010 Ahel Mw 5.7
MW 6.2
5.5.97 Mw 5.1 18.9.97
Mw 5.1
30.4.99 Mw 5.1
Figure 3: Calibrated epicentral locations in the southeastern Zagros, colored by time and scaled bymagnitude. Where they are available, teleseismic focal mechanisms are plotted at their relocatedepicenters using the same scaling and coloring. White shaded regions show the extend of individualclusters as in Fig. 1c. Major surface-breaking faults are in black and Berberian’s [1995] “masterblind thrusts” are in color. HZF = High Zagros Fault; MFF = Mountain Front Fault; MZRF =Main Zagros Reverse Fault; ZFF = Zagros Foredeep Fault.
18
0
20
40
60
80
Dep
th (k
m)
0 2 4 6 8
ak135 ak135
Aligudarz
Qeshm
Ghir
Avaj
Ahel
KarbaasKaki
Dehloran
Fin-Tiab
Dorud
OshnaviyehFarsan
PanjwinPolzohabQomSahnehShushtar
Southeastern Clusters
Northwestern Clusters
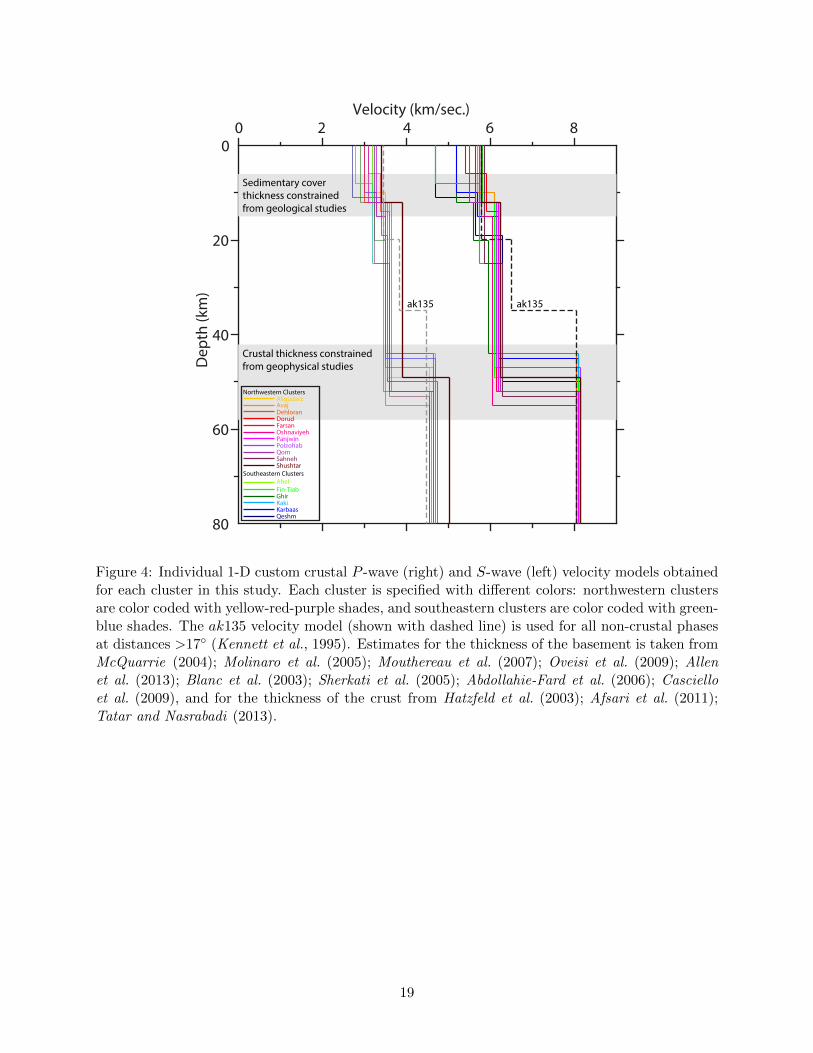
Figure 4: Individual 1-D custom crustal P -wave (right) and S-wave (left) velocity models obtainedfor each cluster in this study. Each cluster is specified with different colors: northwestern clustersare color coded with yellow-red-purple shades, and southeastern clusters are color coded with green-blue shades. The ak135 velocity model (shown with dashed line) is used for all non-crustal phasesat distances >17◦ (Kennett et al., 1995). Estimates for the thickness of the basement is taken fromMcQuarrie (2004); Molinaro et al. (2005); Mouthereau et al. (2007); Oveisi et al. (2009); Allenet al. (2013); Blanc et al. (2003); Sherkati et al. (2005); Abdollahie-Fard et al. (2006); Cascielloet al. (2009), and for the thickness of the crust from Hatzfeld et al. (2003); Afsari et al. (2011);Tatar and Nasrabadi (2013).
19

Figure 5: Caption on next page.
20
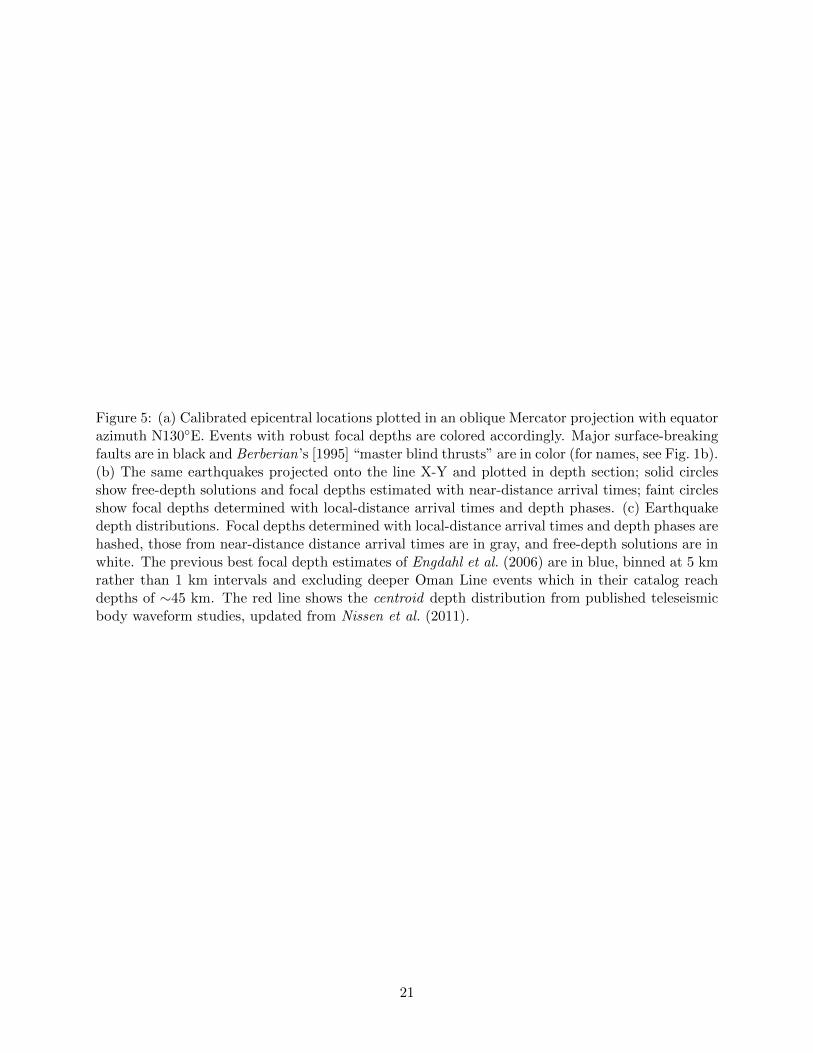
Figure 5: (a) Calibrated epicentral locations plotted in an oblique Mercator projection with equatorazimuth N130◦E. Events with robust focal depths are colored accordingly. Major surface-breakingfaults are in black and Berberian’s [1995] “master blind thrusts” are in color (for names, see Fig. 1b).(b) The same earthquakes projected onto the line X-Y and plotted in depth section; solid circlesshow free-depth solutions and focal depths estimated with near-distance arrival times; faint circlesshow focal depths determined with local-distance arrival times and depth phases. (c) Earthquakedepth distributions. Focal depths determined with local-distance arrival times and depth phases arehashed, those from near-distance distance arrival times are in gray, and free-depth solutions are inwhite. The previous best focal depth estimates of Engdahl et al. (2006) are in blue, binned at 5 kmrather than 1 km intervals and excluding deeper Oman Line events which in their catalog reachdepths of ∼45 km. The red line shows the centroid depth distribution from published teleseismicbody waveform studies, updated from Nissen et al. (2011).
21

35˚
36˚
37˚
45˚ 46˚
MFF
HZF
HZF
MFF
LakeSNF
SNF
SNF
MRF
MRF
1950 1970 1990 2010
20 km<3.03.0 - 4.04.0 - 5.05.0 - 6.06.0 - 7.0
>7.0
Piranshahr pull-apart
basin
Figure 6: Close-up map of calibrated earthquake epicenters in the northern Zagros, colored by timeand scaled by magnitude, showing the deviation of seismicity from the Main Recent Fault (MRF).Where they are available, teleseismic focal mechanisms are plotted at their relocated epicentersusing the same scaling and coloring. Major surface-breaking faults are in black and Berberian’s[1995] “master blind thrusts” are in color. HZF = High Zagros Fault; MFF = Mountain FrontFault; SNF = Serow Normal Faults (Copley and Jackson, 2006).
22
50˚ 51˚49˚
32˚
31˚
33˚
MFF
DEF
MZRF
Izeh Zone
ZFFMFF
DEF
MFF
MRF
DezfulEmbayment
1950 1970 1990 2010
20 km<3.03.0 - 4.04.0 - 5.05.0 - 6.06.0 - 7.0
>7.0
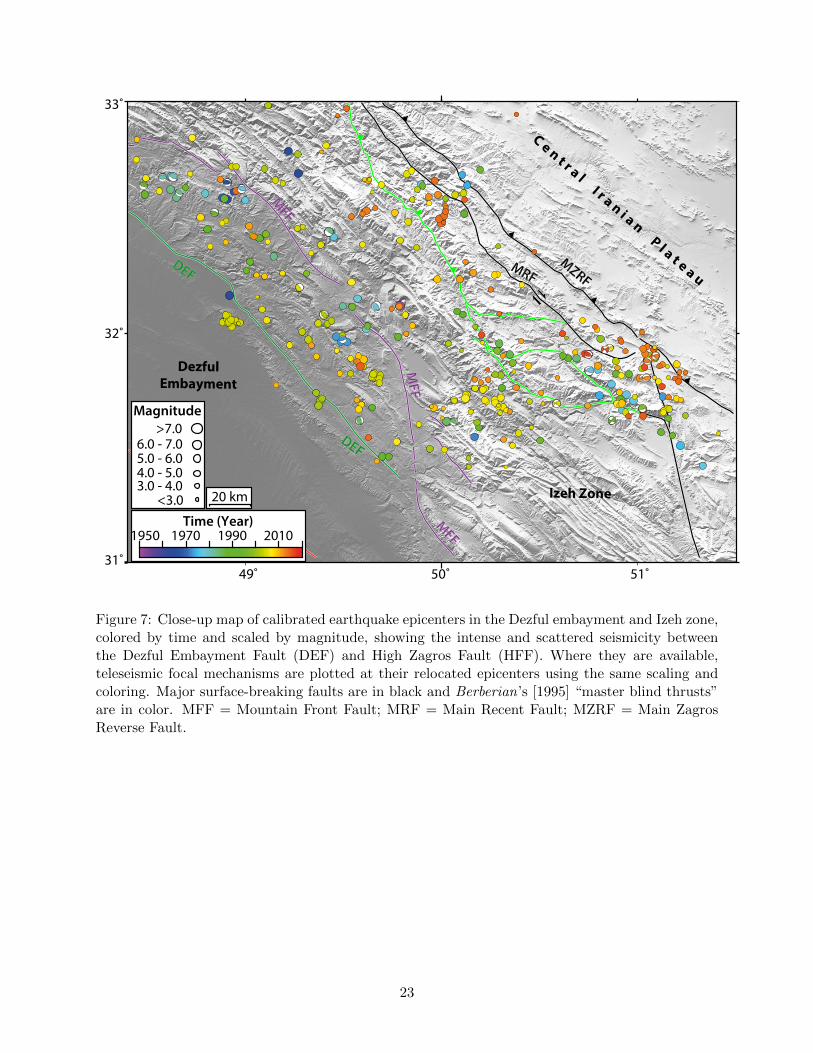
Figure 7: Close-up map of calibrated earthquake epicenters in the Dezful embayment and Izeh zone,colored by time and scaled by magnitude, showing the intense and scattered seismicity betweenthe Dezful Embayment Fault (DEF) and High Zagros Fault (HFF). Where they are available,teleseismic focal mechanisms are plotted at their relocated epicenters using the same scaling andcoloring. Major surface-breaking faults are in black and Berberian’s [1995] “master blind thrusts”are in color. MFF = Mountain Front Fault; MRF = Main Recent Fault; MZRF = Main ZagrosReverse Fault.
23

30˚
29˚
51˚ 52˚
Kareh Bas F.
Surmeh F.
ZFFKazerun F.
MFF
Sabz Pushan F.
Kazerun F.
1950 1970 1990 2010
20 km<3.03.0 - 4.04.0 - 5.05.0 - 6.06.0 - 7.0
>7.0
Figure 8: Close-up map of calibrated earthquake epicenters in the northern Fars Arc, colored bytime and scaled by magnitude, showing the area with possible conjugate left-lateral faulting lie eastof the northern strand of the Kazerun fault. Where they are available, teleseismic focal mechanismsare plotted at their relocated epicenters using the same scaling and coloring. Major surface-breakingfaults are in black and Berberian’s [1995] “master blind thrusts” are in color. MFF = MountainFront Fault.
24

Focal Depth (km)0 10 20
Cent
roid
Dep
th (k
m)
300
10
20
30
centroid = focal
centroid = focal +5 km
centroid = focal -5 km
Figure 9: Focal mechanisms of several larger earthquakes for which robust estimates of both centroid(from published waveform modeling studies) and focal depth (from this study) are available. Greyfocal mechanisms are from the Qeshm cluster.
25