
Seismology Schools Study Handbook Earthquakes
21
Seismology Handbook (Intellectual Output O4) Schools Study Earthquakes Editors Gerasimos Chouliaras, Marianna Potsidi Authors Gerasimos Chouliaras, Georgios Drakatos, Maria Staviani National Observatory of Athens, Greece Georgios Mavromanolakis, Marianna Potsidi, Sofoklis Sotiriou, Ilias Stouraitis, Giannis Alexopoulos Ellinogermaniki Agogi, Greece Date April 2016 Dissemination Level Public Status Final
Transcript of Seismology Schools Study Handbook Earthquakes

Seismology
Handbook (Intellectual Output O4)
Schools Study
Earthquakes
Editors Gerasimos Chouliaras, Marianna Potsidi
Authors
Gerasimos Chouliaras, Georgios Drakatos, Maria Staviani
National Observatory of Athens, Greece
Georgios Mavromanolakis, Marianna Potsidi,
Sofoklis Sotiriou, Ilias Stouraitis, Giannis Alexopoulos
Ellinogermaniki Agogi, Greece
Date April 2016
Dissemination Level Public
Status Final
[Πληκτρολογήστε κείμενο]
2
Consortium Members
Name Organization Abbreviation Country
Gerasimos Chouliaras Georgios Drakatos
Maria Staviani
NATIONAL OBSERVATORY OF
ATHENS NOA Greece
Georgios Mavromanolakis Marianna Potsidi
Manolis Chaniotakis Sofoklis Sotiriou Ilias Stouraitis
Giannis Alexopoulos
ELLINOGERMANIKI AGOGI
EA Greece
Yvoni Pavlou Marios Papaevripidou
Zacharias Zacharia Nikoletta Xenofontos
Maria Irakleous Anna Fiakkou
UNIVERSITY OF CYPRUS UCY Cyprus
Bulent Cavas Elif Dönertaş Yavas
Zeynep Ozben Zeynep Hulagu
Ismail Aras Sedriye Guler
BAHCESEHIR EGITIM KURUMLARI ANONIM
SIRKETI
BEKAS Turkey
Luigi Cerri Flora Di Martino
FONDAZIONE IDIS-CITTÀ DELLA SCIENZA
IDIS Italy
Daniela Pavlova Philip Ivanov Orlin Kouzov
Radoslav Yoshinov Stefan Hadjitodorov
NATIONAL RESEARCH NETWORK ASSOCIATION
NRNA Bulgaria

[Πληκτρολογήστε κείμενο]
3
The project Schools Study Earthquakes has been funded with support from
the European Commission under the Erasmus+ programme
(Grant agreement number 2015-1-EL01-KA201-013966)
2017 The Schools Study Earthquakes Consortium
Except where otherwise noted, this work is licensed under a Creative Commons
Attribution-NonCommercial 4.0 International license (CC BY-NC 4.0)
Unless otherwise noted, photos, pictures or graphic content shown in this
document are included hereby and utilized only for educational non-commercial
purposes.
[Πληκτρολογήστε κείμενο]
4
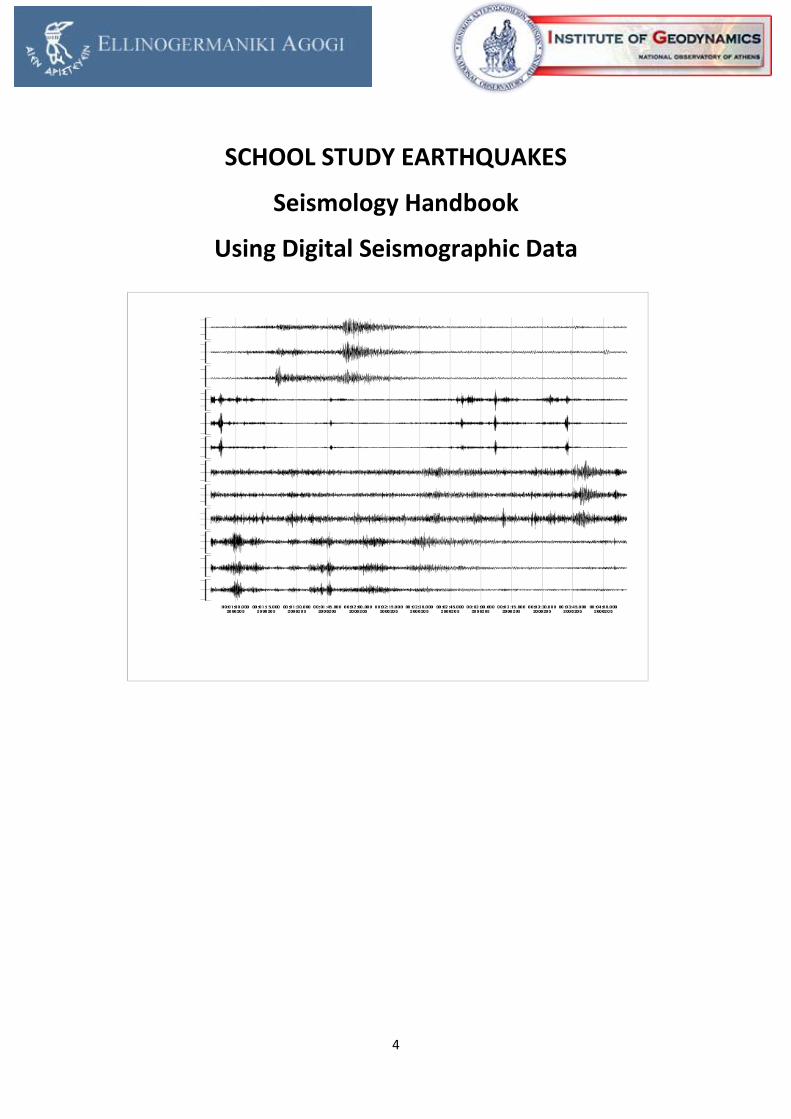
SCHOOL STUDY EARTHQUAKES
Seismology Handbook
Using Digital Seismographic Data
[Πληκτρολογήστε κείμενο]
5
Preface
The main purpose of educational systems is acquisition of knowledge. One of the most effective ways to achieve this is by triggering learners’ interest. Consequently, this triggering becomes a need. In natural sciences, it is observed that students become enthusiastic and respond better during the learning process when experimental techniques, through both physical and/or virtual means, are employed. And for this employment seismology presents itself as an excellent candidate. Seismology is fundamental for understanding our dynamic planet, as it plays a vital role in monitoring both human-made and natural seismogenic events. Appreciating and understanding seismology's scientific and societal relevance requires knowledge of geology and physics, often coupled with elements of civil engineering, environmental sciences, official state policy, geography and geo-engineering as well as other scientific disciplines. Seismology is thus an engaging and quantitative science exhibiting a number of inherent links to wider areas of science but also to society providing the opportunity for applying multi-field scientific hands on experimental as well as theoretical activities. Seismology in school education can promote scientific literacy at all levels but its benefits go far wider than simply providing scientific knowledge about this everyday natural phenomenon. It provides the basis for informed action to protect lives and property on local, regional, and national levels. As such, the SSE project and proposed approach will not only contribute to providing high-level educational material to teachers and their students but will also highlight aspects of civil protection, citizenship, civil responsibility and cooperation.

[Πληκτρολογήστε κείμενο]
6
Teachers guide The main purpose of this guide is to step by step direct teachers in organizing a training route which would ultimately lead to the active students’ participation in seismograph handling process, recording and studying seismograms, calculating seismic parameters and exchanging results and experience within their cooperation with other student groups participating in the project.

[Πληκτρολογήστε κείμενο]
7
STEP 1
Teachers should give pupils an incentive to the process in which they will participate so that they understand the need for dealing with the study of the seismicity of the country they live in. The teacher has to motivate them by providing initial information on earthquakes (e.g. how they are created) and encourage them to seek more information online, in printed form or by contacting scientists specialized on this subject. Some introductory information concerning the origin of earthquakes and the propagation of the seismic wave is presented below.
Earthquake Definition
An earthquake is a shaking of the ground. This could be due to the sudden breaking and movement of rock within the earth’s outermost crust (i.e tectonic plate relative movements) but also due to explosions. The edges of the shifting masses are marked by faults, which are breaks in the continuity of a body rock. Most earthquakes occur along the fault lines when the tectonic plates slide past each other or collide against each other. The shifting masses send out seismic waves that may be powerful enough to alter the surface of the Earth, opening cracks in the ground, cause volcanic eruptions, tsunamis and great damage in human-made structures. Seismic waves
They are waves of energy produced by the change in volume or shape of the medium and are travelling through the earth and recorded on seismographs. They are emitted from the seismic source to all directions and propagate with speeds depending on the elastic properties and density of the rocky crust.

[Πληκτρολογήστε κείμενο]
8
There are several different kinds of seismic waves but the two main types are body waves and surface waves. Body waves can travel through the earth's inner layers, but surface waves can only move along the surface of the earth’s crust. Either body or surface waves radiate seismic energy.
1. Body waves
They are emitted from the seismic source and by traveling through the inner layers of the crust body waves arrive before surface waves which are also emitted by an earthquake. The frequency of body waves is higher than the frequency of surface waves. Body waves are created at the seismic source and the two main types are the longitudinal primary waves (P-waves) and the transverse secondary waves (S-waves).
P-waves travel at higher speeds than the S-waves and thus arrive first at the seismic station and are recorded first on seismographs. P waves are also known as compressional waves, because of the pushing and pulling they do. Subjected to a P wave, particles move in the same direction that the wave is moving in, which is the direction that the energy is traveling in, and is sometimes called the 'direction of wave propagation' while S waves move rock particles up and down, or side-to-side--perpendicular to the direction of wave propagation. (Figure 1).
Figure 1. Left: A P Wave travels through a medium and Right: An S wave travels through a medium.

[Πληκτρολογήστε κείμενο]
9
Their speed is approximately 1.7 times higher than the speed of the S-waves which always follow and have greater amplitudes. Typical speed values for P and S waves are 5.5 km/s and 3.0 km/s for granite and near Earth’s surface and 1.5 km/s and 0 km/s for water. Time delay of the S-waves depends on the distance between the seismograph and the focus of the S waves. The amplitude of the P wave can move through solid rock and fluids, like water or the liquid layers of the earth. It pushes and pulls the rock it moves through just like sound waves push and pull the air. The S waves cannot travel through any liquid medium. It is this property of S waves that led seismologists to conclude that the Earth's outer core is a liquid.
2. Surface waves
When P and S waves meet surface layers or a discontinuity in the inner layers other type of waves are created. The prevailing ones are the surface waves. Travelling only through the crust, surface waves have a lower frequency than body waves and are easily distinguished on a seismogram as a result. Though they arrive after body waves, surface waves are almost entirely responsible for the damage and destruction associated with earthquakes. This damage and the strength of the surface waves are reduced in deeper earthquakes.
The two main types of surface waves are
• ƒ The Love waves (LQ)
• ƒ The Rayleigh waves (LR)
Surface waves have larger amplitudes and periods and thus their role is very important especially in the behavior of large man-made structures. Their amplitudes reach their maximum near the Earth's surface and decrease exponentially with depth. This means that earthquakes occurring near the
[Πληκτρολογήστε κείμενο]
10
surface generate large surface waves. As the focus depth increases the amplitude of the surface waves in seismogram decreases. In earthquakes near the surface, surface waves dominate in the seismogram while for focus depths > 100 km are negligible. Therefore, we know at a quick look at a seismogram whether we have a near-surface earthquake or a deep-focus one.
The propagation velocity of LQ and LR waves depends on their frequency. The larger the frequency the lower the speed is. This means that waves with a larger wavelength will be recorded first. The LQ waves have relatively higher velocities than those of LR waves and thus are recorded first.
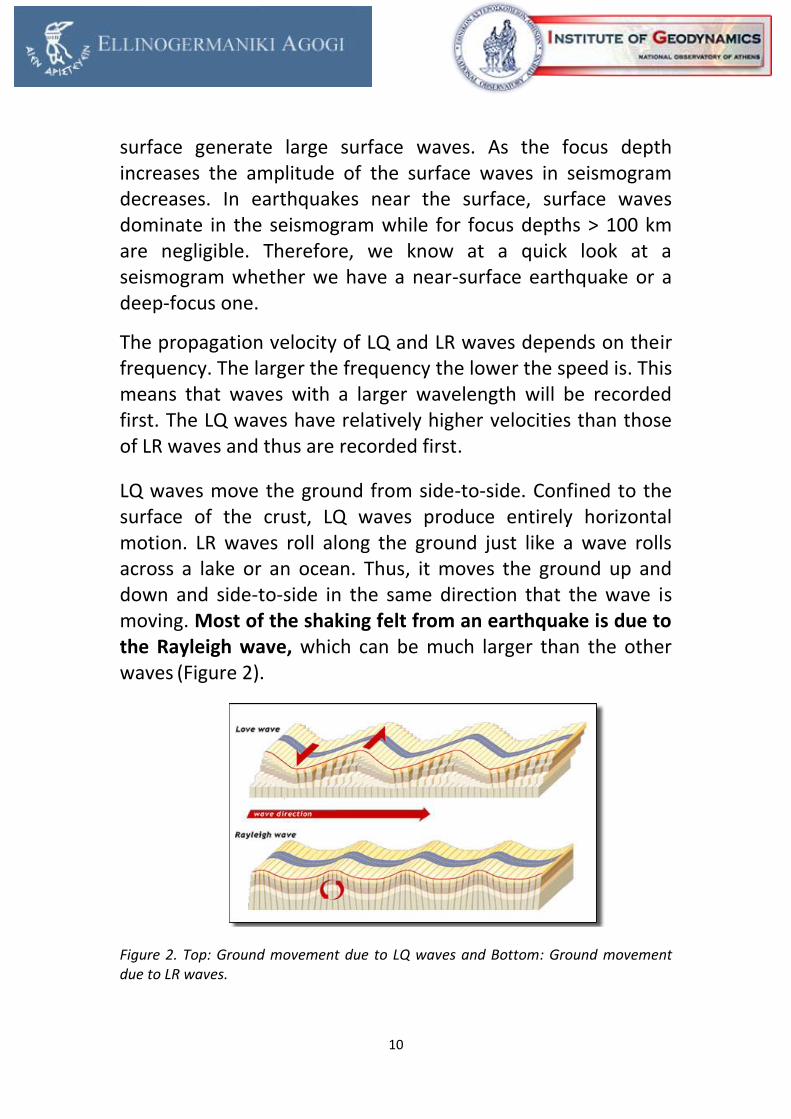
LQ waves move the ground from side-to-side. Confined to the surface of the crust, LQ waves produce entirely horizontal motion. LR waves roll along the ground just like a wave rolls across a lake or an ocean. Thus, it moves the ground up and down and side-to-side in the same direction that the wave is moving. Most of the shaking felt from an earthquake is due to the Rayleigh wave, which can be much larger than the other waves (Figure 2).
Figure 2. Top: Ground movement due to LQ waves and Bottom: Ground movement due to LR waves.
[Πληκτρολογήστε κείμενο]
11
Seismic parameters
The basic seismic parameters are a) the origin time, b) the focal depth, c) the epicenter, d) the magnitude. Initial information on some of the seismic parameters is presented below.
a) The time of origin of the earthquake.
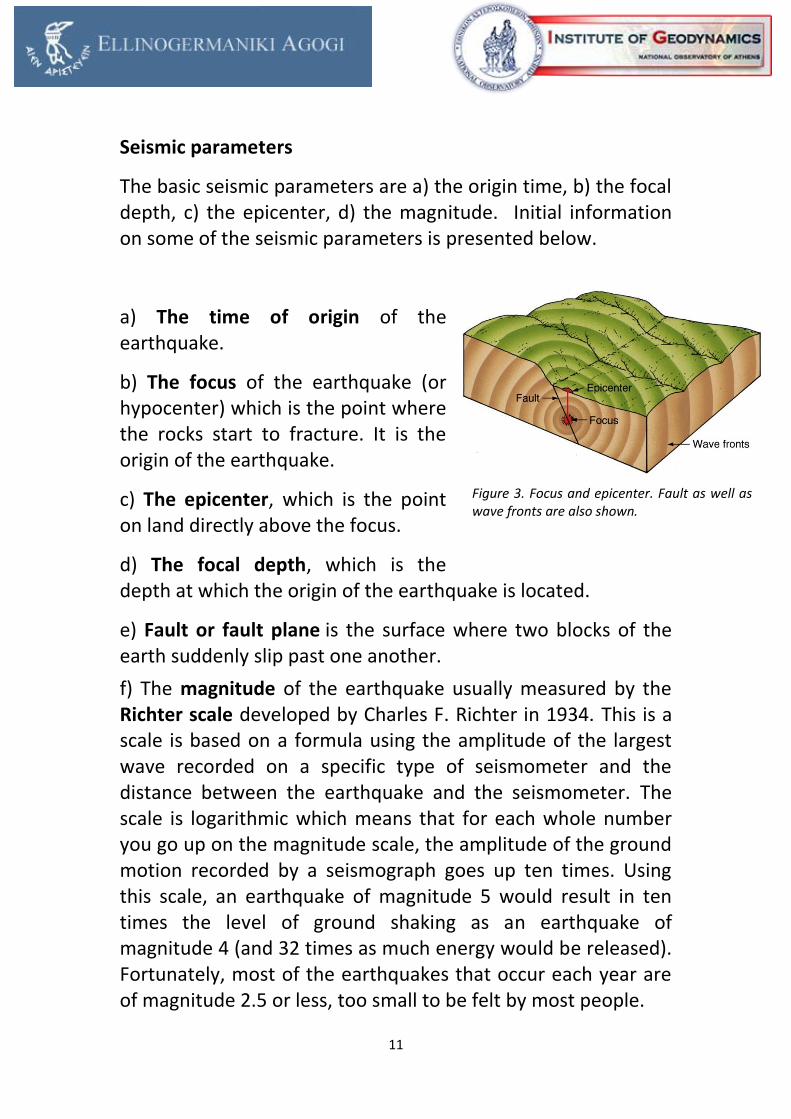
b) The focus of the earthquake (or hypocenter) which is the point where the rocks start to fracture. It is the origin of the earthquake.
c) The epicenter, which is the point on land directly above the focus.
d) The focal depth, which is the depth at which the origin of the earthquake is located.
e) Fault or fault plane is the surface where two blocks of the earth suddenly slip past one another.
f) The magnitude of the earthquake usually measured by the Richter scale developed by Charles F. Richter in 1934. This is a scale is based on a formula using the amplitude of the largest wave recorded on a specific type of seismometer and the distance between the earthquake and the seismometer. The scale is logarithmic which means that for each whole number you go up on the magnitude scale, the amplitude of the ground motion recorded by a seismograph goes up ten times. Using this scale, an earthquake of magnitude 5 would result in ten times the level of ground shaking as an earthquake of magnitude 4 (and 32 times as much energy would be released). Fortunately, most of the earthquakes that occur each year are of magnitude 2.5 or less, too small to be felt by most people.
Figure 3. Focus and epicenter. Fault as well as wave fronts are also shown.

[Πληκτρολογήστε κείμενο]
12
Within the framework of this project students will focus on the origin time, the focus, the focal depth, the epicenter and the magnitude of the earthquake.

[Πληκτρολογήστε κείμενο]
13
STEP 2
At this stage, students should get familiar with the use of the seismograph and be able to read a seismogram. Important information on seismograms is given below and teachers can get more information from the references at the end of the guide.
Earthquake recording on seismographs
Seismographs are instruments used to detect and record earthquakes. Generally, they consist of a mass attached to a fixed base. A seismograph is securely mounted onto the surface of the Earth so that when the Earth shakes, the entire unit shakes with it, except for the mass on the spring which has inertia, and remains in the same place. As the seismograph shakes under the mass, the recording device on the mass records the relative motion between itself and the rest of the instrument, thus recording the ground motion. In reality, these mechanisms are no longer manual, but instead work by measuring electronic changes produced by the motion of the ground with respect to the mass. The motion of the base with respect to the mass is commonly transformed into an electrical voltage. The electrical voltage is recorded on paper, magnetic tape, or another recording medium. This record is proportional to the motion of the seismometer mass relative to the Earth, but it can be mathematically converted to a record of the absolute motion of the ground. Seismograph generally refers to the seismometer and its recording device as a single unit. A seismometer is the internal part of the seismograph, which may be a pendulum or a mass mounted on a spring; however, it is often used synonymously with "seismograph".

[Πληκτρολογήστε κείμενο]
14
Seismometers are oriented in one direction so that they record the ground movement (East-West, North-South or vertical). So in order to represent the ground movement due to seismic waves that reach the Earth's surface in many laboratories scientists use data from three seismometers oriented in three directions. Seismographs are installed in the ground throughout the world and operate as seismographic network.
A typical seismogram
When studying a seismogram we can draw conclusions on the distance between the focus and the station as well as on the magnitude. We cannot tell with absolute accuracy where the epicenter is. For this to be done data from at least two other stations is needed. Before we will refer to this we present a typical seismogram (Figure 4).
Figure 4. A typical seismogram with P, S and surface waves monitored.
Direction of tape movement in the seismograph
P-Wave S-Wave Surface wave
Time
Noise

[Πληκτρολογήστε κείμενο]
15
Reading a seismogram
When you look at a seismogram, there will be wiggly lines all across it. These are all the seismic waves that the seismograph has recorded. Most of these waves were so small that nobody felt them. These tiny microseisms can be caused by heavy traffic near the seismograph, waves hitting a beach, the wind, and any number of other ordinary things that cause some shaking of the seismograph. There may also be some little dots or marks evenly spaced along the paper. These are marks for every minute that the drum of the seismograph has been turning. How far apart these minute marks are will depend on the kind of seismograph.
The P wave will be the first wiggle that is bigger than the rest of the little ones (the microseisms). Because P waves are the fastest seismic waves, they will usually be the first ones that your seismograph records. The next set of seismic waves on your seismogram will be the S waves. The S waves travel at about 0.6 times the velocity of P waves. These have generally higher amplitudes than the P waves. They travel with a shearing motion which slows them, but can cause greater ground motion.
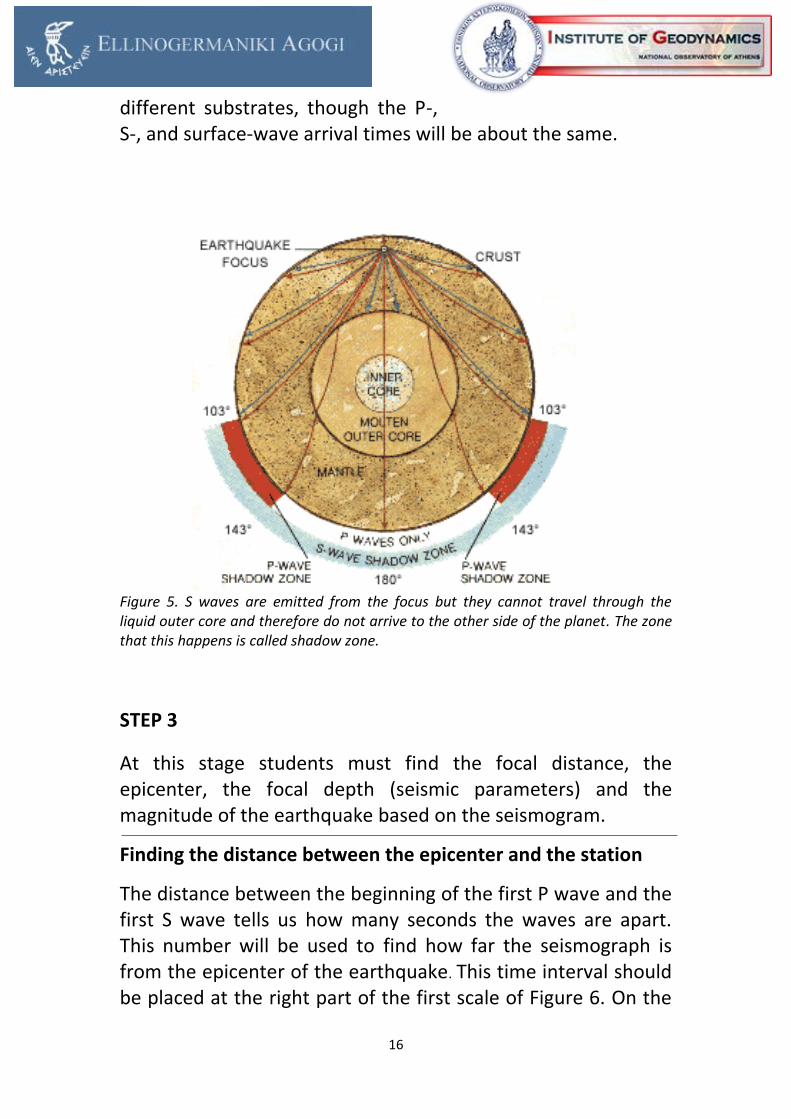
If there aren't any S waves marked on your seismogram, it probably means the earthquake happened on the other side of the planet. S waves can't travel through the liquid layers of the earth so these waves never made it to your seismograph.
The surface waves (Love and Rayleigh waves) are often the largest and longest wave sets on the seismogram. Surface waves travel slower than S waves. They travel across the surface of the globe. For really close earthquakes, the body and surface waves may appear on the seismogram simultaneously. Regional stations equidistance from a distant earthquake could have markedly different amplitudes if they are located on
[Πληκτρολογήστε κείμενο]
16
different substrates, though the P-, S-, and surface-wave arrival times will be about the same.
Figure 5. S waves are emitted from the focus but they cannot travel through the liquid outer core and therefore do not arrive to the other side of the planet. The zone that this happens is called shadow zone.
STEP 3
At this stage students must find the focal distance, the epicenter, the focal depth (seismic parameters) and the magnitude of the earthquake based on the seismogram.
Finding the distance between the epicenter and the station
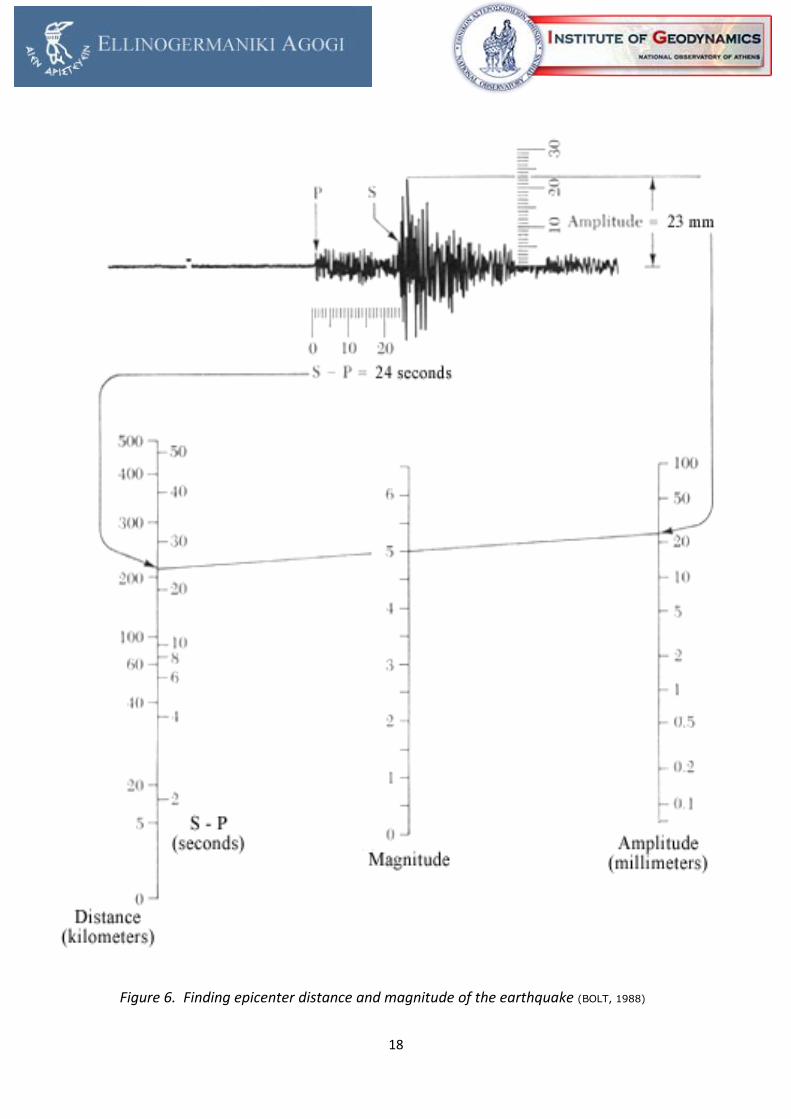
The distance between the beginning of the first P wave and the first S wave tells us how many seconds the waves are apart. This number will be used to find how far the seismograph is from the epicenter of the earthquake. This time interval should be placed at the right part of the first scale of Figure 6. On the

[Πληκτρολογήστε κείμενο]
17
left part of this scale we read the distance between the epicenter and the seismic station. In the seismogram of Figure 6 S and P waves are 24 seconds away. 24 is put on the right part and on the left part we read 215 km. Thus, the epicenter is 215 km away from the seismic station.
Finding the epicenter of the earthquake
So that you find the epicenter (approximately) of the earthquake you must draw a circle with a radius equal to the number you came up above (that is 215 km). The center of the circle will be the location of the seismograph. The epicenter of the earthquake is somewhere on the edge of that circle.
You must follow the same procedure for the distance to the epicenter that the other seismograms recorded (with the location of those seismographs at the center of their circles). All of those circles should overlap. The point where all of the circles overlap is where the approximate epicenter of the earthquake is located (Figure 7).
Finding the magnitude of the earthquake
You should measure the highest wave amplitude on your seismogram. On the seismogram of Figure 6 the amplitude is 23 millimeters. Then, find 23 millimeters on the right side of the chart and mark that point.
Place a ruler (or straight edge) on the chart between the points you marked for the distance to the epicenter and the amplitude. The point where your ruler crosses the middle line on the chart marks the magnitude of the earthquake, showing how strong the earthquake was. In Figure 6 the earthquake had a magnitude of 5.0.
[Πληκτρολογήστε κείμενο]
18
Figure 6. Finding epicenter distance and magnitude of the earthquake (BOLT, 1988)

[Πληκτρολογήστε κείμενο]
19
Figure 7. Finding the epicenter of the earthquake using the “triangulation” method. The point where the three circles intersect is the approximate epicenter of the earthquake.
STEP 4
At this stage students should be prompted to visit http://www.gein.noa.gr/el/teleutaia-anakoinothenta and check the accuracy of their calculation on the epicenter distance and the magnitude of the earthquake. In case of deviations they should mention the possible reasons behind experimental errors. Finally, students should participate in a teleconference meeting bringing up their results on their calculations, the conclusions drawn and the experience gained.

[Πληκτρολογήστε κείμενο]
20
References
• Berenguer, J.L., and Virieux J., 2006. Projet educatif “Sismo des
Ecoles”. Geosciences, BRGM’S journal for a sustainable Earth, 4.
• Bobbio, A., and Zollo, A., 2000. The educational broadband seismic
network at Naples (Southern Italy), Orfeus, Electronic Newsletter,
2(3), 23.
• EDUSEIS-The Educational Seismological Project.
URL:http://eduseis.na.infn.it/sitoing/ project/goals.htm
• Bolt, B. Earthquakes, W.H. Freeman and Company, 1988.
• Bullen, S. (1998). Seismology in schools. Astronomy and
Geophysics, 39 (4), 25–26.
• Denton, P. (2008). Seismology in schools: 10 years on. Astronomy
and Geophysics, 49 (6), 613–614.
• Denton, P. (2009). UK school seismology project. EMSC Newsletter
, (24), 16–19.
• Hall-Wallace, M., & Wallace, T. C., Jr. (1996). Seismologists and
educational outreach. Seismological Research Letters, 67 (5), 3–5.
• Milne, J. (1888). Pendulum seismometers. Nature, 37 , 570–571.
• Nolet, G. (1993). A Volksseismometer . IRIS newsletter Spring 1993
(1998). Seismology in schools. Astronomy and Geophysics, 39 (4),
25–26.
• Husebye, E.S., Beketova, E., & Fedorenko, Y.V., 2003. School yard
seismology, Journal of Geoscience Education, 51(3), 329-335.
• S.S.N-Seismological Society of America–Education.
URL:http://www.seismosoc.org/society/ education/
[Πληκτρολογήστε κείμενο]
21
• S.S.N-Seismological Society of
America–Seismological Research letters. URL:http://www.
seismosoc.org/publications/srl/eduquakes.php
• USESN, 2001. Shaking up America’s Classrooms: A Vision for
Educational Seismology in the United States. Available online at:
http://www.indiana.edu/~usesn/text/eos.html
• Virieux, J. (2000). Educational seismological project: EDUSEIS.
Seismological Research Letters,71 , 530–535.
• Zollo, A., A. Bobbio, J. L. Berenguer, F. Courboulex, P. Denton, G.
Festa, A. Sauron, S. Solarino, F. Haslinger, and D. Giardini (2014).
The European experience of educational seismology, in
Geoscience Research and Outreach, V. C. H. Tong (Editor),
Springer, Dordrecht, The Netherlands, 145–170, doi: 10.1007/978-
94-007-6943-4_10.