![Influence of observed mantle anisotropy on isotropic ...geophysics.earth.northwestern.edu/seismology/suzan/... · 6] In constructing our anisotropy data vector we limit ourselves](https://static.fdocuments.us/doc/165x107/5edab890272674784f04f4e8/influence-of-observed-mantle-anisotropy-on-isotropic-6-in-constructing-our.jpg)
Seismology and Deep Mantle Temperature Structure
38
Seismology and Deep Mantle Temperature Structure Thorne Lay
Transcript of Seismology and Deep Mantle Temperature Structure

Seismology and Deep Mantle Temperature Structure
Thorne Lay

Travel time of seismic phases vs. angular distance
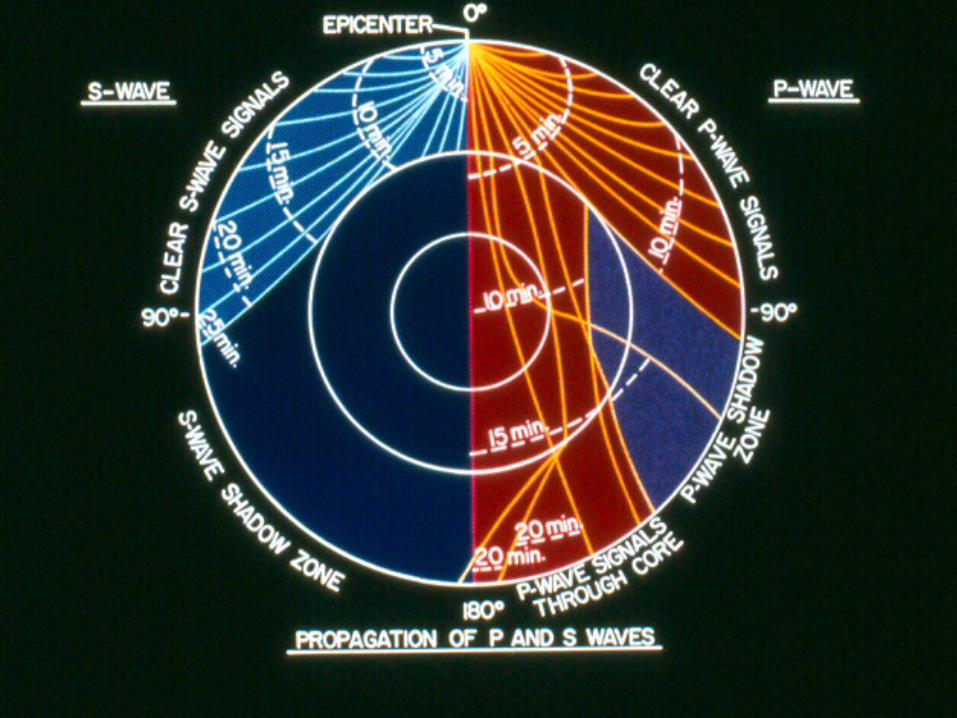
PREM Preliminary Reference Earth Model
Dziewonski and Anderson [1981, PEPI]


Basic fact: We can determine Earth elasticity structure directly from seismic wave observations with NO required knowledge of temperature structure. Hence, temperature structure cannot be directly inferred from seismic velocity structure. Additional constraints from mineral physics/petrology are required. Uncertainties in composition and, to some extent, in the seismological models, give uncertainties in inferred temperatures.
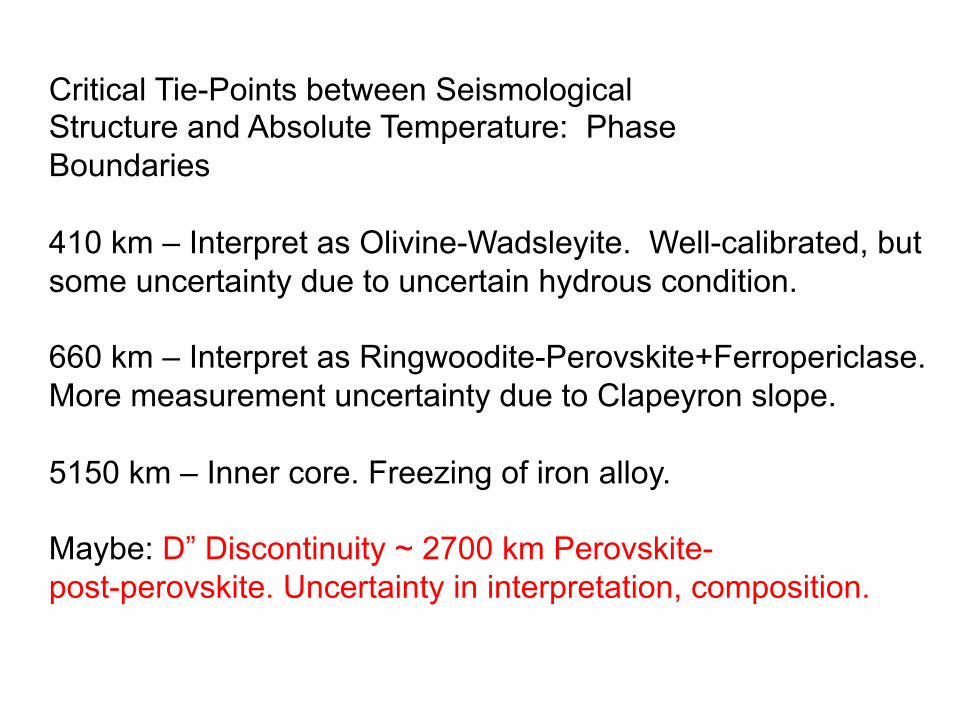
Critical Tie-Points between Seismological Structure and Absolute Temperature: Phase Boundaries 410 km – Interpret as Olivine-Wadsleyite. Well-calibrated, but some uncertainty due to uncertain hydrous condition. 660 km – Interpret as Ringwoodite-Perovskite+Ferropericlase. More measurement uncertainty due to Clapeyron slope. 5150 km – Inner core. Freezing of iron alloy. Maybe: D” Discontinuity ~ 2700 km Perovskite- post-perovskite. Uncertainty in interpretation, composition.
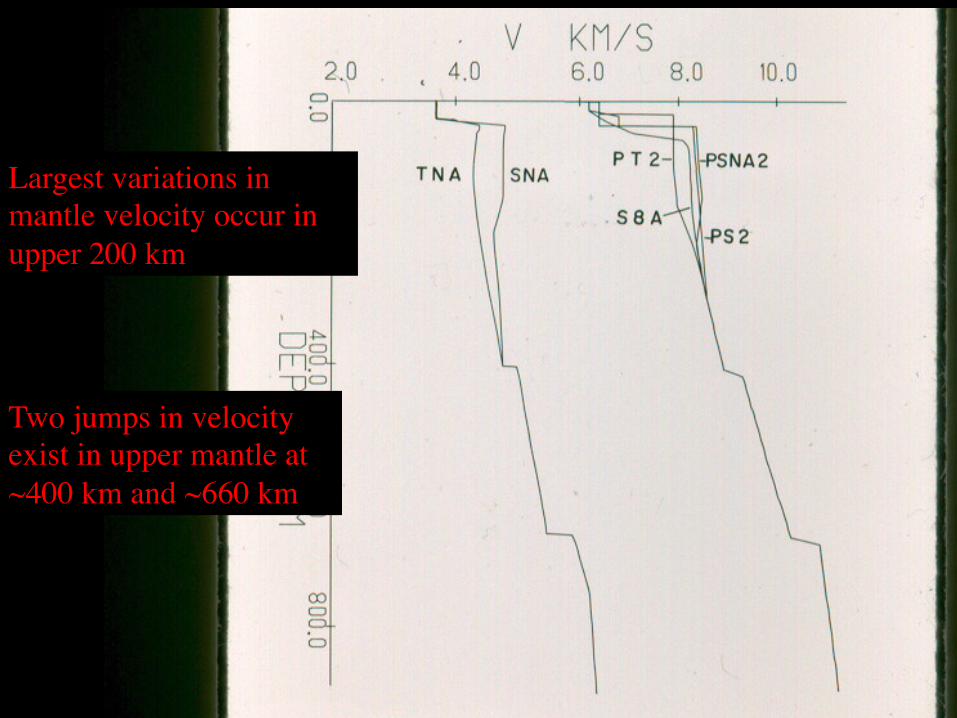
Largest variations in mantle velocity occur in upper 200 km
Two jumps in velocity exist in upper mantle at ~400 km and ~660 km

(Mg,Fe)2SiO4 Olivine Polymorphs Forsterite (α)(0-~410 km)
Wadsleyite (β-spinel)(~410-~520 km)
Ringwoodite (γ-spinel)(~520-660 km)
Orange, purple red are MgO6 octahedraBlue SiO4 tetrahedra
Major Upper Mantle Minerals - 1

Mg-Silicate Perovskite(Mg,Fe)SiO3 Ferropericlase (Mg,Fe)O
Purple: Mg or FeYellow: O
Blue – SiO6 OctahedraRed – Mg or Fe
Major Lower Mantle Minerals

Mantle seismic discontinuities vary laterally in depth (P). If, the discontinuity is due to a phase transition with calibrated P-T (Clapeyron) slope; lateral variations in T can be inferred from topography on the boundary.

Boundary topography has been determined from reflections, conversions, from phases impinging on the boundaries from above and below. Here are raypaths of SS ‘precursors’ from 410 and 660. Can map boundary undulations.


Early Seismic Models for D” – Focus on velocity gradients and some reflectivity. Diffracted waves indicate reduced gradient.

Many waveforms have an arrival, Scd, before the core reflection, ScS, and sometimes an arrival before PcP

D” discontinuities
200-300 km thick 0.5-3% velocity increase
Seismology: Nataf & Houard [1993], Sidorin et al. [1999ab] Mineral Physics: Murakami et al [2004], Shim et al [2004] Tsuchiya et al [2004];
Iitaka et al [2004]
Post-Perovskite phase change?

D” Discontinuity is Probably due to a Phase Change
Lay et al., EOS, 2005

Rokosky, Lay, Garnero [GRL, 2004]
Region Beneath the Caribbean and Central America
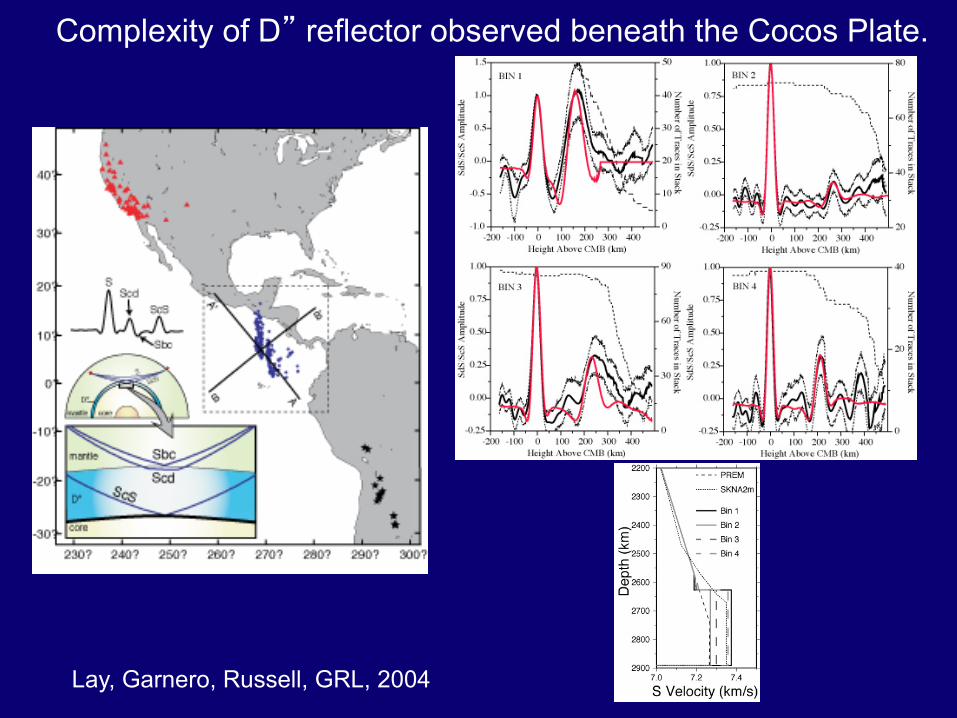
Lay, Garnero, Russell, GRL, 2004
Complexity of D” reflector observed beneath the Cocos Plate.

Thomas, Garnero, Lay, JGR, 2004
Complexity of reflectors may imply thermal complexity affecting the phase boundary.
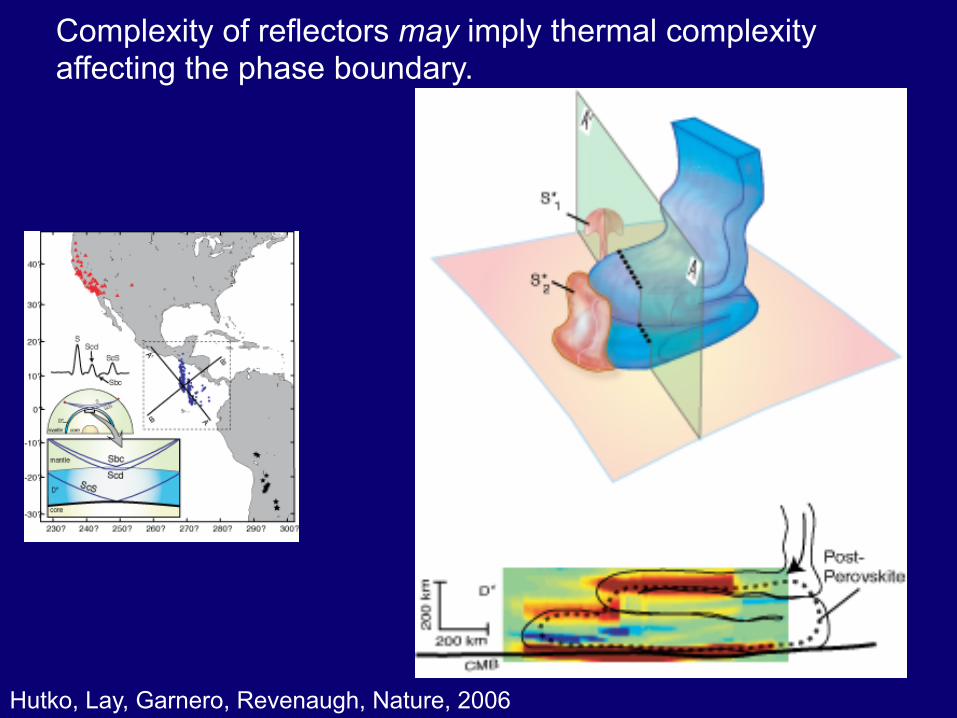
Hutko, Lay, Garnero, Revenaugh, Nature, 2006
Complexity of reflectors may imply thermal complexity affecting the phase boundary.

Lay and Garnero, AGU Monograph, 2007

Lay, Garnero, Williams [2004, PEPI]
LLSVPs have Distinctive Vs/Vp Behavior Shear velocities anti-correlated with bulk sound velocities.

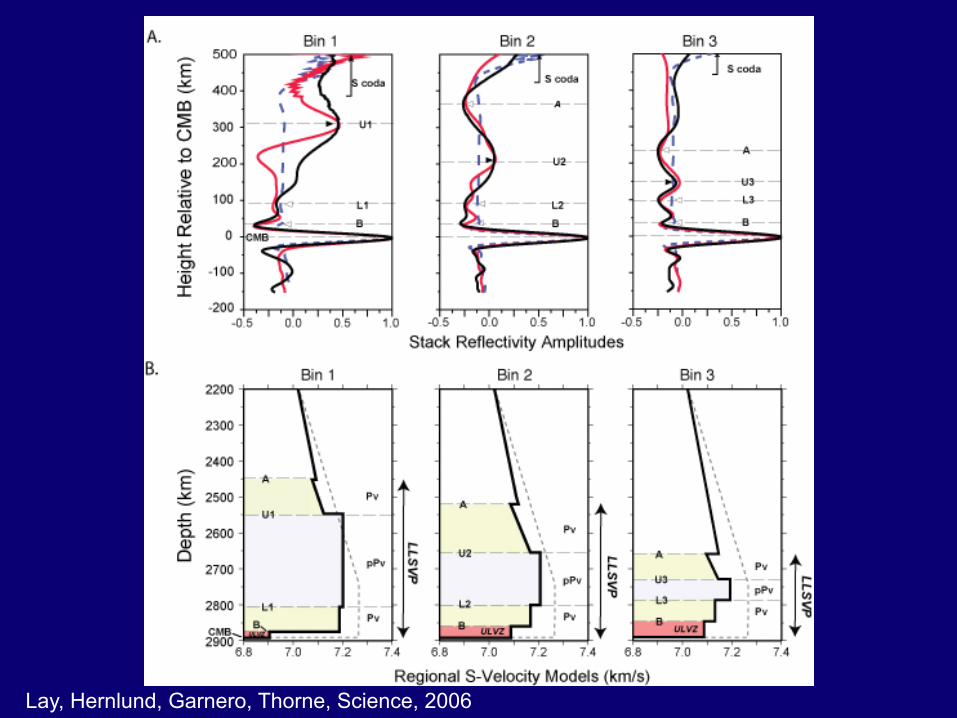
Lay, Hernlund, Garnero, Thorne, Science, 2006
LLSVPs are usually thought to be warm; hence no post-perovskite there, or only a thin layer. But, this appears to be wrong. S wave discontinuities are seen where they “shouldn’t be”.
Lay, Hernlund, Garnero, Thorne, Science, 2006
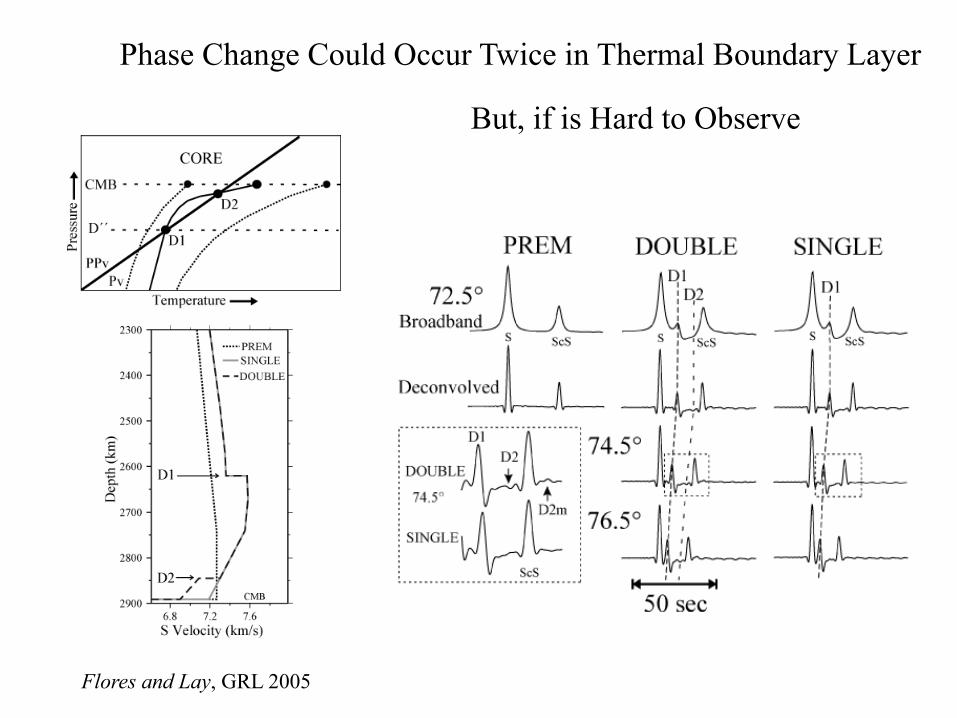
Phase Change Could Occur Twice in Thermal Boundary Layer
But, if is Hard to Observe
Flores and Lay, GRL 2005

Lay, Hernlund, Garnero, Thorne, Science, 2006
Paired velocity discontinuities may be due to double-crossing of the phase boundary in lowermost thermal boundary layer, as suggested by Hernlund et al., Nature, 2005
Lay, Hernlund, Garnero, Thorne, Science, 2006
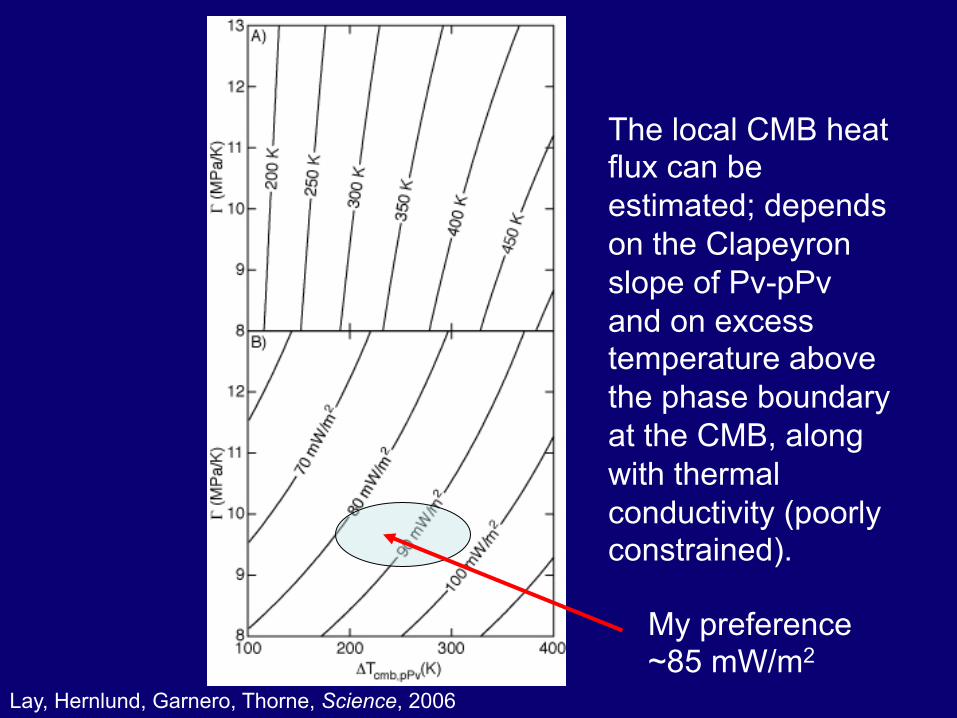
The local CMB heat flux can be estimated; depends on the Clapeyron slope of Pv-pPv and on excess temperature above the phase boundary at the CMB, along with thermal conductivity (poorly constrained).
My preference ~85 mW/m2

Lay et al., Science, 2006

Lay et al., Science, 2006
So, we think pPv could exist both in cold down-welling regions and in cool down-wellings inside large chemical piles.
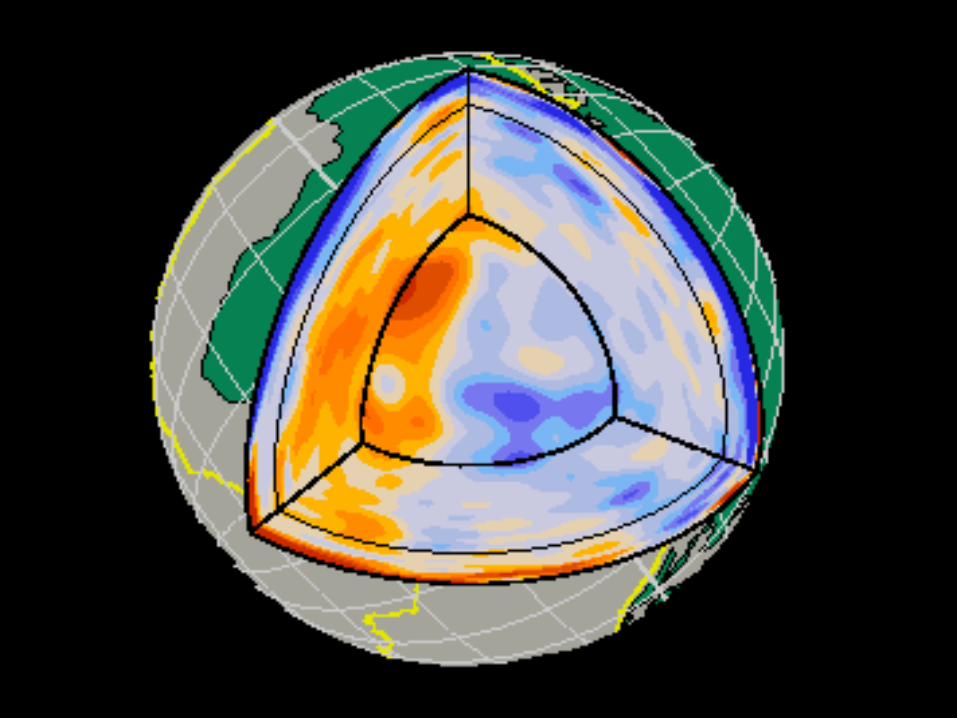
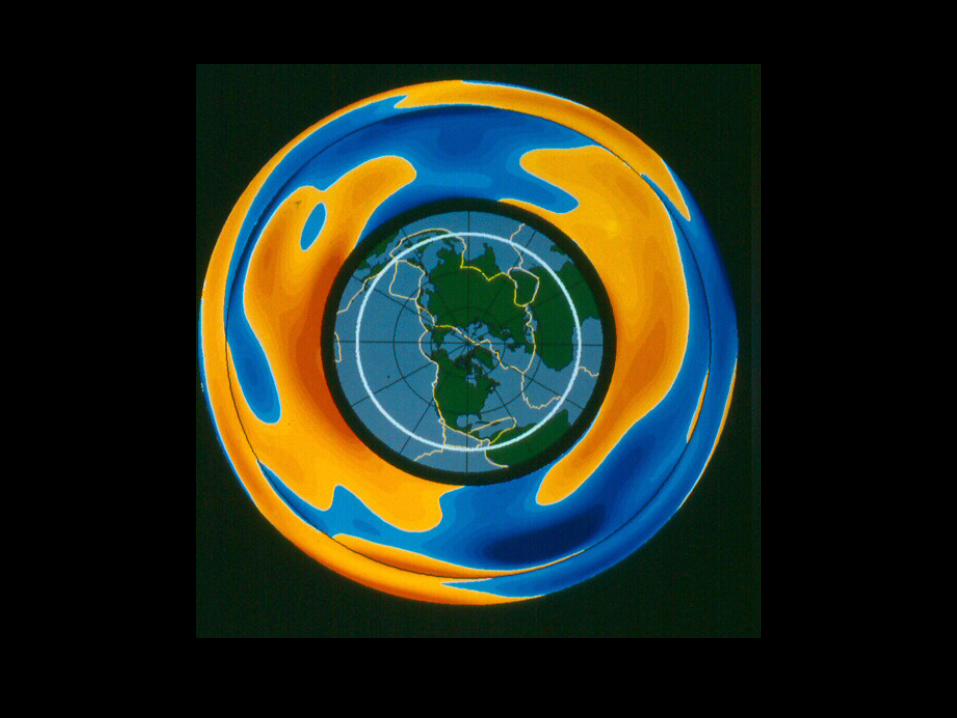
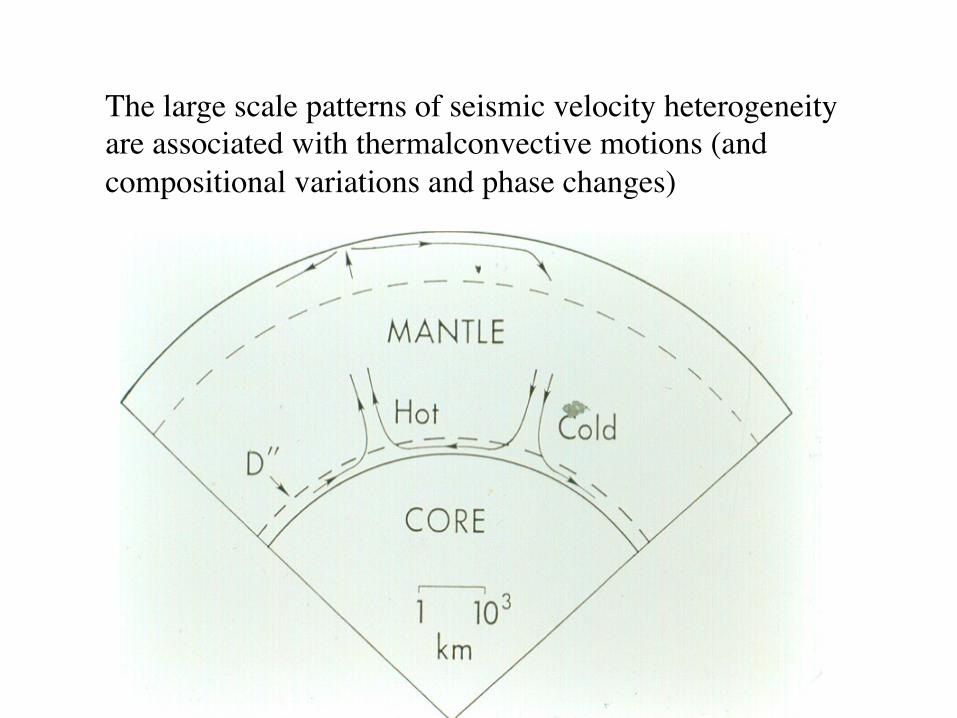
The large scale patterns of seismic velocity heterogeneityare associated with thermalconvective motions (and compositional variations and phase changes)
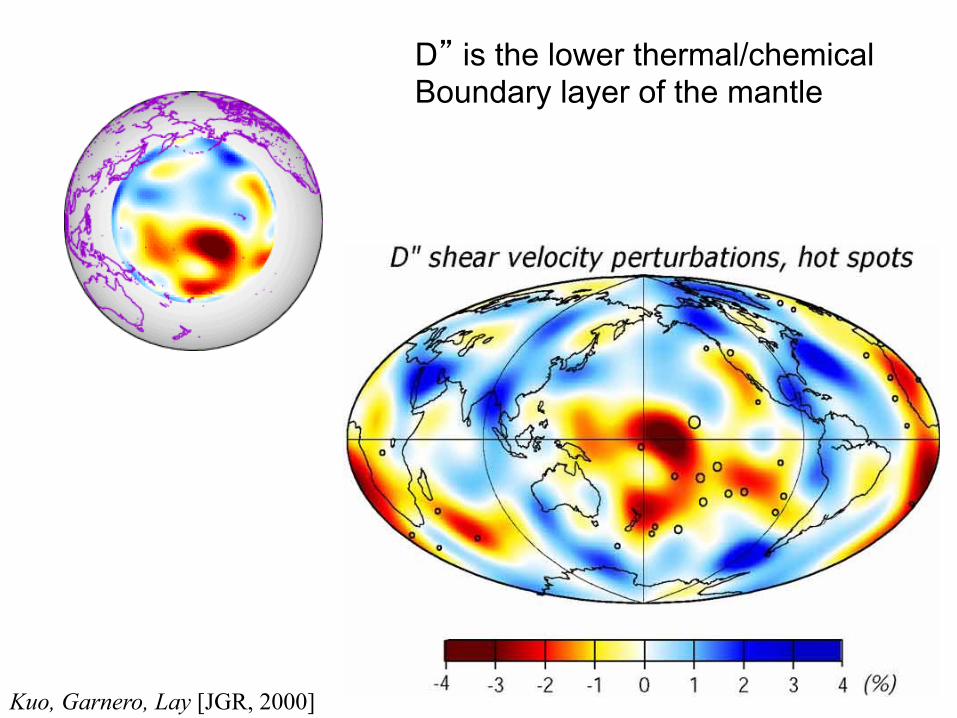
Kuo, Garnero, Lay [JGR, 2000]
D” is the lower thermal/chemical Boundary layer of the mantle
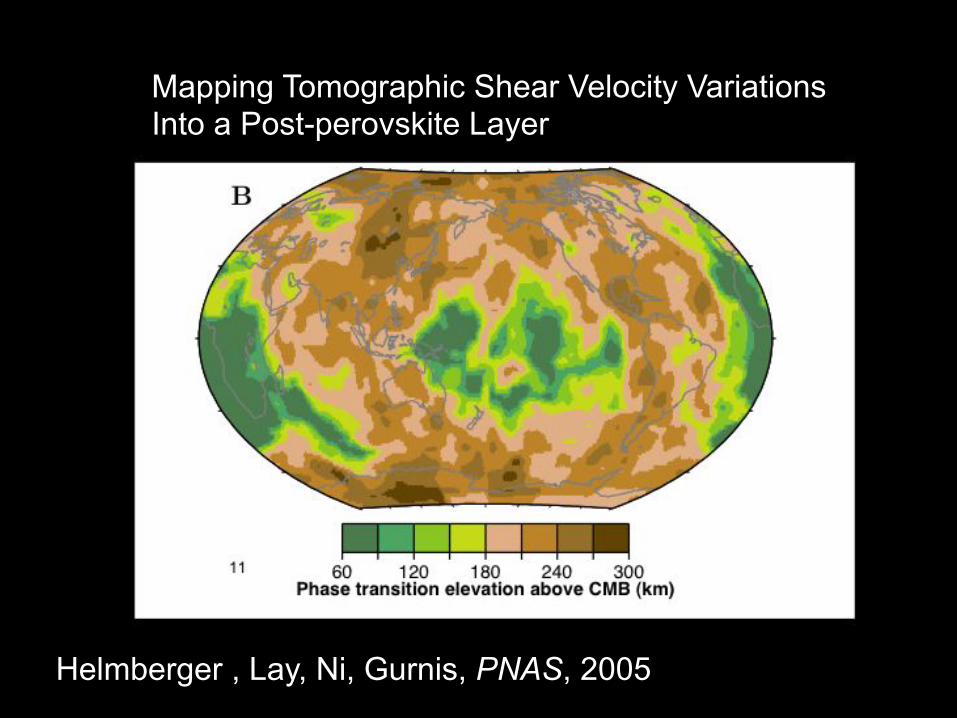
Mapping Tomographic Shear Velocity Variations Into a Post-perovskite Layer
Helmberger , Lay, Ni, Gurnis, PNAS, 2005