Seismic Refraction Survey of Tar Sands Deposits in Ijebu ...
13
IOSR Journal of Applied Geology and Geophysics (IOSR-JAGG) e-ISSN: 2321–0990, p-ISSN: 2321–0982.Volume 1, Issue 3 (Sep. – Oct. 2013), PP 82-94 www.iosrjournals.org www.iosrjournals.org 82 | Page Seismic Refraction Survey of Tar Sands Deposits in Ijebu East of Ogun State Southwestern Nigeria 1 Raimi Adepoju Mufutau m.Sc 2 Odunaike Rasaki Kola Phd 3 Fasunwon Olusola O. Phd 4 Alagbe Oluwafemi A. Phd 1 Department Of Science Laboratory Technology Osun State Polytechnic Iree, P.M.B 301 Osun State Nigeria 2 Department Of Physics Olabisi Onabanjo University, Ago-Iwoye Ogun State Nigeria 4 Department Of Physics, Bowen University, Iwo, Osun State Nigeria Abstract: The interest in unconventional oil resources such as tar sands and oil shale is known as great economic importance by the governments and industries have encouraged researches in the development of these resources. Vast tar sands resources have not been adequately explored and exploited by the Nigeria Government except for accumulation of oil, natural gas and other minerals but bitumen has proven to be of great value. This motivated this study to map the ttar sands deposit at Imeri in Ijebu-Imushin within the Ijebu- East Local government area in Ogun State using seismic refraction survey. A seismic refraction survey at Imeri, Ijebu-Imushin of Ijebu-east carried out using ABEM seismograph Terraloc Mark 6 Version 2.22. Thirteen (13) traverse were taken along five profiles in which both forward and backward shooting were measured to cover a spread of 72m in each of the traverse. Pickwin software was adopted to analyze the results obtained in order to give information on first arrival time and velocity of the first and second layers. A model of the earth structure was achieved by the used of ploterrafa (refraction) software and interpretation to determine the thickness of the first layer from the processed data based on the known geology of the area. The velocities of the first layers of five profiles ranges from (0.75-1.30)km/s and the second layers velocities ranges were from (1.31-2.51)km/s. The presence of tar sands was observed in traverse 6, 7, 8, 9&12, with velocity values (1.12-1.44)km/s, (1.12- 1.86)km/s and (1.10-1.47)km/s respectively. The depth of the first layer of the above profile ranges from (5.00- 7.10)m. traverses 1-5, 10,11 and 13 shows the presence of clayed sand, sand, sand stone clay and sand with water saturation respectively was observed. The information provided by the analysis and interpretation of the first arrival time and velocities of the first and second layers concise with geologic trends of the rock type in the study area. It was observed that the velocities of the first and second layers were related to the velocities of different earth materials and their depth to the surface. Keywords: ABEM seismograph Terraloc Mark 6 Version 2.22, first arrival time, Pickwin, ploterrafa (refraction) software. I. Introduction Tar sands (also referred to as oil sands) are a combination of clay, sand water and bitumen, a heavy black viscous oil. Tar sands can be mined and processed to extract the oil – rich bitumen, which is then refined into oil. The bitumen in tar sands cannot be pumped from the ground in its natural state; instead tar sand deposits are mined, usually strip mining or open pit techniques, or the oil is extracted by underground heating with additional upgrading. Oduniake et al., (2009). These are grains of sand or, in some cases, porous carbonate rocks that are intimately mixed with a very heavy, asphalt-like crude oil called bitumen. The bitumen is much too viscous to be recovered by traditional petroleum recovery techniques. Tar sands contain about 10-15% bitumen, the remainder being sand or other inorganic materials. (committee on oil and tar sand, 2008). Tar sands are mined and processed to generate oil similar to oil pumped from conventional oil wells, but extracting oil from tar sands is more complex than conventional oil recovery. Oil sands recovery processes include extraction and separation system to separate the bitumen from the clay, sand and water that make up the tar sands. Bitumen also requires additional upgrading before it can be refined. Because it is so viscous (thick), it also requires dilution with lighter hydrocarbons to make it transportable by pipelines. Kambiz (2010) The estimated world – wide resources of tar sands are about three times the known petroleum reserves. The world’s largest deposit of tar sands is near Athabasca, in Alberta. Bitumen was first discovered in Nigerian in 1990 in a belt stretching from east of Ijebu Ode (Ogun State) through Okitipupa (Ondo State), Benin (Edo State) and then in lagos State. A series of drilling programmes between 1907 and 1914 by the defunct Nigerian Bitumen Corporation (NBC), following the trend of the outcrop belt from north-east of Lekki Lagoon in Ogun State to the south east in Odon State. Nigeria’s
Transcript of Seismic Refraction Survey of Tar Sands Deposits in Ijebu ...

IOSR Journal of Applied Geology and Geophysics (IOSR-JAGG)
e-ISSN: 2321–0990, p-ISSN: 2321–0982.Volume 1, Issue 3 (Sep. – Oct. 2013), PP 82-94 www.iosrjournals.org
www.iosrjournals.org 82 | Page
Seismic Refraction Survey of Tar Sands Deposits in Ijebu East of
Ogun State Southwestern Nigeria
1 Raimi Adepoju Mufutaum.Sc
2 Odunaike Rasaki Kola Phd
3 Fasunwon Olusola O.
Phd 4
Alagbe Oluwafemi A. Phd 1Department Of Science Laboratory Technology Osun State Polytechnic Iree, P.M.B 301 Osun State Nigeria
2Department Of Physics Olabisi Onabanjo University, Ago-Iwoye Ogun State Nigeria 4Department Of Physics, Bowen University, Iwo, Osun State Nigeria
Abstract: The interest in unconventional oil resources such as tar sands and oil shale is known as great
economic importance by the governments and industries have encouraged researches in the development of these resources. Vast tar sands resources have not been adequately explored and exploited by the Nigeria
Government except for accumulation of oil, natural gas and other minerals but bitumen has proven to be of
great value. This motivated this study to map the ttar sands deposit at Imeri in Ijebu-Imushin within the Ijebu-
East Local government area in Ogun State using seismic refraction survey. A seismic refraction survey at Imeri,
Ijebu-Imushin of Ijebu-east carried out using ABEM seismograph Terraloc Mark 6 Version 2.22. Thirteen (13)
traverse were taken along five profiles in which both forward and backward shooting were measured to cover a
spread of 72m in each of the traverse. Pickwin software was adopted to analyze the results obtained in order to
give information on first arrival time and velocity of the first and second layers. A model of the earth structure
was achieved by the used of ploterrafa (refraction) software and interpretation to determine the thickness of the
first layer from the processed data based on the known geology of the area. The velocities of the first layers of
five profiles ranges from (0.75-1.30)km/s and the second layers velocities ranges were from (1.31-2.51)km/s. The presence of tar sands was observed in traverse 6, 7, 8, 9&12, with velocity values (1.12-1.44)km/s, (1.12-
1.86)km/s and (1.10-1.47)km/s respectively. The depth of the first layer of the above profile ranges from (5.00-
7.10)m. traverses 1-5, 10,11 and 13 shows the presence of clayed sand, sand, sand stone clay and sand with
water saturation respectively was observed. The information provided by the analysis and interpretation of the
first arrival time and velocities of the first and second layers concise with geologic trends of the rock type in the
study area. It was observed that the velocities of the first and second layers were related to the velocities of
different earth materials and their depth to the surface.
Keywords: ABEM seismograph Terraloc Mark 6 Version 2.22, first arrival time, Pickwin, ploterrafa
(refraction) software.
I. Introduction
Tar sands (also referred to as oil sands) are a combination of clay, sand water and bitumen, a heavy
black viscous oil. Tar sands can be mined and processed to extract the oil – rich bitumen, which is then refined
into oil. The bitumen in tar sands cannot be pumped from the ground in its natural state; instead tar sand
deposits are mined, usually strip mining or open pit techniques, or the oil is extracted by underground heating
with additional upgrading. Oduniake et al., (2009).
These are grains of sand or, in some cases, porous carbonate rocks that are intimately mixed with a very heavy,
asphalt-like crude oil called bitumen. The bitumen is much too viscous to be recovered by traditional petroleum
recovery techniques. Tar sands contain about 10-15% bitumen, the remainder being sand or other inorganic
materials. (committee on oil and tar sand, 2008).
Tar sands are mined and processed to generate oil similar to oil pumped from conventional oil wells, but extracting oil from tar sands is more complex than conventional oil recovery. Oil sands recovery processes
include extraction and separation system to separate the bitumen from the clay, sand and water that make up the
tar sands. Bitumen also requires additional upgrading before it can be refined. Because it is so viscous (thick), it
also requires dilution with lighter hydrocarbons to make it transportable by pipelines. Kambiz (2010)
The estimated world – wide resources of tar sands are about three times the known petroleum reserves.
The world’s largest deposit of tar sands is near Athabasca, in Alberta.
Bitumen was first discovered in Nigerian in 1990 in a belt stretching from east of Ijebu Ode (Ogun
State) through Okitipupa (Ondo State), Benin (Edo State) and then in lagos State. A series of drilling
programmes between 1907 and 1914 by the defunct Nigerian Bitumen Corporation (NBC), following the trend
of the outcrop belt from north-east of Lekki Lagoon in Ogun State to the south east in Odon State. Nigeria’s

Seismic Refraction Survey Of Tar Sands Deposits In Ijebu East Of Ogun State Southwestern Nigeria
www.iosrjournals.org 83 | Page
reserves of oil sands are estimated to be 30 to 40 billion barrels of heavy oil in place with future potential
recovery of 3,654 x 106 billion barrels (Adegoke et al., 1991).
The by-product of the bitumen can be useful domestically; pitch a by-product of bitumen can be used
as a smokeless, domestic charcoal/coal briquette. It is also a useful material for petroleum and allied industries.
Nigeria is known to have enormous reserves of oil sands within a belt that cut across Ogun, Ondo and Edo
states, covering a distance of approximately 10 km. Oduniake et al., (2010).
Today’s oil price is good news for heavy oil developers. But the past year has also brought new economic realities in the two biggest heavy oil resource countries. It increased scrutiny of environmental issues
surrounding unconventional oil development.
The inclination is to call these challenges “non-technical”. But all the challenges that heavy oil
development faces will ultimately be dealt with through the development of new technology. The country to
look at all possible sources, including its significant heavy oil deposits to the economy of the concern country.
Ministry of mines and steel development (MMSD) 2010.
II. Materials And Methods The survey involved the understudying of the geology, topography and general selling of the, follow by
seismic refraction measurements and interpretation of the acquired data by geophysical software using pickwin
and ploterafa software.
Figure 1 Base map of the study area
FIELD PROCEDURE
A total of five seismic refraction profiles were run, in which 13 traverse were cut both forward and
backward shooting were carried out along each traverse over a lateral distance of 75 meters. Sufficient information on the direct wave and reasonable converse of the reflection was obtained.
In – Line seismic refraction technique was carried out by placing 24 Geophones with a spacing of 3m
from each other (fig 1)
Seismic Refraction Survey Of Tar Sands Deposits In Ijebu East Of Ogun State Southwestern Nigeria
www.iosrjournals.org 84 | Page
75m
Shot
point Geophones
Reverse
Shot
point
3m 3m 3m 3m 3m 3m 3m 3m
Seismograph
Forward
Geophones
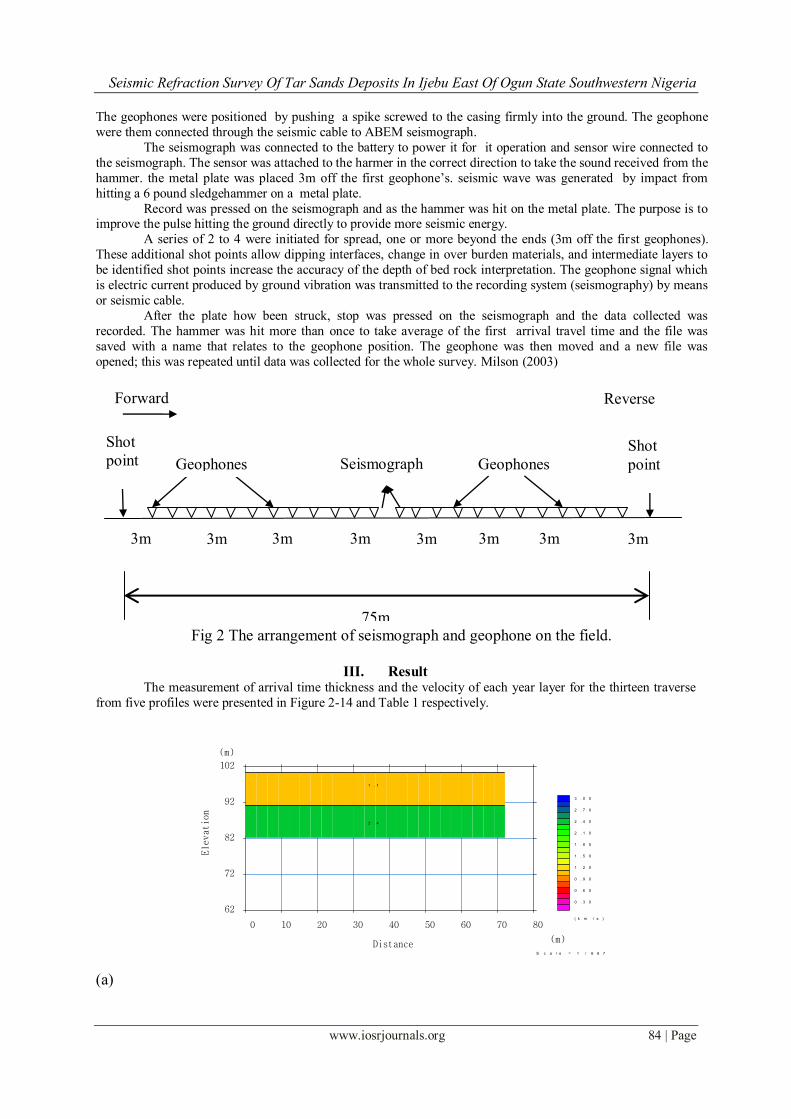
The geophones were positioned by pushing a spike screwed to the casing firmly into the ground. The geophone
were them connected through the seismic cable to ABEM seismograph.
The seismograph was connected to the battery to power it for it operation and sensor wire connected to
the seismograph. The sensor was attached to the harmer in the correct direction to take the sound received from the
hammer. the metal plate was placed 3m off the first geophone’s. seismic wave was generated by impact from
hitting a 6 pound sledgehammer on a metal plate.
Record was pressed on the seismograph and as the hammer was hit on the metal plate. The purpose is to improve the pulse hitting the ground directly to provide more seismic energy.
A series of 2 to 4 were initiated for spread, one or more beyond the ends (3m off the first geophones).
These additional shot points allow dipping interfaces, change in over burden materials, and intermediate layers to
be identified shot points increase the accuracy of the depth of bed rock interpretation. The geophone signal which
is electric current produced by ground vibration was transmitted to the recording system (seismography) by means
or seismic cable.
After the plate how been struck, stop was pressed on the seismograph and the data collected was
recorded. The hammer was hit more than once to take average of the first arrival travel time and the file was
saved with a name that relates to the geophone position. The geophone was then moved and a new file was
opened; this was repeated until data was collected for the whole survey. Milson (2003)
Fig 2 The arrangement of seismograph and geophone on the field.
III. Result
The measurement of arrival time thickness and the velocity of each year layer for the thirteen traverse
from five profiles were presented in Figure 2-14 and Table 1 respectively.
(a)
62
72
82
92
102
Elevation
(m)
0 10 20 30 40 50 60 70 80
(m)Distance
( k m / s )
0 . 3 0
0 . 6 0
0 . 9 0
1 . 2 0
1 . 5 0
1 . 8 0
2 . 1 0
2 . 4 0
2 . 7 0
3 . 0 0
S c a l e = 1 / 6 6 7
1 . 1
2 . 4
Seismic Refraction Survey Of Tar Sands Deposits In Ijebu East Of Ogun State Southwestern Nigeria
www.iosrjournals.org 85 | Page
0
10
20
30
40
50
60
70
Trav
elti
me
(ms)
0 10 20 30 40 50 60 70 80
(m)Distance
S c a l e = 1 / 6 6 7
(b)
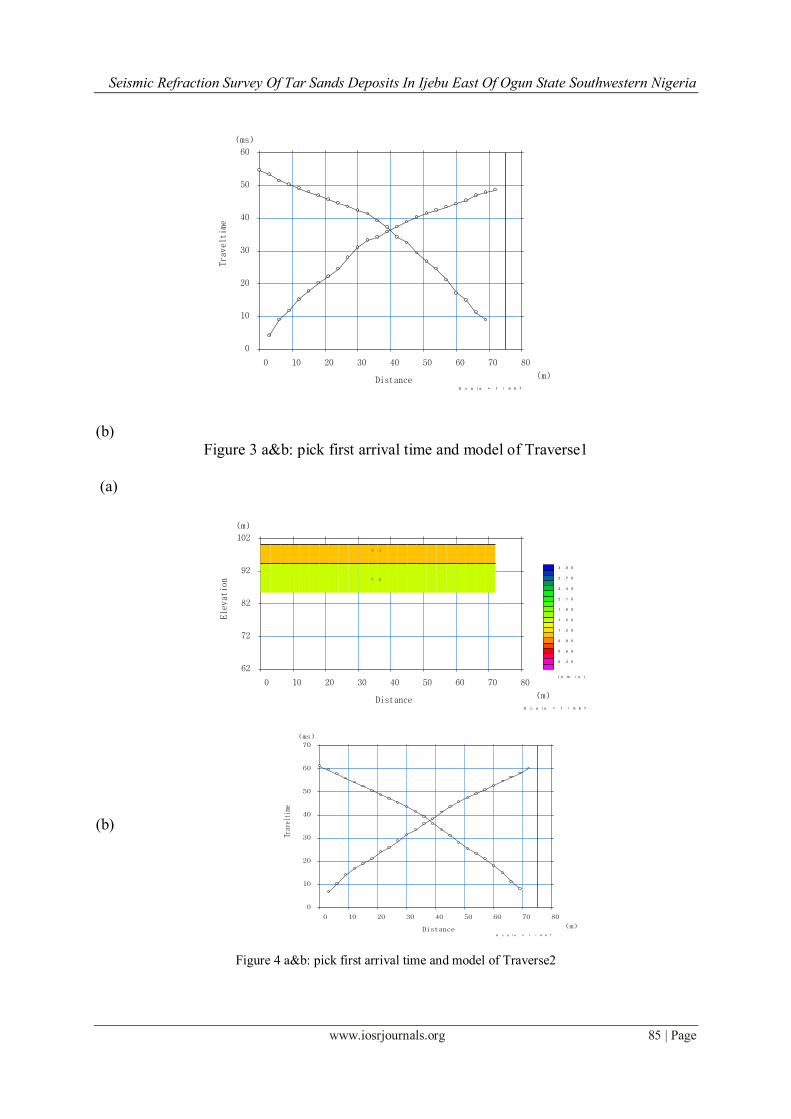
Figure 3 a&b: pick first arrival time and model of Traverse1
(a)
(b)
Figure 4 a&b: pick first arrival time and model of Traverse2
0
10
20
30
40
50
60
Traveltime
(ms)
0 10 20 30 40 50 60 70 80
(m)Distance
S c a l e = 1 / 6 6 7
62
72
82
92
102
Elevation
(m)
0 10 20 30 40 50 60 70 80
(m)Distance
( k m / s )
0 . 3 0
0 . 6 0
0 . 9 0
1 . 2 0
1 . 5 0
1 . 8 0
2 . 1 0
2 . 4 0
2 . 7 0
3 . 0 0
S c a l e = 1 / 6 6 7
1 . 1
1 . 5

Seismic Refraction Survey Of Tar Sands Deposits In Ijebu East Of Ogun State Southwestern Nigeria
www.iosrjournals.org 86 | Page
(a)
(b)
(b)
Figure 5 a&b: pick first arrival time and model of Traverse3
(a)
62
72
82
92
102
Elevation
(m)
0 10 20 30 40 50 60 70 80
(m)Distance
( k m / s )
0 . 3 0
0 . 6 0
0 . 9 0
1 . 2 0
1 . 5 0
1 . 8 0
2 . 1 0
2 . 4 0
2 . 7 0
3 . 0 0
S c a l e = 1 / 6 6 7
1 . 0
1 . 8
0
10
20
30
40
50
60
70
Traveltime
(ms)
0 10 20 30 40 50 60 70 80
(m)Distance
S c a l e = 1 / 6 6 7
62
72
82
92
102
Elevation
(m)
0 10 20 30 40 50 60 70 80
(m)Distance
( k m / s )
0 . 3 0
0 . 6 0
0 . 9 0
1 . 2 0
1 . 5 0
1 . 8 0
2 . 1 0
2 . 4 0
2 . 7 0
3 . 0 0
S c a l e = 1 / 6 6 7
1 . 0
1 . 6

Seismic Refraction Survey Of Tar Sands Deposits In Ijebu East Of Ogun State Southwestern Nigeria
www.iosrjournals.org 87 | Page
(b)
Figure 6 a&b: pick first arrival time and model of Traverse4
(a)
(b)
Figure 7a&b: pick first arrival time and model of Traverse5
0
10
20
30
40
50
60
70
Traveltime
(ms)
0 10 20 30 40 50 60 70 80
(m)Distance
S c a l e = 1 / 6 6 7
62
72
82
92
102
Elevation
(m)
0 10 20 30 40 50 60 70 80
(m)Distance
( k m / s )
0 . 3 0
0 . 6 0
0 . 9 0
1 . 2 0
1 . 5 0
1 . 8 0
2 . 1 0
2 . 4 0
2 . 7 0
3 . 0 0
S c a l e = 1 / 6 6 7
0 . 9
1 . 8
0
10
20
30
40
50
60
70
Trav
elti
me
(ms)
0 10 20 30 40 50 60 70 80
(m)Distance
S c a l e = 1 / 6 6 7

Seismic Refraction Survey Of Tar Sands Deposits In Ijebu East Of Ogun State Southwestern Nigeria
www.iosrjournals.org 88 | Page
(a)
(b)
Figure 8 a&b: pick first arrival time and model of Traverse6
(a)
62
72
82
92
102
Elevation
(m)
0 10 20 30 40 50 60 70 80
(m)Distance
( k m / s )
0 . 3 0
0 . 6 0
0 . 9 0
1 . 2 0
1 . 5 0
1 . 8 0
2 . 1 0
2 . 4 0
2 . 7 0
3 . 0 0
S c a l e = 1 / 6 6 7
1 . 3
1 . 4
0
10
20
30
40
50
60
70
Traveltime
(ms)
0 10 20 30 40 50 60 70 80
(m)Distance
S c a l e = 1 / 6 6 7
62
72
82
92
102
Elevation
(m)
0 10 20 30 40 50 60 70 80
(m)Distance
( k m / s )
0 . 3 0
0 . 6 0
0 . 9 0
1 . 2 0
1 . 5 0
1 . 8 0
2 . 1 0
2 . 4 0
2 . 7 0
3 . 0 0
S c a l e = 1 / 6 6 7
1 . 0
1 . 3

Seismic Refraction Survey Of Tar Sands Deposits In Ijebu East Of Ogun State Southwestern Nigeria
www.iosrjournals.org 89 | Page
(b) Figure 9 a&b: pick first arrival time and model of Traverse7
(a)
(b)
Figure 10 a&b: pick first arrival time and model of Traverse8
0
10
20
30
40
50
60
70
Traveltime
(ms)
0 10 20 30 40 50 60 70 80
(m)Distance
S c a l e = 1 / 6 6 7
62
72
82
92
102
Elevation
(m)
0 10 20 30 40 50 60 70 80
(m)Distance
( k m / s )
0 . 3 0
0 . 6 0
0 . 9 0
1 . 2 0
1 . 5 0
1 . 8 0
2 . 1 0
2 . 4 0
2 . 7 0
3 . 0 0
S c a l e = 1 / 6 6 7
1 . 1
1 . 5
0
10
20
30
40
50
60
70
80
Traveltime
(ms)
0 10 20 30 40 50 60 70 80
(m)Distance
S c a l e = 1 / 6 6 7

Seismic Refraction Survey Of Tar Sands Deposits In Ijebu East Of Ogun State Southwestern Nigeria
www.iosrjournals.org 90 | Page
(a)
(b) Figure 11 a&b: pick first arrival time and model of Traverse9
(a)
62
72
82
92
102
Elevation
(m)
0 10 20 30 40 50 60 70 80
(m)Distance
( k m / s )
0 . 3 0
0 . 6 0
0 . 9 0
1 . 2 0
1 . 5 0
1 . 8 0
2 . 1 0
2 . 4 0
2 . 7 0
3 . 0 0
S c a l e = 1 / 6 6 7
1 . 0
1 . 5
0
10
20
30
40
50
60
70
Traveltime
(ms)
0 10 20 30 40 50 60 70 80
(m)Distance
S c a l e = 1 / 6 6 7
62
72
82
92
102
Elevation
(m)
0 10 20 30 40 50 60 70 80
(m)Distance
( k m / s )
0 . 3 0
0 . 6 0
0 . 9 0
1 . 2 0
1 . 5 0
1 . 8 0
2 . 1 0
2 . 4 0
2 . 7 0
3 . 0 0
S c a l e = 1 / 6 6 7
0 . 9
2 . 0
Seismic Refraction Survey Of Tar Sands Deposits In Ijebu East Of Ogun State Southwestern Nigeria
www.iosrjournals.org 91 | Page
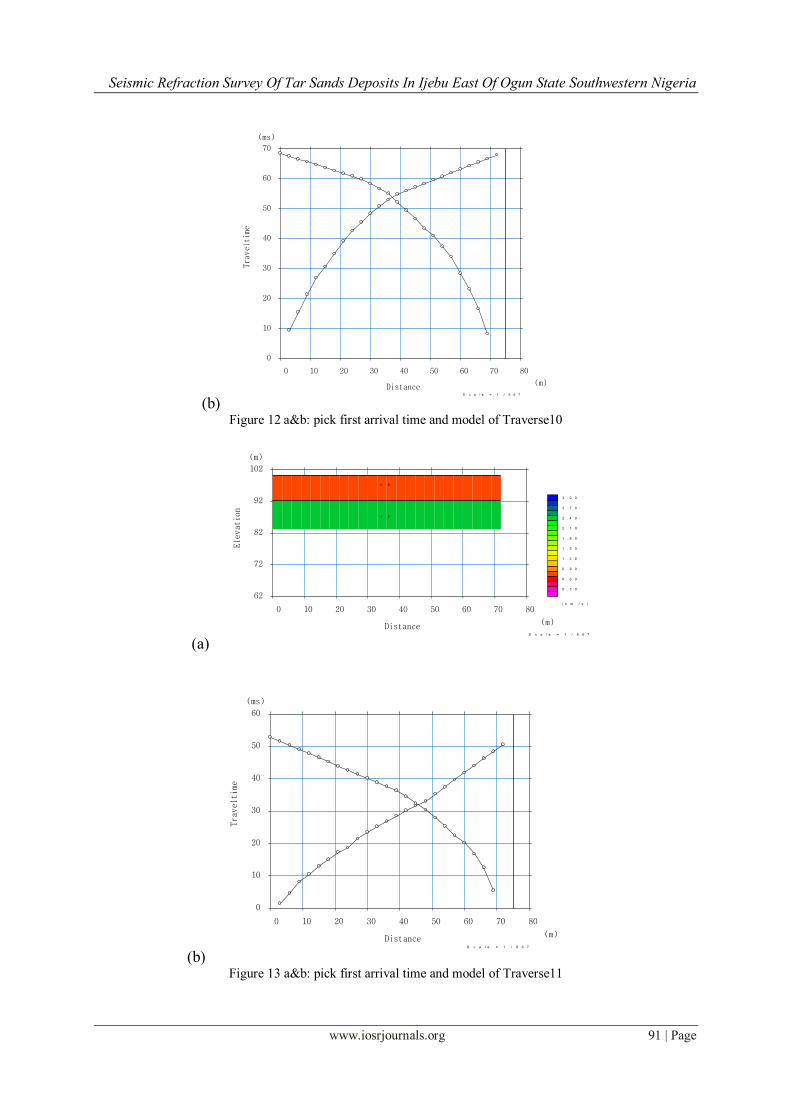
(b) Figure 12 a&b: pick first arrival time and model of Traverse10
(a)
(b) Figure 13 a&b: pick first arrival time and model of Traverse11
0
10
20
30
40
50
60
70
Traveltime
(ms)
0 10 20 30 40 50 60 70 80
(m)Distance
S c a l e = 1 / 6 6 7
62
72
82
92
102
Elevation
(m)
0 10 20 30 40 50 60 70 80
(m)Distance
( k m / s )
0 . 3 0
0 . 6 0
0 . 9 0
1 . 2 0
1 . 5 0
1 . 8 0
2 . 1 0
2 . 4 0
2 . 7 0
3 . 0 0
S c a l e = 1 / 6 6 7
0 . 8
2 . 5
0
10
20
30
40
50
60
Traveltime
(ms)
0 10 20 30 40 50 60 70 80
(m)Distance
S c a l e = 1 / 6 6 7
Seismic Refraction Survey Of Tar Sands Deposits In Ijebu East Of Ogun State Southwestern Nigeria
www.iosrjournals.org 92 | Page
(a)
(b)
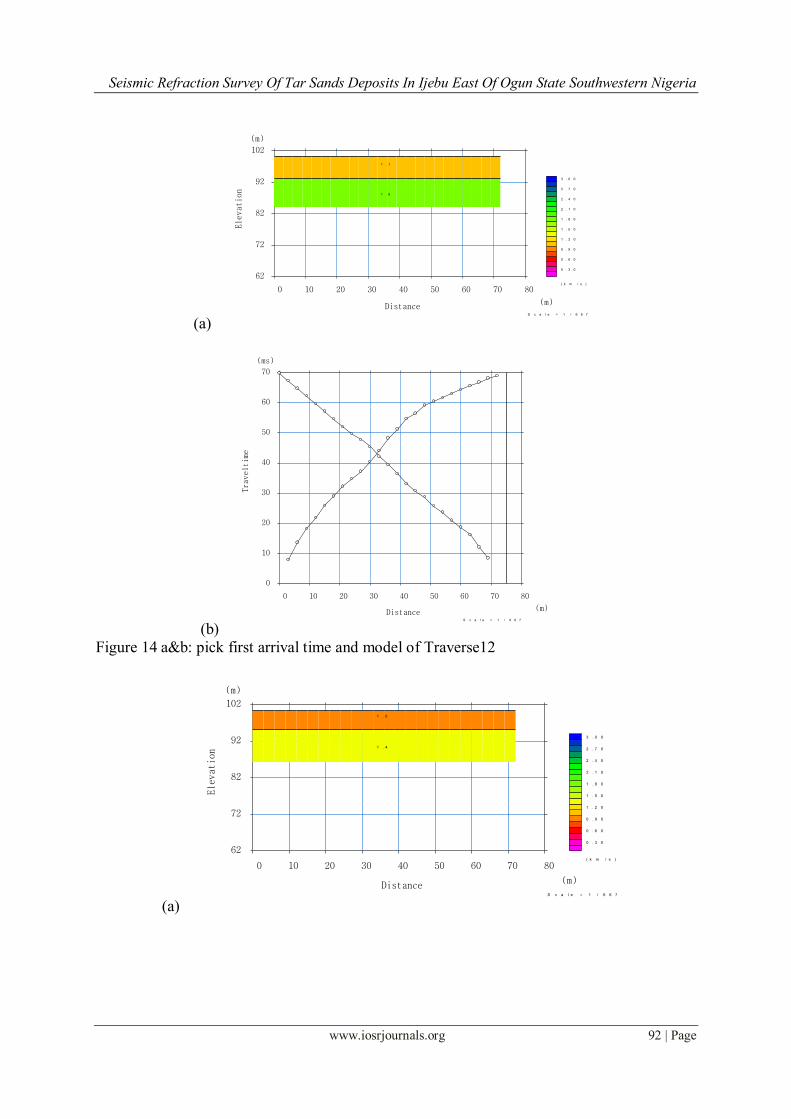
Figure 14 a&b: pick first arrival time and model of Traverse12
(a)
62
72
82
92
102
Elevation
(m)
0 10 20 30 40 50 60 70 80
(m)Distance
( k m / s )
0 . 3 0
0 . 6 0
0 . 9 0
1 . 2 0
1 . 5 0
1 . 8 0
2 . 1 0
2 . 4 0
2 . 7 0
3 . 0 0
S c a l e = 1 / 6 6 7
1 . 1
1 . 9
0
10
20
30
40
50
60
70
Traveltime
(ms)
0 10 20 30 40 50 60 70 80
(m)Distance
S c a l e = 1 / 6 6 7
62
72
82
92
102
Elevation
(m)
0 10 20 30 40 50 60 70 80
(m)Distance
( k m / s )
0 . 3 0
0 . 6 0
0 . 9 0
1 . 2 0
1 . 5 0
1 . 8 0
2 . 1 0
2 . 4 0
2 . 7 0
3 . 0 0
S c a l e = 1 / 6 6 7
1 . 0
1 . 4
Seismic Refraction Survey Of Tar Sands Deposits In Ijebu East Of Ogun State Southwestern Nigeria
www.iosrjournals.org 93 | Page
0
10
20
30
40
50
60
70
Trav
elti
me
(ms)
0 10 20 30 40 50 60 70 80
(m)Distance
S c a l e = 1 / 6 6 7
(b)
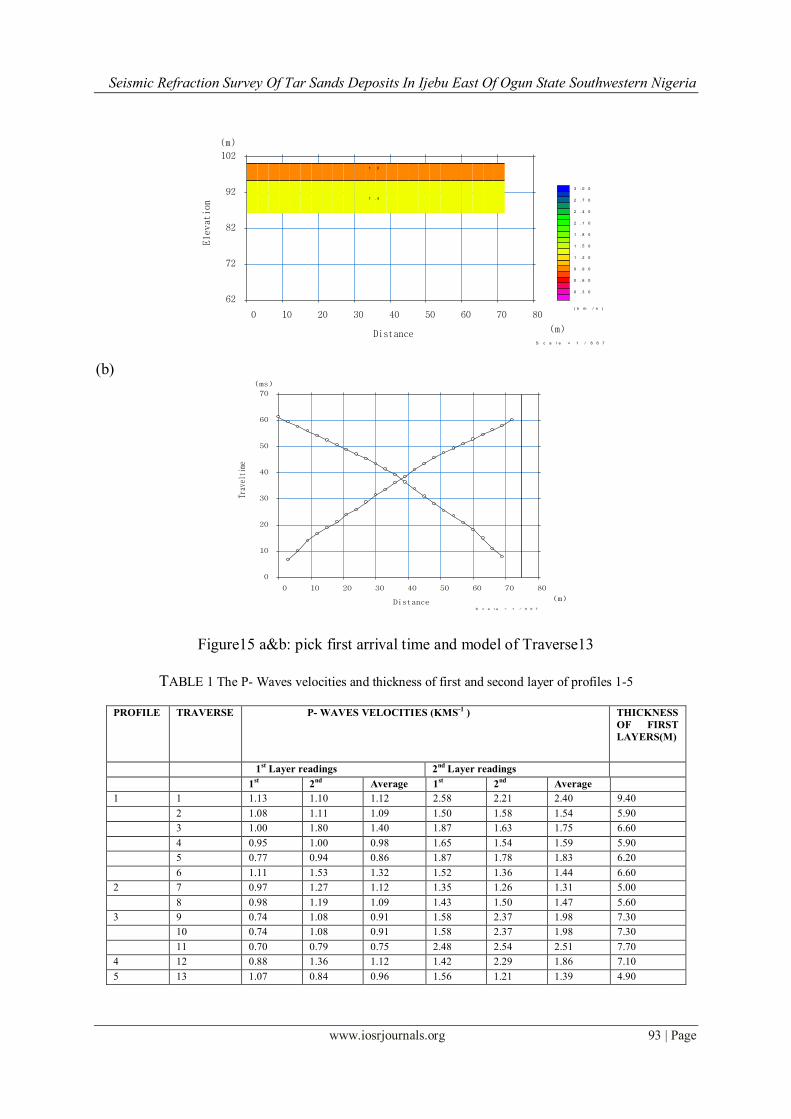
Figure15 a&b: pick first arrival time and model of Traverse13
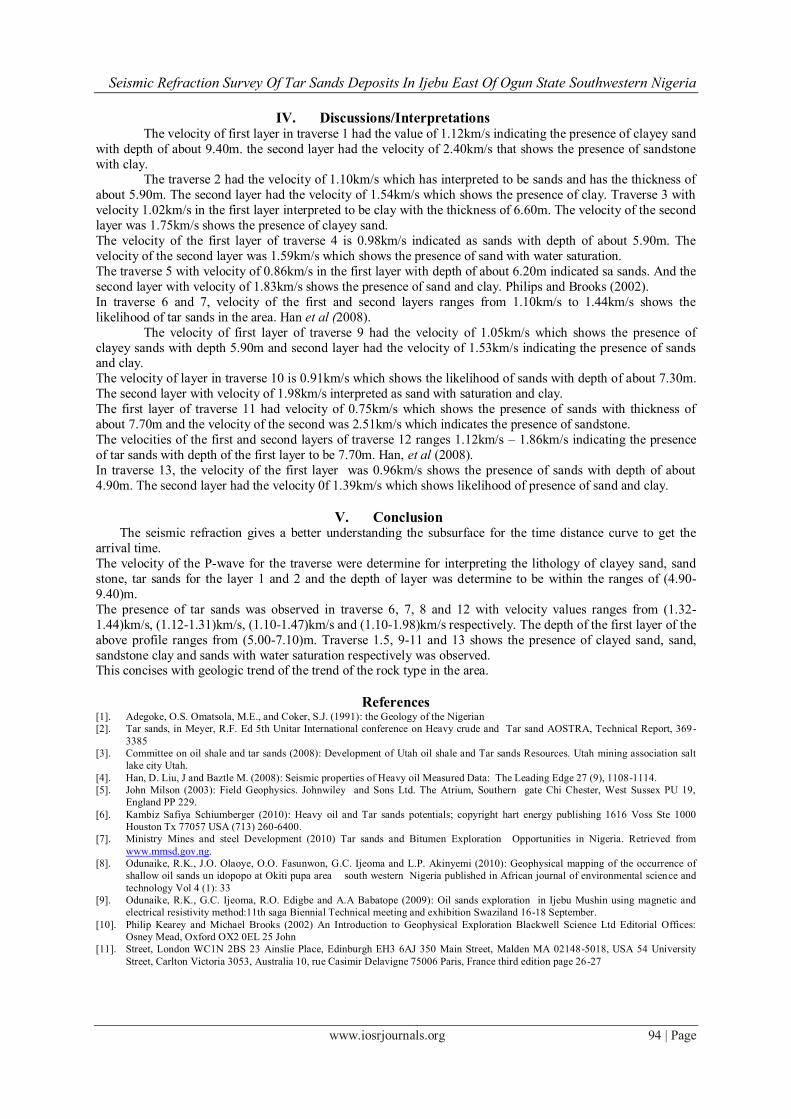
TABLE 1 The P- Waves velocities and thickness of first and second layer of profiles 1-5
PROFILE
TRAVERSE
P- WAVES VELOCITIES (KMS-1
)
THICKNESS
OF FIRST
LAYERS(M)
1st Layer readings 2
nd Layer readings
1st 2
nd Average 1
st 2
nd Average
1 1 1.13 1.10 1.12 2.58 2.21 2.40 9.40
2 1.08 1.11 1.09 1.50 1.58 1.54 5.90
3 1.00 1.80 1.40 1.87 1.63 1.75 6.60
4 0.95 1.00 0.98 1.65 1.54 1.59 5.90
5 0.77 0.94 0.86 1.87 1.78 1.83 6.20
6 1.11 1.53 1.32 1.52 1.36 1.44 6.60
2 7 0.97 1.27 1.12 1.35 1.26 1.31 5.00
8 0.98 1.19 1.09 1.43 1.50 1.47 5.60
3 9 0.74 1.08 0.91 1.58 2.37 1.98 7.30
10 0.74 1.08 0.91 1.58 2.37 1.98 7.30
11 0.70 0.79 0.75 2.48 2.54 2.51 7.70
4 12 0.88 1.36 1.12 1.42 2.29 1.86 7.10
5 13 1.07 0.84 0.96 1.56 1.21 1.39 4.90
62
72
82
92
102
Elevation
(m)
0 10 20 30 40 50 60 70 80
(m)Distance
( k m / s )
0 . 3 0
0 . 6 0
0 . 9 0
1 . 2 0
1 . 5 0
1 . 8 0
2 . 1 0
2 . 4 0
2 . 7 0
3 . 0 0
S c a l e = 1 / 6 6 7
1 . 0
1 . 4
Seismic Refraction Survey Of Tar Sands Deposits In Ijebu East Of Ogun State Southwestern Nigeria
www.iosrjournals.org 94 | Page
IV. Discussions/Interpretations The velocity of first layer in traverse 1 had the value of 1.12km/s indicating the presence of clayey sand
with depth of about 9.40m. the second layer had the velocity of 2.40km/s that shows the presence of sandstone
with clay. The traverse 2 had the velocity of 1.10km/s which has interpreted to be sands and has the thickness of
about 5.90m. The second layer had the velocity of 1.54km/s which shows the presence of clay. Traverse 3 with
velocity 1.02km/s in the first layer interpreted to be clay with the thickness of 6.60m. The velocity of the second
layer was 1.75km/s shows the presence of clayey sand.
The velocity of the first layer of traverse 4 is 0.98km/s indicated as sands with depth of about 5.90m. The
velocity of the second layer was 1.59km/s which shows the presence of sand with water saturation.
The traverse 5 with velocity of 0.86km/s in the first layer with depth of about 6.20m indicated sa sands. And the
second layer with velocity of 1.83km/s shows the presence of sand and clay. Philips and Brooks (2002).
In traverse 6 and 7, velocity of the first and second layers ranges from 1.10km/s to 1.44km/s shows the
likelihood of tar sands in the area. Han et al (2008).
The velocity of first layer of traverse 9 had the velocity of 1.05km/s which shows the presence of
clayey sands with depth 5.90m and second layer had the velocity of 1.53km/s indicating the presence of sands and clay.
The velocity of layer in traverse 10 is 0.91km/s which shows the likelihood of sands with depth of about 7.30m.
The second layer with velocity of 1.98km/s interpreted as sand with saturation and clay.
The first layer of traverse 11 had velocity of 0.75km/s which shows the presence of sands with thickness of
about 7.70m and the velocity of the second was 2.51km/s which indicates the presence of sandstone.
The velocities of the first and second layers of traverse 12 ranges 1.12km/s – 1.86km/s indicating the presence
of tar sands with depth of the first layer to be 7.70m. Han, et al (2008).
In traverse 13, the velocity of the first layer was 0.96km/s shows the presence of sands with depth of about
4.90m. The second layer had the velocity 0f 1.39km/s which shows likelihood of presence of sand and clay.
V. Conclusion The seismic refraction gives a better understanding the subsurface for the time distance curve to get the
arrival time.
The velocity of the P-wave for the traverse were determine for interpreting the lithology of clayey sand, sand
stone, tar sands for the layer 1 and 2 and the depth of layer was determine to be within the ranges of (4.90-
9.40)m.
The presence of tar sands was observed in traverse 6, 7, 8 and 12 with velocity values ranges from (1.32-
1.44)km/s, (1.12-1.31)km/s, (1.10-1.47)km/s and (1.10-1.98)km/s respectively. The depth of the first layer of the
above profile ranges from (5.00-7.10)m. Traverse 1.5, 9-11 and 13 shows the presence of clayed sand, sand,
sandstone clay and sands with water saturation respectively was observed. This concises with geologic trend of the trend of the rock type in the area.
References [1]. Adegoke, O.S. Omatsola, M.E., and Coker, S.J. (1991): the Geology of the Nigerian
[2]. Tar sands, in Meyer, R.F. Ed 5th Unitar International conference on Heavy crude and Tar sand AOSTRA, Technical Report, 369-
3385
[3]. Committee on oil shale and tar sands (2008): Development of Utah oil shale and Tar sands Resources. Utah mining association salt
lake city Utah.
[4]. Han, D. Liu, J and Baztle M. (2008): Seismic properties of Heavy oil Measured Data: The Leading Edge 27 (9), 1108-1114.
[5]. John Milson (2003): Field Geophysics. Johnwiley and Sons Ltd. The Atrium, Southern gate Chi Chester, West Sussex PU 19,
England PP 229.
[6]. Kambiz Safiya Schiumberger (2010): Heavy oil and Tar sands potentials; copyright hart energy publishing 1616 Voss Ste 1000
Houston Tx 77057 USA (713) 260-6400.
[7]. Ministry Mines and steel Development (2010) Tar sands and Bitumen Exploration Opportunities in Nigeria. Retrieved from
www.mmsd.gov.ng.
[8]. Odunaike, R.K., J.O. Olaoye, O.O. Fasunwon, G.C. Ijeoma and L.P. Akinyemi (2010): Geophysical mapping of the occurrence of
shallow oil sands un idopopo at Okiti pupa area south western Nigeria published in African journal of environmental science and
technology Vol 4 (1): 33
[9]. Odunaike, R.K., G.C. Ijeoma, R.O. Edigbe and A.A Babatope (2009): Oil sands exploration in Ijebu Mushin using magnetic and
electrical resistivity method:11th saga Biennial Technical meeting and exhibition Swaziland 16-18 September.
[10]. Philip Kearey and Michael Brooks (2002) An Introduction to Geophysical Exploration Blackwell Science Ltd Editorial Offices:
Osney Mead, Oxford OX2 0EL 25 John
[11]. Street, London WC1N 2BS 23 Ainslie Place, Edinburgh EH3 6AJ 350 Main Street, Malden MA 02148-5018, USA 54 University
Street, Carlton Victoria 3053, Australia 10, rue Casimir Delavigne 75006 Paris, France third edition page 26-27