SEISMIC PERFORMANCE OF SLOPES IN PSEUDO-STATIC DESIGNS WITH DIFFERENT SAFETY...
19
IJST, Transactions of Civil Engineering, Vol. 38, No. C2, pp 465-483 Printed in The Islamic Republic of Iran, 2014 © Shiraz University SEISMIC PERFORMANCE OF SLOPES IN PSEUDO-STATIC DESIGNS WITH DIFFERENT SAFETY FACTORS * B. NADI 1** F. ASKARI 2 , O. FARZANEH 3 1 Dept. of Civil Engineering, Science and Research Branch, Islamic Azad University, Tehran, I. R. of Iran Email: [email protected] 2 Geotechnical Engineering Research Center, International Institute of Earthquake Engineering and Seismology (IIEES), Tehran, I. R. of Iran 3 Faculty of Engineering, Tehran University, Tehran, I. R. of Iran Abstract– Seismic coefficient values coupled with minimum pseudo-static safety factors are still used for analysis where selection of seismic coefficients relies on expertise and judgment. However, safety factor approach does not give any idea about the deformations and displacements that are expected to occur during earthquake loading. Displacements are mostly evaluated by equations based on yield acceleration of the slope and maximum acceleration of sliding mass. The method based on rigid block gives co-seismic permanent slope deformation when its factor of safety equals 1.0, hence, there is a need to link slope displacements, seismic coefficients and pseudo-static safety factors. This will enable the designers to predict slope displacements based on selected seismic coefficients. In the present paper, slope displacements obtained for different peak ground accelerations and safety factors are used to propose charts linking co-seismic slope displacements (D), seismic coefficients ( ) and pseudo-static safety factors (FS), which are important parameters in pseudo-static approach. This enables the values to be chosen based on allowable displacements instead of using judgment and expertise. Results show that values for any allowable displacement should be based on anticipated PGA and FS values. Subsequently, slope displacements are utilized in developing a novel displacement-based methodology to select the seismic coefficient which will be used to calculate the pseudo-static safety factor. Keywords– Slope stability, slope, displacement, performance, seismic coefficients 1. INTRODUCTION Slope failures are often observed following large earthquakes. Because of their effects on infrastructure facilities such as buildings, bridges, roads and lifelines, they have a significant impact on casualties and economic losses. As a result, evaluation of the stability of slopes has become an important part of geotechnical earthquake engineering. Several approaches for evaluation of seismic slope stability, ranging from simple to complex, are available and can be divided into: 1) pseudo-static methods, 2) sliding block methods, and 3) stress-deformation methods [1]. The performance of earth structures subjected to seismic action can be evaluated through force-based pseudo-static methods, displacement-based sliding block methods, non-linear soil behavior and fully coupled effective stress numerical analyses. In principle, numerical methods allow the most comprehensive analyses of the response of earth structures to seismic loading. However, reliable numerical analyses require accurate evaluation of soil profile, initial stress state, stress history, pore water pressure conditions, strength and deformation characteristics of the selected soil layers. Moreover, cyclic soil behavior can be properly described using advanced constitutive models developed within the Received by the editors March 1, 2013; Accepted February 16, 2014. Corresponding author
Transcript of SEISMIC PERFORMANCE OF SLOPES IN PSEUDO-STATIC DESIGNS WITH DIFFERENT SAFETY...

IJST, Transactions of Civil Engineering, Vol. 38, No. C2, pp 465-483 Printed in The Islamic Republic of Iran, 2014 © Shiraz University
SEISMIC PERFORMANCE OF SLOPES IN PSEUDO-STATIC DESIGNS WITH DIFFERENT SAFETY FACTORS*
B. NADI1** F. ASKARI2, O. FARZANEH3 1Dept. of Civil Engineering, Science and Research Branch, Islamic Azad University, Tehran, I. R. of Iran
Email: [email protected] 2Geotechnical Engineering Research Center, International Institute of Earthquake Engineering and Seismology
(IIEES), Tehran, I. R. of Iran 3Faculty of Engineering, Tehran University, Tehran, I. R. of Iran
Abstract– Seismic coefficient values coupled with minimum pseudo-static safety factors are still used for analysis where selection of seismic coefficients relies on expertise and judgment. However, safety factor approach does not give any idea about the deformations and displacements that are expected to occur during earthquake loading. Displacements are mostly evaluated by equations based on yield acceleration of the slope and maximum acceleration of sliding mass. The method based on rigid block gives co-seismic permanent slope deformation when its factor of safety equals 1.0, hence, there is a need to link slope displacements, seismic coefficients and pseudo-static safety factors. This will enable the designers to predict slope displacements based on selected seismic coefficients. In the present paper, slope displacements obtained for different peak ground accelerations and safety factors are used to propose charts linking co-seismic slope displacements (D), seismic coefficients ( ) and pseudo-static safety factors (FS), which are important parameters in pseudo-static approach. This enables the values to be chosen based on allowable displacements instead of using judgment and expertise. Results show that values for any allowable displacement should be based on anticipated PGA and FS values. Subsequently, slope displacements are utilized in developing a novel displacement-based methodology to select the seismic coefficient which will be used to calculate the pseudo-static safety factor.
Keywords– Slope stability, slope, displacement, performance, seismic coefficients
1. INTRODUCTION
Slope failures are often observed following large earthquakes. Because of their effects on infrastructure facilities such as buildings, bridges, roads and lifelines, they have a significant impact on casualties and economic losses. As a result, evaluation of the stability of slopes has become an important part of geotechnical earthquake engineering. Several approaches for evaluation of seismic slope stability, ranging from simple to complex, are available and can be divided into: 1) pseudo-static methods, 2) sliding block methods, and 3) stress-deformation methods [1].
The performance of earth structures subjected to seismic action can be evaluated through force-based pseudo-static methods, displacement-based sliding block methods, non-linear soil behavior and fully coupled effective stress numerical analyses. In principle, numerical methods allow the most comprehensive analyses of the response of earth structures to seismic loading. However, reliable numerical analyses require accurate evaluation of soil profile, initial stress state, stress history, pore water pressure conditions, strength and deformation characteristics of the selected soil layers. Moreover, cyclic soil behavior can be properly described using advanced constitutive models developed within the Received by the editors March 1, 2013; Accepted February 16, 2014. Corresponding author
B. Nadi et al.
IJST, Transactions of Civil Engineering, Volume 38, Number C2 August 2014
466
framework of bounding surface plasticity or kinematic hardening plasticity, which requires input parameters that are not usually measured in field or laboratory testing.
For slope stability analysis, limit equilibrium method (LEM) is widely used by engineers and researchers which is a traditional and well-established method. Although the LEM does not consider the stress–strain relations of the soil, it can provide an estimate of the safety factor without requiring the initial conditions. For this reason, the method is favored by engineers. LEM is known to be a statically indeterminate method which requires assumptions on the distributions of internal forces for evaluation of the safety factor.
The displacement-based approach provides a compromise between the rather inadequate pseudo-static approach and the more refined numerical analyses; indeed, it has the advantage of giving a quantitative assessment of the earthquake-induced displacements using a rather simple analytical procedure. Prediction of earthquake-triggered landslide displacements is important for the design of engineered slopes seismic hazard analysis as well as for co-seismic landslide analysis. The earthquake acceleration needed to reduce the factor of safety to 1.0 is called the yield or critical acceleration. This procedure is simple and requires no more information than what is needed for a static factor-of-safety analysis.
A common approach to using pseudo static analysis is to iteratively conduct a limit-equilibrium analysis using different values of k until FS=1. The resulting pseudo-static coefficient is called the yield coefficient, . As mentioned above, the conventional methods used for evaluating the performance of slopes under seismic loading includes application of a seismic coefficient to calculate the pseudo-static safety factor and calculation of permanent displacements. These approaches employ pseudo-static limit equilibrium analysis. Until the 1960s, engineers employed a seismic coefficient to assess the safety factor of slopes and embankments. In the current state of the art, seismic coefficient values coupled with minimum pseudo-static safety factors are used in the analyses, where the selected seismic coefficients rely on expertise and judgment. However, safety factor approach does not provide any information about deformations that are expected to occur during earthquake loading. Deformation is a better indicator of slope performance and therefore, seismic slope stability is evaluated more and more frequently based on the permanent deformations rather than the safety factor criterion. In this context, Newmark’s [2] sliding block model is a widely used tool for calculating permanent slope displacements.
Displacements are mostly calculated by equations based on yield ( ) for rigid slopes. The materials that comprise slopes are compliant and respond dynamically as deformable bodies to ground motions. As the motion propagates, different parts of the slope move by different amounts and different phases, thereby creating a distribution of accelerations throughout the slope that vary in space and time. These accelerations induce inertial forces, that when superimposed on the self-weight of the soil mass, destabilize the slope. Therefore, slope displacements are calculated by equations based on maximum equivalent accelerations (k ). Where, k represents the peak value of the HEA time history and represents a spatial average of the accelerations acting on the slide mass. The dynamic response analysis is then performed to quantify the accelerations experienced by the slide mass and is expressed as Horizontal Equivalent Acceleration or HEA time history.
Based on the above arguments, to predict slope displacements based on selected seismic coefficients, there is a need to link slope displacements, seismic coefficients and pseudo static safety factors. This will enable the designers to predict slope displacements based on selected seismic coefficients. Following a review of the literature on different methods used in seismic slope stability problems, a methodology is proposed to link the permanent slope displacements, seismic coefficients, and pseudo-static safety factors.
In order to facilitate more relations between LEM and sliding block methods, the following activities were conducted in the present paper:

Seismic performance of slopes in pseudo-static…
August 2014 IJST, Transactions of Civil Engineering, Volume 38, Number C2
467
1- Determination of horizontal acceleration effects on slope (based on various limit equilibrium procedures including Bishop's method). 2- Determination of earth slope's factor of safety under effects of imposed seismic horizontal acceleration. 3- Determination of slope yield acceleration coefficient (variation in slope yield acceleration coefficient, where factor of safety is required to become equal 1). 4- Determination of co-seismic permanent slope deformation (based on various rigid block methods).
2. BACKGROUND The earliest methods of seismic slope stability analyses used a limit-equilibrium pseudo-static approach and considered stability in terms of a simple factor-of-safety. These very basic procedures evolved into more sophisticated deformation-based approaches during the 1960s and 1980s. Today it is common practice in geotechnical earthquake engineering to estimate seismically-induced displacements in slopes and earth structures, using one of the available deformation-based analysis procedures. Such an approach is appropriate as displacements ultimately govern the serviceability of a slope after an earthquake.
Over the past 50 years, roughly 30 different deformation-based methods have been developed to compute seismic slope displacements. These procedures generally fall into one of three categories: (1) rigid block-type procedures, which ignore the dynamic response of slopes [2-4],(2) decoupled procedures, which account for dynamic response, but “decouple” this response from the sliding response of slopes[5-6], and (3) coupled procedures, which “couple” the dynamic and sliding response of slopes[7].
In design applications, these methods are used in a predictive capacity to estimate the amount of earthquake-induced displacement for a design earthquake event. More detailed information is presented in individual sections devoted to each method.
a) Pseudo-static coefficient
Landslides account for a significant portion of total earthquake damage; therefore, seismic stability of
slopes is of primary concern. As emphasized by Kramer [1], analysis of seismic stability of slopes is complicated by the need to consider the effects of seismic stresses, their effects on strength and stress-strain properties of the slope materials.
Stability analyses of earth slopes during earthquake were initiated in the early 20thcentury using what has come to be known as the pseudo-static method. The first known documentation of this method in the technical literature was proposed by Terzhagi [8]. Pseudo-static analysis, models the seismic shaking as a permanent body force that is added to the force-body diagram of a conventional static limit-equilibrium analysis. Normally, only the horizontal component of earthquake shaking is modeled because the effects of vertical forces tend to average out to near zero.
Figure 1 shows the forces acting on a sliding mass of the soil above a failure surface in a pseudo static analysis .The magnitude of the inertial forces acting on the sliding mass, and , are calculated as
= (1)
= (2)
Wherea and are horizontal and vertical pseudo-static accelerations; and are dimensionless horizontal and vertical pseudo-static coefficients (seismic coefficients) and W is the weight per unit length of slope, β is the slope angle and g is the acceleration of gravity. The horizontal pseudo-static force affects the pseudo-static safety factor considerably, whereas the vertical pseudo-static force has been shown to be completely insignificant and therefore it can be neglected. In this context, the pseudo-static factor of safety (FS) is calculated as:

IJST, Transac
468
Fi
The chare related factor valuenegligible. safety factoduring earth[13] present[10] stated tbased on th
for earth Selecti
however, itstatic coeffstudies citedesign, in wthe stability30cm. The mwere formu
After coefficient, coefficient f
Stewarand Rathje ground accdisplacemencalculates thand spectraallowable d
ctions of Civil E
ig. 1. Force dilength of th
th
hoice of the sto the value
e to drop beloTherefore, u
or of 1.0 hashquakes [14]ted charts tothat recomm
he actual antidams depen
ion of the pst is most difficient. Signied. One key which as mucy assessmentmost commo
ulated for eartsummarizingKramer con
for design.” rt et al. [19] [6], wherein
celeration, ent (5 and 15he pseudo s
al acceleratiodisplacement
Engineering, V
iagram of a lanhe landslide, khe slip surface
seismic coefs of the safeow 1.0, this muse of peak s been shown]. In many buo find out wh
mendations giicipated levended on the sseudo-static cfficult to calcificant diffeissue is cal
ch as 1m of t of natural sonly used valth dams that g a numberncluded that
developed an a pseudo-
earthquake m5 cm) [19]. static coefficon. The com[11].
B
Volume 38, Num
ndslide in dryk is the pseudoe, and β is the
fficient valueety factor [9-may be for aground accen to give exuilding codehether the seiven would b
el of acceleraize of the faicoefficient isculate. Tablerences in aplibration. Sodisplacemenslopes, in wlues in Califocould accom
r of publisht “there are
a site screenistatic coeffic
magnitude, sBray and T
cient as a funmmon basis
B. Nadi et al.
mber C2
y, cohesive ando-static coeffiangle of incli
e gives rise t-13]. Even th
a very short deleration as xcessively cos, empirical
eismic coeffibe appropriaation in the filure mass [1s thus the moe 1 lists sevpproaches a
ome of thesent is acceptabhich the acc
fornia are k=0mmodate abohed approach
no hard an
ing procedurcient is calcsource distaravasarou [7nction of allof these rat
d frictional socient, s is the nation of the s
to some uncehough the pe
duration and the seismic
onservative avalues based
icients used te for most s
failure mass. 15]. ost importan
veral recommand resultinge studies havble. These saceptable disp0.15 and FS>
out 1m of dishes for dete
nd fast rules
re based on tculated as a ance, and tw7] presented lowable dispionalized ap
il. W is the wshear resistanslope surface
ertainties andeak accelerathe resultingcoefficient i
assessments d on judgmein Italy wereslopes, indicGazetas sho
nt aspect of pmendations fg values cleave been caliame values aplacement m>1.1. But thesplacement. ermining an for selectio
the statisticafunction of
wo possible a straight f
placement, epproaches is
A
weight per unit nce along
d further uncation causes g displacemein conjunctioof slope pernt are used. e appropriateating that it owed that the
pseudo staticfor selecting arly exist amibrated for eare commonl
might be as lien again, the
n appropriateon of a pseu
al relationshimaximum hlevels of
forward apprearthquake m
calibration
August 2014
(3)
certainties the safety nt may be on with a rformance Simonelli e. Kramer should be e value of
c analysis; a pseudo
mong the earth-dam ly used in ittle as 5–se criteria
e seismic udo static
p of Bray horizontal allowable roach that
magnitude, based on

Seismic performance of slopes in pseudo-static…
August 2014 IJST, Transactions of Civil Engineering, Volume 38, Number C2
469
Table 1. Pseudo-static coefficients from various studies
Investigator Recommended Pseudo static Coefficient
(k)
Recommended factor of safety (FS)
Calibration conditions
Terzhagi [8] 0.1(R-F=IX) >1.0 Unspecified 0.2(R-F=X)
0.5(R-F>X) Seed (1979) [16] 0.10(M=6.50)
> 1.15 <1 m displacement in earth dams 0.15 (M=8.25)
Marcuson (1981) [17] 0.33-0.50 PGA/g >1.0 Unspecified
Hynes- Griffin and Franklin (1984) [18]
0.5 PGA/g >1.0 <1 m displacement in
earth dams California Division Of
Mines and Geology (1997)
0.15 >1.1 Unspecified: probably
based on <1 m displacement in dams
JCOLD Japan 0.12-0.25 Corps of Engineering 0.1 (Major
Earthquake) >1 >1
Unspecified
0.15 (Great Earthquake) IRI Road and Railway
Bridges Seismic Resistant Design Code
NO: 463
0.5 A >1 Unspecified
Indian standard for Seismic design of earth
0.33 Z I S >1 Unspecified R-F is Rossi –Forel earthquake intensity scale. M is earthquake magnitude. PGA is Peak Ground Acceleration. G is acceleration of gravity. A is ratio of design acceleration to acceleration of gravity (0.2 to 0.35) Z is zone factor (0.1 to 0.36) I importance factor (1.0 to 2.0) S site amplification factor (1.0 to 2.0)
b) Deformation analysis
The following section includes a discussion of appropriate applications of these types of analysis.
1. Stress-strain analysis: The advantage of stress-strain modeling such as Finite Element Analysis is that it gives the most accurate picture of what actually happens in the slope during an earthquake. Clearly, models that account for the complexity of spatial variability of properties and the stress-strain behavior of slope materials yield more reliable results. But stress-deformation modeling has also its drawbacks. The complex modeling is warranted only if the quantity and quality of the data merit it.
2. Permanent deformation analysis: Newmark [2] introduced a method to assess the performance of slopes during earthquakes that bridges the gap between overly simplistic pseudo static analysis and overly complex stress-deformation analysis. Newmark's method models a landslide as a rigid block that slides on an inclined plane. The block has a known yield or critical acceleration, the acceleration being required to overcome basal resistance and initiating sliding (Fig. 2).
On conceptual level, all deformation-based methods are models which are simplified approximations of the real physical mechanism of seismic-induced deformation in slopes. As mentioned above there are three fundamental models, all of them relied on deformation-based methods. These model categories

IJST, Transac
470
range fromrepresent th
1. Rigid blo
The rigid-blillustrated inin Fig. 3 anacting on a seismic yielrest of the uFig 3a]. DurSliding contthe slide mathat occurreaccelerationindicated by
ctions of Civil E
m simple to he mechanism
ock
lock model wn Fig. 2. It cond assumes slide mass e
ld coefficienunderlying slring this timtinues until tass and the ued during ean time history the displac
Fig. 3.
Engineering, V
complex anm of earthqua
F
was originallonsiders an athat perman
exceed the ynt ( ) [referlope and slid
me, the velocithe followingunderlying gch interval ory. The totalement plot sh
. Newmark’s rper
B
Volume 38, Num
nd differ witake-induced
ig. 2. Newma
ly proposed bacceleration nent deformayield resistanr to (1) in Fiding occurs aty of the grog conditions ground coincof slip, is del permanent hown in Fig.
rigid -block prrmanent deform
B. Nadi et al.
mber C2
th respect todisplacemen
ark’s sliding-b
by Newmarktime history ation initiate
nce on the sliig. 3a]. At that a constant ound is greate
are met: (1)cide [refer toetermined by
deformation. 3c.
rocedure for cmation (simpl
o the assumnt.
lock analogy
k [2] and is brepresented
es when the ip surface. This point the
rate of acceer than the v) accelerationo (3) in Fig. y double-inten accumulate
calculating Eale sine motion
mptions and
based on the by a simple earthquake-
This resistancslide mass b
eleration equelocity of thens fall below3b]. The per
egrating the ed during ea
arthquake-indun)
A
idealization
sliding-blocsine motion induced acc
ce is quantifibreaks awayal to [refee slide mass
w and (2) vrmanent dispshaded regioach interval
uced
August 2014
s used to
k analogy as shown
celerations ied by the
y from the r to (2) in (Fig. 3b).
velocity of placement ons of the of slip is

Seismic performance of slopes in pseudo-static…
August 2014 IJST, Transactions of Civil Engineering, Volume 38, Number C2
471
Newmark [2], Ambraseys and Srbulov [20], Jibson [9], Saygili and Rathje [4] used this method with various assumptions for calculation or co-seismic slope permanent deformation. The recommended single (scalar) ground motion parameter model is the "peak ground acceleration PGA, earthquake magnitude M" model from Saygili and Rathje [21], and the recommended two vector ground motion parameter model is the PGA and PGV(peak ground velocity), models from Saygili and Rathje [4]. For simplicity, these models will be called the SR08/RS09 models.
2. Decoupled analysis
Soon after Newmark [2] published his rigid-block method, more sophisticated analyses were developed to account for the fact that landslide masses are not rigid bodies, but deform internally when subjected to seismic shaking [22-23]. The most commonly used of such analyses was developed by Makdisi and Seed [5]. They produced design charts for estimating co-seismic displacements as a function of slope geometry, earthquake magnitude, and the ratio of yield acceleration to peak acceleration.
In decoupled analysis, the first step is dynamic-response analysis of the slope with 1D programs such as EERA and SHAKE, or with 2D programs such as PLAXIS and FLAC; through estimating average acceleration-time history for the several points within the slope mass above the potential failure surface. The average acceleration has been referred to as k or HEA, the horizontal equivalent acceleration [6]. Peak values are generally referred to as or MHEA, the maximum horizontal equivalent acceleration. In the second step, the permanent earthquake-induced deformation is calculated through double-integration of the HEA time history. This approach is referred to as a decoupled analysis. Computation of dynamic response and the plastic displacement are performed independently. 3. Coupled analysis
In a fully coupled analysis, the dynamic response of the sliding mass and the permanent displacement are modeled together so that the effect of plastic sliding displacement on the ground motions is taken into account. Wartman et al. [24] compared the sliding response of deformable clay masses and a rigid block on an included plane subjected to cyclic motion. They found that the Newmark-type rigid block analysis was overly conservative for cases where the tuning ratio ( ), the ratio of the predominant frequency of the input motion ( ) to the predominant natural frequency of the slope ( ) was greater than about 1.3 and un-conservative when was in the range of 0.2–1.3 [24].
More recently, Rathje and Bray (1999, 2000) compared results from rigid block analysis with linear and non-linear coupled and decoupled analyses. Many empirical models predict permanent deformation "D" as a function of and one or more ground motion parameters (e.g., PGA, Arias Intensity , PGV, and mean period, ). There are many available predictive models, but the most recently developed models are those proposed by Rathje and Antonakos [22] and Bray and Travasarou [7].
3. METHODOLOGY
In methods based on the permanent deformation method, safety factor is assumed to be equal to 1. In pseudo-static methods based on limit states, safety factor is usually considered to be greater than 1 under specified pseudo-static acceleration. Developing a method to calculate the seismic deformation of an earth slope with a specified safety factor, would be a bridge between these two methods of analysis. In other words, if an earth slope is designed based on a specified horizontal pseudo static accelerations and safety factor, how much would the estimated earth slope deformations be?
IJST, Transac
472
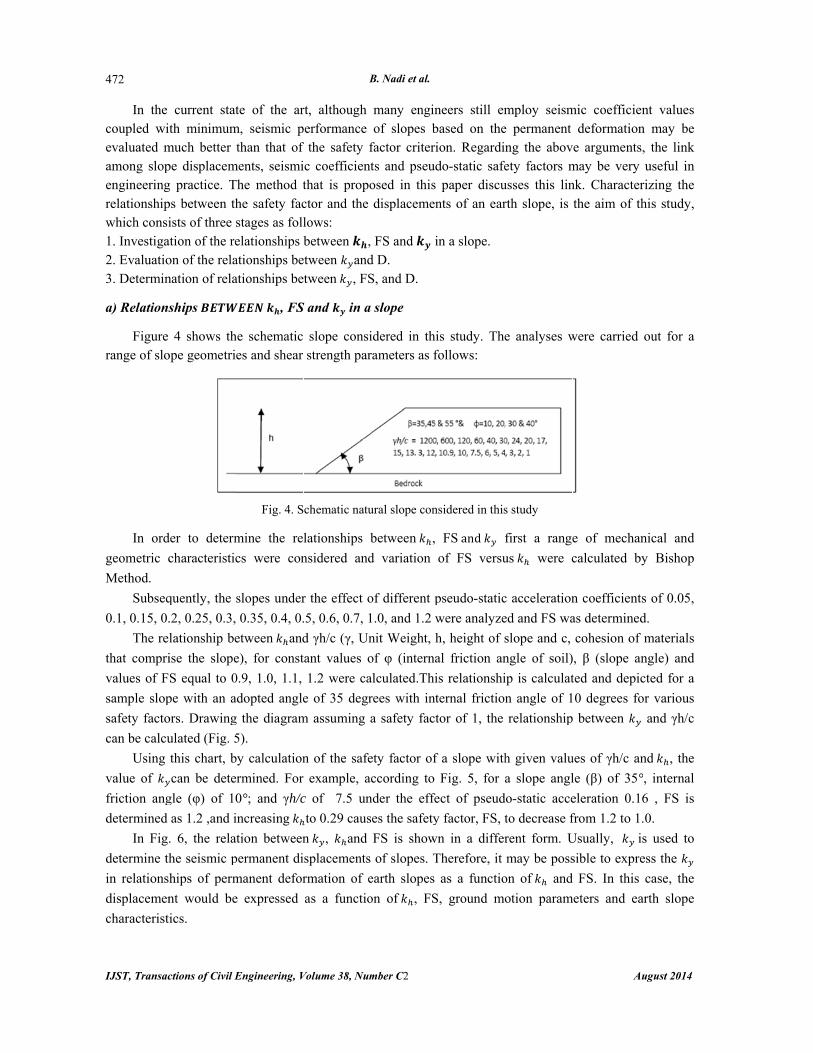
In the coupled wievaluated mamong slopengineeringrelationshipwhich consi1. Investiga2. Evaluatio3. Determin
a) Relations
Figure
range of slo
In ord
geometric c
Method.
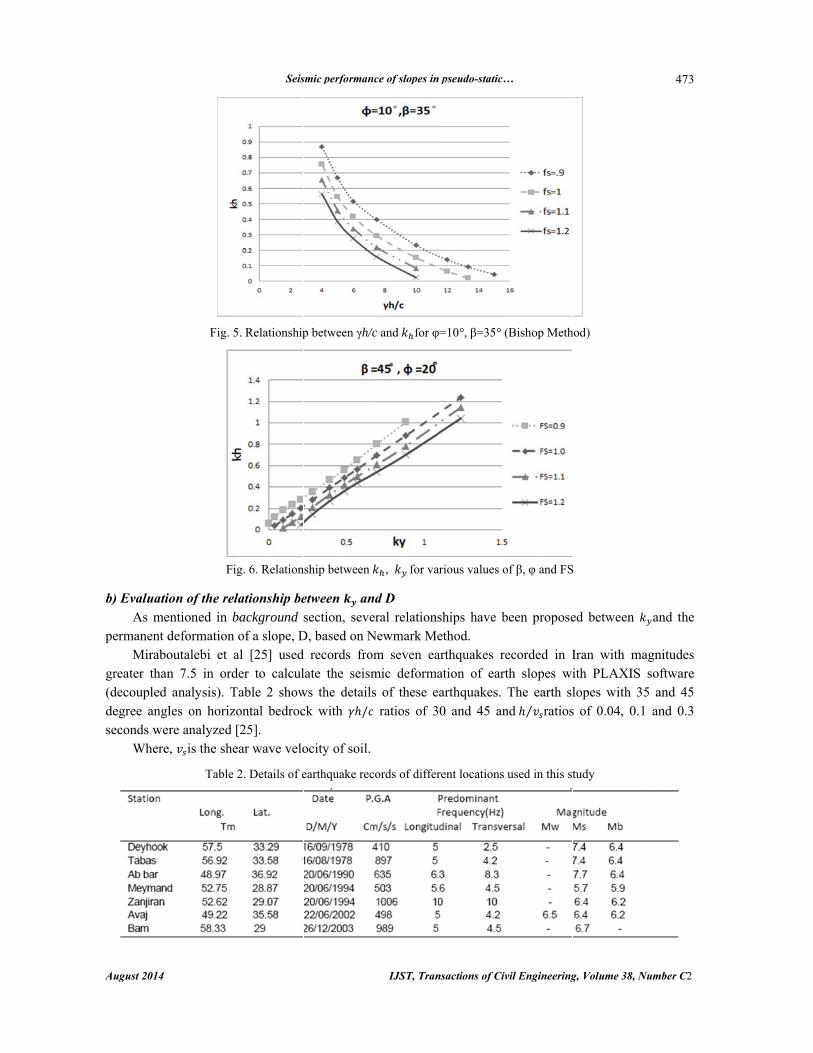
Subseq
0.1, 0.15, 0.
The re
that compri
values of F
sample slop
safety facto
can be calcu
Using
value of
friction ang
determined
In Fig.
determine th
in relations
displacemen
characterist
ctions of Civil E
current statth minimum
much better tpe displacemg practice. Tps between thists of three s
ation of the reon of the relanation of rela
ships
4 shows thope geometrie
der to determ
characteristic
quently, the s
.2, 0.25, 0.3,
lationship be
ise the slope
S equal to 0
pe with an a
ors. Drawing
ulated (Fig. 5
this chart, b
can be dete
gle (φ) of 10
as 1.2 ,and i
. 6, the relat
he seismic p
hips of perm
nt would be
ics.
Engineering, V
te of the arm, seismic p
than that of ments, seismiThe method the safety facstages as follelationships bationships beationships be
, FS
he schematic es and shear
Fig. 4. S
mine the re
cs were con
slopes under
0.35, 0.4, 0.
etween and
e), for const
0.9, 1.0, 1.1,
dopted angle
g the diagram
5).
by calculation
rmined. For
0°; and γh/c
increasing
tion between
permanent di
manent defor
e expressed
B
Volume 38, Num
rt, although performance f the safety fic coefficientthat is propoctor and the lows: between ,
etween andtween , FS
S and in a
slope consistrength par
chematic natu
lationships b
nsidered and
r the effect o
.5, 0.6, 0.7, 1
d γh/c (γ, Un
tant values o
1.2 were ca
e of 35 degr
m assuming a
n of the safe
example, a
c of 7.5 un
to 0.29 caus
n , and
splacements
rmation of e
as a functio
B. Nadi et al.
mber C2
many enginof slopes b
factor criterits and pseudosed in this displacemen
FS and id D. S, and D.
slope
idered in thirameters as fo
ural slope con
between ,
d variation
of different p
1.0, and 1.2 w
nit Weight, h
of φ (interna
alculated.Thi
rees with int
a safety fact
ety factor of
ccording to
nder the effe
ses the safety
FS is shown
of slopes. T
earth slopes
on of , FS
neers still embased on theion. Regardindo-static safepaper discu
nts of an ear
n a slope.
is study. Thefollows:
sidered in this
FSand f
of FS versu
pseudo-static
were analyze
h, height of s
al friction an
s relationshi
ternal friction
tor of 1, the
f a slope with
Fig. 5, for a
ect of pseud
y factor, FS, t
n in a differ
Therefore, it
as a functio
, ground mo
mploy seisme permanent ng the abovety factors musses this linrth slope, is
e analyses w
s study
first a range
us were c
c acceleration
ed and FS wa
slope and c,
ngle of soil)
ip is calculat
n angle of 1
relationship
h given valu
a slope angl
do-static acce
to decrease f
rent form. U
may be poss
on of and
otion param
A
mic coefficiedeformation
ve argumentsmay be very nk. Characterthe aim of t
were carried
e of mecha
calculated b
n coefficient
as determined
cohesion of
), β (slope a
ted and depi
0 degrees fo
p between
ues of γh/c a
le (β) of 35°
eleration 0.1
from 1.2 to 1
Usually, i
sible to expre
d FS. In this
meters and ea
August 2014
ent values n may be s, the link
useful in rizing the this study,
out for a
anical and
by Bishop
ts of 0.05,
d.
f materials
angle) and
cted for a
or various
and γh/c
nd , the
°, internal
6 , FS is
.0.
is used to
ess the
case, the
arth slope
August 2014
b) Evaluatio
As mepermanent d
Mirabogreater than(decoupled degree anglseconds wer
Where
Fig. 5
Fi
on of the relentioned in bdeformation outalebi et an 7.5 in ordanalysis). T
les on horizore analyzed [, is the she
Table
Seis
5. Relationship
g. 6. Relation
lationship bebackground of a slope, D
al [25] usedder to calculTable 2 showontal bedroc[25]. ear wave velo
2. Details of e
smic performan
p between γh/
nship between
etween ansection, seve
D, based on Nd records frolate the seismws the detailck with /
ocity of soil.
earthquake rec
nce of slopes in
IJST, Tran
/c and for φ
, for va
nd D eral relationsNewmark Meom seven eamic deformals of these e ratios of 3
cords of differ
n pseudo-static…
nsactions of Civ
φ=10°, β=35° (
arious values o
ships have bethod. arthquakes reation of eart
earthquakes. 0 and 45 an
rent locations
…
vil Engineering
(Bishop Meth
of β, φ and FS
been propose
ecorded in Ith slopes wiThe earth sl
nd ⁄ ratios
used in this st
g, Volume 38, N
hod)
S
ed between
Iran with mith PLAXISlopes with 3s of 0.04, 0.
tudy
Number C2
473
and the
magnitudes S software 35 and 45 1 and 0.3

IJST, Transac
474
Mirabohistory, basresults of Newmark's
In ordeearthquake with the resand Travasa
To com
displacemenand the stanRS09 (PGABray & Trathat results et al. (2011)
The RS
Ln (D)
Where: σ
The co
The mas a comprespond dyacceleratiomaterial bepropagatin
ctions of Civil E
outalebi et ased on the redynamic anmethod.
er to select arecords the
sults of scalaarou [7] and
mpare the rents from PLAndard deviat
A, M model)avasarou moof PGA&M ), which is bS09 (PGA &
= +
= 0.694 + 0
oefficients of
=4.89
most importaliant, non-rynamically
ons within elow the slo
ng up (possi
Engineering, V
al‘s [25] anacords which
nalysis. Fina
an appropriaresults of th
ar and vectorMiraboutale
Fig. 7. Com
esults, the mAXIS and nation of the m), SR08 (PGdels were 1.unified modased on earth
&M) modified
+ +
0.322 /
f the model a
, =−4.85,
ant feature origid block.
to earthquthe slide mope. This isibly amplify
B
Volume 38, Num
alyses were h are presenteally, the slo
ate seismic ehe analyses or predictive d
ebi et al [25].
mparison of sl
mean residuaatural log of mean residu
GA Model) o004, 1.197,
del based onhquake record model [21-
+ +
are given belo
=−19.64,
of the decou This mean
uake shakinmass and sls due to accying or de-a
B. Nadi et al.
mber C2
decoupled. Fed in Table 2
ope's perman
earth slope dof PLAXIS sdeformation The results
lope deformat
al (the diffethe predicted
uals was calcof Rathje et 1.871, 0.836
n RS09 is mords from Iran-22] is as foll
+ l
ow:
=42.49,
upled modens that the ng. The malope will bcelerations amplifying a
First, the av2, was evalunent displac
deformation software (demodels of Rare shown in
tion predictive
erence of nad displacemeculated. The al., Jibson [96 and 1.186, ore consistenn. lows:
ln +
=−29.06, =
el is the factslide mass
ain implicatbe differentoriginating along the w
verage respouated in the scement was
predictive mecoupled anaRathje et al. n Fig. 7.
e models
atural log ofents obtained
obtained st9], Miraboutrespectively
nt with the re
(M-6) +ε
=0.72 and
t that the sliis a deform
tion of thist than those
from the fway); causin
A
onse accelerasliding mass
calculated
model based alysis) were [22], Jibson
f the calculad from other tandard devitalebi et al. y. It can be csults of Mira
+3.69 -1.
=0.89
ide mass is mable body s expressione in the fofoundation lng the slope
August 2014
ation time using the based on
on Iran’s compared [9], Bray
ated slope methods) ations for [25] and
concluded aboutalebi
22 (4)
modeled that can
n is that oundation level and
e to move

August 2014
by differeacceleratioslide masswith the riexperienceimprovemedeformatio
For a instead of P
As noteffects and response ofincrease in shaking is aon a site-spaccounted bthe ground mat the locatprescribed b
To estigiven pseud
1. Accordiproperti
2. is de3. Accord
PGA. 4. Based
deforma and
Continuing 1.1 and 1.2
ent amountons. The dyns which is qigid-block med by the ent over thon.
dynamic rePGA, which
ted, topograpthe one dim
f soil and sothe amplitu
a function ofpecific seismbased on a simotion of thtion of the cby Euro Codimate the seido- static coe
ing to Fig. ies of the soietermined fording to Fig. 8
on and ation can beFS.
such compucan be obtai
Seis
ts and in namic respoquantified tmodel,
slide mashe rigid-blo
esponse of h can be obt
Fig
phy can locmensional amoft rock slopude of grounf the defined
mic hazard aimplified proe free field bcells is
de 8. ismic deformefficient, the
6, based on il, γh/c is detr the obtaine8 for compli
other chara determined
utations, seisined for diffe
smic performan
different ponse analysthrough the
is a muchss. In this ck model f
compliant, tained from
g. 8. Computed
ally modify mplification opes during end shaking nd seismic hazanalysis, or focedure devebehind the crs obtained b
mation for a gsteps are as
geometric ctermined for ed γh/c in Figiant, non-rigi
acteristics ofwhich is als
mic deformaferent values
nce of slopes in
IJST, Tran
phases theis models c
e . In ch more real
way, the for modelin
non-rigid m Fig. 8 as a
d values
earthquake of earthquakeearthquakes. near the creszard level (e.from local seloped by Asrest is by linear inte
given slope wfollow:
characteristicthe defined
g. 6 (obtaininid slope
f the predictso the seism
ation of the of as pre
n pseudo-static…
nsactions of Civ
ereby creatcalculate thicomparison istic represe
decoupledng the mec
slope to eaa function of
s plotted versu
ground shae ground moTopographi
sts of steep .g. return peseismic codeshford et al.increased byerpolation b
with the appa
cs of the slo and calcu
ng with ob could be p
tive model mic permanen
given earth esented in Fi
…
vil Engineering
ting a spatis behavior the rock o
entation of d model mchanism of
arthquake shf / and
us
aking in slopotion, can alic effects haslopes [26].riod) and ma
es. The effec[27]. The pr
y 50%. The Petween the
arent safety f
ope and phyulated FS. btained γh/c predicted dir
which is usnt slope defo
slope with dig. 9. This fi
g, Volume 38, N
tial distriband its effe
outcrop motthe seismic
marks a coearthquake
haking, PGA.
pes. Additionso affect the
ave shown aThe intensitay be estimacts of topogrocedure sugPGA on the sbase and the
factor, calcu
ysical and m
on curve FSrectly from
sed, permanormation for
defined FS ogure can be
Number C2
475
bution of ect on the tion used c loading onceptual e-induced
is used
nally, site e dynamic a dramatic ty of base ated based graphy are ggests that slope face e crest as
ulated by a
mechanical
=1). / and
nent slope the given
f 0.9, 1.0, described

IJST, Transac
476
as a bridgedeformation
Fig
For differen
pseudo-stati
and φ was
30°, and40°
were consid
as 0.05, 0.1
Accord
function of
seismic perm
a) The effec
Peak g
place of th
on / and
deformation
the seismic
internal fric
to 0.3, defor
PGA from 0
As can
deformation
designs. Mo
seismic coe
conservativ
ctions of Civil E
e from limin of the slope
g. 9. Variation
nt β, φ, γh/c
ic analysis w
determined.
°; and γh/c fo
dered. Next,
, 0.15, 0.2, 0
ding to Fig. 9
φ, β, PGA,
manent slope
ct of PGA
ground accel
he earthquak
d . For co
n of the slop
c permanent
ction angle of
rmation will
0.6to 0.9, def
n be seen, i
n of the slope
oreover, this
efficient in
e assessment
Engineering, V
it equilibriumes.
n of seismic e
4
c, and vari
was performe
The slope a
or 1200, 600
the slopes w
0.25, 0.3, 0.35
9, it is can b
/ , and
e deformatio
eration is a
ke occurren
onstant char
pe increase fo
deformation
f 20° under t
decrease to
formation wi
if FS is equ
e will be neg
s has also be
conjunction
ts of slope pe
B
Volume 38, Num
m results to
arth slope per
. RESULTS
ious methods
ed and the rel
angle (β) for
, 120, 60, 40
were analyze
5, 0.4, 0.5, 0
e seen that in
d M. The fol
on.
function of
nce. Moreov
racteristics o
or the same
n of an earth
the effects of
5 cm, and vi
ill increase to
ual to or gre
gligible. Cho
een expressed
with a saf
erformance i
B. Nadi et al.
mber C2
o Newmark'
rmanent deform
S AND EVA
s used for c
lationship be
r 55°, 45°,an
0, 30, 24, 20,
ed under the
0.6, 0.7, 1.0,
n addition to
lowing secti
earthquake m
ver, the effe
of slope and
value. Fo
h slope with
f = 0.1will
ice versa. In
o 75cm.
eater than 1
osing this sta
d by Kramer
fety factor o
in earthquake
's based me
mation with d
ALUATION
alculating F
etween ,
nd35°; intern
, 17, 15, 13.
effect of dif
1.2and safety
o FS and ,
ons describe
magnitude a
ects of the
d earthquak
or example, a
h a safety f
be 35cm. In
case of incre
and the
ate for design
r as: ‘‘Use o
of 1.0 has b
es’’ [10].
ethods of es
different value
S from limit
, γh/c ,FS fo
nal friction a
3, 12, 10.9,
fferent pseud
y factors wer
seismic disp
e the effect o
and the regio
site are al
ke, the incre
according to
factor of 1.1
n case of decr
easing in
is considere
ning can lead
of peak groun
been shown
A
stimating the
es of & FS
t equilibrium
or different v
ngle (φ) for
10, 7.5, 6, 5,
do-static acc
re determine
placement of
of each variab
on’s distance
lso consider
ease in PG
o Fig. 10, if P
,slope angle
reasing PGA
ed equal to
d to very con
nd accelerati
n to give ex
August 2014
e seismic
S
m method,
values of β
10°, 20°,
, 4, 3, 2, 1
celerations
d.
slope is a
ble on the
e from the
red based
A causes
PGA=0.6,
e of 45 °,
A from 0.6
PGA, the
nservative
ion as the
xcessively
August 2014
b) The effec
Figure
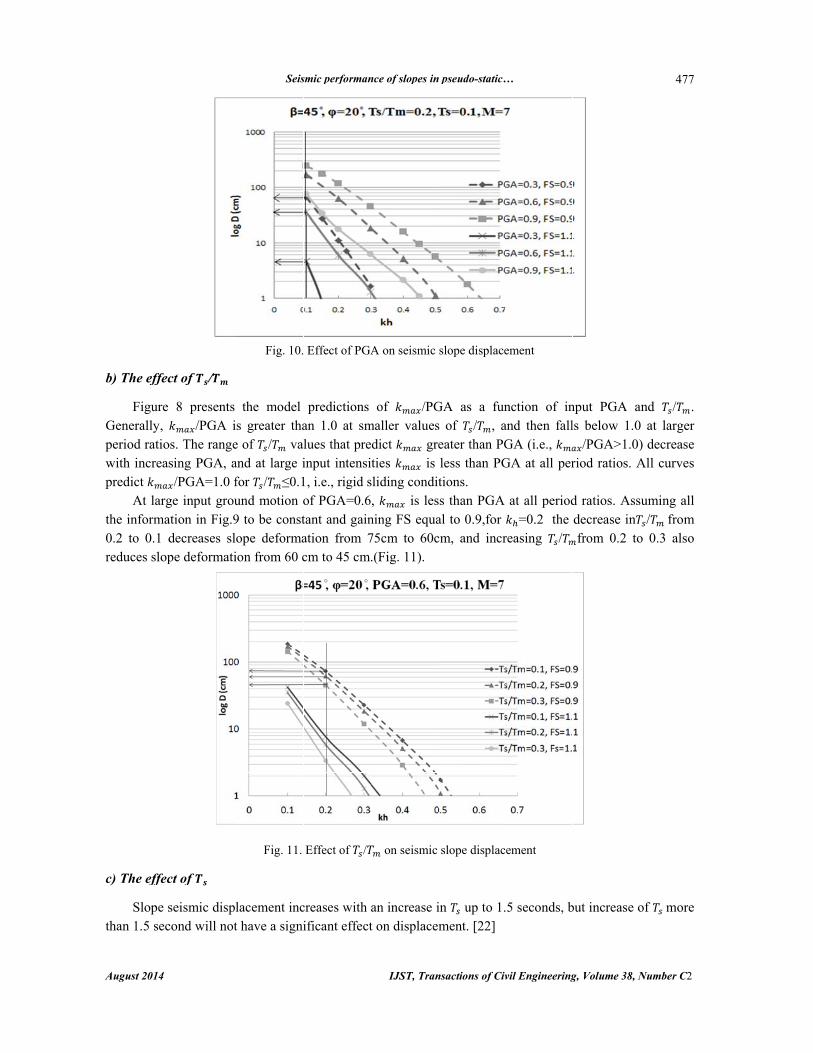
Generally, period ratiowith increaspredict
At largthe informa0.2 to 0.1 dreduces slop
c) The effec
Slope s
than 1.5 sec
ct of /
8 presents /PGA i
os. The rangesing PGA, a/PGA=1.0 f
ge input grouation in Fig.9decreases slope deformati
ct of
seismic displcond will not
Seis
Fig. 10.
the model s greater tha
e of / vaand at large ifor / ≤0.1und motion o9 to be constope deformaion from 60 c
Fig. 11.
lacement inct have a signi
smic performan
Effect of PGA
predictions an 1.0 at smlues that preinput intensi1, i.e., rigid sof PGA=0.6tant and gaination from 7cm to 45 cm
Effect of /
creases with ificant effect
nce of slopes in
IJST, Tran
A on seismic
of /PGmaller valuesedict grities is sliding condi, is les
ning FS equa75cm to 60c.(Fig. 11).
on seismic
an increase it on displace
n pseudo-static…
nsactions of Civ
slope displace
GA as a funs of / , aeater than PGless than PGtions.
ss than PGA al to 0.9,for cm, and incr
slope displac
in up to 1.ment. [22]
…
vil Engineering
ement
nction of inand then fallGA (i.e., GA at all per
at all period=0.2 the
reasing /
ement
5 seconds, b
g, Volume 38, N
nput PGA als below 1.0
/PGA>1.0)riod ratios. A
d ratios. Assdecrease infrom 0.2 to
but increase o
Number C2
477
and / . 0 at larger ) decrease All curves
suming all / from
o 0.3 also
of more
IJST, Transac
478
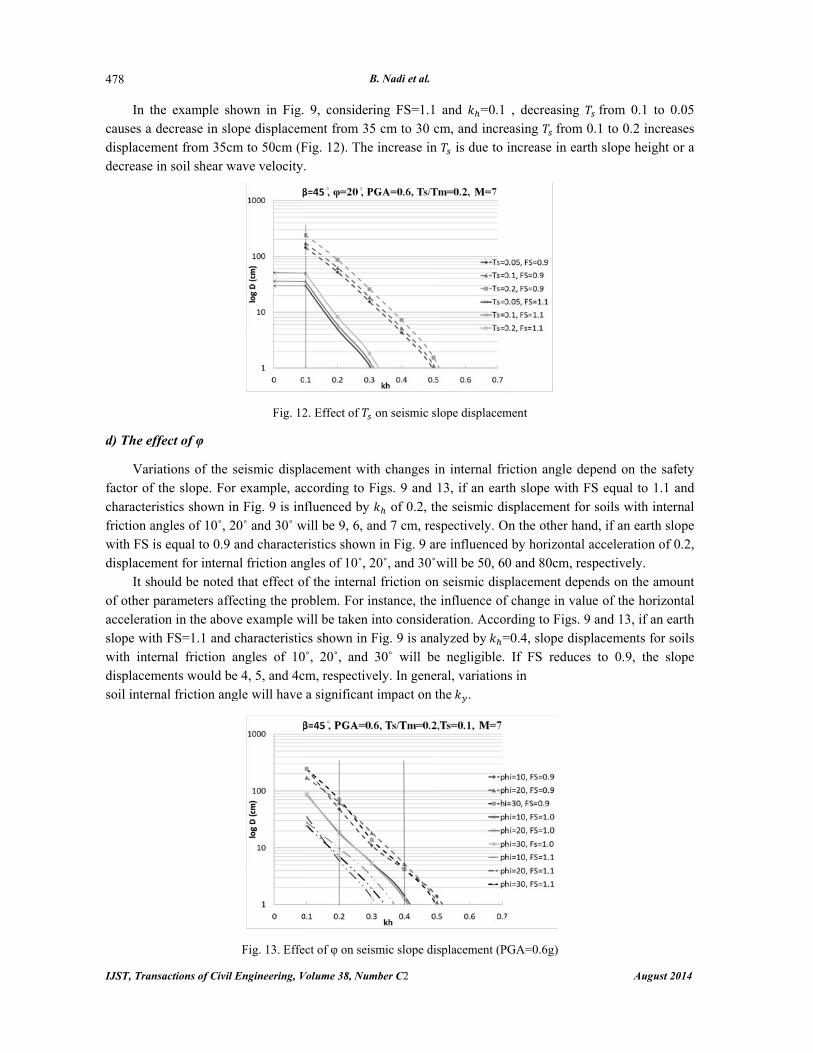
In the causes a decdisplacemendecrease in
d) The effec
Variati
factor of thcharacteristfriction angwith FS is edisplacemen
It shouof other paraccelerationslope with Fwith internadisplacemensoil internal
ctions of Civil E
example shcrease in slont from 35cmsoil shear w
ct of φ
ions of the se slope. For ics shown in
gles of 10˚, 2equal to 0.9 ant for internauld be noted rameters affen in the abovFS=1.1 and cal friction ants would bel friction ang
Engineering, V
hown in Fig.ope displacemm to 50cm (Fave velocity
Fig. 12
seismic displexample, ac
n Fig. 9 is in0˚ and 30˚ wand characteral friction anthat effect o
ecting the prove example wcharacteristicangles of 10e 4, 5, and 4cgle will have
Fig. 13. Effe
B
Volume 38, Num
9, considerment from 35Fig. 12). The.
2. Effect of
lacement witccording to F
nfluenced by will be 9, 6, aristics showngles of 10˚, 2
of the internaoblem. For i
will be taken cs shown in 0˚, 20˚, and cm, respectiva significant
ect of φ on sei
B. Nadi et al.
mber C2
ring FS=1.1 5 cm to 30 ce increase in
on seismic sl
th changes iFigs. 9 and 1
of 0.2, thand 7 cm, resn in Fig. 9 ar20˚, and 30˚wal friction onnstance, the into consideFig. 9 is ana30˚ will be
vely. In genert impact on t
smic slope dis
and =0.1cm, and incre
is due to
lope displacem
n internal fr13, if an earhe seismic dispectively. Ore influencedwill be 50, 60
n seismic dispinfluence ofration. Acco
alyzed by =e negligible. ral, variationthe .
splacement (P
, decreasineasing fromincrease in e
ment
riction angle th slope withisplacement
On the other hd by horizont0 and 80cm, placement def change in vording to Figs=0.4, slope d
If FS reduns in
PGA=0.6g)
A
g from 0.m 0.1 to 0.2 earth slope h
depend on th FS equal tfor soils withand, if an etal acceleratirespectively
epends on thvalue of the hs. 9 and 13, i
displacementuces to 0.9,
August 2014
.1 to 0.05 increases
height or a
the safety to 1.1 and th internal arth slope ion of 0.2, y. he amount horizontal if an earth ts for soils the slope
Seismic performance of slopes in pseudo-static…
August 2014 IJST, Transactions of Civil Engineering, Volume 38, Number C2
479
e) The effect of β
According to Euro Code 8, based on a simplified procedure developed by Ashford et al. [27] the seismic loading can be amplified for steep (>60°) slopes (i.e., ∼1.5 PGA). [27]
f) Verification and example applications
To illustrate the verification and application of the model for predicting the sliding displacement of
slopes with specified safety factor, consider the following example: Consider two slope Models (M1 and M2) on Fig. 4, with the height of 30m from bedrock, angle of
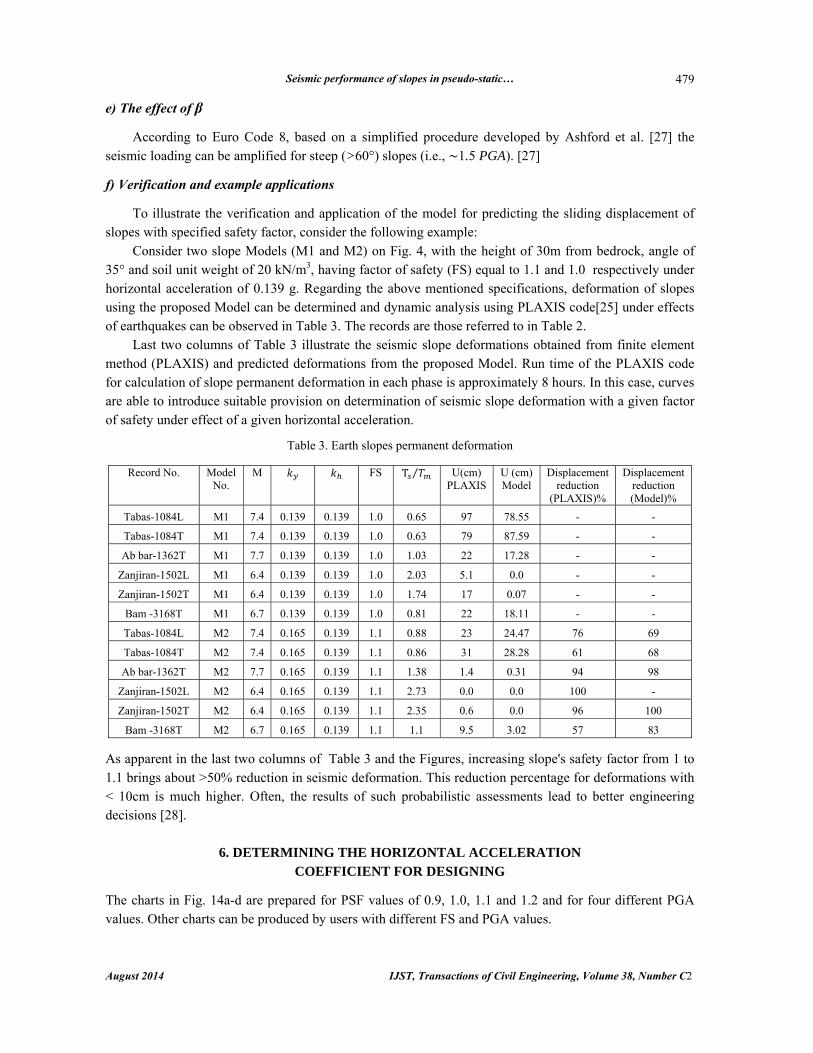
35° and soil unit weight of 20 kN/m3, having factor of safety (FS) equal to 1.1 and 1.0 respectively under horizontal acceleration of 0.139 g. Regarding the above mentioned specifications, deformation of slopes using the proposed Model can be determined and dynamic analysis using PLAXIS code[25] under effects of earthquakes can be observed in Table 3. The records are those referred to in Table 2.
Last two columns of Table 3 illustrate the seismic slope deformations obtained from finite element method (PLAXIS) and predicted deformations from the proposed Model. Run time of the PLAXIS code for calculation of slope permanent deformation in each phase is approximately 8 hours. In this case, curves are able to introduce suitable provision on determination of seismic slope deformation with a given factor of safety under effect of a given horizontal acceleration.
Table 3. Earth slopes permanent deformation
Displacement
reduction (Model)%
Displacement reduction
(PLAXIS)%
U (cm) Model
U(cm) PLAXIS
T ⁄ FS M Model No.
Record No.
- - 78.55 97 0.65 1.0 0.139 0.139 7.4 M1 Tabas-1084L
- - 87.59 79 0.63 1.0 0.139 0.139 7.4 M1 Tabas-1084T
- - 17.28 22 1.03 1.0 0.139 0.139 7.7 M1 Ab bar-1362T
- - 0.0 5.1 2.03 1.0 0.139 0.139 6.4 M1 Zanjiran-1502L
- - 0.07 17 1.74 1.0 0.139 0.139 6.4 M1 Zanjiran-1502T
- - 18.11 22 0.81 1.0 0.139 0.139 6.7 M1 Bam -3168T
69 76 24.47 23 0.88 1.1 0.139 0.165 7.4 M2 Tabas-1084L
68 61 28.28 31 0.86 1.1 0.139 0.165 7.4 M2 Tabas-1084T
98 94 0.31 1.4 1.38 1.1 0.139 0.165 7.7 M2 Ab bar-1362T
- 100 0.0 0.0 2.73 1.1 0.139 0.165 6.4 M2 Zanjiran-1502L
100 96 0.0 0.6 2.35 1.1 0.139 0.165 6.4 M2 Zanjiran-1502T
83 57 3.02 9.5 1.1 1.1 0.139 0.165 6.7 M2 Bam -3168T
As apparent in the last two columns of Table 3 and the Figures, increasing slope's safety factor from 1 to 1.1 brings about >50% reduction in seismic deformation. This reduction percentage for deformations with < 10cm is much higher. Often, the results of such probabilistic assessments lead to better engineering decisions [28].
6. DETERMINING THE HORIZONTAL ACCELERATION COEFFICIENT FOR DESIGNING
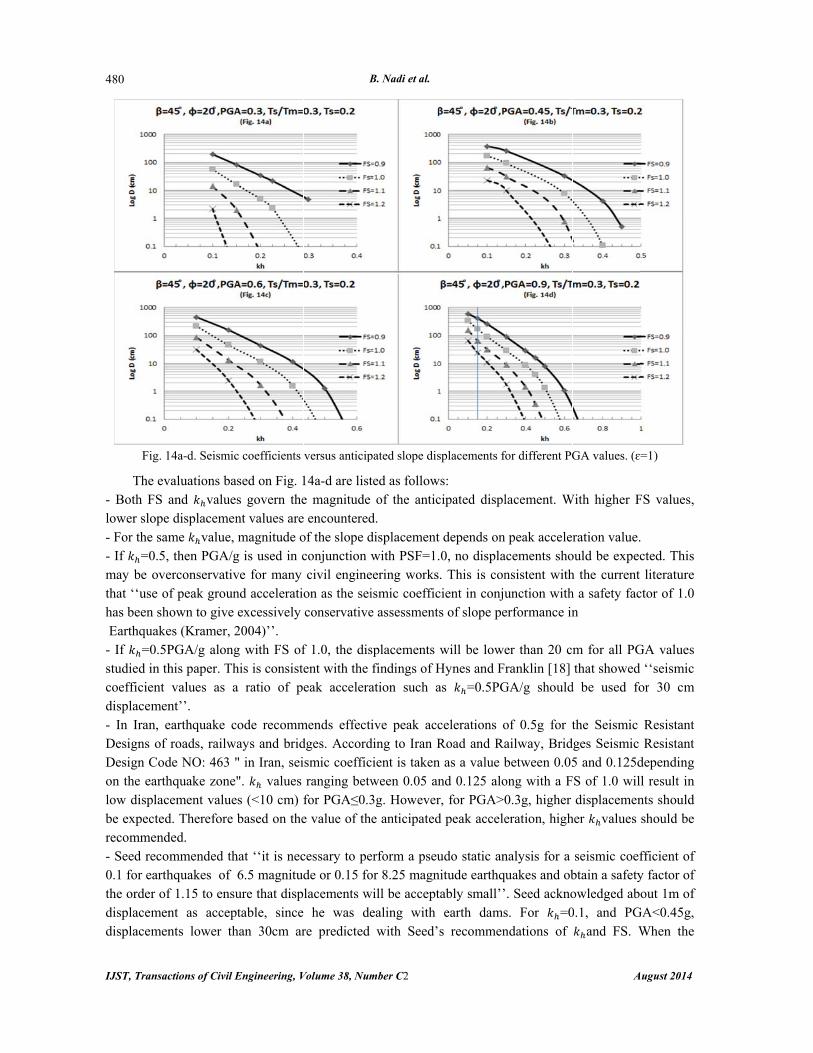
The charts in Fig. 14a-d are prepared for PSF values of 0.9, 1.0, 1.1 and 1.2 and for four different PGA values. Other charts can be produced by users with different FS and PGA values.
IJST, Transac
480
Fig. 1
The ev- Both FS alower slope- For the sam- If =0.5, may be ovethat ‘‘use ohas been sh Earthquake- If =0.5Pstudied in thcoefficient displacemen- In Iran, eDesigns of Design Codon the earthlow displacbe expectedrecommend- Seed reco0.1 for earththe order ofdisplacemendisplacemen
ctions of Civil E
14a-d. Seismic
valuations baand value displacemenme value, then PGA/g
erconservativf peak grounown to give
es (Kramer, 2PGA/g alonghis paper. Thvalues as a
nt’’. earthquake croads, railw
de NO: 463 "hquake zoneement value
d. Therefore ded. mmended thhquakes of f 1.15 to ensunt as accepnts lower th
Engineering, V
c coefficients
ased on Fig. 1s govern thent values aremagnitude o
g is used in cve for many nd acceleratioexcessively
2004)’’. g with FS ofhis is consistea ratio of p
code recommays and brid" in Iran, sei". values
es (<10 cm) fbased on the
hat ‘‘it is nec6.5 magnitudure that disp
ptable, sincehan 30cm ar
B
Volume 38, Num
versus anticip
14a-d are liste magnitude e encounteredof the slope dconjunction wcivil engine
on as the seiconservative
f 1.0, the disent with the eak accelera
mends effectidges. Accordsmic coefficranging betwfor PGA≤0.3e value of th
cessary to pede or 0.15 folacements w he was dere predicted
B. Nadi et al.
mber C2
pated slope dis
ted as followof the antic
d. displacementwith PSF=1.
eering worksismic coeffice assessment
splacements findings of Hation such a
ive peak accding to Iran Rcient is takenween 0.05 an3g. Howevere anticipated
erform a pseuor 8.25 magn
will be acceptealing with
with Seed’
splacements fo
ws: cipated displ
t depends on .0, no displas. This is concient in conjuts of slope pe
will be loweHynes and Fras =0.5PG
celerations oRoad and Ran as a value bnd 0.125 alor, for PGA>0d peak accele
udo static annitude earthqutably small’’
earth damss recommen
for different PG
lacement. W
peak acceleracements shonsistent withunction witherformance in
er than 20 cmranklin [18]
GA/g should
of 0.5g for tailway, Bridbetween 0.05ong with a F0.3g, higher eration, high
nalysis for a uakes and ob. Seed acknos. For =0ndations of
A
GA values. (ɛ
With higher F
ration value.ould be expech the current h a safety facn
m for all PGthat showed
d be used fo
the Seismic dges Seismic 5 and 0.125dS of 1.0 wildisplacemen
her values
seismic coefbtain a safetyowledged ab0.1, and PG
and FS. W
August 2014
=1)
FS values,
. cted. This literature
ctor of 1.0
GA values d ‘‘seismic or 30 cm
Resistant Resistant
depending ll result in nts should should be
fficient of y factor of out 1m of
GA<0.45g, When the
Seismic performance of slopes in pseudo-static…
August 2014 IJST, Transactions of Civil Engineering, Volume 38, Number C2
481
value of 0.15 and FS of 1.15 is applied with PGA=0.90g, the proposed methodology in this paper predicts maximum displacement of 140cm. This means that even for high PGA values, Seed’s recommendation may be un-conservative. - Magnitude of the slope displacement depends on the maximum horizontal equivalent acceleration which depends on PGA and / . - The Newmark-type rigid block analysis was overly conservative for cases where the / was greater than about 0.5 and un-conservative when / was in the range of 0.2–0.5 for PGA 0.5 .When PGA 0.5gNewmark-type rigid block analysis was overly conservative for all of / .PGA and / have
significant effect on and slope displacement.
7. CONCLUSION
The pseudo static approach is a well-known method to calculate the seismic stability of slopes. However, in today’s practice, performance based design concept necessitates the anticipated displacements to be known instead of a single pseudo static safety factor (FS). Although there are also several recommendations for selection of value, many of them depend on judgment and expertise.
Based on the provided charts, while designing an earth slope under specific and FS, its performance can be taken into consideration, simultaneously. Design of slopes without consideration of its performance may be conservative or underestimated. This kind of application is a novel approach. Calculated displacements are then investigated in terms of /PGA values and being consistent with the literature. Earthquake induced slope displacements are found to be very sensitive to the value of the yield accelerations. Displacements decrease with increase in the acceleration ratios. Several equations are derived for all data and for different earthquake magnitude values (M) with and without distance constraint and for different peak acceleration (PGA) ranges. The obtained equations are compared with literature and it is shown that categorizations for earthquake magnitude, distance to the epicenter and peak acceleration are important and effective tools.
Based on the results, a methodology is presented in the context of a coupled displacement pseudo-static safety factor–seismic coefficient analysis. The results revealed that seismic coefficient for any allowable displacement should be based on anticipated PGA values. Use of high FS values results in lower displacements. It is also found that use of =PGA/g in conjunction with FS=1.0 results in negligible displacement and it may be over conservative for any civil engineering works. If =0.5PGA/g along with FS of 1.0, displacements will be lower than 30cm for all PGA values studied in this paper, which is consistent with the well-known findings of Hynes and Griffin [18] . Evaluations are also made for Seed’s recommendations and it is shown that Seed’s criterion limits the displacement values to about 100cm for accelerations as high as 0.7g. Acknowledgements: The paper has been prepared in the framework of researches in seismic design of slopes in continuation and development of the research project No. 403 supported by International Institute of Earthquake Engineering and Seismology (IIEES), Iran, entitled "Determination of pseudo static coefficients in seismic slope stability analysis in a selected zone of Iran based on the performance". The authors would like to thank IIEES for support and assistance.
REFERENCES 1. Kramer, S. L. & Lindwall, N. W. (2004). Dimensionality and directionality effects in Newmark sliding block
analyses. Journal of Geotechnical and Geoenvironmental Engineering, Vol. 130, No. 3, pp. 303-315.
B. Nadi et al.
IJST, Transactions of Civil Engineering, Volume 38, Number C2 August 2014
482
2. Newmark, N. M. (1965). Effects of earthquakes on dams and embankments. Geotechnique, Vol. 15, No. 2, pp.
139-160.
3. Ambraseys, N. N. & Menu, J. M. (1988). Earthquake induced ground displacements. Earthquake Engineering
and Structural Dynamics, Vol. 16, No. 7, pp. 985-1005.
4. Saygili, G. & Rathje, E. M. (2008). Empirical predictive models for earthquake induced sliding displacements of
slopes. Journal of Geotechnical and Geoenvironmental Engineering, Vol. 134, No. 6, pp. 790-803.
5. Makdisi, F. I. & Seed, H. B. (1978). Simplified procedure for estimating dam and embankment earthquake-
induced deformations. Journal of Geotechnical Engineering Division, Vol. 104, No. 7, pp. 849-867.
6. Bray, J. D. & Rathje, E. M. (1998). Earthquake-induced displacements of solid-waste landfills. Journal of
Geotechnical and Geoenvironmental Engineering, Vol. 124, No. 3, pp. 242-253.
7. Bray, J. D. & Travasarou, T. (2007). Simplified procedure for estimating earthquake-induced deviatoric slope
displacements. Journal of Geotechnical and Geoenvironmental Engineering, Vol. 133, No. 4, pp. 381-392.
8. Terzaghi, K. (1950). Mechanism of landslides. Application of Geology to Engineering Practice, Berkey Volume,
Geological Society of America (GSA), pp. 83-123.
9. Jibson, R. W. (2007). Regression models for estimating coseismic landslide displacement. Engineering Geology,
Vol. 91, No. 2-4, pp. 209-218.
10. Kramer, S. L. (1996). Geotechnical earthquake engineering. Prentice Hall Pub., New Jersey, USA.
11. Jibson, R. W. (2011). Methods for assessing the stability of slopes during earthquakes—A retrospective.
Engineering Geology, Vol. 122, No. 1–2, pp. 43–50.
12. Gazetas, G., Garini, E., Anastasopoulos, I. & Georgarakos, T. (2009). Effects of near fault ground shaking on
sliding systems. Journal of Geotechnical and Geoenvironmental Engineering, Vol. 135, No. 12, pp. 1906–1921.
13. Simonelli, A. L. (1993). Displacement analysis in earth slope design under seismic conditions. In: Proc. VI
Conference on Soil Dynamics and Earthquake Engineering, Bath, U.K., pp. 493-505
14. Bozbey, I. & Gundogdu, O. (2011). A methodology to select seismic coefficients based on upper bound
"Newmark" displacements using earthquake records from Turkey. Soil Dynamics and Earthquake Engineering,
Vol. 31, No. 3, pp. 440-451.
15. Gazetas, G. & Garini, E. (2007). Sliding of rigid block on sloping plane the surprising role of the sequence of
long duration pulses. In: Proceedings of the second Japan–Greece workshop on seismic design, observation
retrofit of foundations, Tokyo, Japan, pp.79–104.
16. Seed, H. B. (1979). Considerations in the earthquake resistant design of earth and rock fill dams. Géotechnique,
Vol. 29, No. 3, pp. 215-263.
17. Marcuson, W. F. & Franklin, A. G. (1983). Seismic design analysis and remedial measures to improve the
stability of existing earth dams. Corps of Engineers Approach, in Seismic Design of Embankments and Caverns,
T. R. Howard, Ed., New York, USA.
18. Hynes-Griffin, M. E. & Franklin, A. G. (1984), Rationalizing the seismic coefficient method. U.S. Army Corps
of Engineers Waterways Experiment Station, Vicksburg, Mississippi, miscellaneous paper GL-84-13.
19. Stewart, J. P., Blake, T. F. & Hollingsworth, R. A. (2003). A screen analysis procedure for seismic slope
stability. Earthquake Spectra, Vol. 19, No. 3, pp. 697-712.
20. Ambraseys, N. N. & Srbulov, M. (1994). Attenuation of earthquake-induced ground displacements. Earthquake
Engineering and Structural Dynamics, Vol. 23, No. 5, pp. 467-487.
21. Saygili, G. & Rathje, E. M. (2009). Probabilistically based seismic landslide hazard maps an application in
Southern California. Engineering Geology, Vol. 109, No. 3-4, pp. 183–194.
22. Rathje, E. M. & Antonakos, G. (2011). A unified model for predicting earthquake-induced sliding displacements
of rigid and flexible slopes. Engineering Geology, Vol. 122, No. 1–2, pp. 51–60.
Seismic performance of slopes in pseudo-static…
August 2014 IJST, Transactions of Civil Engineering, Volume 38, Number C2
483
23. Lin, J. S. & Whitman, R. V. (1986). Earthquake induced displacements of sliding blocks. Journal of
Geotechnical Engineering, Vol. 112, No. 1, pp. 44-59.
24. Wartman, J., Seed, R. B. & Bray, J. D. (2005). Shaking table modeling of seismically induced deformations in
slopes. Journal of Geotechnical and Geoenvironmental Engineering, Vol.131, No. 5, pp. 610-622.
25. Miraboutalebi, M., Askari, F. & Farzaneh, O. (2011). Effect of bedrock inclination on seismic slope stability
according to Iran seismically data. International Journal of Civil Engineering, Vol. 9, No. 4. pp. 247-254.
26. Mavrouli, O., Corominas, J. & Wartman, J. (2009). Methodology to evaluate rock slope stability under seismic
conditions at Sola de Santa Coloma, Andorra. Natural Hazards Earth System Sciences, Vol. 9, No. 6, pp. 1763–
1773.
27. Ashford, S. A., Sitar, N. & Lysmer, J. (1997). Topographic effects on the seismic response of steep slopes.
Bulletin of the Seismological Society of America, Vol. 87, No. 3, pp. 701-709.
28. Dabiri, R., Askari, F., Shafiee, A. & Jafari, M. K. (2010). Shear wave velocity based liquefaction resistance of
sand-silt mixtures: deterministic versus probabilistic approach. Iranian Journal of Science & Technology,
Transactions of Civil Engineering, Vol. 35, No. C2, pp. 199-215.