Seismic performance evaluation of jacket-type o shore...
12
Transcript of Seismic performance evaluation of jacket-type o shore...

Scientia Iranica A (2017) 24(4), 1843{1854
Sharif University of TechnologyScientia Iranica
Transactions A: Civil Engineeringwww.scientiairanica.com
Seismic performance evaluation of jacket-type o�shoreplatforms using endurance time method consideringsoil-pile-superstructure interaction
H. Hasani�, A.A. Golafshani and H.E. Estekanchi
Department of Civil and Environmental Engineering, Sharif University of Technology (SUT), Tehran, P.O. Box 11155-1639, Iran.
Received 10 November 2015; accepted 2 August 2016
KEYWORDSEndurance timemethod;Soil-pile-superstructureinteraction;Single pile;Jacket o�shoreplatform;Seismic assessment.
Abstract. In this paper, application of Endurance Time (ET) method in nonlinearseismic analysis of o�shore pile supported systems has been studied. The ET method is atime-history analysis in which structures are subjected to intensifying arti�cial accelerationfunctions. The ET method reduces complexity and computational demand of conventionalnonlinear seismic analysis, and it provides response at di�erent seismic levels in a single ETanalysis. The aforementioned methodology has been applied to a typical model of single pileand then to a functional jacket o�shore platform in Persian Gulf region. Seismic response ofaforesaid models by ET method has been compared with conventional time-history method.The results indicate that ET method is reliable in capturing seismic response of o�shoreplatforms supported on piles with an acceptable accuracy.© 2017 Sharif University of Technology. All rights reserved.
1. Introduction
The main objective of seismic design is to providesafe structures at reasonable cost. O�shore platformshave been used in petroleum activity for decades,and these types of structures are considered as highlyimportant in oil industry. Special e�orts are requiredto operate them continuously over time for economicand environmental reasons. Therefore, it is necessaryto pay special attention to the analysis of these typesof structures. Current methods for seismic analysis ofthese structures have a number of problems such asbeing complex and time consuming. In this paper,the ET method on the o�shore structures with deepfoundation (pile), such as o�shore platforms, has beeninvestigated.
*. Corresponding author. Fax: +98 21 22415800E-mail addresses: h [email protected] (H. Hasani);[email protected] (A.A. Golafshani);[email protected] (H.E. Estekanchi)
The most common o�shore platforms, which areused in the oil industry, are Jacket-Type O�shorePlatform (JTOP) which consists of the jacket struc-ture, pile foundation, and its supporting soil. Duringearthquakes, these components act with each otherto produce the global response of the JTOP so thatthe shear waves propagate through di�erent soil layersand lead to kinematic forces to the pile foundation;subsequently, the pile shaking induces inertial force inthe jacket structure. Hence, the seismic response ofstructures with pile is strongly related to non-linearbehavior of piles. The ET method, however, wasinvestigated on simpli�ed models of JTOPs regardlessof their piles so far [1].
Estekanchi et al. introduced the ET method [2]as a new seismic analysis method. The ET methodhas been applied in the linear and nonlinear seismicanalyses of several structures which are built on soilsuch as steel frames [3,4], concrete gravity dams [5],unanchored steel storage tanks [6], steel liquid storagetanks [7], and shell structures [8]. However, the

1844 H. Hasani et al./Scientia Iranica, Transactions A: Civil Engineering 24 (2017) 1843{1854
reliability and level of accuracy of the method, inthe case of pile supported structures, have not beenexamined. It is important to extend these studies tothe area of pile supported structures such as jacket-typeo�shore structures, since the presence of di�erent soillayers results in complex models with a special type ofground motion �ltering e�ects that is not common inother types of structures.
In this study, the ability of ET method in estimat-ing seismic behavior of o�shore structures supportedwith piles is investigated. First, the concept of ETmethod is explained. In addition to ET analysis, time-history analysis is conducted for comparative analysisof the results obtained from the two methods. For thispurpose, the authors selected two case studies: �rst,a Single Pile (SP) was tested by the centrifuge at theUniversity of California at Davis under an earthquakeloading [9]; second, a JTOP in the Persian Gulf. Af-terwards, these structures with soil-pile-superstructureinteraction have been modeled in Open System forEarthquake Engineering Simulation (OpenSees) [10];moreover, for non-linear one-dimensional site responseanalysis, DEEPSOIL [11] has been used.
2. Endurance time concept
The ET method is a dynamic analysis procedurewhich uses arti�cial intensifying acceleration as theloading functions. By using this method, the entirerange of excitation levels of interest can be coveredin a single numerical or experimental simulation, thussigni�cantly reducing the computational demand ascompared to full nonlinear response-history analyses.ET analysis makes it easy to compare the improve-ments or disadvantages resulting from changes in thedesign parameters. Due to the dynamic nature of thismethod, structural modeling and loading on structurecan be accomplished with an acceptable precision.
In the ET procedure, structures are subjected toa set of arti�cial intensifying acceleration functions; forexample, an ET acceleration function (ETA20en01) isshown in Figure 1. These ET accelerograms are de-signed in a manner which has a linear relationship withintensity of acceleration and displacement responsespectrum as shown in Eqs. (1) and (2):
SaT (T; t) =t
tTargetSac(T ); (1)
SuT (T; t) =t
tTargetSac(T )� T 2
4�2 ; (2)
where SaT (T; t) represents target acceleration responseat time t, T stands for the period of free vibration,Sac(T ) is designated as the template design accelera-tion spectrum, and SuT (T; t) is the target displacementresponse at time t. To obtain an ET Acceleration
Figure 1. The ETAen01 accelerogram.
Function (ETAF) by these features, it is formulatedas an unconstrained optimization problem in the timedomain as follows:
Minimize F (ag) =Z Tmax
0t
Z tmax
0
��Sa(T; t)
� SaT (T; t)�2 + �
�Su(T; t)
� SuT (T; t)�2dtdT; (3)
where F (ag) represents the ETAF being sought, and �stands for an optimization weighting parameter set to1.0 in this study.
Preliminary concepts of this method can be in-troduced by a hypothetical shaking table test in whichthere are three o�shore platforms, and intensifyingacceleration function of ET is applied to them. Inthe beginning, all three platforms are stable up tothe 5th second; while intensity of excitation graduallyincreases, amplitude of structures becomes large as welldue to the increasing demand for acceleration function.Eventually, platforms show non-linear behavior afterelastic deformations. As shown in Figure 2, platformnumber 1 is stronger than platform number 3, andnumber 3 is stronger than number 2. If the ETAF isscaled such that response spectrum in the 10th secondis in accordance with ELE [12] event and the 15thsecond is in accordance with ALE [12] event, it canbe concluded that platform number 3 is a suitable one;platform number 2 is weak, and platform number 1 isnon-economic.
3. Model description
3.1. Single pileAll experimental results related to SP model have beenextracted from CSP4 experimental centrifuge test doneby Wilson et al. (1997) [13]. All results in study ofWilson et al. (1997) [13] were in prototype units. SPwas in a Flexible Shear Beam [14], and soil pro�le wascomposed of two horizontal layers. The lower layer was

H. Hasani et al./Scientia Iranica, Transactions A: Civil Engineering 24 (2017) 1843{1854 1845
Figure 2. Hypothetical test of shaking table.
�ne uniformly graded Nevada sand with a Cu of 1.5,D50 of 15, dry density of 66 Mg/m3, and Dr 75-80%.The upper layer was very soft clay from Bay mud withLL of 88%, PI of 48%, and a moist soil (water content=140%); moreover, this layer was placed in four equallayers; in addition, each layer was separated by a sheetof �lter to accelerate consolidation. cu, according toBoulanger et al. (1999) [9], was considered to be equalto cu = 0:45�0vc. Also, the chosen SP consisted of asuperstructure with mass of 49.1 Mg attached to thetop of SP at elevation of 3.81 m. This aluminum SPin the test was approximately equivalent to a steel pilewith diameter of 0.67 m, thickness of 19 mm, mass perunit length of 0.37 Mg/m, and EI equal to 417 MN.m2
(Figure 3).In CSP4 experiment, Kobe earthquake (1995) for
Port Island Station, whose noises were removed andscaled to 0.055 g, was entered to centrifuge table.
Figure 3. SP supported structure in CSP4 test.
Figure 4. General view of the SPD2 frame.
3.2. Functional jacket type o�shore platformIn this study, SPD2 as a JTOP located in South ParsGas �eld Phase-1 in Persian Gulf region was consideredherein. This platform is a six-legged jacket, and thereis a grouted pile at the end of each leg. The fourpiles at the corners of longitudinal faces of platformare extended 85 m, and two intermediate piles areextended 79 m below the mud line elevation. Thejacket dimensions in the horizontal plane at the topand bottom (mud line) are about 16:00 m � 27:50 mand 23:4 m � 37:7 m. The mean water depth is 65 m(Figure 4).
Furthermore, bedrock elevation in this area isnearly at 110 m depth beneath the mud line, and pro�leof median shear wave velocity in the vicinity of thisjacket is shown in Figure 5.
4. Numerical simulations
4.1. Pile-soil interactionRegarding these models, BNWF was employed toconsider nonlinear pile-soil interaction. In the BNWFmodel, movements around pile, where pile-soil in-teraction occurs, is called near-�eld movement, andmovements far from the pile are called far-�eld orfree-�eld movement. We simulated far-�eld move-ments by 1-D wave propagation analysis program forgeotechnical response analysis of deep soil deposits(DEEPSOIL) [11]; moreover, for near-�eld movements,we simulated these movements by independent springs(p-y, t-z, and q-z) connected horizontally and verticallyto pile elements. p-y springs indicate soil reaction

1846 H. Hasani et al./Scientia Iranica, Transactions A: Civil Engineering 24 (2017) 1843{1854
Figure 5. Pro�le of median shear wave velocity for site ofSouth Pars Gas �eld in the vicinity of SPD2 location usedin site response analyses [28].
force versus lateral displacement response of pile indi�erent layers; t-z springs consider the shear forcetransferred between the soil and the pile in variousdepths, and q-z springs provide end bearing resistance.The concept of dynamic BNWF model is shown inFigure 6.
In addition, the dynamic model used for p-y elements in this paper is illustrated in Figure 7.Displacement time history calculated by DEEPSOILwas applied to p-y element along the pile. TheBNWF model can take the variation of soil propertieswith depth, nonlinear soil behavior, dissipating energyby hysteric damping for radiation damping [15], and
Figure 7. Components of nonlinear p-y element [9].
gapping e�ect [16] into account. Penzien et al. [17],Kagawa and Kraft [18], Nogami et al. [19], Boulangeret al. [9], and Naggar and Bentley [20] proposedseveral models of the BNWF. In this study, nonlinearp-y material with gapping capability (Figure 7), inaddition to t-z and q-z materials, was modeled usingthe element described by Boulanger et al. (1999) [9].The characteristics of these springs were estimated byemploying recommendations in API RP-2A WSD [21].
4.2. Free-�eld site response analysis4.2.1. Single pileAccording to the recommendations of Boulanger etal. [9], small-strain shear modulus Gmax of sand wascalculated by Eq. (4), which was obtained by Seed andIdris [22], and Gmax of clay was considered to be equalto Gmax =cu = 380:
Gmax
Patm= 21:8K2;max
r�0mPatm
; (4)
where K2;max = 65, �0m = (1 + 2K0)�0vc=3, and K0 =0:6.
To obtain a precise match between numerical non-linear model of deep soil deposit and experimentalresults, MRDF pressure-dependent hyperbolic modelwas used to �nd the �tting parameters [23]. Further-
Figure 6. A schematic concept of soil-pile-structure interaction dynamic BNWF model used in this research.
H. Hasani et al./Scientia Iranica, Transactions A: Civil Engineering 24 (2017) 1843{1854 1847
more, for curve �tting procedure, the MRDF-Darendeliwas used. Considering the clay, Darendeli [24] targetcurves, and for the sand, Vucetic & Dobri [25] targetcurves for damping versus strain and G=Gmax versusstrain were chosen.
Forty-nine layers of soil were considered for thismodel since the maximum frequency which can bepropagated from thick layers of soil is small; moreover,using fewer numbers of layers (thicker layers) �ltershigh frequency waves in low spectral accelerations [26].
Besides, SP was in Flexible Shear Beam; hence,the total unit weight of the soil was increased forconsidering the lateral forces of the rings according tothe suggestion of Van Laak et al. [27].
4.2.2. Functional o�shore platformAs demonstrated in Figure 5, median shear wavevelocity for South Pars Gas �eld site in the vicinityof SPD2 location was used, which was calculated byTabandeh [28]. Afterwards, the authors used pressure-dependent hyperbolic model for soil column behaviorof this model, and Darendeli's models [24] were selectedto be the reference curves.
4.3. Structure modelingBoth SP and SPD2 were modeled in 2D; additionally,�ber section (in combination with beam-column) wasused for modeling.
For the JTOP, the initial errors of constructionalo�shore platform were accounted with value of 0.002 L.Moreover, all topside loads were applied to the mainjoints as equivalent point loads, and in this model,the added mass e�ect was considered for hydrodynamice�ects [21].
4.4. Comparison of numerical andexperimental results for a single pile
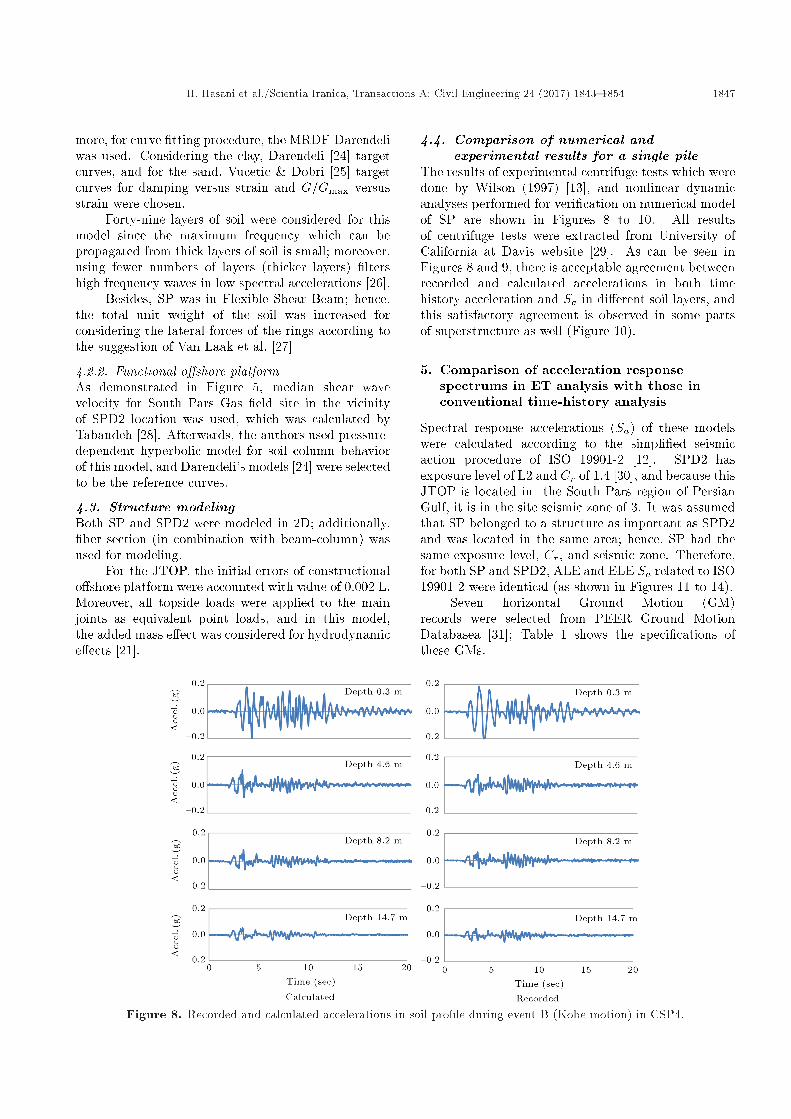
The results of experimental centrifuge tests which weredone by Wilson (1997) [13], and nonlinear dynamicanalyses performed for veri�cation on numerical modelof SP are shown in Figures 8 to 10. All resultsof centrifuge tests were extracted from University ofCalifornia at Davis website [29]. As can be seen inFigures 8 and 9, there is acceptable agreement betweenrecorded and calculated accelerations in both timehistory acceleration and Sa in di�erent soil layers, andthis satisfactory agreement is observed in some partsof superstructure as well (Figure 10).
5. Comparison of acceleration responsespectrums in ET analysis with those inconventional time-history analysis
Spectral response accelerations (Sa) of these modelswere calculated according to the simpli�ed seismicaction procedure of ISO 19901-2 [12]. SPD2 hasexposure level of L2 and Cr of 1.4 [30], and because thisJTOP is located in the South Pars region of PersianGulf, it is in the site seismic zone of 3. It was assumedthat SP belonged to a structure as important as SPD2and was located in the same area; hence, SP had thesame exposure level, Cr, and seismic zone. Therefore,for both SP and SPD2, ALE and ELE Sa related to ISO19901-2 were identical (as shown in Figures 11 to 14).
Seven horizontal Ground Motion (GM)records were selected from PEER Ground MotionDatabasea [31]; Table 1 shows the speci�cations ofthese GMs.
Figure 8. Recorded and calculated accelerations in soil pro�le during event B (Kobe motion) in CSP4.

1848 H. Hasani et al./Scientia Iranica, Transactions A: Civil Engineering 24 (2017) 1843{1854
Figure 9. ARS (5% damping) in soil pro�le.
Figure 10. Accelerations and ARS (5% damping) for pile head and superstructure of structure SP during event B (Kobemotion) in CSP4 test.
Figure 11. ELE ARS of ISO 19901 code, average GM,and ETAF for SP.
For scaling of these records, the method of ISO19901-2 Code [12] was used. According to this method,standard GM is scaled so that scaled GM has the sameSa with Sa related to ISO in fundamental period (forSP 1.04 sec and for SPD2 1.93 sec); the scaling factors
Figure 12. ALE ARS of ISO 19901 code, average GM,and ETAF for SP.
which were obtained by this method can be seen inTable 2.
According to the ET methodology, the targettime in the ETAF should be found so that the ac-celeration spectra of each ETAF until target time

H. Hasani et al./Scientia Iranica, Transactions A: Civil Engineering 24 (2017) 1843{1854 1849
Table 1. Speci�cations of GMs.
NGA# Event Year Station Magnitude VS30 (m/s)788 Loma Prieta 1989 Piedmont Jr High 6.93 895.4789 Loma Prieta 1989 Point Bonita 6.93 1315.9891 Landers 1992 Silent Valley-Poppet Flat 7.28 684.9897 Landers 1992 Twenty nine Palms 7.28 684.9946 Northridge-01 1994 Antelope Buttes 6.69 821.71041 Northridge-01 1994 Mt Wilson-CIT Seis Sta 6.69 821.71096 Northridge-01 1994 Wrightwood-Jackson Flat 6.69 821.7
Table 2. Scale factors of GMs for SP and SPD2.
NGA#
SP SPD2ELEscalefactor
ALEscalefactor
ELEscalefactor
ALEscalefactor
788 1.99 2.78 2.028 2.839789 0.84 1.18 0.850 1.190891 8.45 11.83 8.310 11.634897 8.45 11.84 8.244 11.542946 3.90 5.46 3.880 5.4321041 4.89 6.85 4.882 6.8331096 2.60 3.65 2.484 3.478
Figure 13. ELE ARS of ISO 19901 code, average GM,and ETAF for SPD2.
become compatible with the average spectrum of GMsbetween 0:2Tn and 1:5Tn. To calculate the time,we considered the linear relation between accelera-tion response spectrum and recorded length in theET method. In the initial calculation, the target
Figure 14. ALE ARS of ISO 19901 code, average GM,and ETAF for SPD2.
time was obtained as short amount of time, whichaccording to Mashayekhi and Estekanchi [32], targettime cannot satisfy e�ective number of cycles in ETanalysis. Thus, the ETAF was scaled by coe�cientof 0.25; target times in which the ET spectrum hadcompatible area with ELE and ALE are displayed inTable 3.
The average of seven scaled records, the averageof three ETAF, and Sa related to ELE level for SP areshown in Figure 11, and those for SPD2 are shown inFigure 13. Aforementioned graphs related to the ALElevel of SP are illustrated in Figure 12, and those forSPD2 are shown in Figure 14.
As shown in Figures 11 to 14, ISO scaling methodprovides a reasonable match in range of 0:2Tn to 1:5Tnfor these long period structures; moreover, the averageof ETAFs has good match with the average of realGMs. According to this match, it is expected thatthe ET method can estimate the responses of thesestructures in di�erent levels.
Table 3. Equivalent time of hazard level of ELE and ALE for ET records.
Equivalent time for di�erent hazard Averagelevels (s) time
ETA20en01 ETA20en02 ETA20en03
SP ALE 17.70 17.70 17.00 17.47ELE 12.60 12.40 13.80 12.93
SPD2 ALE 12.5 13 14 13.17ELE 8.9 9.11 8.23 8.75

1850 H. Hasani et al./Scientia Iranica, Transactions A: Civil Engineering 24 (2017) 1843{1854
Figure 15. Average inter-story drift ratios of SP under GMs and ET accelerograms.
6. Results and discussion
For investigating the accuracy and proximity of theestimation in the ET method with the selected records,we compared the results of average ET analysis ob-tained from the ETA20en01-3 with those of structuressubjected to the GMs mentioned in Table 1. Thebehaviors of the SP and SPD2 were evaluated underGMs and ET acceloregrams, and responses are shownin Figures 15 and 16.
As shown in Figures 15 and 16, the ET es-timations of the response of structures with deepfoundations are satisfactory. These �gures indicateappropriate estimation of ET method with mean di�er-ence of 10% and the max di�erence of 20% comparedto average results of GMs. It is noteworthy that theresults of ET method are well within the range ofaverage results of real earthquake records, consideringa standard deviation. Moreover, this lack of exactmatch is partially caused due to the random natureof acceleration functions, and this is also true in thecase of GMs.
The results of ET analysis are presented by
Figure 16. Average inter-story drift ratio of SPD2 underGMs and ET accelerograms.
increasing ET curves where they are coordinated ateach time value, t, corresponding to the maximumabsolute value of the considered variables from t =0 to the desired time. As a result of statisticalcharacteristics of the ET analysis, the ET curves areusually serrated. To solve this problem, we used amoving average procedure to reduce the serrated natureof ET curves. To obtain the �nal ET curves, the ETcurves obtained from three acceleration functions were�rst averaged; afterwards, the procedure of movingaverage was applied to serrated ET curves. Figure 17shows the performance curve from the ET method forSP, where EDP is the drift ratio; moreover, Figures 18to 21 illustrate the performance curve by the ETmethod for SPD2.
As mentioned earlier, one of the advantages of ETmethod is that it can show simpli�ed results. Hence,we chose more than one EDP for the JTOP. Becausethe structure of platform is a pile-supported system,we used some EDPs considered for these features.The �rst EDP was the maximum inter-level drift ratioby considering the pile, and the performance curveis shown in Figure 18. The second EDP was themaximum pile drift ratio; this EDP occurred witha particular mechanism, where the height of drift is
Figure 17. SP performance curve for EDP of drift ratio.

H. Hasani et al./Scientia Iranica, Transactions A: Civil Engineering 24 (2017) 1843{1854 1851
Figure 18. SPD2 performance curve for EDP ofmaximum inter-level drift ratio.
Figure 19. SPD2 performance curve for EDP ofmaximum pile drift ratio.
between two hinges: The �rst hinge occurs at the depthwhere the �rst plastic hinge forms due to the maximummoment. The second hinge occurs just below the �rstlevel or at the mud line level. The performance curveof this EDP is shown in Figure 19. The third EDPwas the maximum drift ratio which is the max of twopreviously EDPs, and the performance curve is shownin Figure 20. The fourth EDP which was only for pileis the maximum pile displacement performance curve,as shown in Figure 21 [33].
As is obvious from Figures 18 to 21, accordingto what is alluded to for the bene�ts of ET method,ET method not only shows results in a simpler mode,but also facilitates comparison between the EDPs. Inthis case, the EDP of maximum pile displacement wasdominant EDP within the EDPs because in this EDP,the increasing ET curve crossed ELE limit sooner thanother EDPs.
Moreover, it can be concluded that this structurecannot satisfy ELE event since not only maximumpile displacement, but also other EDPs crossed ELElimit before equivalent time for ELE in the graphs.However, SPD2 ful�lled ALE event because none of
Figure 20. SPD2 performance curve for EDP ofmaximum drift ratio.
Figure 21. SPD2 performance curve for EDP ofmaximum pile displacement.
the increasing ET curves crossed ALE limit beforeequivalent time for ALE limit.
7. Conclusion
In this paper, we investigated application of ETmethod through nonlinear seismic analysis of o�shorepile supported systems, and responses of these struc-tures under grounds motions and ETAF were com-pared. The following conclusions can be drawn:
1. The drift ratios of ET analyses for both the singlepile and the jacket-type o�shore platform were com-pared well with those from GMs in these structures,and the results indicate a proper approximation ofET method compared to conventional time-historymethod;
2. Arti�cial acceleration functions of ET method per-formed reliably in cases involving deep soils andpile supported structures in this study. ETAFs pro-duced acceptable results compared to real groundmotions while passing di�erent soil layers;

1852 H. Hasani et al./Scientia Iranica, Transactions A: Civil Engineering 24 (2017) 1843{1854
3. Di�erent EDPs for the JTOP were considered, andit is shown that ET method provides simpli�edpresentation of multi-level seismic evaluation sothat results can be compared in di�erent EDPsconveniently;
4. In this study, due to the presence of piles, eachrecord had to be applied at the bottom of thepile system, and pass through di�erent layersof soil. This requirement heavily increases thecomputational demand required for conventionalnonlinear time-history analysis. By applying ETmethod, this required computational demand canbe considerably reduced.
Nomenclature
� An optimization weighting parameter�0m Mean e�ective stress�0vc Vertical e�ective stressag ET acceleration function in vector
formALE Abnormal Level EarthquakeARS Acceleration Response SpectraBNWF Beam on Nonlinear Winkler
FoundationCr Seismic reserve capacity factorCu Coe�cient of uniformitycu Undrained shear strengthD50 Median particle size diameterDr Relative densityEDP Engineering Demand ParameterEI Flexural sti�nessELE Extreme Level EarthquakeEq EquivalentET Endurance TimeETAF Endurance Time Acceleration FunctionF (ag) Optimization target functionG Shear modulusGmax Maximum shear modulusGM Ground MotionJTOP Jacket Type O�shore PlatformK0 Coe�cient of lateral stress at restK2;max parameter relating Gmax and �0m and a
function of density or void ratioL Length of memberLL Liquid LimitMRDF Modulus reduction curve and damping
curve including reduction factorPatm Atmospheric pressurePEER Paci�c earthquake research center
PI Plasticity IndexSa Spectral accelerationSa(T; t) Acceleration response for period T at
time tSac(T ) Code acceleration response for period
TSaT (T; t) Target acceleration response at time tSu(T; t) Displacement response for period T at
time tSuT (T; t) Target displacement response at time tSP Single PileT Period of free vibrationtTarget Target timeTmax Maximum free vibration period (sec)
to be considered in the optimizationtmax Time corresponding to the end of
acceleration functionTn Fundamental period of structure
References
1. Seif, M.S., Mehdigholi, H., Estekanchi, H.E. andDastan, M.A. \Evaluation of seismic behavior of �xedo�shore platforms with endurance time method", In-ternational Journal of Maritime Technology, 15, pp.97-103 (2012).
2. Estekanchi, H.E., Vafai, A. and Sadeghazar, M. \En-durance time method for seismic analysis and design ofstructures", Scientia Iranica, 11, pp. 361-370. (2004).
3. Estekanchi, H.E., Riahi, H.T. and Vafai, A. \Applica-tion of endurance time method in seismic assessmentof steel frames", Engineering Structures, 33, pp. 2535-2546 (2011).
4. Riahi, H.T., Estekanchi, H.E. and Boroujeni, S.S.\Application of endurance time method in nonlinearseismic analysis of steel frames", Procedia Engineering,14, pp. 3237-3244 (2011).
5. Valamanesh, V., Estekanchi, H.E., Vafai, A. andGhaemian, M. \Application of the endurance timemethod in seismic analysis of concrete gravity dams",Scientia Iranica, 18, pp. 326-337 (2011).
6. Alembagheri, M. and Estekanchi, H.E. \Seismic assess-ment of unanchored steel storage tanks by endurancetime method", Earthquake Engineering and Engineer-ing Vibration, 10, pp. 591-603 (2011).
7. Estekanchi, H.E. and Alembagheri, M. \Seismic anal-ysis of steel liquid storage tanks by endurance timemethod", Thin-Walled Structures, 50, pp. 14-23(2012).
8. Tavazo, H., Estekanchi, H.E. and Kaldi, P. \Endurancetime method in the linear seismic analysis of shellstructures", International Journal of Civil Engineer-ing, 10, pp. 169-178 (2012).
H. Hasani et al./Scientia Iranica, Transactions A: Civil Engineering 24 (2017) 1843{1854 1853
9. Boulanger, R., Curras, C., Kutter, B., Wilson, D.and Abghari, A. \Seismic soil-pile structure interactionexperiments and analyses", Journal of Geotechnicaland Geoenvironmental Engineering, 125, pp. 750-759(1999).
10. Mazzoni, S., McKenna, F., Scott, M.H. and Fenves,G.L. OpenSees Command Language Manual (2007).
11. Hashash, Y.M.A., DEEPSOIL V 5.0, User Manualand Tutorial, 2002-2011, University of Illinois atUrbana-Champaign (2011).
12. ISO. \Petroleum and natural gas industries-speci�c re-quirements for o�shore structures (ISO 19901-2)", Part2, Seismic Design Procedures and Criteria, Switzer-land, International Standard Organization (2004).
13. Wilson, D.W., Boulanger, R.W. and Kutter, B.L.\Soil-pile-superstructure interaction at soft or lique-�able soil sites { centrifuge data report for CSP4,UCD/CGMDR-97/05", Center for Geotechnical Mod-eling, Department of Civil and Environmental Engi-neering, University of California, Davis, CA (1997).
14. Wilson, D.W., Soil-Pile-Superstructure Interaction inLiquefying Sand and Soft Clay, UCD/CGM-98/04,University of California, Davis (1998).
15. Wang, S., Kutter, B.L., Chacko, M.J., Wilson, D.W.,Boulanger, R.W. and Abghari, A. \Nonlinear seismicsoil-pile structure interaction", Earthquake Spectra,14, pp. 377-396 (1998).
16. Matlock, H., Bryant, L.M. and Foo, S.H.C. \Simula-tion of lateral pile behavior under earthquake motion",Earthquake Engineering and Soil Dynamics, Pasadena,CA, American Society of Civil Engineers, pp. 600-19(1978).
17. Penzien, J., Sche�ey, C.F. and Parmelee, R.A. \Seis-mic analysis of bridges on long pile", Journal ofthe Engineering Mechanics Division, 90, pp. 223-254(1964).
18. Kagawa, T. and Kraft, L.M. \Seismic p � y responsesof exible piles", Journal of the Geotechnical Engineer-ing Division, 106, pp. 899-918 (1980).
19. Nogami, T., Otani, J., Konagai, K. and Chen, H.\Nonlinear soil-pile interaction model for dynamiclateral motion", Journal of Geotechnical Engineering,118, pp. 89-106 (1992).
20. Naggar, M.H.E. and Bentley, K.J. \Dynamic analysisfor laterally loaded piles and dynamic p-y curves",Canadian Geotechnical Journal, 37, pp. 1166-1183(2000).
21. API., Recommended Practice for Planning, Designingand Constructing Fixed O�shore Platforms{WorkingStress Design (API RP2A-WSD), Washington (DC),American Petroleum Institute (2005).
22. Seed, H.B. and Idriss, I.M., Soil Moduli and DampingFactors for Dynamic Response Analyses, In Earth-quake Engineering Research Center, EERC 70-10:College of Engineering, University of California (1970).
23. Phillips, C. and Hashash, Y.M.A. \Damping formu-lation for nonlinear 1D site response analyses", SoilDynamics and Earthquake Engineering, 29, pp. 1143-58 (2009).
24. Darendeli, M.B. Development of a New Family ofNormalized Modulus Reduction and Material DampingCurves, University of Texas at Austin (2001).
25. Vucetic, M. and Dobry, R. \E�ect of soil plasticity oncyclic response", Journal of Geotechnical Engineering,117, pp. 89-107 (1991).
26. Stewart, J.P., Benchmarking of Nonlinear Geotech-nical Ground Response Analysis Procedures, Paci�cEarthquake Engineering Research Center (2008).
27. Van Laak, P.A., Taboada, V.M., Dobry, R. and El-gamal, A.-W. \Earthquake centrifuge modeling usinga laminar box", In Dynamic Geotechnical Testing II.ASTM Special Technical Publication: ASTM STP1213, p. 15 (1994).
28. Tabandeh, S.A., Seismic Assessment of Fixed JacketType O�shore Platforms - Special Attention to RecordSelection and Probabilistic Nonlinear Site ResponseAnalysis, Sharif University of Technology (2010).
29. http://cgm.engr.ucdavis.edu/, Center for Geotechni-cal Modeling at University of California Davis.
30. ISO, Petroleum and Natural Gas Industries { FixedSteel O�shore Structures (ISO 19902), Switzerland,International Standard Organization (2007).
31. Paci�c Earthquake Engineering Research Center,PEER Ground Motion Database, Beta Version.http://cgm.engr.ucdavis.edu/
32. Mashayekhi, M. and Estekanchi, H.E. \Signi�cance ofe�ective number of cycles in endurance time analysis",Asian Journal of Civil Engineering (Building andHousing), 13, pp. 647-57 (2012).
33. Ebrahimian, H., Assessment of Existing Jacket-TypeO�shore Platforms in the Persian Gulf Region forService Life Extension on Operative Conditions, SharifUniversity of Technology (2012).
Biographies
Hamed Hasani received his MS degree from SharifUniversity of Technology, Tehran, Iran. His researchinterests include earthquake engineering, o�shorestructures, and soil-pile-superstructure interaction.
Ali Akbar Golafshani graduated in 1978 from UtahState University, Logan, USA with a BS degree. Hereceived his MS and PhD degrees in the �eld ofStructural Mechanics from the University of California,Berkeley, USA in 1979 and 1981. Between 1982 and2016, he had cooperation with Sharif University ofTechnology as a Professor in the Department of CivilEngineering. He passed away in April 2016.
Homayoon Estekanchi is a Professor of Civil En-

1854 H. Hasani et al./Scientia Iranica, Transactions A: Civil Engineering 24 (2017) 1843{1854
gineering at Sharif University of Technology (SUT),Tehran, Iran. He received his PhD degree in CivilEngineering from SUT in 1997 and has been a facultymember at SUT since then. He is a member of IranianConstruction Engineers Organization, ASCE, Iranian
Inventors Association, and several other professionalassociations. His research interests include a broadarea of topics in structural and earthquake engineeringwith a special focus on the design of tall buildings andindustrial structures.