Web Service Help Guide - Docmail: Hybrid Mail Print and Post just 35p!
Seismic Interpretation Report
SS03 2D (T/35P) Seismic Survey
Southern Australia Exploration
May 2006
Table of Contents INTRODUCTION ..................................................................................................................................2 PERMIT HISTORY...............................................................................................................................2 EXPLORATION HISTORY.................................................................................................................3 GEOLOGY AND HYDROCARBON PROSPECTIVITY .................................................................3 DISCUSSION OF SEISMIC RECORD QUALITY............................................................................4 SEISMIC MAPPING .............................................................................................................................4
AREA AND DATA MAPPED ....................................................................................................................4 INTERPRETATION METHODOLOGY ........................................................................................................4 HORIZONS INTERPRETED.......................................................................................................................4 DEPTH CONVERSION .............................................................................................................................4 STRUCTURE MAPS PREPARED ...............................................................................................................5
PLAY TYPES .........................................................................................................................................5 LEADS AND PROSPECTS...................................................................................................................5 CONCLUSIONS.....................................................................................................................................5 FIGURES ................................................................................................................................................6
SURVEY LOCATION MAP.......................................................................................................................6 DATA LOCATION MAP...........................................................................................................................7 STRATIGRAPHIC CHART ........................................................................................................................8 SYNTHETIC SEISMOGRAMS....................................................................................................................9 INTERPRETED SEISMIC SECTIONS ........................................................................................................10
ENCLOSURES - MAPS OF KEY HORIZONS................................................................................11
SS03 2D T35P Seismic Interpretation Report_draft.doc Page 1 of 12
Introduction The SS03 Seismic Survey was acquired by Santos in 2003 as part of the work commitment for the first permit year. Acquisition was completed in November 2003, using PGS Exploration A/S research vessel Orient Explorer. Processing was undertaken by Robertson Research Australia and was completed in May 2004.
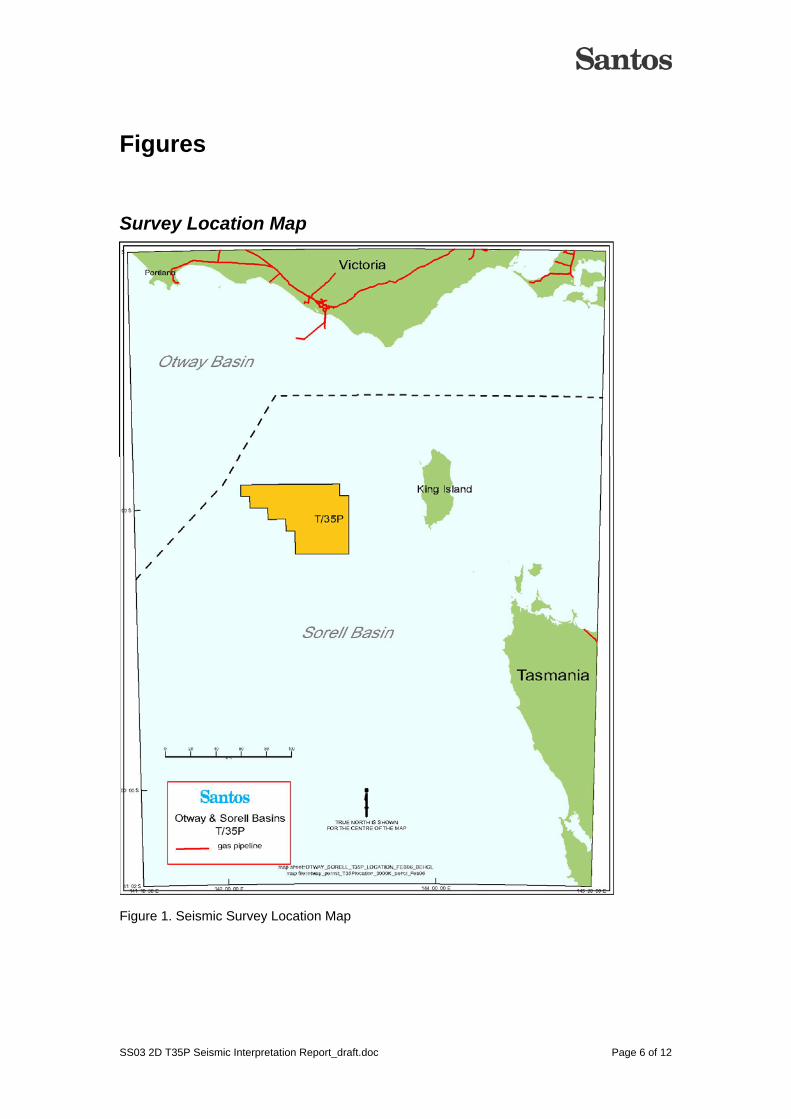
The SS03 2D seismic survey consisted of 31 lines, totalling 1336 km of 2D seismic, over the T/35P exploration permit (Figure 1 & 2). Robertson Research found that water bottom profiles were smooth along dip, but undulating along strike. All processing parameters that were applied took into account the changing water bottom (300 – 4000ms, majority of water bottom times greater than 1000ms). The survey was focused primarily over the Brandt lead.
Permit History Exploration Permit T/35P in the Otway Basin was awarded to Santos Ltd and Unocal South Australia Pty Ltd on 30 July 2003 for an initial term of 6 years (Figure 1).
In August 2005 Chevron Texaco merged with Unocal, taking on their interest through the subsidiary Chevron Australia P/L.
In February 2006 Mittwell Energy Resources PL joined the partnership.
The permit is assessed to contain 50 graticular blocks covering an area of approximately 3285 km2 (GDA).
Santos Ltd is Operator of the Permit. The current interest holders in the permit are:
Company Percentage Interest
Santos Offshore Pty Ltd 37.5%
Chevron Australia Pty Ltd 37.5%
Mittwell Energy Resources PL 25%
The work program for the primary commitment (Years 1 to 3) and the secondary contingent term (Years 4 to 6) is set out in the following table:
Year Work Requirements
1 1,276 km 2D seismic survey
2 G & G studies
3 G & G studies & environmental assessment
4 410 km2 of 3D seismic data
5 G & G studies & detailed well design
6 one well
SS03 2D T35P Seismic Interpretation Report_draft.doc Page 2 of 12
Exploration History Described below are the results of the offshore wells closest to the T/35P exploration permit. Well completion reports issued by the Operator and the updated interpretation of seismic data provide the primary source of information for detailing the exploration history. No wells to date have been drilled on the permit.
Prawn-A1 (Esso, 1967). Intersected 712m of Waarre Formation equivalent. Measured porosities in the sandstone exceeded 20% with permeabilities up to 235 mD.
Clam-1 (Esso, 1969). Tested structural closure of the basal Tertiary and updip pinchout of Cretaceous sediments against the Clam High. Good reservoir sandstones with porosities up to 20% were intersected. Clam-1 reached a depth of only 1592m, intersecting Devonian conglomerates on Pre-Cambrian metamorphic basement. The penetrated sedimentary section is immature for hydrocarbon generation.
Whelk-1 (Esso, 1970). Drilled an anticlinal closure 120 km north of Clam in the southern Otway Basin to test anticipated Waarre Formation sandstones with good reservoir characteristics. Although 94m of Waarre Sandstone was intersected, top seal (Belfast Mudstone) lithologies were not developed.
Thylacine-1 (Origin, 2001). Successfully tested a mapped Waarre Formation closure, with associated amplitude anomaly. It encountered gas within the Thylacine/Flaxman/Waarre section.
Geographe-1 (Origin, 2001). This well was a successful test of a mapped Waarre Formation closure, with associated amplitude anomaly. It encountered gas within the Thylacine/Flaxman/Waarre section.
Geographe North-1 (Origin, 2001). This well drilled as a follow-up test of Geographe-1 was a dry hole (no full stack amplitude anomaly).
Thylacine-2 (Origin, 2001). This well was an appraisal to follow up success at Thylacine-1.
Geology and Hydrocarbon Prospectivity The Sorell Basin formed during oblique rifting between the Australian and Antarctic continents in the Late Cretaceous. While relatively open ocean conditions existed to the north and west in the Otway Basin, a restricted marine embayment was formed in the Sorell region, bounded to the southeast by a land-bridge between the two continents, which did not separate until the Eocene.
Late Cretaceous reservoir sandstones, belonging to the Waarre Formation, Flaxman Formation and Thylacine Sandstone Member (Figure 3), form the main productive zones within fields such as Casino (Santos-operated), Minerva, La Bella, Thylacine and Geographe, located north of the deep water acreage trend. These sandstones exhibit excellent reservoir quality with average log porosity in the range of 15-28% and permeabilities of up to 8 Darcies.
These sandstones are mapped extending southwards into Santos' deepwater permits. Deposition of coarse-grained siliciclastics in the Turonian-Santonian is associated with periodic fluvio-deltaic pulses into an overall upwards-deepening/fining section (Belfast Mudstone), providing an effective reservoir-seal couplet. Regional regression in the Campanian led to renewed coarse-grained, fluvio-deltaic input to the basin as the Paaratte and Timboon sandstones. Potential sealing sequences of the Skull Creek and Timboon mudstones and the Massacre Shale are observed to thicken into the basin. Mild structural inversion in the latest Cretaceous was followed by rapid subsidence and transgression resulting in retrogradation of the deltaic systems and deposition of the Wangerrip Group in the
SS03 2D T35P Seismic Interpretation Report_draft.doc Page 3 of 12
Palaeogene. Eventually the marginal sedimentary systems were drowned and, in association with the opening of the seaway in the late Eocene and subsequent formation of the Circum-Antarctic current, deposition came to be dominated by cool-water carbonates that persist through to the present day.
Six offshore discoveries have been made to date proving in excess of 1.5 TCF recoverable gas. These discoveries have been full to spill, with liquids content increasing generally from north to south. Hydrocarbon charge in the basin is considered to come from Albian-aged, Eumeralla Formation source rocks.
Discussion of Seismic Record Quality Seismic data is of good to adequate quality down to the top of the Belfast Formation. Below this point, the noise level becomes higher and imaging is much more difficult. In many cases, below the Belfast the seismic data quality is substantially poorer than the multiclient data.
In the north of the permit a laterally extensive volcanic body also reduces the quality of the seismic data in its vicinity (Figure 8). This increases the difficulty of correlating from the wells to the north.
Seismic Mapping
Area and Data Mapped The new SS03 seismic data infilled the existing (Fugro) multi-client DS02 data (Figure 2). This SS03 data was spread across the permit, covering several leads identified during gazettal evaluation, with a higher line density over the Brandt lead. The new data was incorporated into the existing interpretation of the multi-client DS02 seismic data.
Interpretation Methodology Geoframe IESX was used in the structural interpretation of this seismic data. Well synthetics were created in Geoframe for the Thylacine, Geographe, Prawn (Figure 4), Whelk (Figure 5) and Clam wells, and the correlations taken into T/35P using the DS02 multi-client and older regional seismic lines. Less continuous seismic events such as the Thylacine were interpreted by bracketing/constraining the formation with more consistent chronostratigraphic horizons such as the Belfast and Waarre sequence boundaries (K90 & K77) and using the typical character of the formation (eg. Thylacine deposited on an unconformity).
Seismic interpretation was undertaken using the all-offset pre-stack time migrated volumes. The new SS03 data was interpreted in conjunction with the multi-client DS02 data as well as various other regional lines required to tie the seismic to the wells.
Horizons Interpreted Key horizons interpreted include the water bottom (WB), top Wangerrip Group (T20), base Tertiary (T1), top Belfast (K90), top Thylacine (K84LS) and top Waarre (K77). Other horizons such as the top Otway group and basement have been mapped locally, but are hard to correlate on a regional basis.
Depth Conversion Depth conversion was undertaken in Petrosys using constant interval velocities over the WB-T20, T20-K90 and K90-K84LS intervals. More detailed depth conversion will need to be undertaken prior to drilling of any of the prospects.
SS03 2D T35P Seismic Interpretation Report_draft.doc Page 4 of 12
Structure Maps Prepared Structure maps prepared include the Water Bottom (WB), Base Tertiary carbonates (T20T) Top Thylacine (K84LS) and Top Waarre (K77) depth maps (Enclosures 1-4).
Play Types The play types targeted in this permit are largely Cretaceous in age, with late-Cretaceous reservoirs (Thylacine/Flaxmans/Waarre equivalent) and top seals (Belfast or intra-formational shales), with hydrocarbons sourced from the Eumeralla or Waarre coals, within faulted structural traps. These plays have been proven in the Otway Basin fields to the north.
A shallower play targeting the Paaratte Formation reservoirs has also been identified in this region. Although gas has been intersected in Paaratte reservoirs in some of the wells to the north, as yet no commercial accumulation has been discovered in this formation.
Leads and Prospects The largest lead or prospect in the permit is the Brandt Prospect, which was identified as a lead during gazettal evaluation on the multi-client DS02 seismic data (Figure 6, Enclosure 4). Part of the SS03 seismic infill was designed to further delineate this lead. Brandt is a large faulted anticline, targeting Waarre equivalent reservoir within four-way dip closure.
The Florey lead in the northeast of the permit targets the Thylacine-equivalent reservoir, but is thought to be a low-side fault closure (Figure 7, Enclosure 3). This has an amplitude anomaly which roughly conforms to three-way closure against the fault. Part of this prospect extends into the neighbouring T/30P permit.
The Ormsby lead in the northwest of the permit targets the Waarre formation in a narrow horst block (faulted anticline). Unfortunately, the lead is probably not large enough to offset cost of drilling in such deep water (~2km).
The Withnall lead targets the unproven Paaratte play within a large faulted four-way dip anticline. Although there are amplitude blooms over the lead, they do not conform to structure, which increases risk that amplitude does not indicate presence of hydrocarbons.
Conclusions The SS03 seismic data is better quality than the DS02 seismic data. The main difference is higher frequency content and reduced noise in the SS03 data.
Interpretation of the SS03 seismic data and incorporation into the regional grid has led to a better understanding of the Brandt and Florey Leads, reducing the risk, although studies to address depth of burial need to be undertaken to determine its likely effect on reservoir quality.
SS03 2D T35P Seismic Interpretation Report_draft.doc Page 5 of 12
Figures
Survey Location Map
Figure 1. Seismic Survey Location Map
SS03 2D T35P Seismic Interpretation Report_draft.doc Page 6 of 12
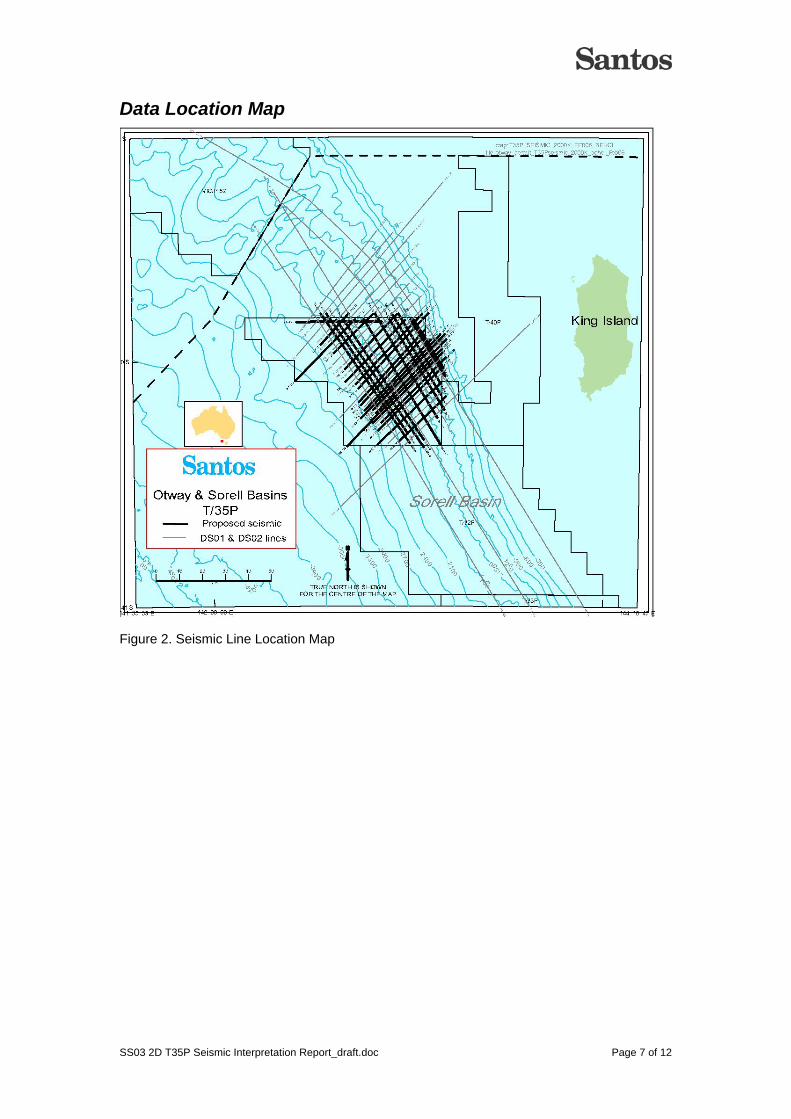
Data Location Map
Figure 2. Seismic Line Location Map
SS03 2D T35P Seismic Interpretation Report_draft.doc Page 7 of 12
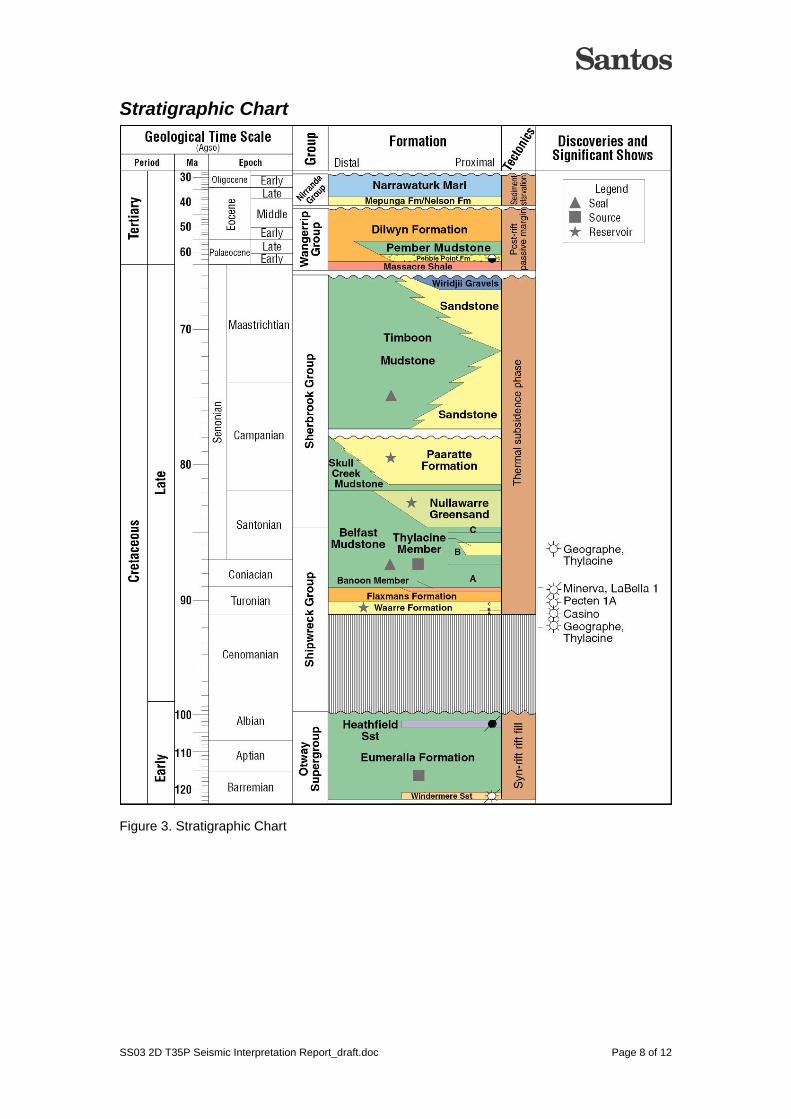
Stratigraphic Chart
Figure 3. Stratigraphic Chart
SS03 2D T35P Seismic Interpretation Report_draft.doc Page 8 of 12
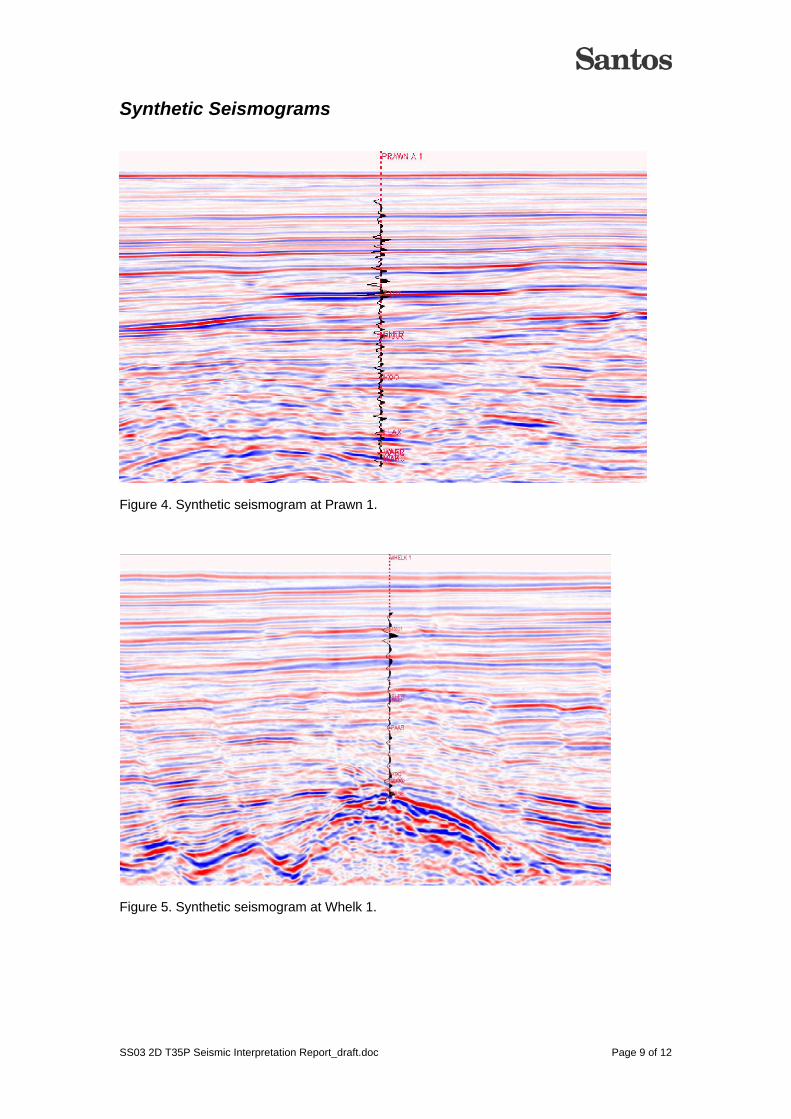
Synthetic Seismograms
Figure 4. Synthetic seismogram at Prawn 1.
Figure 5. Synthetic seismogram at Whelk 1.
SS03 2D T35P Seismic Interpretation Report_draft.doc Page 9 of 12
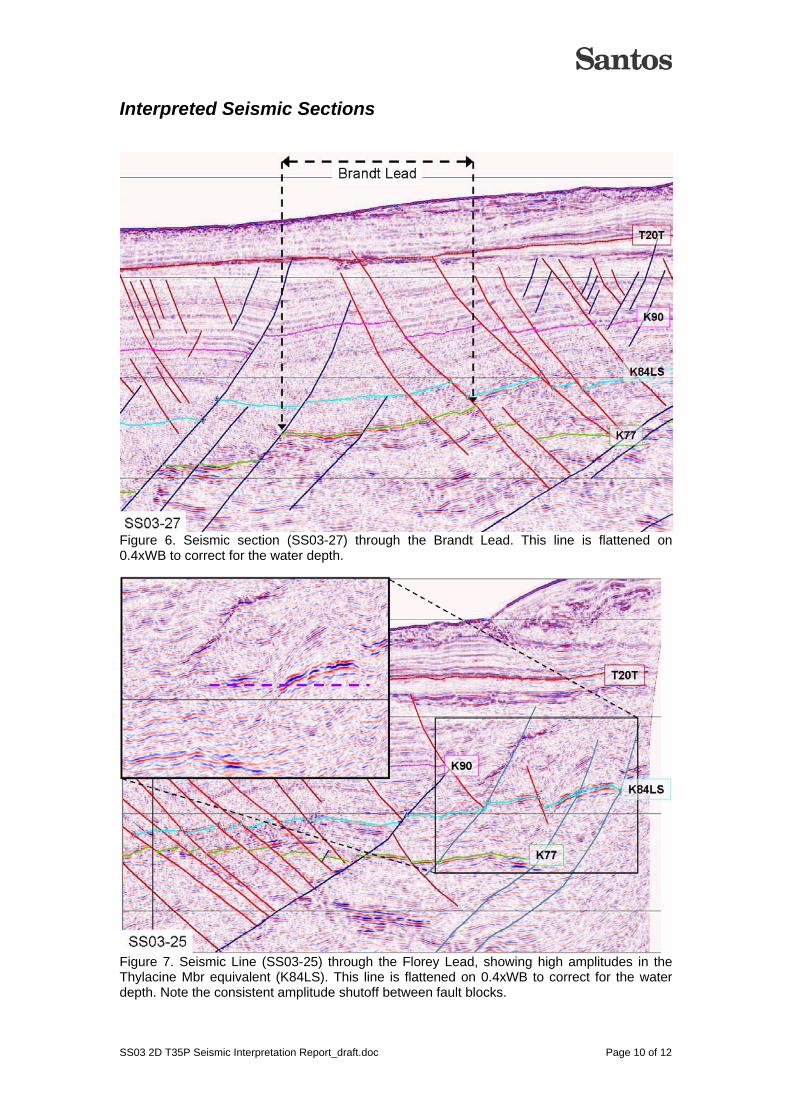
Interpreted Seismic Sections
Figure 6. Seismic section (SS03-27) through the Brandt Lead. This line is flattened on 0.4xWB to correct for the water depth.
Figure 7. Seismic Line (SS03-25) through the Florey Lead, showing high amplitudes in the Thylacine Mbr equivalent (K84LS). This line is flattened on 0.4xWB to correct for the water depth. Note the consistent amplitude shutoff between fault blocks.
SS03 2D T35P Seismic Interpretation Report_draft.doc Page 10 of 12
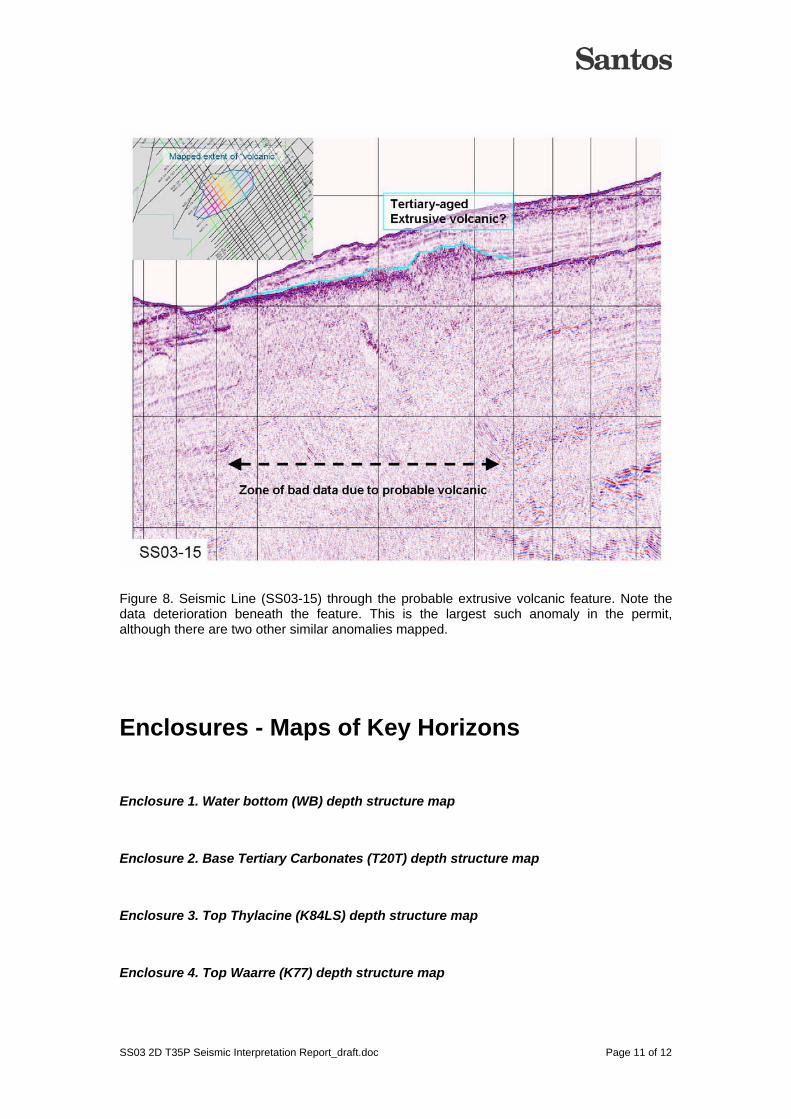
Figure 8. Seismic Line (SS03-15) through the probable extrusive volcanic feature. Note the data deterioration beneath the feature. This is the largest such anomaly in the permit, although there are two other similar anomalies mapped.
Enclosures - Maps of Key Horizons
Enclosure 1. Water bottom (WB) depth structure map
Enclosure 2. Base Tertiary Carbonates (T20T) depth structure map
Enclosure 3. Top Thylacine (K84LS) depth structure map
Enclosure 4. Top Waarre (K77) depth structure map
SS03 2D T35P Seismic Interpretation Report_draft.doc Page 11 of 12