Seismic Hazard in the Basin and Range Province,...
52
Seismic Hazard in the Basin and Range Province, U.S.A. Aasha Pancha
Transcript of Seismic Hazard in the Basin and Range Province,...

Seismic Hazard in the Basin and
Range Province, U.S.A.
Aasha Pancha

Seismic Hazard Analysis
• Earthquake occurrence rates
PLUS
• Ground motion prediction
Basin and Range Province
Reno

Faults Geodetic strain rates
Faults with slip rates
greater than 0.1 mm/yr.
nanostrain/yr

Moment Rate Comparison

Rate from historical seismicity
Time predictableSlip predictable

Moment Rate Comparison

Models to relate deformation rates
to seismic moment rates
sAMo
ksWLkWLLMo /2/2 1221
Anderson (1979)For a fault with average
geological slip rate s
For broad zones of deformation, the slip
rate can be replaced by the strain rate.

2121
min ,,Max2 WMo
kWLLMo 2212
212 WM o
21 ,2 MaxWM o
Volumetric strain in multiple directions
Savage and Simpson (1997)
Working Group CEP (1995)
Ward (1994, 1998a,b)
Anderson (1979)

Basin and Range Comparison


Catalog adequacy parameter
I suggest that when Z >1.5 km2, the
observation period in the seismicity
catalog is likely to be long enough to yield
a stable estimate of the rate.
TZ

Characterization of ground
motion amplification and
correlation with near-surface
geology at strong-motion
stations in the vicinity of Reno,
Nevada.
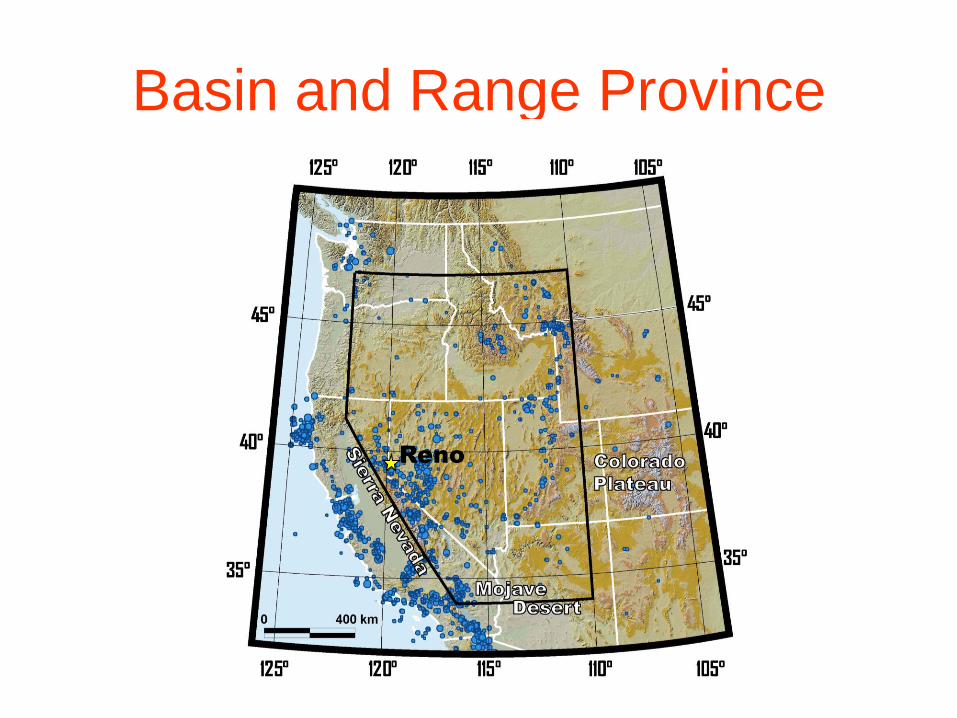
Reno Area Basin
Abbott and Louie (2000)

1. M=4.4 12/02/2000
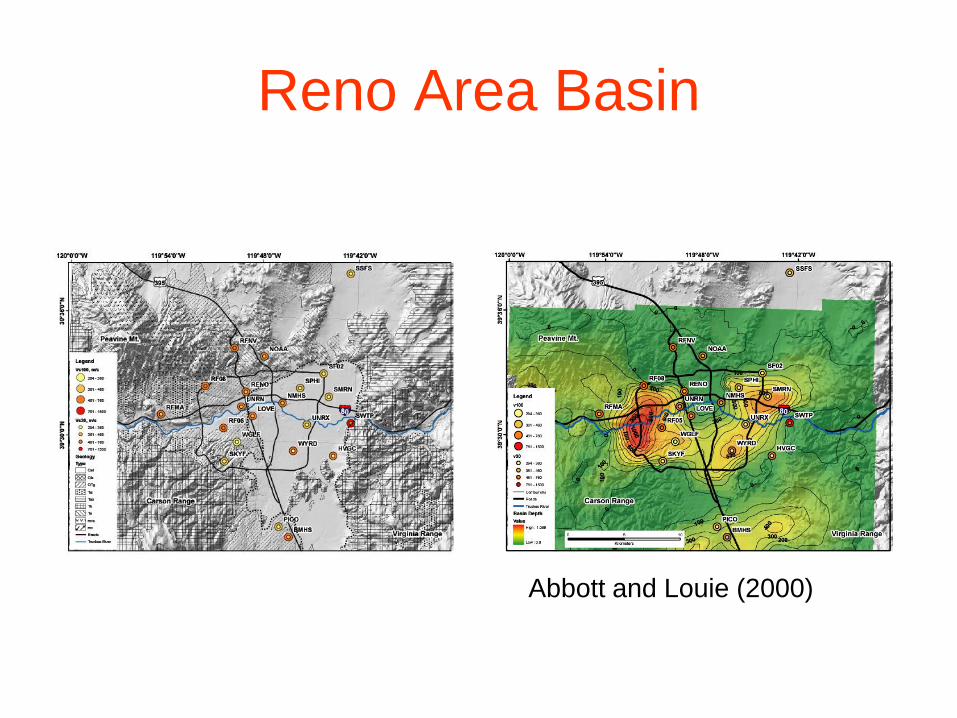
2. M=4.49 06/03/2004

1. M=4.4 12/02/2000

1. M=4.4 12/02/2000
0.2 to 0.6 Hz

1. M=4.4 12/02/2000
2. M=4.49 06/03/2004
2. M=4.49 06/03/2004

Refraction Microtremor
Propagation velocity is
frequency dependent.


Vs versus 1:250,000 geology

Vs versus 1:24,000 geology

Statistical Analysis of classifications
Ftest statistics suggest that separation of the individual velocity measurements into
geological classifications significantly reduce the variance of the data. However,
insufficient data within each classification mean that velocity ranges and correlation
with these classifications are not well determined.
Statistical evaluation of correlation of Vs measurements with geology classifications.
No. stns Std ~ No.
Groups Std Groups
Ratio of variance
Degrees of Freedom
Ftest CL¶
N Ng (N-1) (N-Ng)
Vs 30 Geology
1:24,000 scale§ 21 110.78 13 49.52 5.00 20 8 98.75 %
1:250,000 scale NBMG¥ 21 110.78 5 68.95 2.58 20 16 97.05 %
1:250,000 scale C&T# 21 110.78 5 68.86 2.59 20 16 97.08 %
Vs100 Geology
1:24,000 scale§ 21 117.10 13 51.53 5.16 20 8 98.87 %
1:250,000 scale NBMG¥ 21 117.10 5 66.34 3.12 20 16 98.76 %
1:250,000 scale C&T# 21 117.10 5 70.25 2.78 20 16 97.87 %

Vs versus soil sediment content

Empirical site response and
comparison with measured
site conditions at ANSS
sites in the Reno area

Earthquake Locations


Spatial
Variation

Insignificant correlation with basin depth
Correlation is significant at the 68% confidence level.

Basin Depth vs Travel Time
Residuals
Correlation is significant at the 98% confidence level.

Travel time residuals vs Fourier
spectral amplification
Correlation is significant at the 90% confidence level.

Correlation with Vs30 and Vs100V
s1
00
(9
8%
)
Vs
30
(9
4%
)

Spectral Amplification

Spectral Amplification

Spectral Amplification

SR
NGA models
Campbell and Bozorognia (thin dashed line);
Choi and Youngs (thin line);
Boore and Atkinson (dashed-dot line)
UULLA

Azimuthal dependence
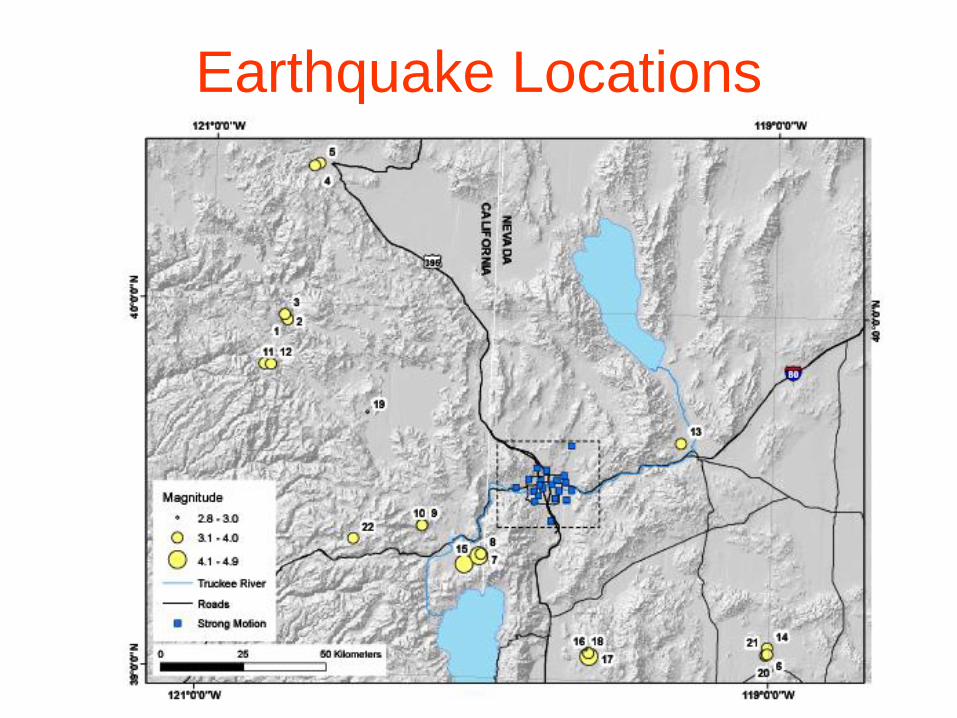
Earthquake Locations

XX X X
X
X
X

Conclusions
• Geodetic deformation has the same spatial distribution as the seismic moment release and earthquake numbers.
• Within uncertainties, the rate of historical earthquakes agrees with the rate predicted from the geodesy, and provides a reasonable estimate of future rates of activity.
• On a large scale, input to seismic hazard analysis should be consistent with geodetic deformation rates.
• Further investigation of conditions for the similarity of seismicity and geodesy is needed.

Conclusions• Rock sites are variable.
• Amplification is dependent on whether station is located within the basin. Within the basin amplification is non-uniform.
• Both near surface low velocity sediment, and the basin thickness as a whole, have an influence on ground motion amplification within the basin.
• Vs30 more useful than geology or basin depth.
• Lack of resonance peaks at many basin sites is consistent with a lack of strong impedance contrast within basin sediments.
• Ground motions are affected by azimuthal dependence of incoming waves highlighting that 3D basin effects are significant.

Publications
• Pancha, A., J. G. Anderson, J. N. Louie, A. Anooshehpoor, and G. Biasi, (2004) Data and simulation of ground motion for Reno, Nevada: Proceedings of the 13th World Conf. on Earthquake Engineering, Vancouver, B.C., Aug. 1-6, paper no. 3452.
• Pancha, A., J. G. Anderson, and C. Kreemer (2006), Comparison of seismic and geodetic scalar moment rates across the Basin and Range province, Bulletin of the Seismological Society of America, 96, 11-32, doi: 10.1785/0120040166.
• Pancha, A., J. G. Anderson, G. Biasi, A. Anooshepor, and J. N. Louie (2007). Empirical site response and comparison with measured site conditions at ANSS sites in the Reno area, submitted to the Bulletin of the Seismological Society of America, (accepted), 97-6, December 2007.
• Pancha, A., J. G. Anderson, G. Biasi, A. Anooshepor, and J. N. Louie (2007). Empirical site response and comparison with measured site conditions at ANSS sites in the Reno area, submitted to the Bulletin of the Seismological Society of America.
• Pancha, A., J. G. Anderson, J. N. Louie, S. Pullammanappallil (2007). Measurement of shallow shear wave velocities at a rock site using the ReMi technique, submitted to Soil Dynamics and Earthquake Engineering, in second revision.

Questions

• Blue = soil to rock (SR)
horizontal spectral ratios.
• Red = soil to rock (SRv)
spectral ratios of the vertical
components of motion.
• Black = horizontal to vertical
spectral ratios (HVSR) for
individual stations.
• The black dashed = ratio the
SR and SRv mean response
spectra.
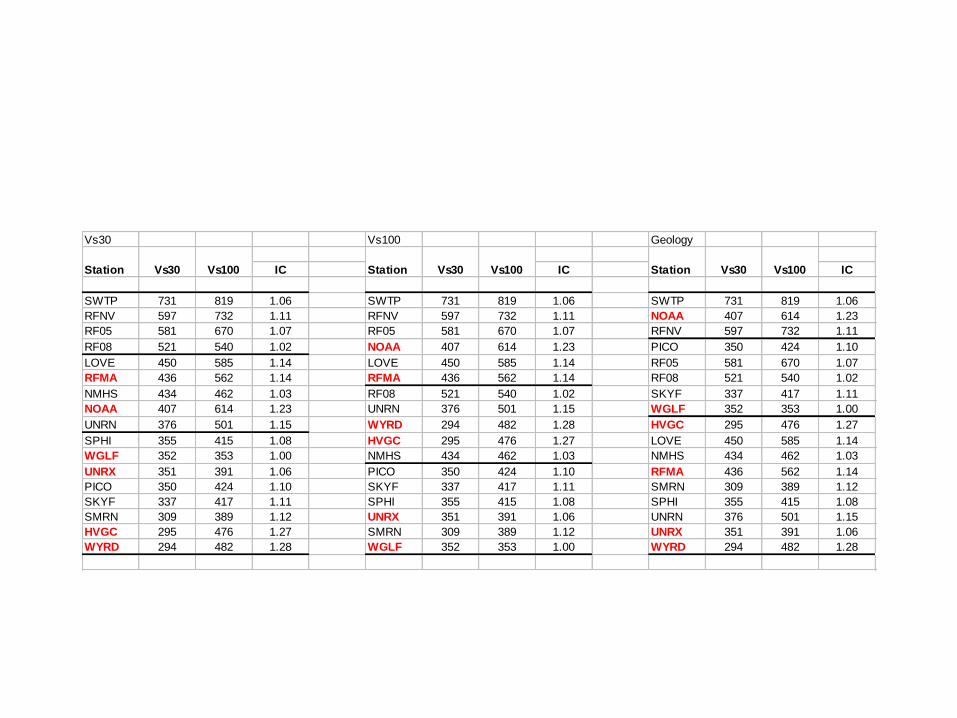
Vs30 Vs100 Geology
IC IC IC
SWTP 731 819 1.06 SWTP 731 819 1.06 SWTP 731 819 1.06
RFNV 597 732 1.11 RFNV 597 732 1.11 NOAA 407 614 1.23
RF05 581 670 1.07 RF05 581 670 1.07 RFNV 597 732 1.11
RF08 521 540 1.02 NOAA 407 614 1.23 PICO 350 424 1.10
LOVE 450 585 1.14 LOVE 450 585 1.14 RF05 581 670 1.07
RFMA 436 562 1.14 RFMA 436 562 1.14 RF08 521 540 1.02
NMHS 434 462 1.03 RF08 521 540 1.02 SKYF 337 417 1.11
NOAA 407 614 1.23 UNRN 376 501 1.15 WGLF 352 353 1.00
UNRN 376 501 1.15 WYRD 294 482 1.28 HVGC 295 476 1.27
SPHI 355 415 1.08 HVGC 295 476 1.27 LOVE 450 585 1.14
WGLF 352 353 1.00 NMHS 434 462 1.03 NMHS 434 462 1.03
UNRX 351 391 1.06 PICO 350 424 1.10 RFMA 436 562 1.14
PICO 350 424 1.10 SKYF 337 417 1.11 SMRN 309 389 1.12
SKYF 337 417 1.11 SPHI 355 415 1.08 SPHI 355 415 1.08
SMRN 309 389 1.12 UNRX 351 391 1.06 UNRN 376 501 1.15
HVGC 295 476 1.27 SMRN 309 389 1.12 UNRX 351 391 1.06
WYRD 294 482 1.28 WGLF 352 353 1.00 WYRD 294 482 1.28
Station Vs30 Vs100 Vs30 Vs100Station Vs30 Vs100 Station


Spatial Variation

ReMi

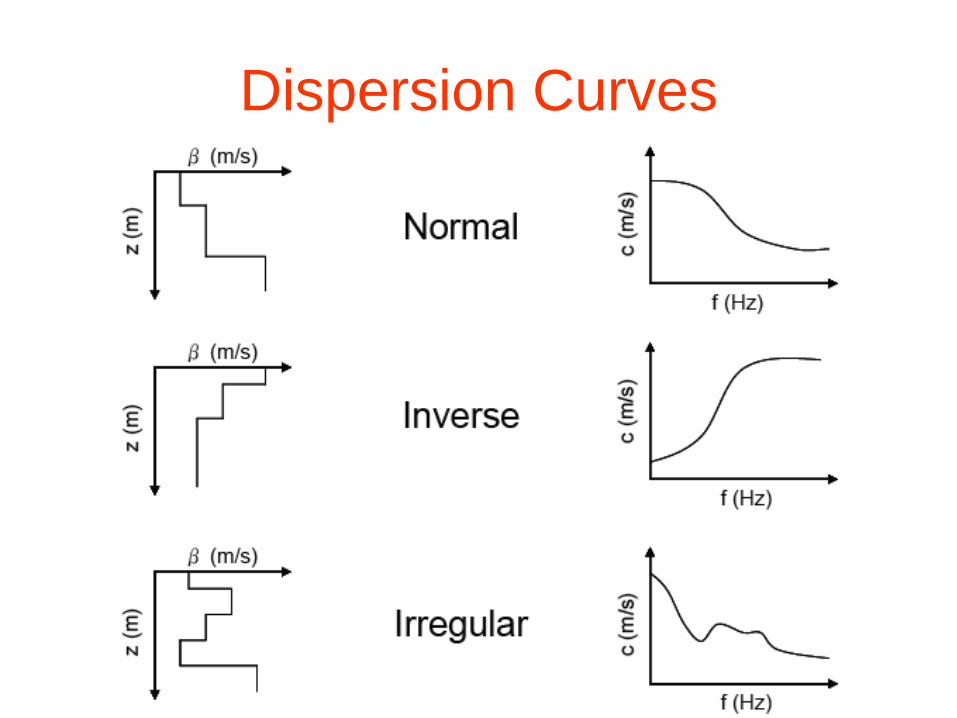
Dispersion Curves

• Start with seismogram amplitudes relative to
distance and time: (x-t).
• p-t transform (simple line integral across the
seismic record A(x,t)).
• Discrete form of the p-t transform (in practice).
• Take each A(p-t) trace and compute its FFT.
• Power spectrum
• Forward and reverse directions