Seismic Computational Analysis of CFS-NEES Building€¦ · an OSB sheathed diaphragm for the...
20
Seismic Computational Analysis of CFS-NEES Building J. Leng 1 , B.W. Schafer 2 and S.G. Buonopane 3 Abstract The objective of this paper is to explore computational modeling of a cold- formed steel framed building subjected to earthquake excitation. The selected two-story building will be subjected to full-scale motion on a shaking table in 2013 as part of the National Science Foundation funded Cold-Formed Steel – Network for Earthquake Engineering Simulation (CFS-NEES) project. The ledger-framed building employs load bearing cold-formed steel members throughout (wall, floors, and roofs) and employs OSB sheathed shear walls and an OSB sheathed diaphragm for the lateral force resisting system. Two- and three-dimensional analysis models capable of providing vibration, pushover, linear and nonlinear time history analysis are created in OpenSees. To date, the key nonlinearity investigated in the models is the characterization of the shear walls. The shear walls are either modeled as (a) elastic perfectly plastic, consistent with “state of the practice” level knowledge from AISI -S213 or (b) fully hysteretic with pinching and strength degradation based on shear walls tests conducted specifically for this building. The impact of the diaphragm stiffness is also investigated. Interaction of the lateral and gravity system, interaction of the joists, ledger, and walls, and the impact of openings on the diaphragm all remain for future work. The model is being employed to help determine the predicted experimental performance and develop key sensor targets in the response. In addition, the model will be used in incremental dynamic analysis to explore seismic performance-based design and sensitivity to model fidelity (2D, 3D, etc.) for cold-formed steel framed buildings. 1 Graduate Research Assistant, Department of Civil Engineering, Johns Hopkins University, Baltimore, MD, USA ([email protected]) 2 Professor and Chair, Department of Civil Engineering, Johns Hopkins University, Baltimore, MD, USA ([email protected]) 3 Associate Professor, Department of Civil & Environmental Engineering, Bucknell University, Lewisburg, PA ([email protected])
Transcript of Seismic Computational Analysis of CFS-NEES Building€¦ · an OSB sheathed diaphragm for the...

Seismic Computational Analysis of CFS-NEES Building
J. Leng1, B.W. Schafer
2 and S.G. Buonopane
3
Abstract
The objective of this paper is to explore computational modeling of a cold-
formed steel framed building subjected to earthquake excitation. The selected
two-story building will be subjected to full-scale motion on a shaking table in
2013 as part of the National Science Foundation funded Cold-Formed Steel –
Network for Earthquake Engineering Simulation (CFS-NEES) project. The
ledger-framed building employs load bearing cold-formed steel members
throughout (wall, floors, and roofs) and employs OSB sheathed shear walls and
an OSB sheathed diaphragm for the lateral force resisting system. Two- and
three-dimensional analysis models capable of providing vibration, pushover,
linear and nonlinear time history analysis are created in OpenSees. To date, the
key nonlinearity investigated in the models is the characterization of the shear
walls. The shear walls are either modeled as (a) elastic perfectly plastic,
consistent with “state of the practice” level knowledge from AISI-S213 or (b)
fully hysteretic with pinching and strength degradation based on shear walls
tests conducted specifically for this building. The impact of the diaphragm
stiffness is also investigated. Interaction of the lateral and gravity system,
interaction of the joists, ledger, and walls, and the impact of openings on the
diaphragm all remain for future work. The model is being employed to help
determine the predicted experimental performance and develop key sensor
targets in the response. In addition, the model will be used in incremental
dynamic analysis to explore seismic performance-based design and sensitivity to
model fidelity (2D, 3D, etc.) for cold-formed steel framed buildings.
1 Graduate Research Assistant, Department of Civil Engineering, Johns Hopkins
University, Baltimore, MD, USA ([email protected]) 2 Professor and Chair, Department of Civil Engineering, Johns Hopkins
University, Baltimore, MD, USA ([email protected]) 3 Associate Professor, Department of Civil & Environmental Engineering,
Bucknell University, Lewisburg, PA ([email protected])

Introduction
Lightweight cold-formed steel framing is a unique and effective building
solution for low and mid-rise structures, but one in which much remains to be
understood for the system to achieve its full efficiency and for modern
performance-based seismic design methods to be fully enabled. The work
presented herein is part of a National Science Foundation funded Cold-Formed
Steel – Network for Earthquake Engineering Simulation (CFS-NEES) project
that builds on single-story shear wall research to address multi-story cold-
formed steel lateral force resisting systems. A key outcome of this project is to
improve the analysis capabilities for complete cold-formed steel framed systems.
Analysis, in particular, the ability to accurately predict building deformations in
modestly, moderately, and heavily damaged states under seismic excitations is a
must for modern performance-based seismic design. However, current analysis
methods in cold-formed steel design are nearly entirely member-based.
Demands are largely based on assumed member tributary areas, end conditions
are simplified to eliminate system interactions, and capacities are based on
member-level only calculations. This approach has proven efficient and
reasonably economic for current strength-based limit-states design methods, but
it essentially cuts-off the future of system-level strength and reliability and
seismic performance-based design. These new paradigms require more
sophisticated system-level analysis models. Models that include all essential
nonlinearities and are robust enough to provide meaningful predictions in
damaged configurations are needed.
A significant focus of the seismic design community over the last decade has
been the investigation of incremental dynamic analysis results for archetype
structures. These models investigate the nonlinear dynamic performance of a
structure against a suite of earthquakes with incrementally increased spectral
acceleration. In much of this work the OpenSees (McKenna et al., 2011)
structural analysis platform has been utilized. OpenSees is primarily a
beam/frame element-based finite element code that includes a wide library of
nonlinear hysteretic material models potentially appropriate for use in nonlinear
time history analysis.
This paper provides the initial work of the CFS-NEES team to develop a
nonlinear model appropriate for predicting the lateral response of the CFS-
NEES archetype building: the CFS-NEES building. The models include
essential nonlinearities related to the shear walls and provide a platform for
investigating the full system performance, but much work remains to realize the
analysis goals necessary for robust, modern performance-based design.

Description of the CFS-NEES building
The focus of this study is a professionally designed two-story cold-formed steel
framed building, sited in Orange County, California (see Figure 1). Drawings,
details, calculations and a complete narrative of the building design are available
(Madsen et al. 2011). Gravity and lateral loads were determined per IBC (2009)
which specifies ASCE 7-05. Cold-formed steel members were sized per
American Iron and Steel Institute (AISI) Specifications (AISI-S100, -S210, -
S211). The lateral force resisting system including shear walls and diaphragms
were also designed using AISI specifications (AISI-S213).
Figure 1 Three-dimensional BIM model of the CFS-NEES building, sheathing
shown only for shear walls, south face is the long side of the building facing out
The building has a footprint of 23’0” x 49’9” and a height of 19’3”. The gravity
walls utilize an all-steel design philosophy (AISI-S211-07, AISI, 2007) and the
members selected are 600S162-054 studs on the first floor and 600S162-033
studs on the second floor (nomenclature per AISI-S200). The joists are
unblocked and utilize a continuously-braced design philosophy (AISI-S210-07,
AISI, 2007), span the short direction of the building, with 1200S250-097 joists
on the second floor and 1200S250-054 joists on the roof. The floors are ledger
framed (hung) from the walls with a 1200T200-097 ledger, or rim track, capping
the joists.
The selected lateral force resisting system uses OSB sheathed shear walls and
diaphragms. For this system the response modification coefficient R = 6.5,
overstrength factor Ω0 = 3, and deflection amplification factor Cd = 4. The Type
I shear walls use back-to-back 600S162-054 chord studs, Simpson S/HDU6
holddowns, and 7/16 in. OSB fastened 6 in. o.c.. Length and location of the
shear walls is designed to meet the base shear and architectural constraints
resulting in the configuration provided in Figure 1. The diaphragm is modeled as
flexible, per ASCE7-10, and 7/16 in. OSB 6 in. o.c. is utilized to meet the
required strength. See Madsen et al. (2011) for details.

Nonlinear OpenSees models of the CFS-NEES building shear walls
The engineering model of the lateral force resisting system in a cold-formed
steel framed building is that the primary energy dissipation occurs in designated
shear walls. Shear walls are selected based on test data from a relatively wide
body of research as compiled in AISI-S213-07. Based on the stud, sheathing,
and fastener details AISI-S213 provides the shear capacity per unit length of the
wall, vn, and in addition provides a method for calculating the deflection of the
shearwall, . Thus, the strength and stiffness (at least up to peak strength) are
available in practice. Shear wall tests, e.g., as those completed for the CFS-
NEES building as reported in Liu et al. (2012) can provide the complete
nonlinear hysteretic response, including pinching and degradation over cycles.
A variety of modeling approaches exist for capturing shear wall nonlinearities in
a model of a building. The work of van de Lindt et al. (2004 and 2010) is
notable as it summarizes much of the extensive work that has been completed in
modeling wood-framed, wood-sheathed, shear walls as well as complete
buildings. Key insights on the importance of nonlinear deformations at fastener
locations have proven remarkably useful in that context. In cold-formed steel
framing, Martínez-Martínez and Xu (2011) demonstrated that using orthotropic
plate elements for the shear walls and diaphragms can provide reasonable results
and nice efficiencies. In addition, Shamim and Rogers (2012) provide specific
modeling guidance for CFS framed shear walls utilizing steel sheet. The
approach taken here is complementary to Shamim and Rogers.
Figure 2 Illustration of shear wall model, diagonals are nonlinear
For the models investigated here the shear walls are treated, essentially, as a
single degree of freedom: shear force V versus lateral deformation . However,
it is desired that the models have a physical width equal to their actual width in
the building and that the forces in the chord studs develop similar to the typical
truss analogy. A simple way to achieve this goal is to model the shear walls as a
pin-connected panel with two diagonals as illustrated in Figure 2. The boundary
members form a mechanism and the lateral stiffness and strength derives
directly from the diagonals.

The axial force, F, in the diagonals that developed from shear force V is:
F =V / (2cosq) (2)
where 2 2cos /b b h
Correspondingly, the stress in the diagonal (truss element) is
/ / 2 cosF A V A (3)
The axial strain () in the diagonal is developed based on the lateral
displacement of the shear wall from:
e = d / l = Dcosq / b2 + h2 (4)
Thus, with the preceding equations any nonlinear shear wall V- relationship
can be expressed as a nonlinear one-dimensional - relationship for the
material in the diagonals, where:
f (5)
and function f is selected to match the desired V- behavior. The two models
explored for the shear walls are described in the following.
Elastic perfectly-plastic (EPP) state-of-the-practice shear wall model
Since strength and deflection up to peak are available in practice the most
straightforward model for a shear wall is a simple elastic perfectly-plastic (EPP)
model. Numerous variations on this model exist including the equivalent energy
elastic perfectly-plastic model (see Liu et al. 2012) and others. However, in
discussion amongst the authors and with the Industry Advisory Board for the
CFS-NEES project it was decided that the simplest possible EPP model best
characterizes current state-of-the-practice: set the “plastic” strength at the code
specified nominal strength (Vn) and set the deflection (and thereby the stiffness)
at the code specified deflection () at the same Vn; as shown in Figure 3a.
The nominal shear capacity per unit width, vn, is found from AISI-S213 and for
a given wall of width b the nominal shear capacity, Vn = bvn. From Table C2.1-3
for 43 or 54 mil studs and track with 7/16 in. OSB on one-side and #8 fasteners
spaced 6 in. o.c. vn = 825 plf. (Note, this is the lower bound specified code

strength and is conservatively selected for the models developed here; further,
this value must be reduced for walls with aspect ratios greater than 2:1). The
deflection of the shear wall at vn is provided by Equation C2.1-1 of AISI S213:
d(vn) =
2vnh3
3EsA
cb
+w1w
2
vnh
rGtsheathing
+w15/4w
2w
3w
4
vn
b
æ
èçç
ö
ø÷÷
2
+h
bd
vn
(6)
All variables are defined in S213; briefly, the first term accounts for chord stud
bending, the second term for shear in the sheathing, the third term is empirically
fit to test data (and accounts for the bulk of ) and the final term accounts for
deformation at the hold downs. The V- curve is converted into material
properties for the diagonals in Figure 2 as described in the previous section.
(a)
(b)
Figure 3 Nonlinear models for shear wall (a) EPP and (b) Pinching4
V
D
(d(Vn) ,Vn)
symmetric
V
D
(1.004d(Vn) ,.197Vn)
(d(.4Vn) ,.4Vn)
( ,u-V -V3)
(Dmin ,V(Dmin))
(Dmax,V(Dmax))
( ,.0+V3)
(r-D Dmin,r-V V(Dmin))
(.5Dmax,.25 V(Dmax))
(d(.8Vn) ,.8Vn) (d(Vn) ,Vn)
symmetric

Pinching4 nonlinear hysteretic shear wall model
A far more realistic characterization of the shear wall behavior can be completed
with the Pinching4 material (Lowes and Altoontash 2003) available in OpenSees.
The model includes a four point backbone curve and a means to reduce (pinch)
the response as a function of the maximum (+) or minimum (–) force or
displacement experienced in a cycle as illustrated in Figure 3b. A complete
discussion of parameterizing cyclic shear wall response with the Pinching4
model is available in Liu et al. 2012. Here the approach taken is to use the
available data to augment the state-of-the-practice model.
As illustrated in Figure 3b the first three points in the backbone curve are set to
((0.4Vn),0.4Vn), ((0.8Vn),0.8Vn), and ((1.0Vn),1.0Vn) and provide the pre-peak
envelope as specified by AISI-S213. The last (fourth) point on the backbone
curve is selected based on the average of Test 4 and 14 from Liu et al. (2012)
and results in (1.004(1.0Vn),0.197Vn). The pinching parameters (reloading and
unloading) are also selected based on the average of reported results from Liu et
al. (2012) and include: r = 0.5, rV = 0.25, and uV = 0.0 as shown in Figure 3b.
The V- curve is converted into material properties for the diagonals in Figure 2
as described in the previous section.
Comparison of shear wall models with typical shear wall test
The developed EPP and Pinching4 models are compared to Test 12 of the shear
wall tests of Liu et al. (2012) in Figure 4. The single story 8 ft x 9 ft OSB
sheathed shear walls have the same details as the CFS-NEES building and are
tested to the CUREE protocol.

Figure 4 Pinching4 and EPP model compared with Test 12 of Liu et al. (2012)
In addition to showing the entire hysteretic response specific cyclic test loops
are also provided in Figure 4; namely pre-peak loops 10, 26, 29, 32, and 35, the
cyclic loop with maximum force: loop 38, and post-peak degraded loops: 39 (at
75% of the maximum deflection at peak load, loop 28) and 41 (at 150% of the
maximum deflection at peak load).
The selected maximum capacity from AISI-S213 (825 plf) for the EPP and
Pinching4 model is conservative when compared to the tests (a case can be
made for a more aggressive selection from the tables of AISI-S213). Initial
stiffness in the Pinching4 model is greater than the EPP model due to the use of
at lower force levels in the first two branches of the Pinching4 model. The
EPP model ignores pinching in the hysteretic behavior, near and past peak this
assumption is untenable, as the actual response is severely pinched. The result is
that the EPP model over-estimates the energy dissipation, in some cases grossly.
(Note, as discussed in Liu et al (2012) equivalent energy elastic-plastic models
sometimes refereed to as EEEP models have the same drawback as the
traditional EEP model in that they only match the energy of the backbone curve
and ignore pinching, which is the dominant effect in the hysteretic response).
Given these observations both the EEP and Pinching4 model of the shear walls
are examined in the context of the CFS-NEES building.
Two-dimensional shear wall simulation
Two-dimensional (2D) models of the walls of the CFS-NEES building are
constructed in OpenSees. The models, as depicted in Figure 5 for the North
elevation, are meant only for lateral analysis and include only the shear walls as
lateral resisting elements. The North elevation is highlighted as it has the largest
shear force resistance.
The pinned connections designated in Figure 5 are realized by introducing
coincident nodes and adding multi-point constraints that tie the translational
degrees of freedom at the coincident nodes. The chord studs of the shear walls
are modeled with actual cross-section properties, but since they are pinned they
essentially do not participate in providing lateral resistance. The tracks (which
here are a stand-in for the full diaphragm) are modeled using artificially
increased material and cross section properties (1x10⁵ times greater than tabled
values of actual members) to transfer the shear force. All supports are pinned.
Mass of each story is obtained from Madsen et al. (2011) and assigned to each

wall elevation proportional to shearwall widths. Lumped mass of each floor is
located at the end of leaning column.
Figure 5 2D OpenSees model of CFS-NEES shear walls, North elevation
Free vibration analysis
Free vibration analysis was performed on the North elevation to check the
natural periods and mode shapes. Figure 6 illustrates the first two mode shapes
based on the EPP initial stiffness (i.e., secant stiffness to the peak strength). The
periods are 0.552 seconds and 0.239 seconds and have less than four percent
error compared with a simple Rayleigh quotient hand calculation. If the first
branch linear stiffness of the Pinching4 model is used (i.e. secant stiffness to 40%
of the peak strength), the periods reduce to 0.420 and 0.177 seconds. Note, even
this is in relatively poor agreement with Equation 12.8-7 of ASCE 7-10 which
yields a first mode period of 0.175 seconds. However, ASCE 7’s expression
empirically includes more in the calculation than just the shear wall stiffness.
(a) First mode, T1 = 0.552 seconds (b) Second mode, T2 = 0.239 seconds
Figure 6 Mode shapes of North elevation model using EPP linear stiffness
Pushover analysis
Nonlinear pushover analysis is used extensively in seismic design and forms a
key methodology in seismic design methods such as ASCE 41. Nonlinear
pushover analysis of the North elevation is conducted in OpenSees. The results
show that displacement control is needed for numerical stability. Currently,
horizontal displacement of the control node, the node with lumped mass on the
second floor, is set to 10% of the building height. This displacement is large
enough for the shear elements to reach full capacity. Since the model does not
include elements beyond the shear walls themselves little redistribution is
observed and the results are essentially trivial (summation of wall capacities is

observed as expected). For verification and late use, a model without pinned
connections is also created, and the base shear force is the same under pushover
analysis.
Linear and nonlinear time history analysis
Elastic and nonlinear time history analysis of the North elevation of the CFS-
NEES building is performed with both the EPP and Pinching4 (elastic models
use only the first branch) shear wall models. Northridge earthquake
measurements at Canoga Park (NGA0959) and Rinaldi receiving station
(NGA1063) are selected as excitations. Based on the elastic response spectrum
acceleration, one signal in a set is selected for analysis use. Signal 106 was
selected for Canoga Park and used as the excitation in the long direction.
Similarly, signal 228 was chosen for Rinaldi. The peak ground acceleration
(PGA) of Canoga Park is 0.354 g, while it is 0.825 g for Rinaldi, illustrating
significant difference between the records.
Currently, linear geometric transformation is used in the OpenSees model thus
excluding nonlinear geometric (and P-Δ) effects. Rayleigh damping with
damping ratios equal to two percent are adopted. Newmark average acceleration
is used for integration in the dynamic analysis.
Time history of the first story drift for the EPP model normalized by the story
height is provided in Figure 7. The Rinaldi ground motion causes permanent
drifts greater than is expected to be sustainable by the building. Peak story drifts
and peak shear forces are provided in Table 1 and Table 2 respectively. The EPP
and Pinching4 models are compared with elastic models that have the same
initial stiffness K(Vn) for EPP per Figure 3a, and K(0.4Vn) for Pinching4 per
Figure 3b. Again the severity of the Rinaldi signal is underscored.
An estimate of the Cd, the displacement amplification factor, is provided in the
last two rows of Table 1. Direct comparisons to ASCE 7 are highly approximate
since the model has only limited nonlinearities included, only one elevation of
the CFS-NEES building is included, and only two earthquake records at singular
spectral acceleration levels are investigated. Nonetheless, it is somewhat
instructive; design Cd = 4, and observed displacement amplifications vary from
0.7 to 3.5 in the EPP model and 1.6 to 4.8 in the more accurate Pinching4 model.
The stronger Rinaldi input signal elicits higher displacement amplifications, and
the displacement is largely concentrated in the first story.
Similarly, an estimate of R, the response modification coefficient, is provided in
Table 2. The same provisos regarding the comparison to ASCE 7 as for Cd apply.
Nonetheless the design value of R=6.5 may be loosely compared with the base
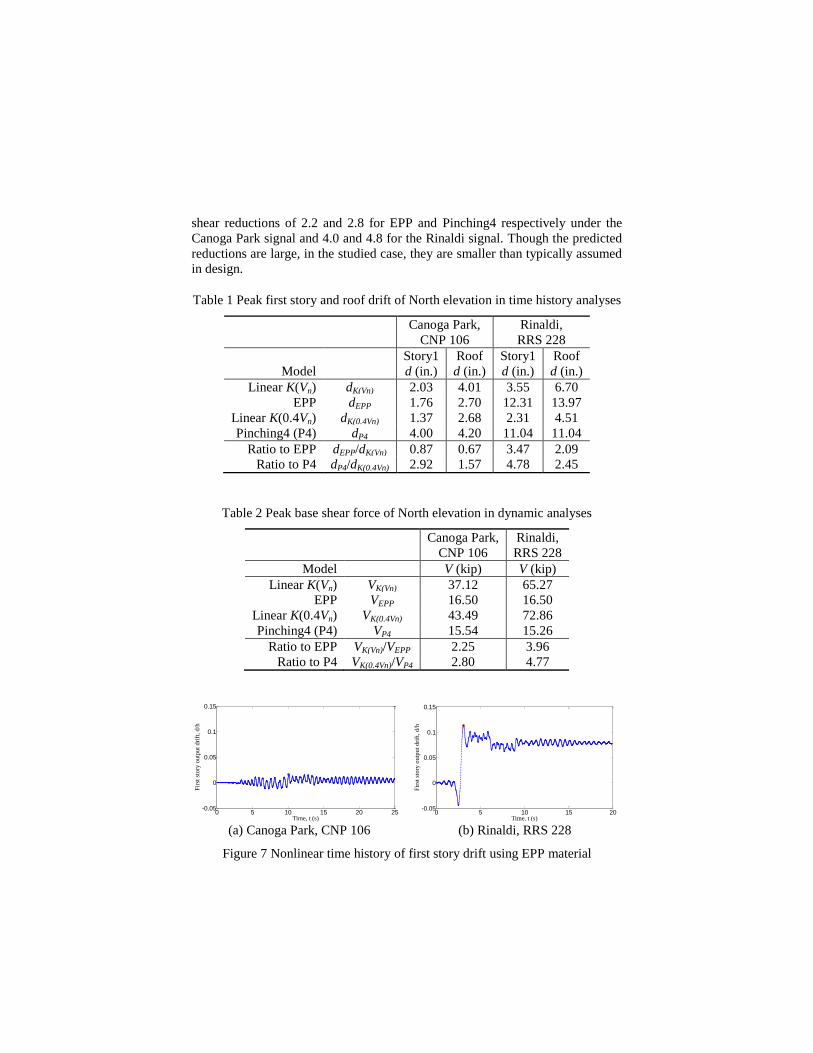
shear reductions of 2.2 and 2.8 for EPP and Pinching4 respectively under the
Canoga Park signal and 4.0 and 4.8 for the Rinaldi signal. Though the predicted
reductions are large, in the studied case, they are smaller than typically assumed
in design.
Table 1 Peak first story and roof drift of North elevation in time history analyses
Canoga Park,
CNP 106
Rinaldi,
RRS 228
Model
Story1
d (in.)
Roof
d (in.)
Story1
d (in.)
Roof
d (in.)
Linear K(Vn) dK(Vn) 2.03 4.01 3.55 6.70
EPP dEPP 1.76 2.70 12.31 13.97
Linear K(0.4Vn) dK(0.4Vn) 1.37 2.68 2.31 4.51
Pinching4 (P4) dP4 4.00 4.20 11.04 11.04
Ratio to EPP dEPP/dK(Vn) 0.87 0.67 3.47 2.09
Ratio to P4 dP4/dK(0.4Vn) 2.92 1.57 4.78 2.45
Table 2 Peak base shear force of North elevation in dynamic analyses
Canoga Park,
CNP 106
Rinaldi,
RRS 228
Model V (kip) V (kip)
Linear K(Vn) VK(Vn) 37.12 65.27
EPP VEPP 16.50 16.50
Linear K(0.4Vn) VK(0.4Vn) 43.49 72.86
Pinching4 (P4) VP4 15.54 15.26
Ratio to EPP VK(Vn)/VEPP 2.25 3.96
Ratio to P4 VK(0.4Vn)/VP4 2.80 4.77
(a) Canoga Park, CNP 106 (b) Rinaldi, RRS 228
Figure 7 Nonlinear time history of first story drift using EPP material
0 5 10 15 20 25-0.05
0
0.05
0.1
0.15
Time, t (s)
Fir
st s
tory
outp
ut
dri
ft, d/h
0 5 10 15 20-0.05
0
0.05
0.1
0.15
Time, t (s)
Fir
st s
tory
ou
tpu
t d
rift
, d
/h

Three-dimensional building simulation
Three-dimensional (3D) models of the CFS-NEES building, appropriate for
lateral analysis only, are constructed in OpenSees, as depicted in Figure 8. The
wall elevations are essentially the same as the 2D models; however, pinned
connections in the corners of the shear walls are not employed. From a
behavioral standpoint removing the pins allows bending to occur in the chord
studs, which is realistic and of interest. From a practical modeling standpoint the
use of coincident nodes (for modeling the pins) was not found to be compatible
with rigid diaphragm modeling (which also employs multi point constraints).
Two-dimensional models with and without pins were conducted, the total base
shear capacities are identical and the stiffness increase by removing the pins is
less than 10% in the first two modes (and modestly moves the predicted stiffness
in the direction of the empirical ASCE 7 stiffness predictions). Note, the
artificially stiff tracks used in the 2D models are replaced with beam-column
elements using appropriate property values.
Figure 8 3D model of the building with rigid diaphragm
An important issue in the 3D model is the stiffness of the diaphragm. The
building design (Madsen et al. 2011) assumes that the unblocked cold-formed
steel joists with 7/16 in. OSB sheathing is flexible per Section 12.3 of ASCE 7-
10. However, calculations with the diaphragm deflection expression in AISI-
S213 indicate the diaphragm may have considerable stiffness. Further, expert
opinion of the Industry Advisory Board for the CFS-NEES project was mixed
on the issue and considered it still an open question. Exact characterization of
the diaphragm stiffness will be left to system identification of the actual building
during future testing. For now, it was decided to consider the two extremes in
modeling: rigid diaphragm, and completely flexible diaphragm. Details of
diaphragm openings, etc. are also not considered at this point.
North

In the model the mass of each story is divided equally and lumped to the four
corners. This simple approximation will need refining in the future for a more
exact prediction of the diaphragm rotational moment of inertia, P-Δ effects, and
interaction of gravity and lateral loads.
Linear Static Analysis
An equivalent static lateral force of 300 kips is applied in the x (long, east-west))
direction of the CFS-NEES building of Figure 8. The load is equally distributed
to the four corner nodes and 1/3 to the first floor and 2/3 to the second floor. The
vertical distribution is close to the first translational model shape. Table 3
provides the resulting base shear for the models under the two diaphragm
assumptions. Both models show that the out of plane walls only carry a small
fraction of the shear. The no-diaphragm model eliminates the load path between
the North and South elevations and thus they carry close to the same shear force
despite their significant difference in stiffness. The rigid diaphragm model
results in over 2/3 of the total applied force being carried in the stiffer North
elevation. Hand analysis performed in Madsen et al. (2011) shows a similar
increase in the expected base shear of the North elevation, and also notes that
this increased demand is not greater than the capacity of these walls.
Table 3 Base shear developed from 300 kip lateral force in long direction
No diaphragm model Rigid diaphragm model
Base shear Base shear
Elevation (kips) (kips)
North 151.15 206.40
South 124.48 78.40
West 12.50 7.82
East 11.87 7.39
Free vibration analysis
Free vibration analysis of the 3D model of the CFS-NEES building is conducted.
The shear wall initial stiffness is based on the initial stiffness of the EPP model,
i.e. K(Vn) and both rigid and no (flexible) diaphragm models are considered. The
first mode shape is reported in Figure 9 and the first six periods in Table 4. The
rigid diaphragm model introduces torsion since the center of mass and center of
stiffness are not aligned, as shown in Figure 9b. In addition, the rigid diaphragm
models have modestly shorter periods than the no diaphragm models.
The 3D model has longer first mode periods than the 2D model and
considerably longer than ASCE7 predictions when all the shearwalls, which are
less stiff than North elevation, are included. Accurately assessing the building

period is important for properly characterizing the design spectra response and
disagreement between the models and ASCE7 predictions underscores the
importance of the experimental investigations that will soon be underway.
(a) No diaphragm model, 1st mode (b) Rigid diaphragm model, 1st mode
Figure 9 First mode shapes of 3D models
Table 4 Natural period comparison of two 3D models using K(Vn) stiffness
Mode number
No diaphragm model
Period
(sec)
Rigid diaphragm model
Period
(sec)
1 0.919a 0.882
b
2 0.881 0.832
3 0.825 0.638
4 0.557 0.342
5 0.390 0.315
6 0.335 0.270
(a) for K(0.4Vn), no diaphragm, mode 1 period = 0.817 sec.
(b) for K(0.4Vn), rigid diaphragm, mode 1 period = 0.782 sec.
Linear and nonlinear time history analysis
Linear and nonlinear time history analysis is performed on the 3D model of the
CFS-NEES building. Models with rigid diaphragm, no diaphragm, and EPP or
Pinching4 shear wall idealizations are considered. The building is subjected to
the Rinaldi excitation in the long (East-West) direction.
The input ground motion, second first floor story drift, and total base shear is
provided for the nonlinear time history response of the rigid diaphragm model
subjected to the Rinaldi excitation in Figure 10. The shear walls experience
significant damage under this excitation. The Pinching4 model shows strong
reductions in the base shear as the stiffness of the shear walls dramatically drop
in the post-peak response, but concomitantly much greater story drift results in

the Pinching4 results. Regardless, peak story drift and peak base shear are
directly correlated with the large pulse in the ground motion (PGA = 0.825g) at
approximately 2.5 seconds. Comparison of linear and nonlinear time history
results for peak story drift and peak base shear are provided in Table 5 and
Table 6 respectively.
Figure 10 Time histories of Rinaldi ground motion (RRS 228), first story drift,
and base shear for 3D model of CFS-NEES building, excitation in long direction
Table 5 Peak first story and roof center drift
comparison of 3D models in dynamic analyses
No
diaphragm (D0)
Rigid
Diaphragm (RD)
D0/
RD
Model
Story1
d (in.)
Roof
d (in.)
Story1
d (in.)
Roof
d (in.)
Story 1
Linear K(Vn) dK(Vn) 8.31 15.83 6.31 11.92 1.32
EPP dEPP 12.40 13.81 13.41 15.24 0.92
Linear K(0.4Vn) dK(0.4Vn) 5.81 11.50 3.69 6.74 1.57
Pinching4 (P4) dP4 12.59 13.05 14.29 14.52 0.88
Ratio to EPP dEPP/dK(Vn) 1.49 0.87 2.13 1.28 0.70
Ratio to P4 dP4/dK(0.4Vn) 2.17 1.13 3.87 2.15 0.56

Table 6 Peak base shear force
comparison of 3D models in dynamic analyses
No dia-
phragm (D0)
Rigid dia-
phragm (RD)
D0/
RD
Model V (kip) V (kip)
Linear K(Vn) VK(Vn) 143.33 154.36 0.93
EPP VEPP 29.60 30.55 0.97
Linear K(0.4Vn) VK(0.4Vn) 130.57 138.29 0.94
Pinching4 (P4) VP4 20.39 20.96 0.97
Ratio to EPP VK(Vn)/VEPP 4.84 5.05 0.96
Ratio to P4 VK(0.4Vn)/VP4 6.40 6.60 0.97
Peak story drifts for the Rinaldi excitation, as recorded in Table 5, are
significant – and although permanent story drifts are much smaller the nonlinear
models essentially predict that all the first story shear walls are far into their
collapse response (first story normalized drift is 13% to15% depending on the
model). Comparison of the no (flexible) diaphragm model with the rigid
diaphragm model demonstrates a significant difference in the response between
the linear and nonlinear shear wall idealizations. As provided in the last column
of Table 5, in the linear models the deflections are greatest when the diaphragm
is modeled as flexible; however in the nonlinear models this reverses as
deflections are greatest when the diaphragm is rigid and the rigid diaphragm
forces all first floor shear walls into greater damage.
Again, noting the provisos with comparisons to ASCE 7 as discussed in the 2D
model results, the design Cd = 4, and observed displacement amplifications in
the 3D models vary from 0.9 to 2.1 in the EPP model and 1.1 to 3.9 in the
Pinching4 model. These 3D results are modestly reduced from the 2D model,
but essentially aligned. (Note, the strongest wall was modeled in the 2D results).
For the Rinaldi excitation the drastic difference between linear and nonlinear
force response is well highlighted by the difference in total peak base shear as
reported in Table 6. Depending on the model details base shear from the
nonlinear models is between 4.8 and 6.6 times less than linear analysis. For the
Pinching4 model with rigid diaphragm, felt by the authors to be the most
accurate characterization, the predicted base shear is 6.6 times less than the
linear analysis. This may very coarsely be compared with the prescribed R factor
of 6.5. The diaphragm assumption has little impact on the peak base shear as
shown in the last column of Table 6; however, this is difficult to generalize as
the excitation is large enough that all shear walls yield thus making the role of
the diaphragm in distributing force to the shear walls irrelevant.

Comparison in the base shear response between the 2D (Table 3) and 3D models
(Table 6) is illuminating. The ratio of nonlinear (P4) to linear peak base shear
response in the 2D model is only 4.8, compared with 6.6 in the 3D model – for
the same excitation. Thus, one can begin to understand how the system, and load
sharing between shear walls, load sharing between different elevations, torsional
influences due to diaphragm behavior, and the asymmetric distribution of shear
walls, can result in differences in response not easily predicted by the 2D models.
Discussion and Future Work
The currently developed OpenSees models of the CFS-NEES building provides
a platform for exploring the expected experimental behavior, demonstrates the
importance of adequate nonlinear models and of employing three-dimensional
models, but significant work remains.
Multidirectional seismic motions need to be considered. The record-to-record
difference of earthquake ground motions can play a significant role in
determination of failure modes. More specifically, the far-field ground motion
data set suggested in FEMA P695 will be used along with incremental dynamic
analysis (Vamvatsikos and Cornell, 2002) in the future.
At the global building scale the mass distribution needs to be handled in a finer
manner and P- effects, at least on the walls as a whole, need to be included.
The explored diaphragm models are adequate for bounding the solution, but a
semi-rigid diaphragm model that includes differing stiffness parallel and
perpendicular to the floor joists and incorporates the effect of openings is needed.
AISI-S213 provides an approximation of the basic stiffness and preliminary
models accounting for openings in the diaphragm have been explored.
The Pinching4 shear wall model is currently calibrated to a lower bound AISI
S213 expected strength (Vn). Based on the Liu et al. (2012) testing a more
precise model calibrated to the average test results can and will be developed. It
is possible to separate the hold down flexibility from the test results and in the
models, this separation will be completed so that the vertical flexibility at the
chord stud locations is more accurately modeled. This is also beneficial so that
the vertical flexibility between the first and second story shear walls can be
included in the model.
In the walls, the lateral stiffness of the gravity system is currently ignored.
Although the stiffness is less than the shear walls it is not zero as assumed in

current models. Final calibration of the gravity system contribution to the lateral
system stiffness likely awaits the full-scale test results; however, the model can
readily be adapted to include this stiffness. Challenges remain due to the lack of
a clear load path in tension and limited/non-existent information on the
nonlinear response of the gravity walls; but it is an important issue worthy of
further consideration.
The impact of ledger framing is currently not explored in the existing models.
Floor masses are not concentric, but rather hung from the interior studs and thus
modestly eccentric. Interaction between the diaphragm and the shear wall as
well as the gravity walls is assumed perfect in the existing models but in reality
includes eccentricities and flexibilities that may have an important influence on
response. Small scale testing is currently underway to explore some of the joist o
ledger to stud (wall) response.
The impact of interior walls, interior gypsum, and the exterior insulated
finishing system are obviously not included in current models, but will be
examined in testing, and are worth incorporating in final models.
Rather than look at the model development as a series of improvements that
must be made to re-create reality, the goal of the increasing model fidelity is to
try to estimate the improved accuracy of response prediction and judge what
level of fidelity is generally appropriate.
Conclusions
Computational models of the cold-formed steel framed two-story archetype
building from the CFS-NES project, appropriate for lateral analysis, have been
developed in OpenSees. The key nonlinearity targeted in the model is the
response of the shear walls. State-of-the-practice models that incorporate an
elastic perfectly-plastic idealization of the shear wall response are shown to be
inadequate when compared with more advanced shear wall idealizations that
include finer discretization of the overall backbone response and the influence of
pinching and other hysteretic degradation, such as in the Pinching4 model of
OpenSees. Two-dimensional models of the lateral response are generally
adequate if the building diaphragm is flexible; however, they are inadequate for
stiffer diaphragms. Even in a regular plan building such as the CFS-NEES
archetype asymmetric distribution of the shear walls still leads to an eccentricity
between the center of mass and center of stiffness that only a three-dimensional
model with appropriate diaphragm stiffness appropriately captures. However, if
excitations are strong enough the diaphragm stiffness is not as influential,

particularly for peak base shear. Significant future work remains to further the
development of the computational model of the CFS-NEES buildings.
Acknowledgements
The authors are grateful to George E. Brown, Jr. Network for Earthquake
Engineering Simulation (NEES) for the sponsorship. Thanks are extended to
Rob Madsen in Devco Engineering for his design work of the archetype building.
This paper was prepared as part of the U.S. National Science Foundation
sponsored CFS-NEES project: NSF-CMMI-1041578: NEESR-CR: Enabling
Performance-Based Seismic Design of Multi-Story Cold-Formed Steel
Structures. The project also received supplementary support and funding from
the American Iron and Steel Institute. Project updates are available at
www.ce.jhu.edu/cfsnees. Any opinions, findings, and conclusions or
recommendations expressed in this publication are those of the author(s) and do
not necessarily reflect the views of the National Science Foundation, nor the
American Iron and Steel Institute.
References
American Iron and Steel Institute. (2007). North American specification for the
design of cold-formed steel structural members, 2007 edition with supplement 2
(AISI S100-07 w/S2-10 ed.). Washington, DC: American Iron and Steel
Institute.
American Iron and Steel Institute. (2007). North American standard for cold-
formed steel framing - general provisions, 2007 edition (AISI S200-07 ed.).
Washington, DC: American Iron and Steel Institute.
American Iron and Steel Institute. (2007). North American standard for cold-
formed steel framing - floor and roof system design, 2007 edition (AISI S210-07
ed.). Washington, DC: American Iron and Steel Institute.
American Iron and Steel Institute. (2007). North American standard for cold-
formed steel framing - wall stud design, 2007 edition (AISI S211-07 ed.).
Washington, DC: American Iron and Steel Institute.
American Iron and Steel Institute. (2009). North American standard for cold-
formed steel framing - lateral design 2007 edition with supplement no. 1 and
commentary (AISI S213-07-SI-09 ed.). Washington, DC: American Iron and
Steel Institute.
American Society of Civil Engineers (ASCE). (2005). Minimum design loads
for buildings and other structures (ASCE/SEI 7-05 ed.). Reston, Va: American
Society of Civil Engineers.

American Society of Civil Engineers (ASCE). (2010). Minimum design loads
for buildings and other structures (ASCE/SEI 7-10 ed.). Reston, Va.: American
Society of Civil Engineers.
American Society of Civil Engineers (ASCE). (2007). Seismic rehabilitation of
existing buildings (ASCE/SEI 41-06 ed.). Reston, Va.: American Society of
Civil Engineers.
Applied Technology Council. (June 2009). Quantification of building seismic
performance factors No. FEMA P695)
Liu, P., Peterman, K. D., Yu, C., & Schafer, B. W. (2012). Characterization of
cold-formed steel shear wall behavior under cyclic loading for the CFS-NEES
building. 21th International Specialty Conference on Cold-Formed Steel
Structures - Recent Research and Developments in Cold-Formed Steel Design
and Construction, St. Louis, MO.
Lowes, L. N., & Altoontash, A. (2003). Modeling reinforced-concrete beam-
column joints subjected to cyclic loading. Journal of Structural Engineering,
129(12), 1686-1697.
Madsen, R. L., Nakata, N., & Schafer, B. W. (December 2011). CFS-NEES
building structural design narrative No. CFS-NEES-RR01)
Martínez-Martínez, J., & Xu, L. (2011). Simplified nonlinear finite element
analysis of buildings with CFS shear wall panels. Journal of Constructional Steel
Research, 67(4), 565-575.
McKenna, F. et al. (2011). Open system for earthquake engineering simulation
(OpenSees) (2.3.2 ed.) Pacific Earthquake Engineering Research Center,
University of California, Berkeley, CA. Retrieved from opensees.berkeley.edu
Shamim, I., & Rogers, C. A. (2012). Numerical Modelling and Calibration of
CFS Framed Shear Walls under Dynamic Loading. 21th International Specialty
Conference on Cold-Formed Steel Structures - Recent Research and
Developments in Cold-Formed Steel Design and Construction, St. Louis, MO.
Vamvatsikos, D., & Cornell, C. A. (2002). Incremental dynamic analysis.
Earthquake Engineering & Structural Dynamics, 31(3), 491-514.
van de Lindt, J. W. (2004). Evolution of wood shear wall testing, modeling, and
reliability analysis: Bibliography. Practice Periodical on Structural Design and
Construction, 9(1), 44-53.
van de Lindt, J. W., Pei, S., Liu, H., & Filiatrault, A. (2010). Three-dimensional
seismic response of a full-scale light-frame wood building: Numerical study.
Journal of Structural Engineering, 136(1), 56-65.