SEISMIC ATTRIBUTES AND WELL LOG ANALYSIS … ATTRIBUTES AND WELL LOG ... statistical methods and...
12
International Journal of Geography , Geology & Agricultural Research, Vol.1, Issue 1, Jan- Jun, 2017, pp 25-36, | submit paper : [email protected] download full paper : www.arseam.com 25 www.arseam.com SEISMIC ATTRIBUTES AND WELL LOG ANALYSIS OF “ HABI” FIELD, NIGER DELTA, NIGERIA. EMUDIANUGHE, J 1 , ADIELA, U.P 2 , UGWU JOSHUA UDOKA 3 1 , Department of Earth scienses, Federal University of Petroleum Resources, Effurun 2, , Department of Petroleum Engineering,, Nigerian Agip Oil Company, Port Harcourt 3 , Department of Geology Institution, Michael Okpara University of Agriculture, Umudike Nigeria Abstract: The quest for optimum method of hydrocarbon production has been an issue which many oil and gas companies are interested in. Alvarado and Manrique (2010) have stated that the effort of industries to increase production by the use of large capital investments to enhance oil recovery sometimes prove futile. One of the major ways of resolving this issue is through hydrocarbon reservoir properties modeling. This study has been carefully and thoroughly carried out in aspects focusing mainly on reservoir modeling of “HABI” field, Niger Delta using an integrated Seismic approach and well log analysis. (I) INTRODUCTION In exploration geophysics, subsurface structures and properties of interest include: the reservoir architecture, porosity, fluid Saturation, lithology and permeability. In the procedure for subsurface property modeling, it is usual that geophysicists first provide spatial distribution of seismic attributes from observed seismic record. Seismic attributes can be used for both quantitative and qualitative purposes. Quantitative uses include prediction of physical properties such as porosity or lithology (Leiphart and Hart, 2001; Sagan and Hart, 2006). Qualitative uses include detection of stratigraphic and structural features. Then from the derived seismic attributes, we can evaluate and estimate subsurface properties of interest using physical theories, statistical methods and geological model, along with well-log data.
Transcript of SEISMIC ATTRIBUTES AND WELL LOG ANALYSIS … ATTRIBUTES AND WELL LOG ... statistical methods and...
International Journal of Geography , Geology & Agricultural Research, Vol.1, Issue 1, Jan- Jun, 2017, pp 25-36,
| submit paper : [email protected] download full paper : www.arseam.com 25
www.arseam.com
SEISMIC ATTRIBUTES AND WELL LOG ANALYSIS OF
“ HABI” FIELD, NIGER DELTA, NIGERIA.
EMUDIANUGHE, J 1 , ADIELA, U.P
2 , UGWU JOSHUA UDOKA
3
1 ,Department of Earth scienses, Federal University of Petroleum Resources,
Effurun 2, ,
Department of Petroleum Engineering,, Nigerian Agip Oil Company, Port
Harcourt 3 ,
Department of Geology Institution, Michael Okpara University of Agriculture,
Umudike Nigeria
Abstract:
The quest for optimum method of hydrocarbon production has been an issue which many oil and
gas companies are interested in. Alvarado and Manrique (2010) have stated that the effort of
industries to increase production by the use of large capital investments to enhance oil recovery
sometimes prove futile. One of the major ways of resolving this issue is through hydrocarbon
reservoir properties modeling. This study has been carefully and thoroughly carried out in
aspects focusing mainly on reservoir modeling of “HABI” field, Niger Delta using an integrated
Seismic approach and well log analysis.
(I) INTRODUCTION
In exploration geophysics, subsurface structures and properties of interest include: the reservoir
architecture, porosity, fluid Saturation, lithology and permeability. In the procedure for
subsurface property modeling, it is usual that geophysicists first provide spatial distribution of
seismic attributes from observed seismic record.
Seismic attributes can be used for both quantitative and qualitative purposes. Quantitative uses
include prediction of physical properties such as porosity or lithology (Leiphart and Hart, 2001;
Sagan and Hart, 2006). Qualitative uses include detection of stratigraphic and structural features.
Then from the derived seismic attributes, we can evaluate and estimate subsurface properties of
interest using physical theories, statistical methods and geological model, along with well-log
data.
Emudianughe, J et. al / Seismic Attributes and Well Log Analysis of “ HABI” Field, Niger Delta, Nigeria.
| submit paper : [email protected] download full paper : www.arseam.com 26
(II) OBJECTIVES OF THE STUDY
The objectives of this study include, but not limited to the: Determination of the seismic
attributes of the HABI Field ,Identification and definition of potential reservoirs and key
hydrocarbon horizons useful for field development
STUDY AREA
The “HABI” oil and gas field is situated within the western margin of the Niger-Delta. The
Niger-Delta is situated in the Gulf of Guinea
GEOLOGY OF THE NIGER DELTA BASIN
The Stratigraphy of the Niger Delta The stratigraphy of the Niger Delta clastic wedge has been
documented during oil exploration and production; most stratigraphic schemes remain
proprietary to the major oil companies operating concessions in the Niger Delta basin. The
composite Tertiary sequence of the Niger Delta consists, in ascending order, of the Akata,
Agbada and Benin Formation. They are composed ofestimated 28,000ft (8,535m) of section at
the approximate depocenter in the central part of the delta (Avbovbo, 1978).
There is decrease in age basin ward, reflecting the overall regression of depositional
environments within the Niger Delta clastic wedge. Stratigraphic equivalent units to these three
formations are exposed in eastern Nigeria (Figs. 6a, 6b and Table 1). The formations reflect a
gross coarsening-upward progradationalclastic wedge (Short and Stauble, 1967), deposited in
marine, deltaic, and fluvial environments (Weber and Daukoru, 1975; Weber, 1986).
The stratigraphic distribution of these rocks is poorly understood because of the lack of drilling
information and outcrops (Avbovbo, 1978 The Akata Formation represents the prodeltafacies of
Eastward prograding Tertiary delta (deposited in the front of the advancing delta). It occurs at the
base of the delta , and is of marine origin. A type section ofthe Akata Formation was defined in
Akata-1 well, 80km east of Port Harcourt (Short and Stauble, 1967). A total depth of 11,121 feet
(3,389.68m) was reached in the Akata-1 well without encountering the base of this formation.
The top of the formation is defined by the deepest occurrence of deltaic sandstone beds (7,180ft
International Journal of Geography , Geology & Agricultural Research, Vol.1, Issue 1, Jan- Jun, 2017, pp 25-36,
| submit paper : [email protected] download full paper : www.arseam.com 27
in Akata well). The formation is estimated to be 18,000ft (about 6000m) thick in the central part
of the clastic wedge (Doust and Omatsola, 1989)
(III) METHODOLOGY (MATERIALS AND METHOD)
i.Four composite well Logs (ASCII): these includes Gamma ray (GR), resistivity (RES) and
density (RHOB), Seismic volume ,Check-shot survey data (ASCII), which was used to generate
the Time-Depth conversion curve.
SEISMIC DATA IMPORT
The seismic volume is imported into a user defined folder in SEG-Y format. It is cropped and
then realized. From the crop-realized volume, inline, crossline are inserted. After loading into
memory, time slice is also inserted.
After the seismic volume is imported into the software, cropping and realization is carried out, so
as to reduce the processing time due to the data and to chop away part that is not needed for
work, leaving behind only the area of interest.
A 3D window is opened and a new interpretation window to view and also start fault mapping.
The faults were mapped on the crosslines and the continuity viewed on the inlines.
SYNTHETIC SEISMOGRAM
The fundamental input in the synthetic process is a sonic log, a density log and check shot; and
acoustic impedance log is produced, which was convolved with a wavelet to give the synthetic
seismogram.
Synthetic seismogram showing a good fit enables us to confidently identify seismic reflections
which are reservoir or falls in our zone of interest. 3D Seeded auto tracking was used in picking
horizon for this research work.
GENERATION OF TIME AND DEPTH STRUCTURE MAP
These grids were transformed into points of value, and then the computer contours it to best fit
with consistent contour spacing specified. Since the horizons are in time domain, we can only
generate a time structure map, in order to generate depth structure map, the horizons in time have
Emudianughe, J et. al / Seismic Attributes and Well Log Analysis of “ HABI” Field, Niger Delta, Nigeria.
| submit paper : [email protected] download full paper : www.arseam.com 28
to be transformed to depth domain using a velocity model. The process is carried out using the
check shot data for each of the wells.
SEISMIC ATTRIBUTES
The seismic data were processed using Landmark‟s SeisWorks from which the X-line and In-line
sections were produced. Complex trace method was adopted in the analysis of the 3D-seismic
sections, and this was done manually. Various seismic reflection events which image the
sedimentary facies and structures were identified and discriminated on basis of reflection
continuity, reflection amplitude, geometric relationships between reflectors and the overall form.
Reflection types were further distinguished by variations in reflection strength and continuity,
geometric relations between overlying and underlying layers and gross form or shape ( e.g.
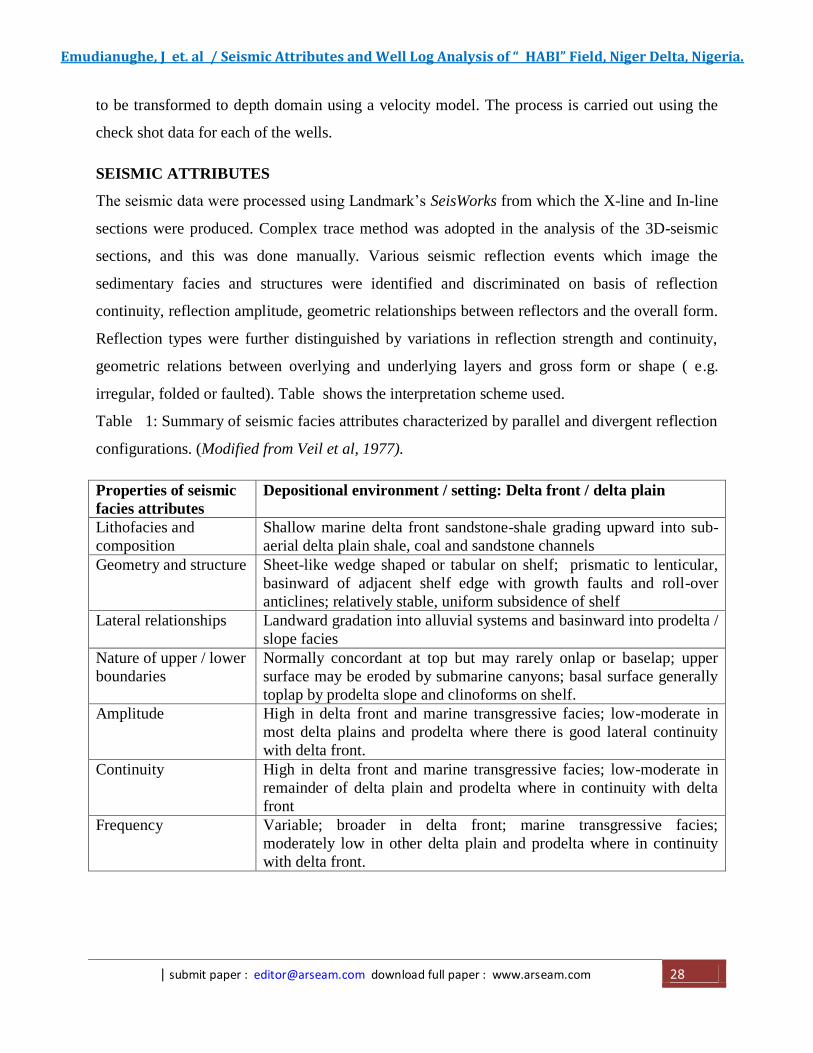
irregular, folded or faulted). Table shows the interpretation scheme used.
Table 1: Summary of seismic facies attributes characterized by parallel and divergent reflection
configurations. (Modified from Veil et al, 1977).
Properties of seismic
facies attributes
Depositional environment / setting: Delta front / delta plain
Lithofacies and
composition
Shallow marine delta front sandstone-shale grading upward into sub-
aerial delta plain shale, coal and sandstone channels
Geometry and structure Sheet-like wedge shaped or tabular on shelf; prismatic to lenticular,
basinward of adjacent shelf edge with growth faults and roll-over
anticlines; relatively stable, uniform subsidence of shelf
Lateral relationships Landward gradation into alluvial systems and basinward into prodelta /
slope facies
Nature of upper / lower
boundaries
Normally concordant at top but may rarely onlap or baselap; upper
surface may be eroded by submarine canyons; basal surface generally
toplap by prodelta slope and clinoforms on shelf.
Amplitude High in delta front and marine transgressive facies; low-moderate in
most delta plains and prodelta where there is good lateral continuity
with delta front.
Continuity High in delta front and marine transgressive facies; low-moderate in
remainder of delta plain and prodelta where in continuity with delta
front
Frequency Variable; broader in delta front; marine transgressive facies;
moderately low in other delta plain and prodelta where in continuity
with delta front.

International Journal of Geography , Geology & Agricultural Research, Vol.1, Issue 1, Jan- Jun, 2017, pp 25-36,
| submit paper : [email protected] download full paper : www.arseam.com 29
(IV) RESULTS AND DISCUSSION
Among other objectives, the 3-D structural interpretation of the seismic data was carried out to
give an overview of the reservoir-trapping configuration in “HABI” field. As one of the major
objective of the work, the depth structure maps were mapped for closures or structures that
possess efficient trapping system suitable for hydrocarbon accumulation, development and
production. These are necessary for projecting the horizons into areas where well control may
not exist. The results generated from this research work, were presented in the forms:
Seismic Section of the mapped faults and horizons., Seismic structural Maps (Time and Depth).,
Seismic Attribute map, Seismic-to-well tie.,
FAULT MODEL
Fault modelling is the process of generating a faulted 3D grid and inserting the horizons, zones
and layers into it, as seen the faults penetrated the two mapped horizons. The process takes 3
steps:
Fault Modelling - The purpose of this step was to define the shape of each of the faults that
should be modeled. This was done by generating “Key Pillars”.
Pillar Gridding - This was done in the Pillar Gridding process. The result of the pillar gridding
process is a “Skeleton grid”, defined by all the faults and all the pillars. This was not associated
with any other input than the faults.
Layering - the final step was to insert the horizons into the faulted 3D grid. At this point, the 3D
grid was attached to depth by associating it with inputs such as time or depth maps and/or well
tops. After the horizons were inserted, the final step was to make the fine-scale layering, suitable
for property modelling.

Emudianughe, J et. al / Seismic Attributes and Well Log Analysis of “ HABI” Field, Niger Delta, Nigeria.
| submit paper : [email protected] download full paper : www.arseam.com 30
Figure:1 Reservoir Architecture showing Fault Model and reservoirs.
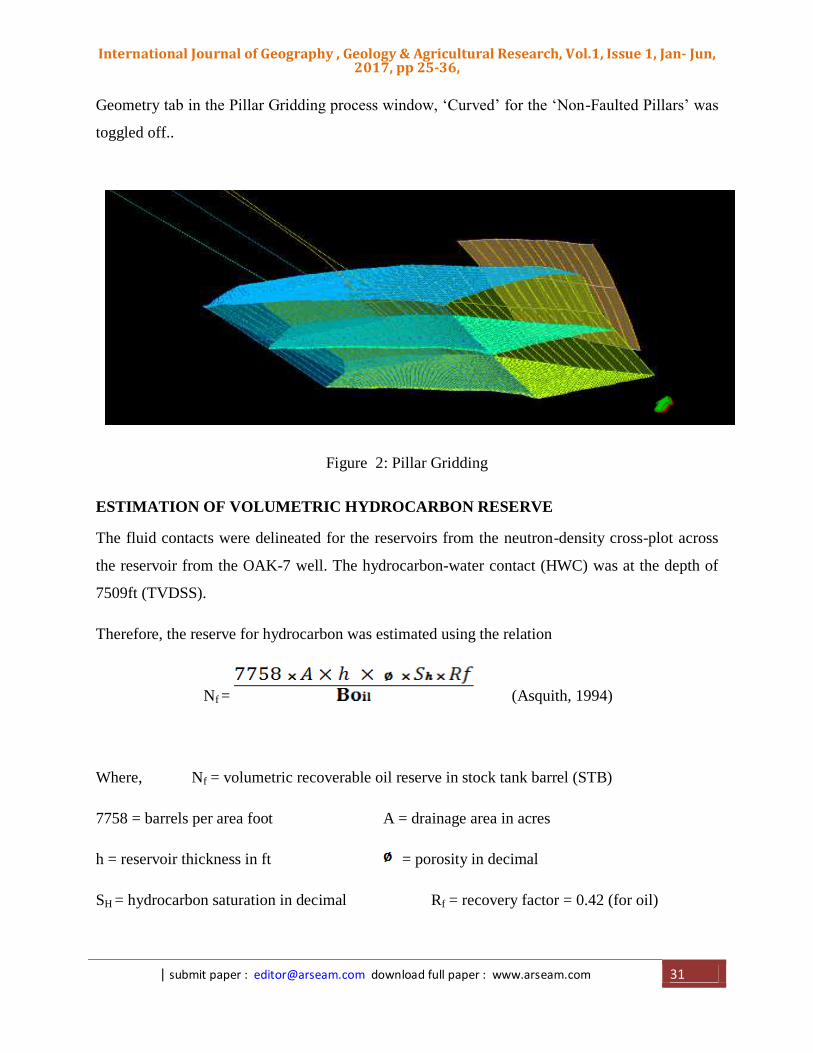
PILLAR GRIDDING
The generation of the structural model was done in a process called Pillar Gridding. Pillar
Gridding is the process of making the „Skeleton Framework‟. The Skeleton is a grid consisting of
a top, a mid and Base skeleton grid, each attached to the top, the Mid and the Base points of the
Key Pillars. The relation between the Fault Modeling process and the Pillar Gridding is an
iterative process with which the user should spend some time in order to attain a grid of good
quality and high cell orthogonality. The result from the Pillar Gridding is a set of pillars both
along the faults but also in between faults. The grid has no layers, only a set of pillars with user
given X and Y increments between them (like a pincushion). The layering was introduced when
making horizons and zones. Before starting Pillar Gridding, a series of checks was performed to
ensure that the fault modeling process is complete.. After the Boundary has been defined and the
2D cell geometry tuned to the point of acceptability (trends and directions was applied to help
tune the 2D cell geometry), the 3D grid was constructed. The result of this construction is the
Skeleton, which is a series of pillars, one for the corner of each cell. Top, middle and base
skeleton grids are used to view these pillars easily in the X-Y dimensions. Under the Pillar
International Journal of Geography , Geology & Agricultural Research, Vol.1, Issue 1, Jan- Jun, 2017, pp 25-36,
| submit paper : [email protected] download full paper : www.arseam.com 31
Geometry tab in the Pillar Gridding process window, „Curved‟ for the „Non-Faulted Pillars‟ was
toggled off..
Figure 2: Pillar Gridding
ESTIMATION OF VOLUMETRIC HYDROCARBON RESERVE
The fluid contacts were delineated for the reservoirs from the neutron-density cross-plot across
the reservoir from the OAK-7 well. The hydrocarbon-water contact (HWC) was at the depth of
7509ft (TVDSS).
Therefore, the reserve for hydrocarbon was estimated using the relation
Nf = (Asquith, 1994)
Where, Nf = volumetric recoverable oil reserve in stock tank barrel (STB)
7758 = barrels per area foot A = drainage area in acres
h = reservoir thickness in ft = porosity in decimal
SH = hydrocarbon saturation in decimal Rf = recovery factor = 0.42 (for oil)

Emudianughe, J et. al / Seismic Attributes and Well Log Analysis of “ HABI” Field, Niger Delta, Nigeria.
| submit paper : [email protected] download full paper : www.arseam.com 32
Boil =oil formation volume factor Boil =
GOR (gas-oil ratio) =
Nf = 136,000,000 STB (stock tank barrels).
SEISMIC ATTRIBUTES MODEL FREQUENCY ATTRIBUTE MODEL
Technically, each individual frequency or band of frequencies could be considered an attribute.
The seismic data was filtered at various frequency ranges in order to show certain geological
patterns that may not be obvious in the other frequency bands. There is an inverse relationship
between the thickness of a rock layer and the corresponding peak frequency of its seismic
reflection. That is, thinner rock layers are much more apparent at higher frequencies and thicker
rock layers are much more apparent at lower frequencies. Frequency attribute has also been
widely used as a direct hydrocarbon indicator based on the time-frequency seismic character of
the hydrocarbon sand (Adepoju et al. 2013).
Figure 3: Frequency Attribute Model showing Sand body in Reservoir A and B.

International Journal of Geography , Geology & Agricultural Research, Vol.1, Issue 1, Jan- Jun, 2017, pp 25-36,
| submit paper : [email protected] download full paper : www.arseam.com 33
“HABI” Field is a prolific field of the Niger Delta which is a deltaic region with favorable
conditions for the generation, accumulation and entrapment of hydrocarbon, possessing
reservoirs that fit these conditions. Hydrocarbon accumulations are present in all the major fault
blocks. The field consists predominantly of hydrocarbon bearing reservoirs. Generally the
accumulations are trapped in a combination of dip and footwall closures. In this light, the
integration of well log correlation and 3-D seismic structural interpretation delineated a geologic
structure that favors accumulation of hydrocarbon within the field of study.
Information extracted from the 3-D seismic data volume and well logs resulted in more
understanding of the structure, stratigraphy and hydrocarbon potentials of the “ HABI” field,
Niger
Figure 4 : Seismic reflection attributes in terms of seismic packages
Emudianughe, J et. al / Seismic Attributes and Well Log Analysis of “ HABI” Field, Niger Delta, Nigeria.
| submit paper : [email protected] download full paper : www.arseam.com 34
Delta. The result suggests more development opportunities in the field such as the North-eastern
flank of the reservoir. However the major uncertainty associated with the “ HABI” field 3D
interpretation is the poor resolution of the seismic data at great depth.
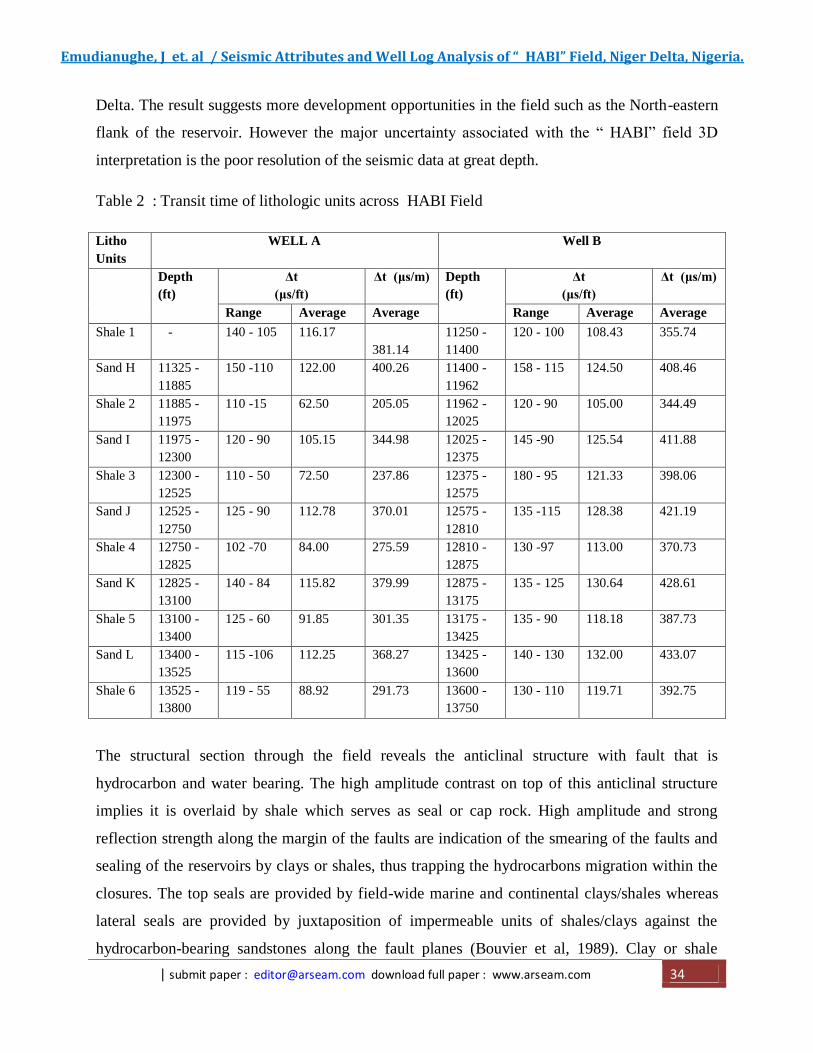
Table 2 : Transit time of lithologic units across HABI Field
Litho
Units
WELL A Well B
Depth
(ft)
Δt
(μs/ft)
Δt (μs/m) Depth
(ft)
Δt
(μs/ft)
Δt (μs/m)
Range Average Average Range Average Average
Shale 1 - 140 - 105 116.17
381.14
11250 -
11400
120 - 100 108.43 355.74
Sand H 11325 -
11885
150 -110 122.00 400.26 11400 -
11962
158 - 115 124.50 408.46
Shale 2 11885 -
11975
110 -15 62.50 205.05 11962 -
12025
120 - 90 105.00 344.49
Sand I 11975 -
12300
120 - 90 105.15 344.98 12025 -
12375
145 -90 125.54 411.88
Shale 3 12300 -
12525
110 - 50 72.50 237.86 12375 -
12575
180 - 95 121.33 398.06
Sand J 12525 -
12750
125 - 90 112.78 370.01 12575 -
12810
135 -115 128.38 421.19
Shale 4 12750 -
12825
102 -70 84.00 275.59 12810 -
12875
130 -97 113.00 370.73
Sand K 12825 -
13100
140 - 84 115.82 379.99 12875 -
13175
135 - 125 130.64 428.61
Shale 5 13100 -
13400
125 - 60 91.85 301.35 13175 -
13425
135 - 90 118.18 387.73
Sand L 13400 -
13525
115 -106 112.25 368.27 13425 -
13600
140 - 130 132.00 433.07
Shale 6 13525 -
13800
119 - 55 88.92 291.73 13600 -
13750
130 - 110 119.71 392.75
The structural section through the field reveals the anticlinal structure with fault that is
hydrocarbon and water bearing. The high amplitude contrast on top of this anticlinal structure
implies it is overlaid by shale which serves as seal or cap rock. High amplitude and strong
reflection strength along the margin of the faults are indication of the smearing of the faults and
sealing of the reservoirs by clays or shales, thus trapping the hydrocarbons migration within the
closures. The top seals are provided by field-wide marine and continental clays/shales whereas
lateral seals are provided by juxtaposition of impermeable units of shales/clays against the
hydrocarbon-bearing sandstones along the fault planes (Bouvier et al, 1989). Clay or shale

International Journal of Geography , Geology & Agricultural Research, Vol.1, Issue 1, Jan- Jun, 2017, pp 25-36,
| submit paper : [email protected] download full paper : www.arseam.com 35
smears along the fault planes during faulting provided a seal to migrating gas and oil. The
abundance of hydrocarbon distribution within the field could possibly be associated with lateral
spill-points at the termination of discontinuous faults and seals, or lack of seals along fault
planes.
The transit time varies down and across the lithologic units. The transit time of sand units are
slightly higher than those of shales. While the transit time of shale ranged from 125us/ft to
15us/ft in Well A and from 180us/ft to 90us/ft at Well 05, those of sands ranged from 150us/ft to
84us/ft at Well 03 and from 158us/ft to 90us/ft at Well 05. Though variation in shale seemed to
be staggered in Well B , there is generally an increase in transit time of shale units down the
depth. Conversely, sands in A showed a gradual increase in transit time down the depth while
those of Well 03 are staggered. Both sand and shale of Well 05 have higher transit time than
those of Well 03. This implies lateral variation in the properties of the lithofacies units, probably
due to changes in the depositional environment and condition.
REFERENCES
Doust, H., and Omatsola, E., 1990. Niger Delta. In: Edwards, J. D., and Santogrossi, P.A., eds.,
Divergent/passive Margin Basins. AAPG Memoir 48, pp. 239-248.
Dresser Atlas, 1982. Well Logging and Interpretation Techniques: The Course for Home Study. Dresser
Atlas Publication, Houston.
Edwards, J. D. and Santogrossi, P. A., 1990. Summary and conclusions. In: Edwards, J.D. and
Santogrossi, P.A., eds., Divergent/passive Margin Basins, AAPG Memoir, 48, pp. 239-248.
Ejedawe, J. E., Coker, S. J. L., Lambert-Aikhionbare, D. O., Alofe, K. B. and Adoh, F. O.,1984.
Evolution of oil-generative window and oil and gas occurrence in Tertiary Niger Delta Basin. AAPG
Bulletin, 68, pp. 1744-1751.
Etu-Efeotor, J. O., 1997. Fundamentals of Petroleum Geology. Paragraphics, Port Harcourt, 146p.
Emery, D. and Myers, K. J., 1996. Sequence stratigraphy. Blackwell Ltd., Oxford, 297p.
Evamy, B. D., Haremboure, J., Kamerling, P., Knaap, W. A., Molloy, F. A., and Rowlands, P. H., 1978.
Hydrocarbon habitat of Tertiary Niger Delta. AAPG Bulletin, 62, pp. 277-298.
Keary, P. and Brooks, M. 1984. An Introduction to Geophysical Exploration. Blackwell Scientific
Publications, Oxford, 296p.
Emudianughe, J et. al / Seismic Attributes and Well Log Analysis of “ HABI” Field, Niger Delta, Nigeria.
| submit paper : [email protected] download full paper : www.arseam.com 36
Kulke, H., 1995. Nigeria. In: Kulke, H., ed., Regional Petroleum Geology of the World. Part II: Africa,
America, Australia and Antarctica. Gebrüder Borntraeger, Berlin, pp. 143-172.
Larionov, V. V., 1969. Borehole Radiometry. Nedra, Moscow.
Marfurt, K., 2005. 3D Seismic Attributes for Prospect Identification and Reservoir Characterization.
Nwachukwu, S. O., 1972. The Tectonic Evolution of the Southern Portion of the Benue Trough, Nigeria,
Geol. Mag. 109, pp. 411-419.
North, F. K., 1990. Petroleum Geology. Unwin Hyman, Winchester, 631p.
Nyong, E. E., 1995. Cretaceous Sediments in the Calabar Flank. In: Ekweme, B. N., Nyong, E. E. and
Peters, S. W., 1995. Geological Excursion Guidebook To Oban Massif, Calabar Flank and Mamfe
Embayment, Southeastern Nigeria. DecFord Publishers, Calabar, pp.14-25.
Rider, M. H., 1986. The Geological Interpretation of Well Logs, 1st ed. Halsted Press, New York, 175p.
Schlumberger, 1977. Log Interpretation Charts. Schlumberger Well Services Inc., Houston, 170p.