Seismic and Infrasound Energy Generation and … and Infrasound Energy Generation and ... SEISMIC...
40
AFRL-RV-HA-TR-2007-1188 Seismic and Infrasound Energy Generation and Propagation at Local and Regional Distances: Phase I – Divine Strake Experiment Brian Stump Aileen Fisher Kevin Jensen Relu Burlacu Tae-Sung Kim Ken Whipp Chris Hayward Ray Kubacki Gordon Johanson Kristine Pankow Mark Leidig Paul Roberson Sue Nava James Britton Ray Read Jessie Bonner Dave Drobeck Ronald Brogan Sebastian Hock Pete O’Neill Steve Masters David Whiteman Department of Geological Sciences Southern Methodist University 6425 BOAZ Dallas, TX 75275 Final Report 11 October 2007 APPROVED FOR PUBLIC RELEASE; DISTRIBUTION UNLIMITED. AIR FORCE RESEARCH LABORATORY Space Vehicles Directorate 29 Randolph Road AIR FORCE MATERIEL COMMAND Hanscom AFB, MA 01731-3010
Transcript of Seismic and Infrasound Energy Generation and … and Infrasound Energy Generation and ... SEISMIC...
AFRL-RV-HA-TR-2007-1188 Seismic and Infrasound Energy Generation and Propagation at Local and Regional Distances: Phase I – Divine Strake Experiment Brian Stump Aileen Fisher Kevin Jensen Relu Burlacu Tae-Sung Kim Ken Whipp Chris Hayward Ray Kubacki Gordon Johanson Kristine Pankow Mark Leidig Paul Roberson Sue Nava James Britton Ray Read Jessie Bonner Dave Drobeck Ronald Brogan Sebastian Hock Pete O’Neill Steve Masters David Whiteman Department of Geological Sciences Southern Methodist University 6425 BOAZ Dallas, TX 75275 Final Report 11 October 2007
APPROVED FOR PUBLIC RELEASE; DISTRIBUTION UNLIMITED.
AIR FORCE RESEARCH LABORATORY Space Vehicles Directorate 29 Randolph Road AIR FORCE MATERIEL COMMAND Hanscom AFB, MA 01731-3010
REPORT DOCUMENTATION PAGE [example] Form Approved
OMB No. 0704-0188 Public reporting burden for this collection of information is estimated to average 1 hour per response, including the time for reviewing instructions, searching existing data sources, gathering and maintaining the data needed, and completing and reviewing this collection of information. Send comments regarding this burden estimate or any other aspect of this collection of information, including suggestions for reducing this burden to Department of Defense, Washington Headquarters Services, Directorate for Information Operations and Reports (0704-0188), 1215 Jefferson Davis Highway, Suite 1204, Arlington, VA 22202-4302. Respondents should be aware that notwithstanding any other provision of law, no person shall be subject to any penalty for failing to comply with a collection of information if it does not display a currently valid OMB control number. PLEASE DO NOT RETURN YOUR FORM TO THE ABOVE ADDRESS. 1. REPORT DATE 11 Oct 2007
2. REPORT TYPE Final Report
3. DATES COVERED (From - To) 16 Mar 2006 to 16 Sep 2007
4. TITLE AND SUBTITLE SEISMIC AND INFRASOUND ENERGY GENERATION AND PROPAGATION AT
5a. CONTRACT NUMBER FA8718-06-C-0028
LOCAL AND REGIONAL DISTANCES: PHASE 1 – DIVINE STRAKE EXPERIMENT 5b. GRANT NUMBER N/A
5c. PROGRAM ELEMENT NUMBER 62601F
6. AUTHOR(S) Brian Stump1, Relu Burlacu3, Chris Hayward1, Kristine Pankow3, Sue Nava4, Jessie Bonner2,
5d. PROJECT NUMBER 1010
Sebastian Hoch3, David Whiteman3, Aileen Fisher1, Tae-Sung Kim1, Ray Kubacki1, Mark Leidig2, James Britton2, Dave Drobeck3, Pete O’Neill3, Kevin Jensen3, Ken Whipp3,
5e. TASK NUMBER SM
Gordon Johanson3, Paul Roberson3, Ray Read4, Ronald Brogan4, and Steve Masters4 5f. WORK UNIT NUMBER A1
7. PERFORMING ORGANIZATION NAME(S) AND ADDRESS(ES) Department of Geological Sciences Southern Methodist University 6425 BOAZ Dallas, TX 75275-6312
8. PERFORMING ORGANIZATION REPORT NUMBER
9. SPONSORING / MONITORING AGENCY NAME(S) AND ADDRESS(ES) Air Force Research Laboratory 29 Randolph Rd. Hanscom AFB, MA 01731-3010
10. SPONSOR/MONITOR’S ACRONYM(S)
11. SPONSOR/MONITOR’S REPORT NUMBER(S) AFRL-RV-HA-TR-2007-1188
12. DISTRIBUTION / AVAILABILITY STATEMENT Approved for Public Release; Distribution Unlimited. 13. SUPPLEMENTARY NOTES 1Department of Geological Sciences, Southern Methodist University 3University of Utah Seismograph Stations 2Weston Geophysical Corporation 4ENSCO, Inc. 14. ABSTRACT
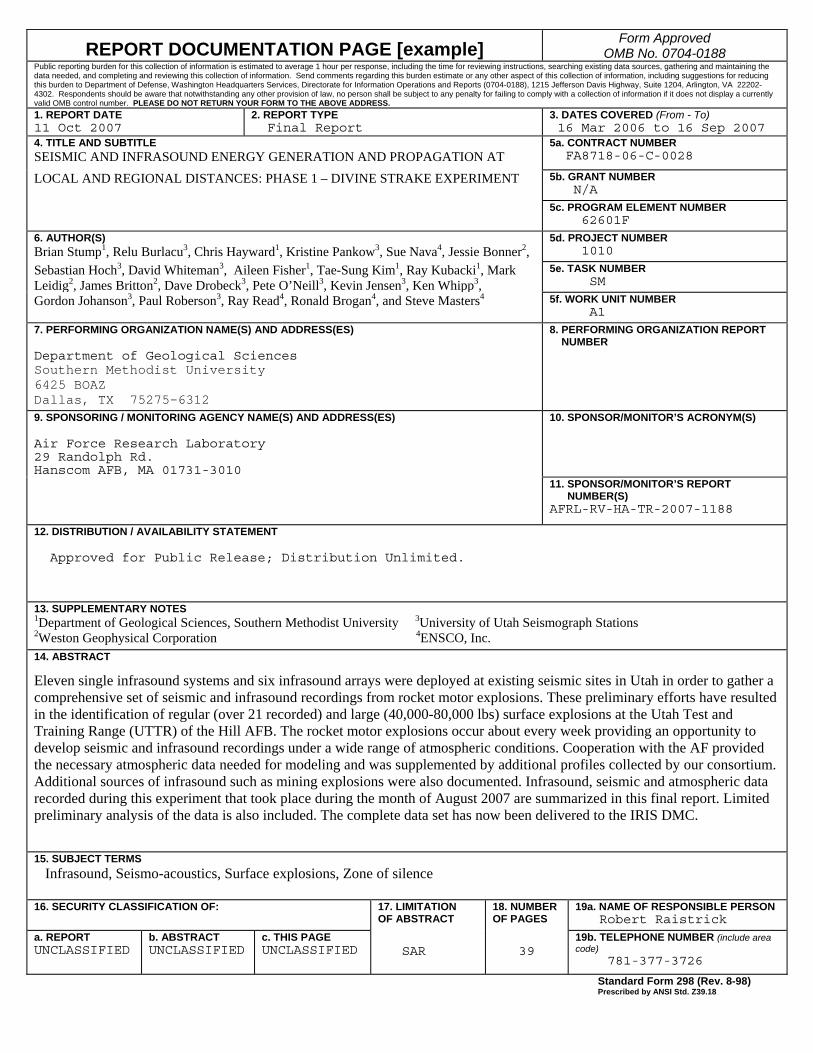
Eleven single infrasound systems and six infrasound arrays were deployed at existing seismic sites in Utah in order to gather a comprehensive set of seismic and infrasound recordings from rocket motor explosions. These preliminary efforts have resulted in the identification of regular (over 21 recorded) and large (40,000-80,000 lbs) surface explosions at the Utah Test and Training Range (UTTR) of the Hill AFB. The rocket motor explosions occur about every week providing an opportunity to develop seismic and infrasound recordings under a wide range of atmospheric conditions. Cooperation with the AF provided the necessary atmospheric data needed for modeling and was supplemented by additional profiles collected by our consortium. Additional sources of infrasound such as mining explosions were also documented. Infrasound, seismic and atmospheric data recorded during this experiment that took place during the month of August 2007 are summarized in this final report. Limited preliminary analysis of the data is also included. The complete data set has now been delivered to the IRIS DMC.
15. SUBJECT TERMS Infrasound, Seismo-acoustics, Surface explosions, Zone of silence
16. SECURITY CLASSIFICATION OF:
17. LIMITATION OF ABSTRACT
18. NUMBER OF PAGES
19a. NAME OF RESPONSIBLE PERSON Robert Raistrick
a. REPORT UNCLASSIFIED
b. ABSTRACT UNCLASSIFIED
c. THIS PAGE UNCLASSIFIED
SAR
39
19b. TELEPHONE NUMBER (include area code) 781-377-3726
Standard Form 298 (Rev. 8-98) Prescribed by ANSI Std. Z39.18


iii
Table of Contents 1. SUMMARY .................................................................................................................. 1 2. OBJECTIVES .............................................................................................................. 2 3. EXPERIMENTAL DEPLOYMENT ......................................................................... 4 4. OBSERVATIONAL RESULTS ............................................................................... 12 5. RESEARCH RESULTS ............................................................................................ 19 6. CONCLUSIONS AND RECOMMENDATIONS................................................... 26 ACKNOWLEDGEMENTS ........................................................................................... 28 REFERENCES................................................................................................................ 29

iv
v
Figures
1. Seismo-acoustic stations in Utah ............................................................................... 2 2. Images documenting the rocket motor detonation at UTTR. .....................................3 3. Earthquake and mining events observed in and around Utah ....................................4 4. Two of the close-in installations, UTTR1 and UTTR 2. ............................................8 5a. The array configuration of the NOQ infrasound array.................................................9 5b. Photos documenting the installation of the infrasound array, NOQ ..........................9 6. Infrasound array configuration at HVU....................................................................10 7. The EarthScope site P13 in Southwest Utah ............................................................11 8. Balloon before and after launch................................................................................12 9. A record section of a portion of the infrasound waveforms from the 27
August 2007 UTTR detonation.................................................................................13 10. Record section of seismic waveforms ......................................................................14 11. Near-source acoustic and seismic signals recorded at UTTR3.................................15 12. Near-source acoustic and seismic signals recorded at EPU......................................15 13. Infrasound signals for the four UTTR explosions observed at N12 .........................16 14. Atmospheric velocity profile along the direction to N12 based on data
gathered from the balloon launches at the time of the four UTTR explosions.........17 15. Seismic record from the Crandall Mine Collapse.....................................................18 16. Seismic record from the magnitude 3.9 earthquake..................................................18 17. IML infrasound gauge...............................................................................................19 18. Response of the Chaparral 2, unfiltered IML and filtered IML................................20 19. Comparison of IML output (unfiltered), Chaparral output (reference, high
pass filtered at 10 s) and IML output .......................................................................21 20. Location of two sources of infrasound signal observed at the NOQ.
Bingham Canyon Mine . ...........................................................................................22 21. Mining blast signal detonated at Bingham open-pit copper mine ............................22 22. Infrasound signals recorded at NOQ........................................................................ 23 23. Infrasound signals observed on the seismic channels at the station SPU.................23 24. Ray tracing results using the MSIS/HWM ...............................................................24 25. Observation of the 4 June 2007 UTTR explosion at the array BGU........................25 26. Observation of the 4 June 2007 UTTR explosion at the array NOQ........................25 27. Record section of seismic stations from the UUSS regional network .....................26

vi
vii
Tables
1a. Acoustic Stations ..................................................................................................... 6 1b. Seismic Stations ....................................................................................................... 7 2. Details of three semi-permanent infrasound arrays ................................................... 9 3. Balloon Launch Times ............................................................................................. 12

viii

1
1. SUMMARY
As noted in the proposal that initiated this research effort, there are unanswered critical questions on the phenomenology surrounding the generation and local-to-regional distance propagation of seismic and low frequency acoustic energy from shallow sources (industrial and mining explosions, chemical test explosions, underground mine related stress release, and earthquakes) that impact the use of observations for source identification, location and characterization in areas with little ground truth. While there have been extensive seismic and acoustic observations of shallow sources (McKenna, 2005; Mutschlecner and Whitaker, 2005; ReVelle, 2004; Patton et al., 2003; Yang et al., 1999 and Dighe et al., 1998) these have been limited in most cases to a moderate number of short-term stations for a single group of events or have focused on signals from one location into one possibly augmented array. Therefore, there is a need to extend the previous observational and theoretical studies using dense networks of simultaneous seismic and infrasound observations of a wide variety of sources at local and regional distances. The acquisition of a dense profile of observations along one or more profiles that characterize the wavefield transition from local to regional distances is a critical component needed to understand seismic and infrasound propagation. Ground truth provides source constraints that are necessary for unique interpretations.
The Defense Threat Reduction Agency (DTRA) planned detonation of approximately 700 tons of explosives in Area-16 of the NTS was to provide the opportunity to gather such a dataset. On 22 February 2007, DTRA announced the cancellation of the Divine Strake explosion. During the preparation for the Divine Strake experiment and as a result of a single infrasound array and seismic network across Utah, a number of large and consistent infrasound sources have been identified and characterized. These preliminary efforts have resulted in the identification of regular (over 21 recorded) and large (40,000-80,000 lbs) surface explosions at the Utah Test and Training Range (UTTR) of the Hill AFB. These sources produced excellent near-regional seismic and infrasound signals that are stored at the IRIS DMC. Our group has cooperated with the group at Hill AFB and has made use of atmospheric profiles that are regularly taken by the AF in this modeling exercise (documented in our annual report). Additional sources of infrasound such as mining explosions were also documented.
Based upon this unexpected source of large, surface explosions and the close cooperation between the AF and our group, the initial goals of our project were reached by shifting our focus to these new sources in Utah. The rocket motor explosions, unlike the single Divine Strake explosion, occur about every week providing an opportunity to develop seismic and infrasound recordings under a wide range of atmospheric conditions. Cooperation with the AF provided the necessary atmospheric data needed for modeling supplemented by additional profiles collected by our consortium. Our consortium redesigned the regional experimental deployment to take advantage of the regular rocket motor explosions at UTTR and implement the experiment in the summer of 2007. Eleven single infrasound systems and six infrasound arrays were deployed at existing seismic sites in Utah in order to gather the comprehensive set of seismic and infrasound recordings from the rocket motor explosions. Infrasound, seismic and atmospheric data recorded during this experiment that took place during the month of August 2007 are summarized in this final report. Limited preliminary analysis of the data is also included. The complete data set has now been delivered to the IRIS DMC.
2
2. OBJECTIVES
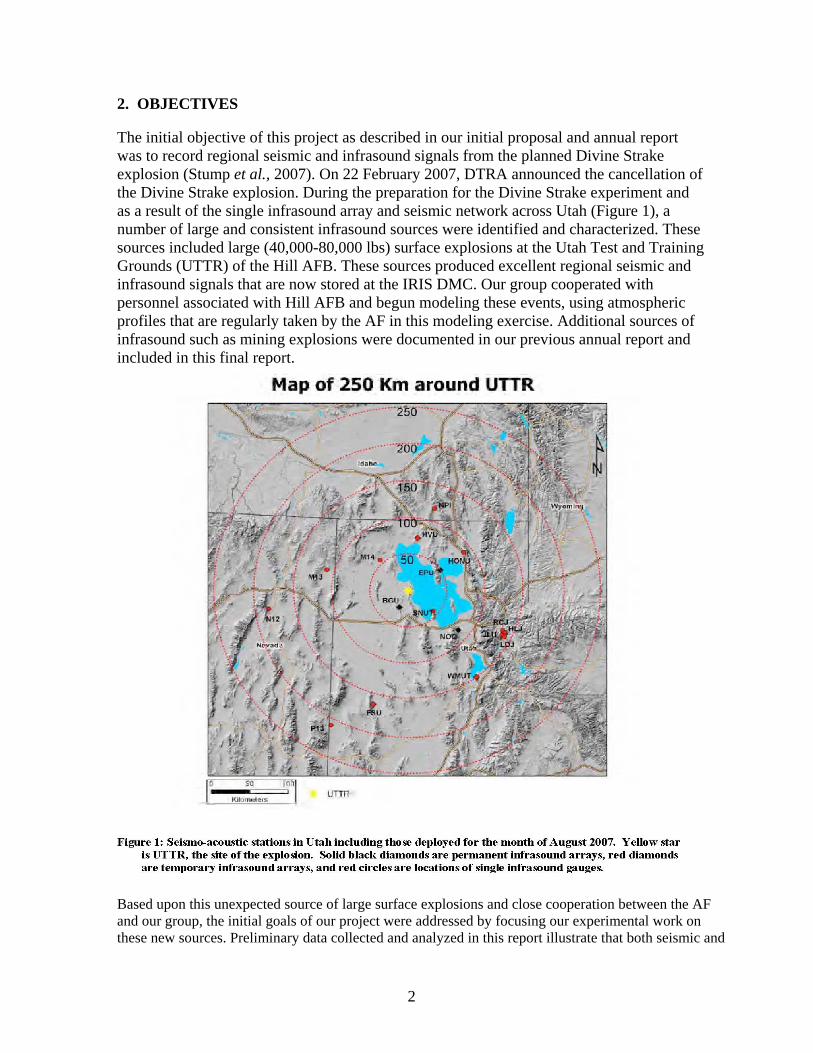
The initial objective of this project as described in our initial proposal and annual report was to record regional seismic and infrasound signals from the planned Divine Strake explosion (Stump et al., 2007). On 22 February 2007, DTRA announced the cancellation of the Divine Strake explosion. During the preparation for the Divine Strake experiment and as a result of the single infrasound array and seismic network across Utah (Figure 1), a number of large and consistent infrasound sources were identified and characterized. These sources included large (40,000-80,000 lbs) surface explosions at the Utah Test and Training Grounds (UTTR) of the Hill AFB. These sources produced excellent regional seismic and infrasound signals that are now stored at the IRIS DMC. Our group cooperated with personnel associated with Hill AFB and begun modeling these events, using atmospheric profiles that are regularly taken by the AF in this modeling exercise. Additional sources of infrasound such as mining explosions were documented in our previous annual report and included in this final report.
Based upon this unexpected source of large surface explosions and close cooperation between the AF and our group, the initial goals of our project were addressed by focusing our experimental work on these new sources. Preliminary data collected and analyzed in this report illustrate that both seismic and
3
infrasound signals are observed at the distances of interest to our proposal as it was funded. The rocket motor explosions, unlike the single Divine Strake explosion, occur about every week providing an opportunity to develop seismic and infrasound recordings with a range of atmospheric conditions. Cooperation with the AF together with our own atmospheric profiling provided the necessary atmospheric data needed for modeling.
As a result of preparations for Divine Strake two, four-element infrasound arrays were deployed at seismic sites BGU and NOQ both part of the University of Utah Seismograph Stations (UUSS) regional network (Figure 1). One additional array was installed at a third site, EPU. These three arrays are all telemetered in real-time to the University of Utah. NOQ has operated for over one year and regularly records seismic and infrasound signals from UTTR rocket motor detonations as well as numerous explosions from nearby mining operations. Initial signals recorded at this array originally identified the rocket motor detonations and became the motivation for the broader experimental deployment in August 2007.
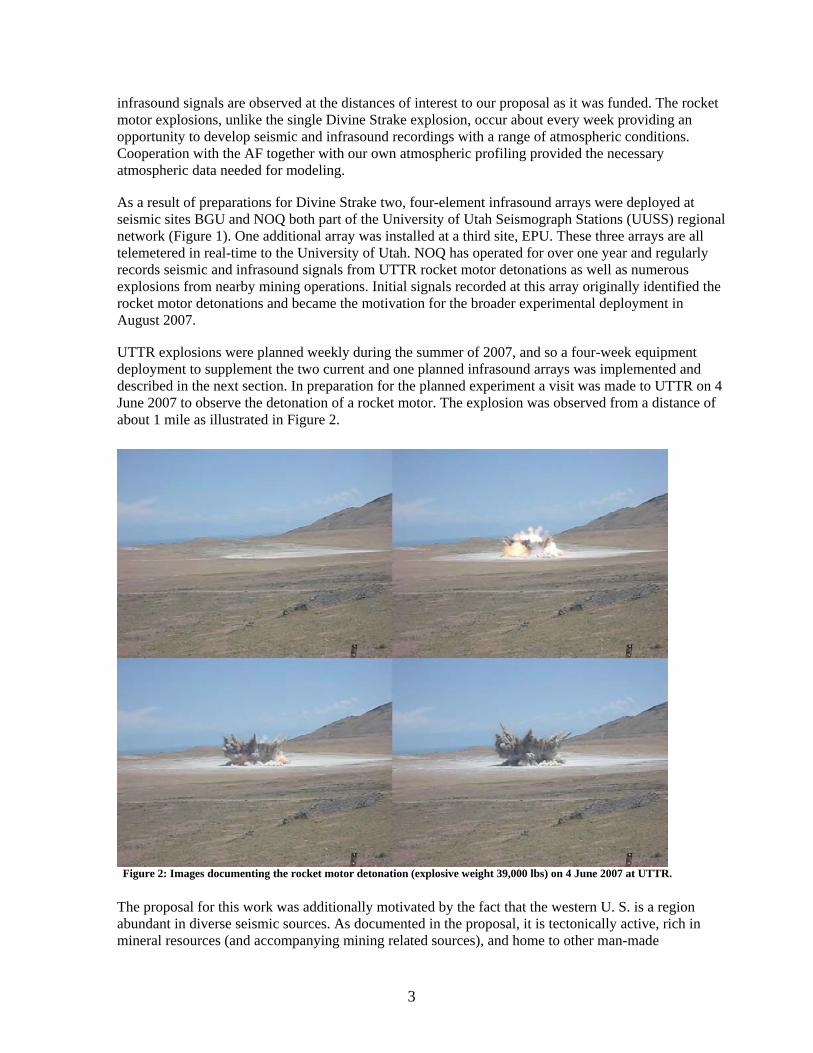
UTTR explosions were planned weekly during the summer of 2007, and so a four-week equipment deployment to supplement the two current and one planned infrasound arrays was implemented and described in the next section. In preparation for the planned experiment a visit was made to UTTR on 4 June 2007 to observe the detonation of a rocket motor. The explosion was observed from a distance of about 1 mile as illustrated in Figure 2.
1Figure 2: Images documenting the rocket motor detonation (explosive weight 39,000 lbs) on 4 June 2007 at UTTR. The proposal for this work was additionally motivated by the fact that the western U. S. is a region abundant in diverse seismic sources. As documented in the proposal, it is tectonically active, rich in mineral resources (and accompanying mining related sources), and home to other man-made
4
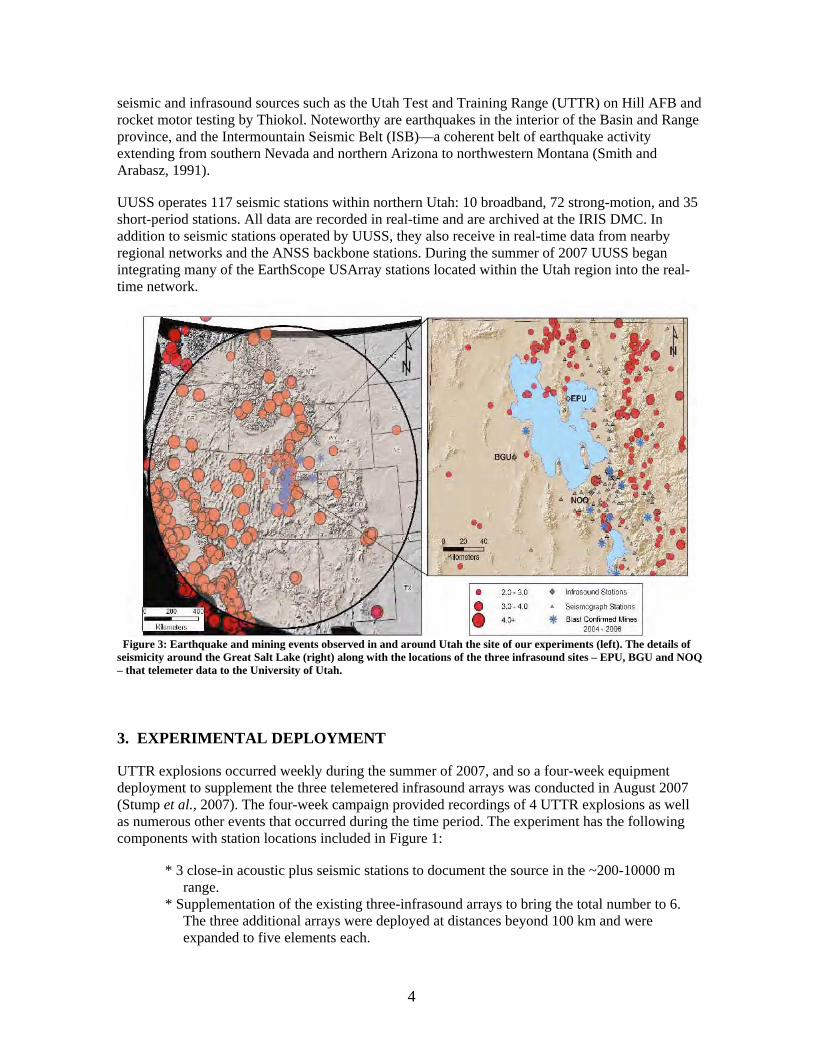
seismic and infrasound sources such as the Utah Test and Training Range (UTTR) on Hill AFB and rocket motor testing by Thiokol. Noteworthy are earthquakes in the interior of the Basin and Range province, and the Intermountain Seismic Belt (ISB)—a coherent belt of earthquake activity extending from southern Nevada and northern Arizona to northwestern Montana (Smith and Arabasz, 1991).
UUSS operates 117 seismic stations within northern Utah: 10 broadband, 72 strong-motion, and 35 short-period stations. All data are recorded in real-time and are archived at the IRIS DMC. In addition to seismic stations operated by UUSS, they also receive in real-time data from nearby regional networks and the ANSS backbone stations. During the summer of 2007 UUSS began integrating many of the EarthScope USArray stations located within the Utah region into the real-time network.
2Figure 3: Earthquake and mining events observed in and around Utah the site of our experiments (left). The details of seismicity around the Great Salt Lake (right) along with the locations of the three infrasound sites – EPU, BGU and NOQ – that telemeter data to the University of Utah.
3. EXPERIMENTAL DEPLOYMENT
UTTR explosions occurred weekly during the summer of 2007, and so a four-week equipment deployment to supplement the three telemetered infrasound arrays was conducted in August 2007 (Stump et al., 2007). The four-week campaign provided recordings of 4 UTTR explosions as well as numerous other events that occurred during the time period. The experiment has the following components with station locations included in Figure 1:
* 3 close-in acoustic plus seismic stations to document the source in the ~200-10000 m range.
* Supplementation of the existing three-infrasound arrays to bring the total number to 6. The three additional arrays were deployed at distances beyond 100 km and were expanded to five elements each.

5
* Addition of a single infrasound sensor at 4 EarthScope USArray and 7 UUSS sites in order to quantify infrasound to seismic coupling as well as expand the number of azimuths and ranges that recorded infrasound signals.
* Balloon launches and atmospheric sampling before and after every explosion. * Video and photo documentation of explosions.
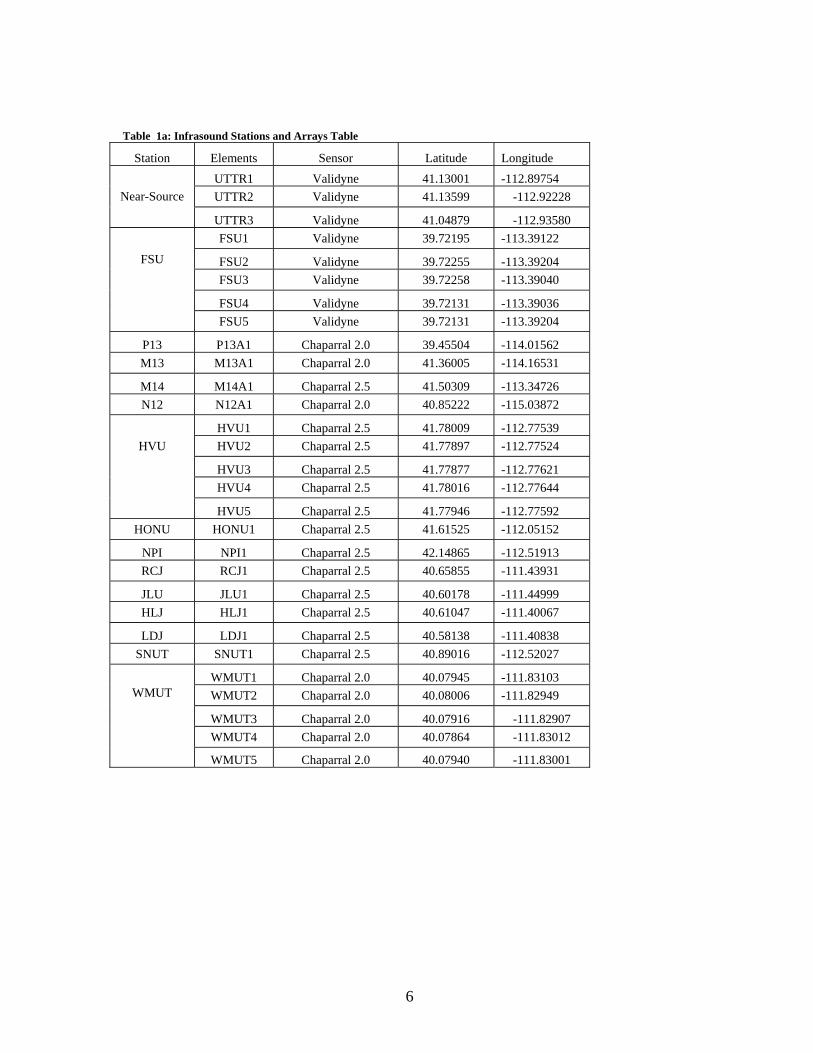
The details of the station locations and sensors deployed are summarized in Table 1a (infrasound) and 1b (seismic).
6
1Table 1a: Infrasound Stations and Arrays Table
Station Elements Sensor Latitude Longitude UTTR1 Validyne 41.13001 -112.89754 UTTR2 Validyne 41.13599 -112.92228 Near-Source
UTTR3 Validyne 41.04879 -112.93580 FSU1 Validyne 39.72195 -113.39122
FSU FSU2 Validyne 39.72255 -113.39204 FSU3 Validyne 39.72258 -113.39040
FSU4 Validyne 39.72131 -113.39036 FSU5 Validyne 39.72131 -113.39204
P13 P13A1 Chaparral 2.0 39.45504 -114.01562 M13 M13A1 Chaparral 2.0 41.36005 -114.16531
M14 M14A1 Chaparral 2.5 41.50309 -113.34726 N12 N12A1 Chaparral 2.0 40.85222 -115.03872
HVU1 Chaparral 2.5 41.78009 -112.77539 HVU HVU2 Chaparral 2.5 41.77897 -112.77524
HVU3 Chaparral 2.5 41.77877 -112.77621 HVU4 Chaparral 2.5 41.78016 -112.77644
HVU5 Chaparral 2.5 41.77946 -112.77592 HONU HONU1 Chaparral 2.5 41.61525 -112.05152
NPI NPI1 Chaparral 2.5 42.14865 -112.51913 RCJ RCJ1 Chaparral 2.5 40.65855 -111.43931
JLU JLU1 Chaparral 2.5 40.60178 -111.44999 HLJ HLJ1 Chaparral 2.5 40.61047 -111.40067
LDJ LDJ1 Chaparral 2.5 40.58138 -111.40838 SNUT SNUT1 Chaparral 2.5 40.89016 -112.52027
WMUT1 Chaparral 2.0 40.07945 -111.83103 WMUT2 Chaparral 2.0 40.08006 -111.82949
WMUT3 Chaparral 2.0 40.07916 -111.82907 WMUT4 Chaparral 2.0 40.07864 -111.83012
WMUT
WMUT5 Chaparral 2.0 40.07940 -111.83001
7
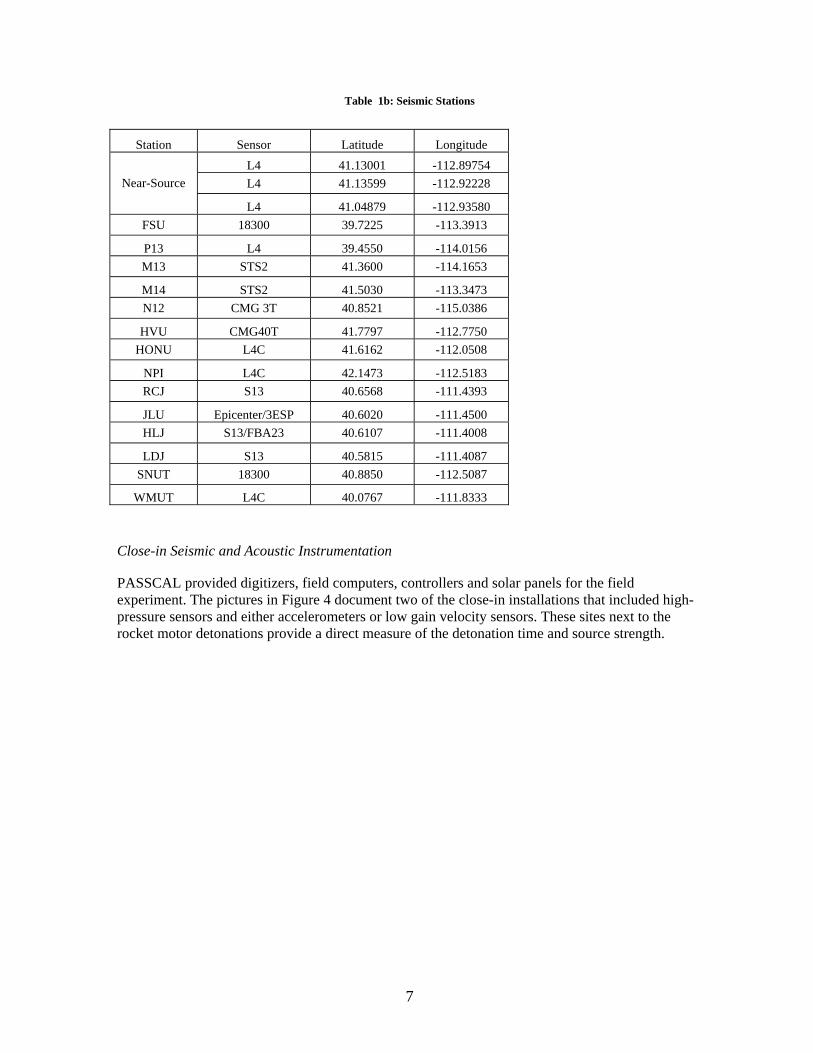
Table 1b: Seismic Stations
Station Sensor Latitude Longitude L4 41.13001 -112.89754 L4 41.13599 -112.92228 Near-Source
L4 41.04879 -112.93580 FSU 18300 39.7225 -113.3913
P13 L4 39.4550 -114.0156 M13 STS2 41.3600 -114.1653
M14 STS2 41.5030 -113.3473 N12 CMG 3T 40.8521 -115.0386
HVU CMG40T 41.7797 -112.7750 HONU L4C 41.6162 -112.0508
NPI L4C 42.1473 -112.5183 RCJ S13 40.6568 -111.4393
JLU Epicenter/3ESP 40.6020 -111.4500 HLJ S13/FBA23 40.6107 -111.4008
LDJ S13 40.5815 -111.4087 SNUT 18300 40.8850 -112.5087
WMUT L4C 40.0767 -111.8333 Close-in Seismic and Acoustic Instrumentation
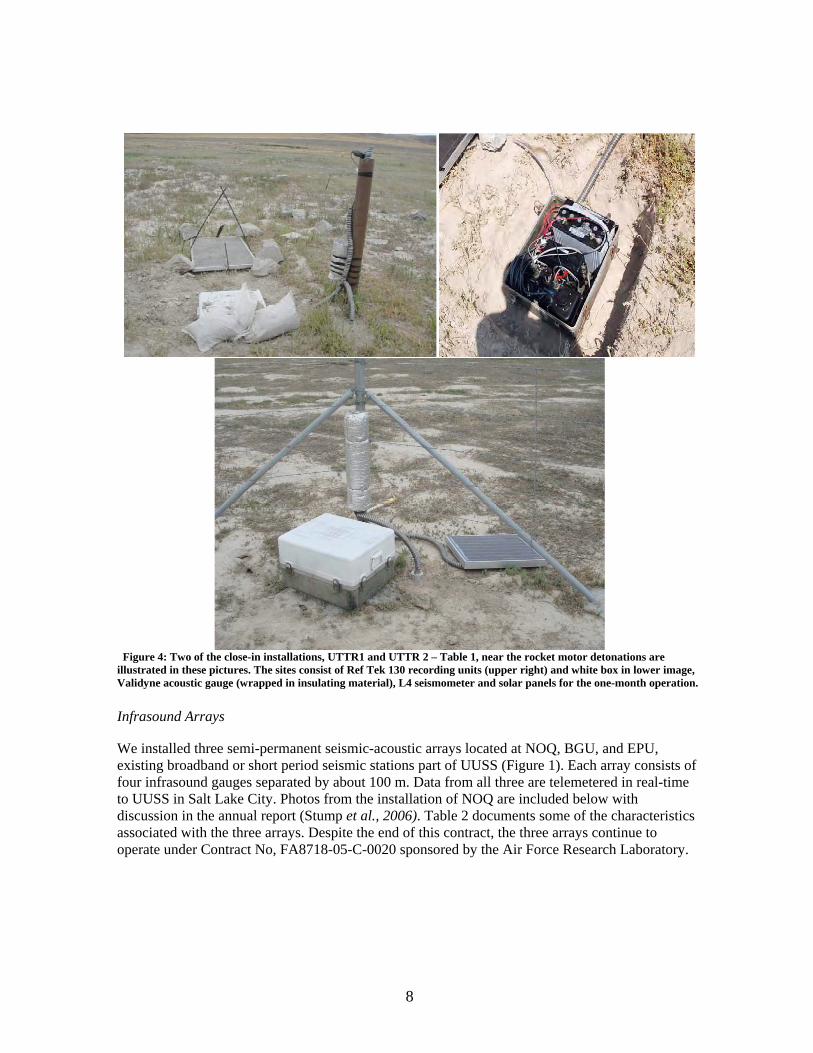
PASSCAL provided digitizers, field computers, controllers and solar panels for the field experiment. The pictures in Figure 4 document two of the close-in installations that included high-pressure sensors and either accelerometers or low gain velocity sensors. These sites next to the rocket motor detonations provide a direct measure of the detonation time and source strength.
8
3Figure 4: Two of the close-in installations, UTTR1 and UTTR 2 – Table 1, near the rocket motor detonations are illustrated in these pictures. The sites consist of Ref Tek 130 recording units (upper right) and white box in lower image, Validyne acoustic gauge (wrapped in insulating material), L4 seismometer and solar panels for the one-month operation. Infrasound Arrays
We installed three semi-permanent seismic-acoustic arrays located at NOQ, BGU, and EPU, existing broadband or short period seismic stations part of UUSS (Figure 1). Each array consists of four infrasound gauges separated by about 100 m. Data from all three are telemetered in real-time to UUSS in Salt Lake City. Photos from the installation of NOQ are included below with discussion in the annual report (Stump et al., 2006). Table 2 documents some of the characteristics associated with the three arrays. Despite the end of this contract, the three arrays continue to operate under Contract No, FA8718-05-C-0020 sponsored by the Air Force Research Laboratory.

9
4Figure 5a: The array configuration of the NOQ infrasound array. Absolute location in Figure 1.
Figure 5b: Photos documenting the installation of the infrasound array, NOQ. 2Table 2: Details of three semi-permanent infrasound arrays. NOQ Array BGU Array EPU Array Number of elements 4 4 4 Sensor type Chaparral 2 Chaparral 2 Chaparral 2.5 Digitizer Ref Tek 130 Ref Tek 130 Ref Tek 130 Telemetry Yes Yes Yes Aperture (m) 161 x 122 136 x 139 159 x 121 Average distance between sensors (m)
118 115 119
Installation date 4 May 2006 17 April 2007 July 2007 Type of collocated seismic sensor
Broadband Broadband Short period
Start date of archived data at IRIS DMC
4 May 2006 N/A N/A
10
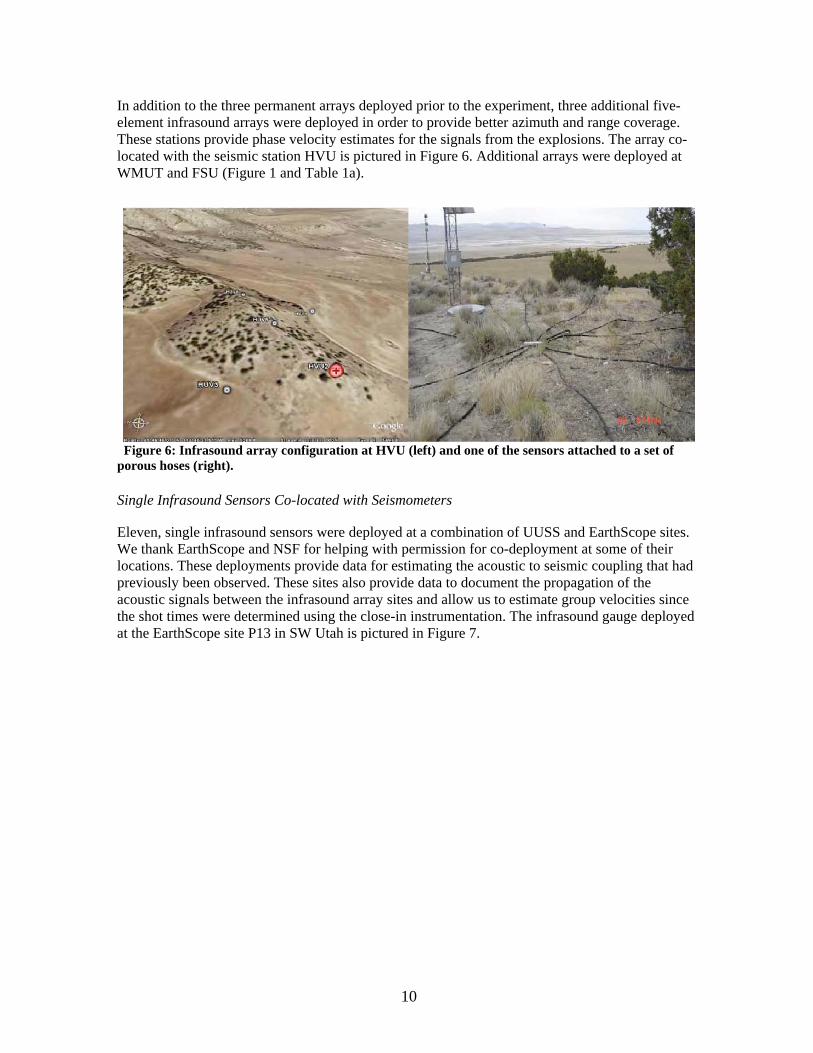
In addition to the three permanent arrays deployed prior to the experiment, three additional five-element infrasound arrays were deployed in order to provide better azimuth and range coverage. These stations provide phase velocity estimates for the signals from the explosions. The array co-located with the seismic station HVU is pictured in Figure 6. Additional arrays were deployed at WMUT and FSU (Figure 1 and Table 1a).
5Figure 6: Infrasound array configuration at HVU (left) and one of the sensors attached to a set of porous hoses (right). Single Infrasound Sensors Co-located with Seismometers
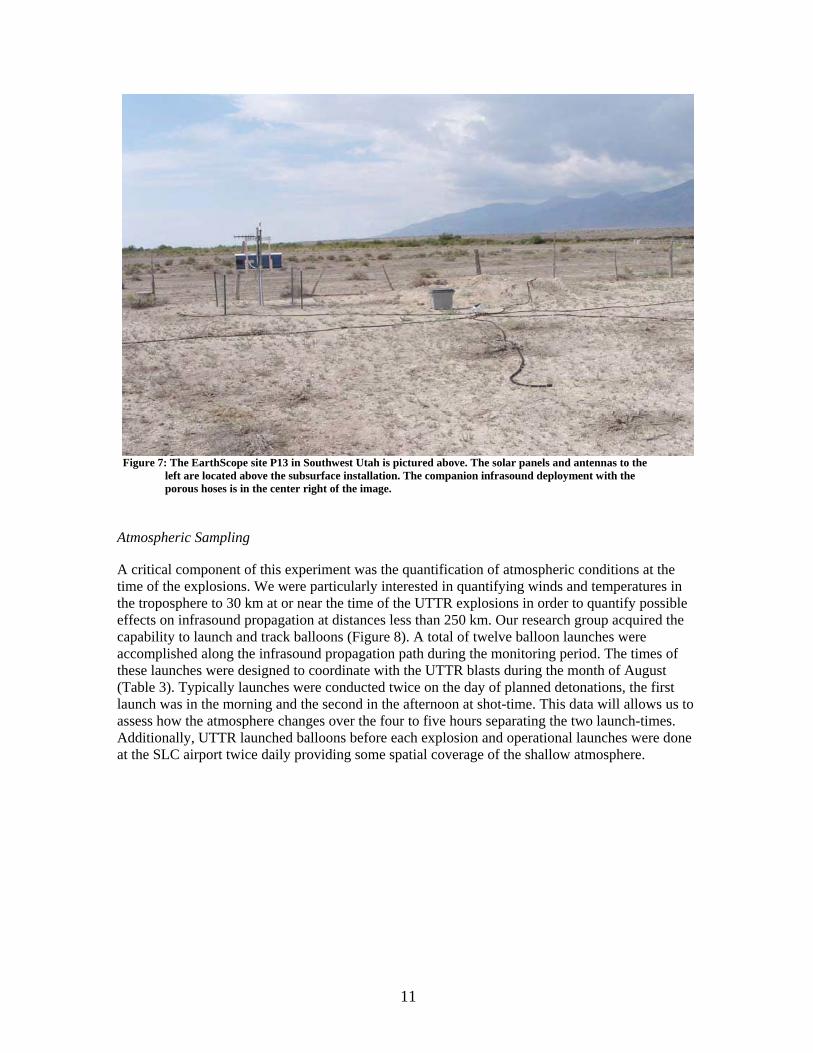
Eleven, single infrasound sensors were deployed at a combination of UUSS and EarthScope sites. We thank EarthScope and NSF for helping with permission for co-deployment at some of their locations. These deployments provide data for estimating the acoustic to seismic coupling that had previously been observed. These sites also provide data to document the propagation of the acoustic signals between the infrasound array sites and allow us to estimate group velocities since the shot times were determined using the close-in instrumentation. The infrasound gauge deployed at the EarthScope site P13 in SW Utah is pictured in Figure 7.
11
6Figure 7: The EarthScope site P13 in Southwest Utah is pictured above. The solar panels and antennas to the
left are located above the subsurface installation. The companion infrasound deployment with the porous hoses is in the center right of the image.
Atmospheric Sampling
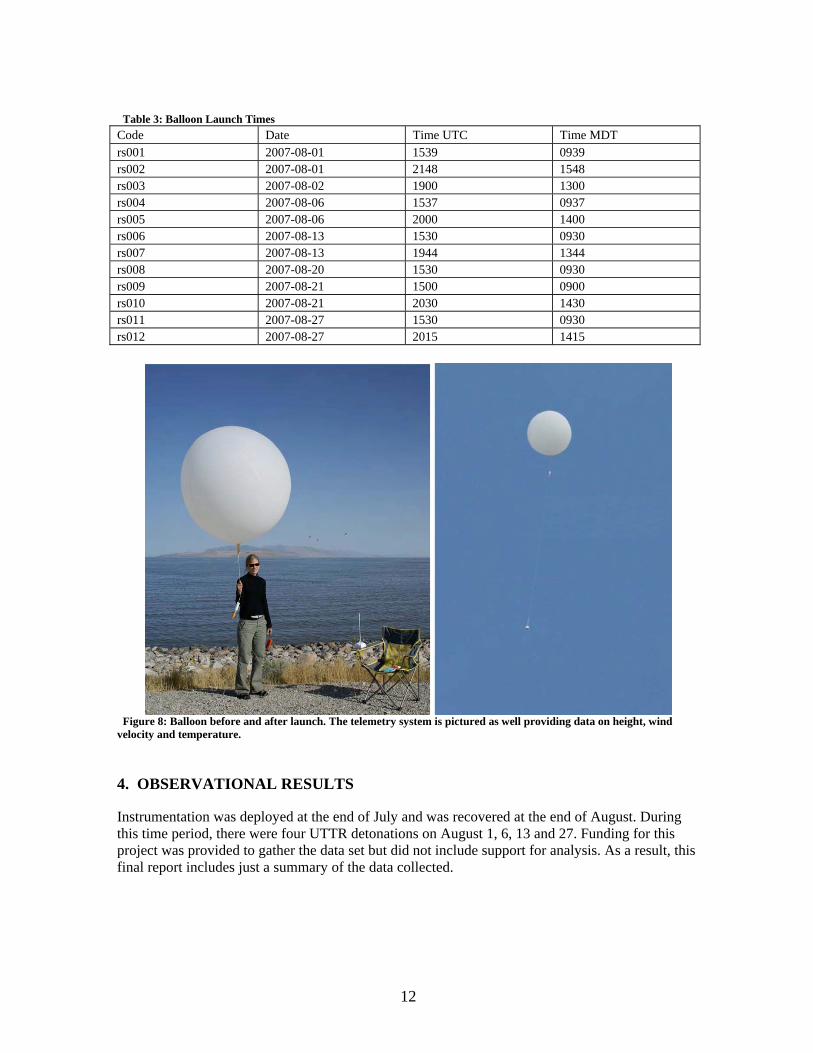
A critical component of this experiment was the quantification of atmospheric conditions at the time of the explosions. We were particularly interested in quantifying winds and temperatures in the troposphere to 30 km at or near the time of the UTTR explosions in order to quantify possible effects on infrasound propagation at distances less than 250 km. Our research group acquired the capability to launch and track balloons (Figure 8). A total of twelve balloon launches were accomplished along the infrasound propagation path during the monitoring period. The times of these launches were designed to coordinate with the UTTR blasts during the month of August (Table 3). Typically launches were conducted twice on the day of planned detonations, the first launch was in the morning and the second in the afternoon at shot-time. This data will allows us to assess how the atmosphere changes over the four to five hours separating the two launch-times. Additionally, UTTR launched balloons before each explosion and operational launches were done at the SLC airport twice daily providing some spatial coverage of the shallow atmosphere.
12
3Table 3: Balloon Launch Times Code Date Time UTC Time MDT rs001 2007-08-01 1539 0939 rs002 2007-08-01 2148 1548 rs003 2007-08-02 1900 1300 rs004 2007-08-06 1537 0937 rs005 2007-08-06 2000 1400 rs006 2007-08-13 1530 0930 rs007 2007-08-13 1944 1344 rs008 2007-08-20 1530 0930 rs009 2007-08-21 1500 0900 rs010 2007-08-21 2030 1430 rs011 2007-08-27 1530 0930 rs012 2007-08-27 2015 1415
7Figure 8: Balloon before and after launch. The telemetry system is pictured as well providing data on height, wind velocity and temperature.
4. OBSERVATIONAL RESULTS
Instrumentation was deployed at the end of July and was recovered at the end of August. During this time period, there were four UTTR detonations on August 1, 6, 13 and 27. Funding for this project was provided to gather the data set but did not include support for analysis. As a result, this final report includes just a summary of the data collected.
13
Rocket Motor Detonations
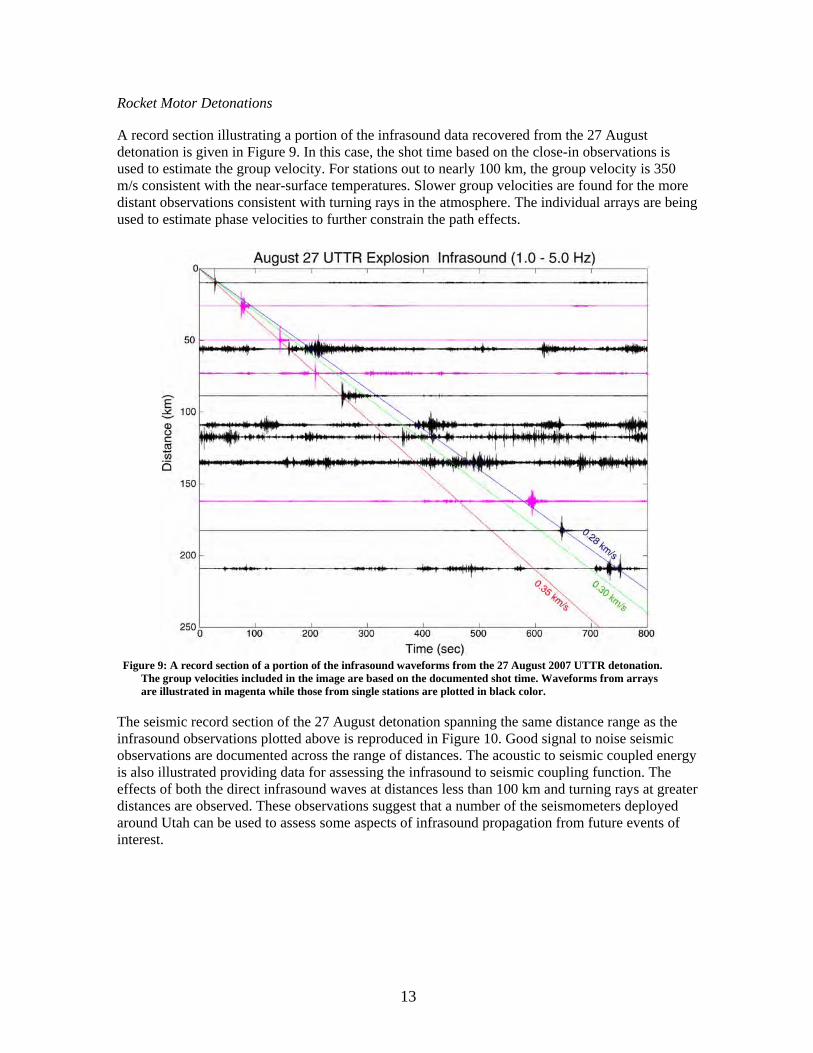
A record section illustrating a portion of the infrasound data recovered from the 27 August detonation is given in Figure 9. In this case, the shot time based on the close-in observations is used to estimate the group velocity. For stations out to nearly 100 km, the group velocity is 350 m/s consistent with the near-surface temperatures. Slower group velocities are found for the more distant observations consistent with turning rays in the atmosphere. The individual arrays are being used to estimate phase velocities to further constrain the path effects.
8Figure 9: A record section of a portion of the infrasound waveforms from the 27 August 2007 UTTR detonation.
The group velocities included in the image are based on the documented shot time. Waveforms from arrays are illustrated in magenta while those from single stations are plotted in black color.
The seismic record section of the 27 August detonation spanning the same distance range as the infrasound observations plotted above is reproduced in Figure 10. Good signal to noise seismic observations are documented across the range of distances. The acoustic to seismic coupled energy is also illustrated providing data for assessing the infrasound to seismic coupling function. The effects of both the direct infrasound waves at distances less than 100 km and turning rays at greater distances are observed. These observations suggest that a number of the seismometers deployed around Utah can be used to assess some aspects of infrasound propagation from future events of interest.

14
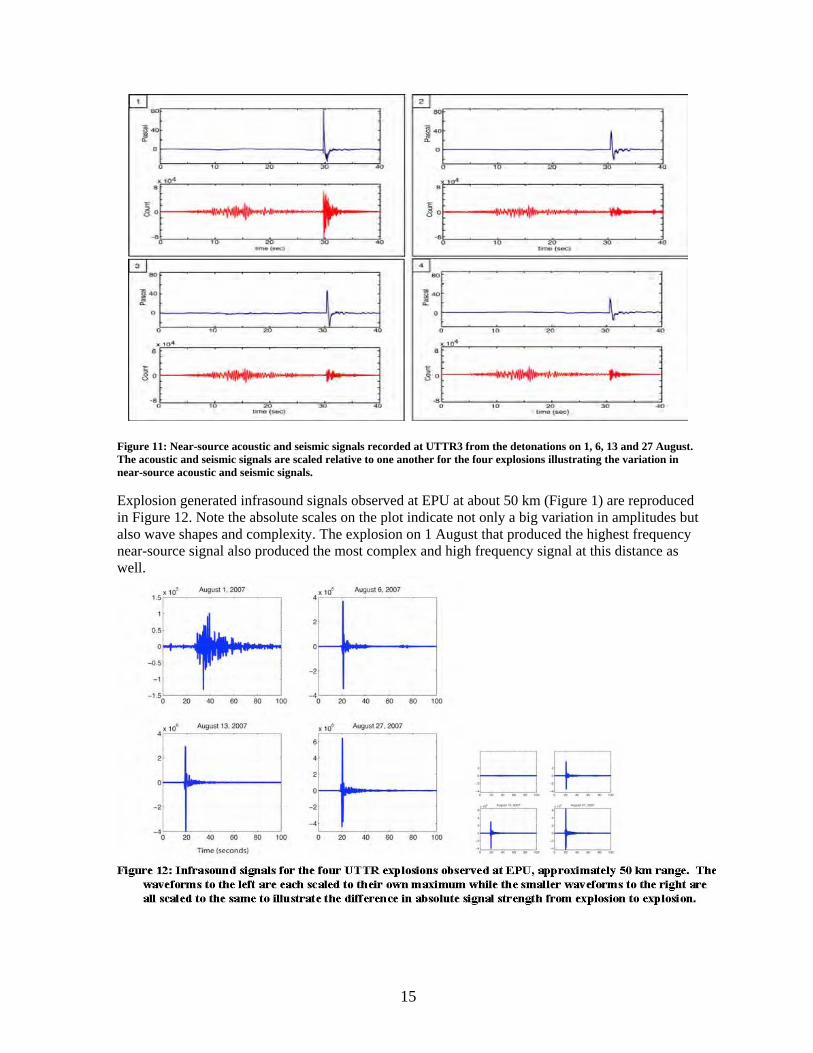
9 Close-in seismic and acoustic measurements at distances from ~200 m to 10 km were used to assess shot time and source coupling. Seismic and acoustic records at 10 km are displayed in Figure 11 for the Aug 1 (1), Aug 6 (2), Aug 13 (3), and Aug 27 (4) UTTR detonations, all the same yield. Strong variations in amplitude and frequency content for the acoustic signals are documented while there are much smaller differences in the seismic signals from the similar explosions.
15
Figure 11: Near-source acoustic and seismic signals recorded at UTTR3 from the detonations on 1, 6, 13 and 27 August. The acoustic and seismic signals are scaled relative to one another for the four explosions illustrating the variation in near-source acoustic and seismic signals. 10 Near-source acoustic and seismic signals recorded at UTTR3 Explosion generated infrasound signals observed at EPU at about 50 km (Figure 1) are reproduced in Figure 12. Note the absolute scales on the plot indicate not only a big variation in amplitudes but also wave shapes and complexity. The explosion on 1 August that produced the highest frequency near-source signal also produced the most complex and high frequency signal at this distance as well.
11Infrasound signals from the four UTTR explosions observed at station N12
16
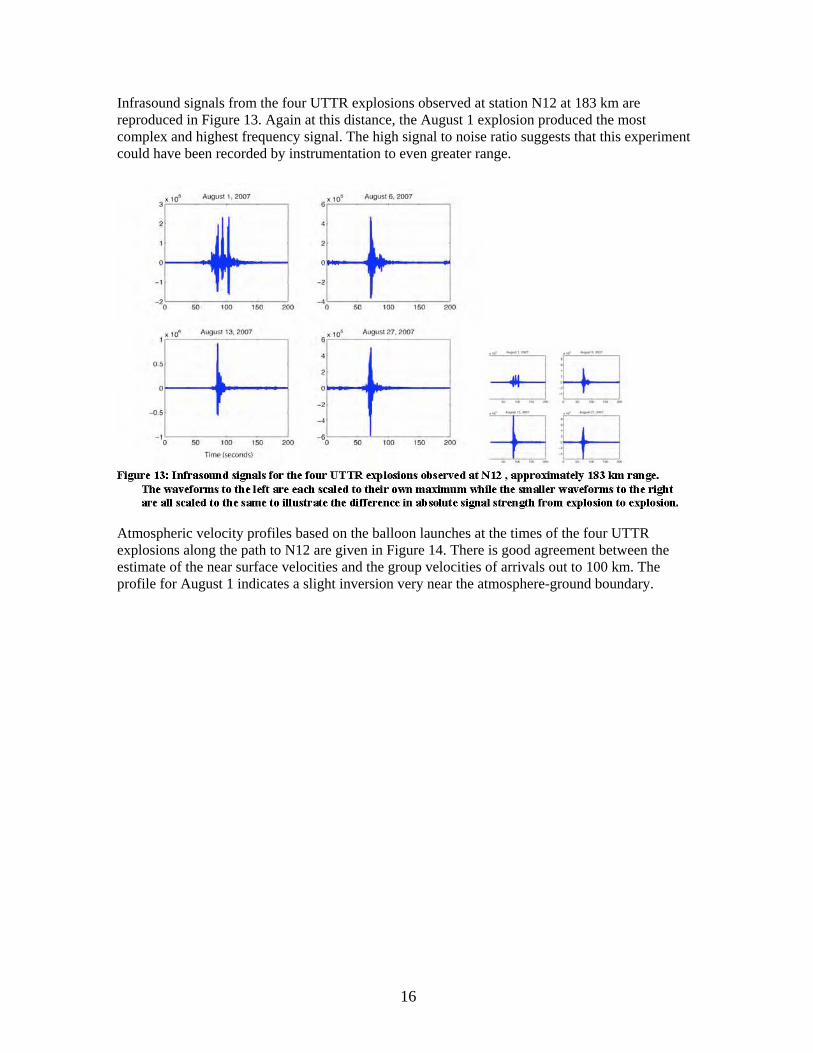
Infrasound signals from the four UTTR explosions observed at station N12 at 183 km are reproduced in Figure 13. Again at this distance, the August 1 explosion produced the most complex and highest frequency signal. The high signal to noise ratio suggests that this experiment could have been recorded by instrumentation to even greater range.
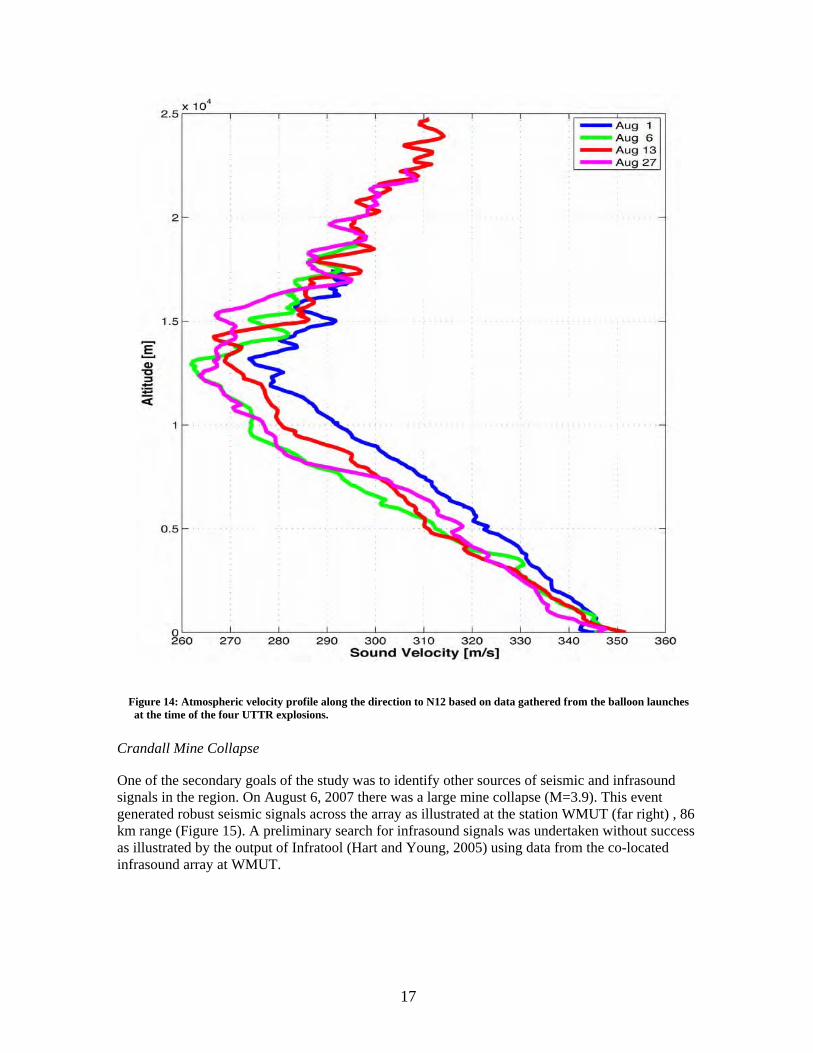
12Infrasound signals for the four UTTR explosions observed at N12 Atmospheric velocity profiles based on the balloon launches at the times of the four UTTR explosions along the path to N12 are given in Figure 14. There is good agreement between the estimate of the near surface velocities and the group velocities of arrivals out to 100 km. The profile for August 1 indicates a slight inversion very near the atmosphere-ground boundary.
17
13Figure 14: Atmospheric velocity profile along the direction to N12 based on data gathered from the balloon launches at the time of the four UTTR explosions. Crandall Mine Collapse
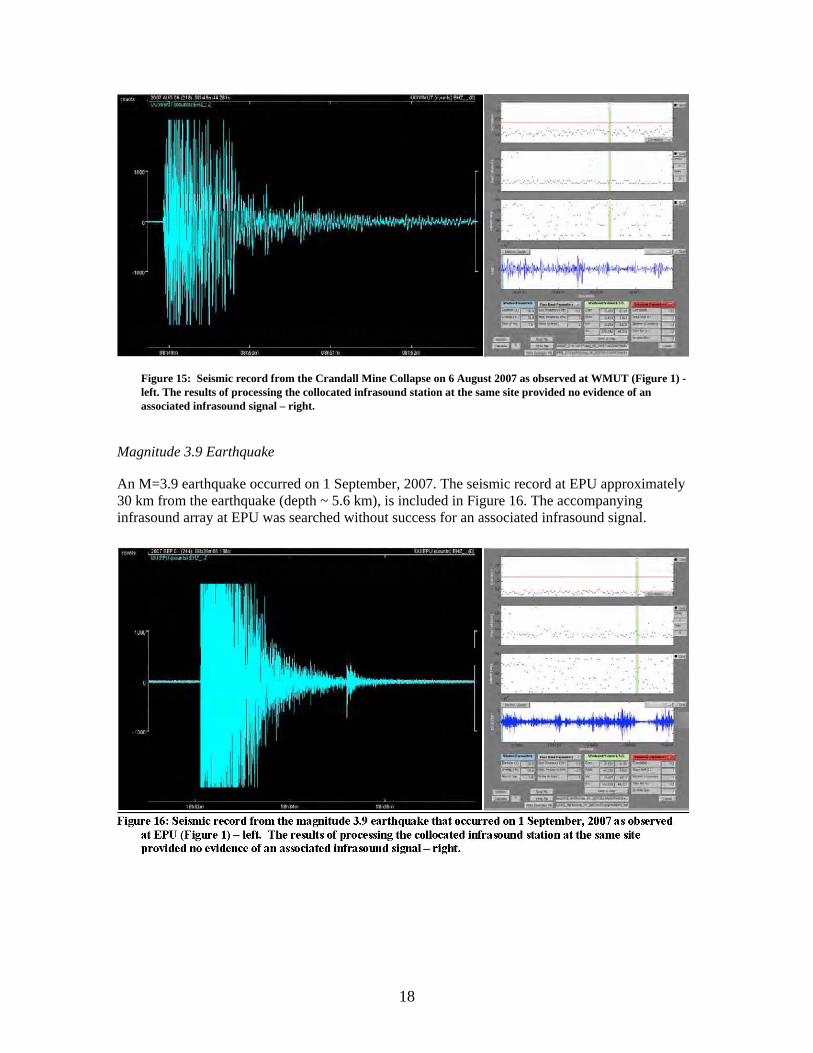
One of the secondary goals of the study was to identify other sources of seismic and infrasound signals in the region. On August 6, 2007 there was a large mine collapse (M=3.9). This event generated robust seismic signals across the array as illustrated at the station WMUT (far right) , 86 km range (Figure 15). A preliminary search for infrasound signals was undertaken without success as illustrated by the output of Infratool (Hart and Young, 2005) using data from the co-located infrasound array at WMUT.
18
Figure 15: Seismic record from the Crandall Mine Collapse on 6 August 2007 as observed at WMUT (Figure 1) - left. The results of processing the collocated infrasound station at the same site provided no evidence of an associated infrasound signal – right.
14Seismic record from the Crandall Mine Collapse Magnitude 3.9 Earthquake
An M=3.9 earthquake occurred on 1 September, 2007. The seismic record at EPU approximately 30 km from the earthquake (depth ~ 5.6 km), is included in Figure 16. The accompanying infrasound array at EPU was searched without success for an associated infrasound signal.
15Seismic record from the magnitude 3.9 earthquake
19
5. RESEARCH RESULTS
Research during the contract focused in three areas and was reported in Stump et al., (2006, 2007). This section includes these previous results in the final report for completeness.. In order to deploy a substantial number of infrasound gauges to document the regional propagation path effects it was necessary to acquire and characterize a new and cost effective acoustic gauge. Second, while waiting for the Divine Strake experiment to occur three infrasound arrays were deployed in Utah. Preliminary analysis and modeling of data recorded at one of these arrays identified a number of interesting infrasound sources. Finally, as a result of the cancellation of Divine Strake and the identification of the large surface explosions at UTTR, an experiment was designed to document UTTR detonations in the summer of 2007. A visit to UTTR for the June 4, 2007 rocket motor explosion (Figure 2) provided preliminary data used to complete the planning for the experiment.
New Infrasound Gauges
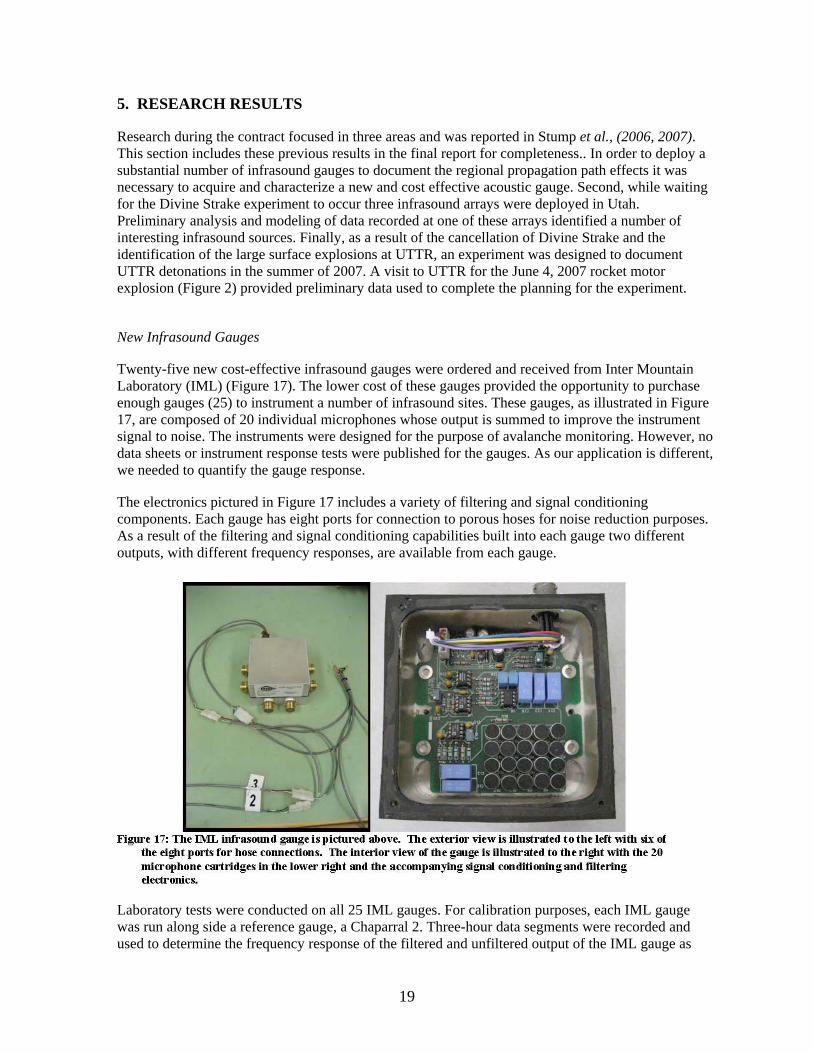
Twenty-five new cost-effective infrasound gauges were ordered and received from Inter Mountain Laboratory (IML) (Figure 17). The lower cost of these gauges provided the opportunity to purchase enough gauges (25) to instrument a number of infrasound sites. These gauges, as illustrated in Figure 17, are composed of 20 individual microphones whose output is summed to improve the instrument signal to noise. The instruments were designed for the purpose of avalanche monitoring. However, no data sheets or instrument response tests were published for the gauges. As our application is different, we needed to quantify the gauge response.
The electronics pictured in Figure 17 includes a variety of filtering and signal conditioning components. Each gauge has eight ports for connection to porous hoses for noise reduction purposes. As a result of the filtering and signal conditioning capabilities built into each gauge two different outputs, with different frequency responses, are available from each gauge.
16IML infrasound gauge Laboratory tests were conducted on all 25 IML gauges. For calibration purposes, each IML gauge was run along side a reference gauge, a Chaparral 2. Three-hour data segments were recorded and used to determine the frequency response of the filtered and unfiltered output of the IML gauge as

20
well as the response of the Chaparral 2 for comparison (Figure 18 – left). The data were also used to compute the coherence of the IML filtered and unfiltered outputs with the reference Chaparral 2 output (Figure 18 – right). The Chaparral 2 has a broader band response (Figure 18) but there is great similarity between the IML and the Chaparral 2 in the important band of 1-10 Hz. The high coherence between the Chaparral 2 and the unfiltered IML to nearly 50 s and to below 10 s with the filtered IML output suggests that, despite the difference in responses, the IML gauge can be utilized to retrieve signals below 1 Hz.
17Response of the Chaparral 2, unfiltered IML and filtered IML Similar tests were conducted on all 25 gauges. Results from these tests indicate that the response and coherence estimates for the one gauge in Figure 18 are similar for all 25 gauges. A theoretical transfer function for the IML gauge was developed as part of the analysis. The IML response was removed from the data taken during the laboratory tests and the resulting output convolved with the known Chaparral response. As illustrated in Figure 19, the observed Chaparral data (high pass filtered at 10 s) are reproduced by this deconvolution followed by convolution procedure.

21
18Figure 19: Comparison of IML output (unfiltered), Chaparral output (reference, high pass filtered at 10 s) and IML output corrected for IML response and convolved with known Chaparral response (inverted, high pass filtered at 10 s). The instrument corrected IML data closely match the Chaparral output for the same time window Preliminary Seismo-Acoustic Observations and Modeling
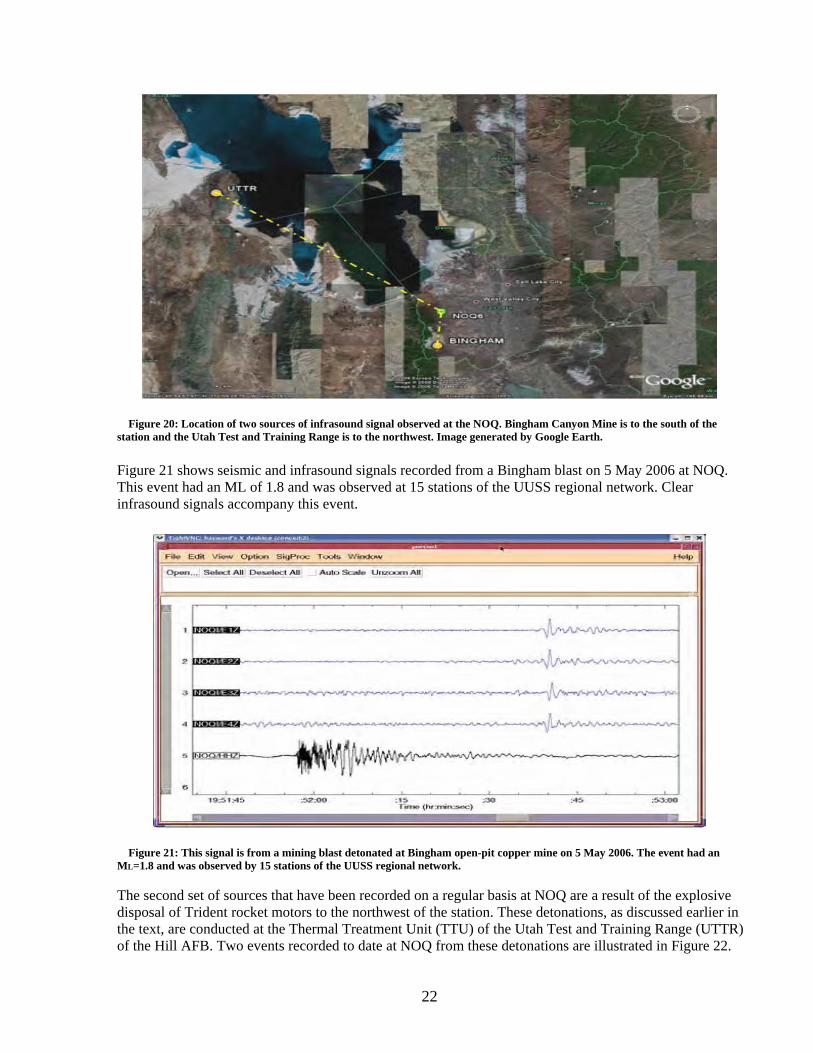
The infrasound array deployed at NOQ has regularly recorded signals from two locations since its installation in May 2006. The first source is mining explosions from the Bingham Canyon Mine operated by Kennecott Utah Copper. The mine is located to the south of the station (Figure 20) and blasts almost daily.
22
19Figure 20: Location of two sources of infrasound signal observed at the NOQ. Bingham Canyon Mine is to the south of the station and the Utah Test and Training Range is to the northwest. Image generated by Google Earth. Figure 21 shows seismic and infrasound signals recorded from a Bingham blast on 5 May 2006 at NOQ. This event had an ML of 1.8 and was observed at 15 stations of the UUSS regional network. Clear infrasound signals accompany this event.
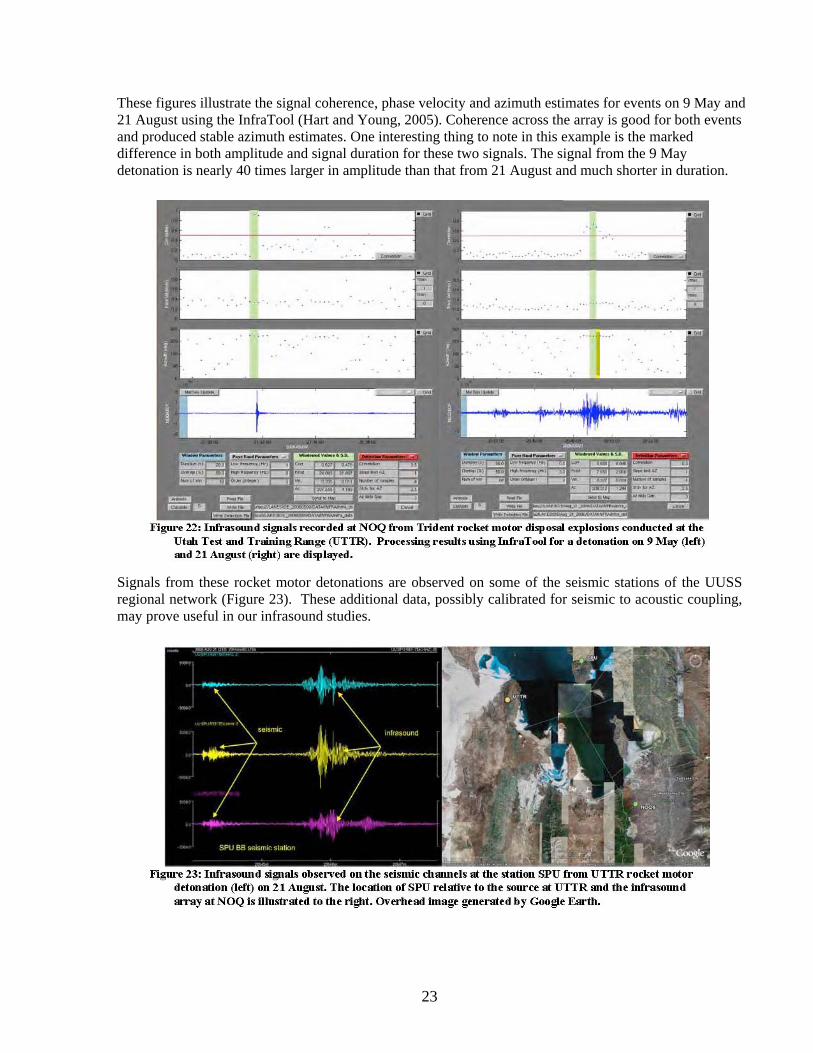
20Figure 21: This signal is from a mining blast detonated at Bingham open-pit copper mine on 5 May 2006. The event had an ML=1.8 and was observed by 15 stations of the UUSS regional network. The second set of sources that have been recorded on a regular basis at NOQ are a result of the explosive disposal of Trident rocket motors to the northwest of the station. These detonations, as discussed earlier in the text, are conducted at the Thermal Treatment Unit (TTU) of the Utah Test and Training Range (UTTR) of the Hill AFB. Two events recorded to date at NOQ from these detonations are illustrated in Figure 22.
23
These figures illustrate the signal coherence, phase velocity and azimuth estimates for events on 9 May and 21 August using the InfraTool (Hart and Young, 2005). Coherence across the array is good for both events and produced stable azimuth estimates. One interesting thing to note in this example is the marked difference in both amplitude and signal duration for these two signals. The signal from the 9 May detonation is nearly 40 times larger in amplitude than that from 21 August and much shorter in duration.
Signals from these rocket motor detonations are observed on some of the seismic stations of the UUSS regional network (Figure 23). These additional data, possibly calibrated for seismic to acoustic coupling, may prove useful in our infrasound studies.
21Infrasound signals observed on the seismic channels at the station SPU
24
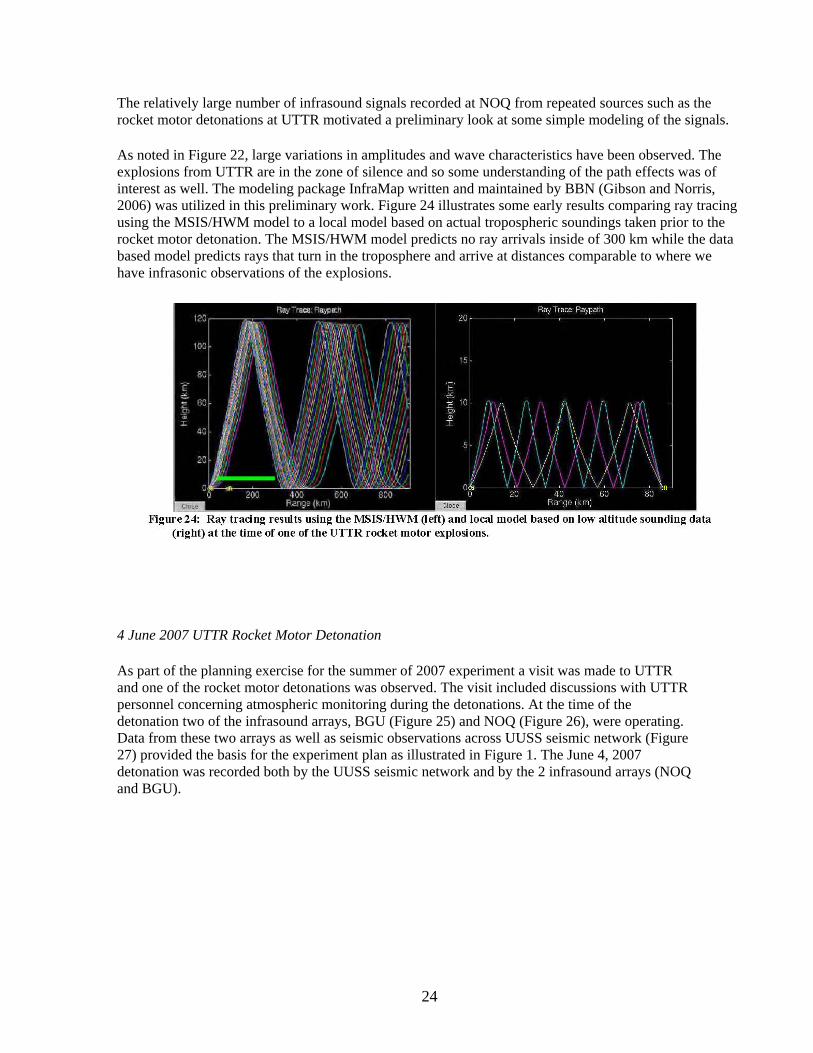
The relatively large number of infrasound signals recorded at NOQ from repeated sources such as the rocket motor detonations at UTTR motivated a preliminary look at some simple modeling of the signals. As noted in Figure 22, large variations in amplitudes and wave characteristics have been observed. The explosions from UTTR are in the zone of silence and so some understanding of the path effects was of interest as well. The modeling package InfraMap written and maintained by BBN (Gibson and Norris, 2006) was utilized in this preliminary work. Figure 24 illustrates some early results comparing ray tracing using the MSIS/HWM model to a local model based on actual tropospheric soundings taken prior to the rocket motor detonation. The MSIS/HWM model predicts no ray arrivals inside of 300 km while the data based model predicts rays that turn in the troposphere and arrive at distances comparable to where we have infrasonic observations of the explosions.
22Ray tracing results using the MSIS/HWM
4 June 2007 UTTR Rocket Motor Detonation
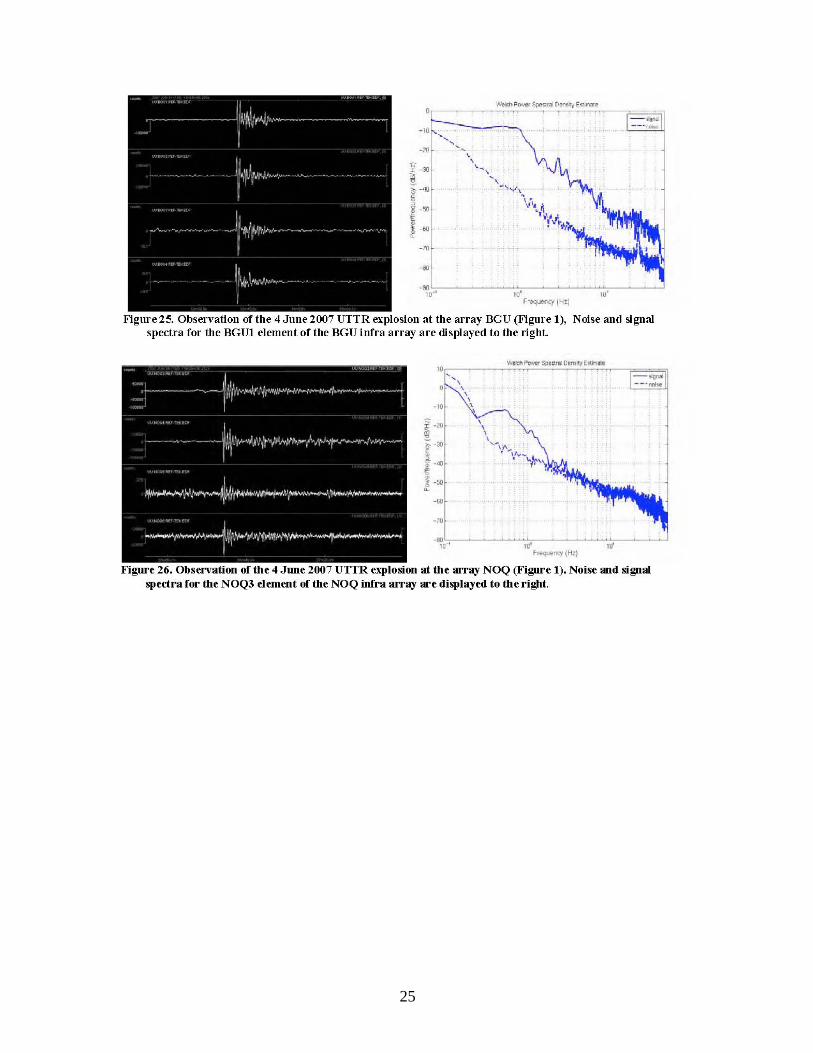
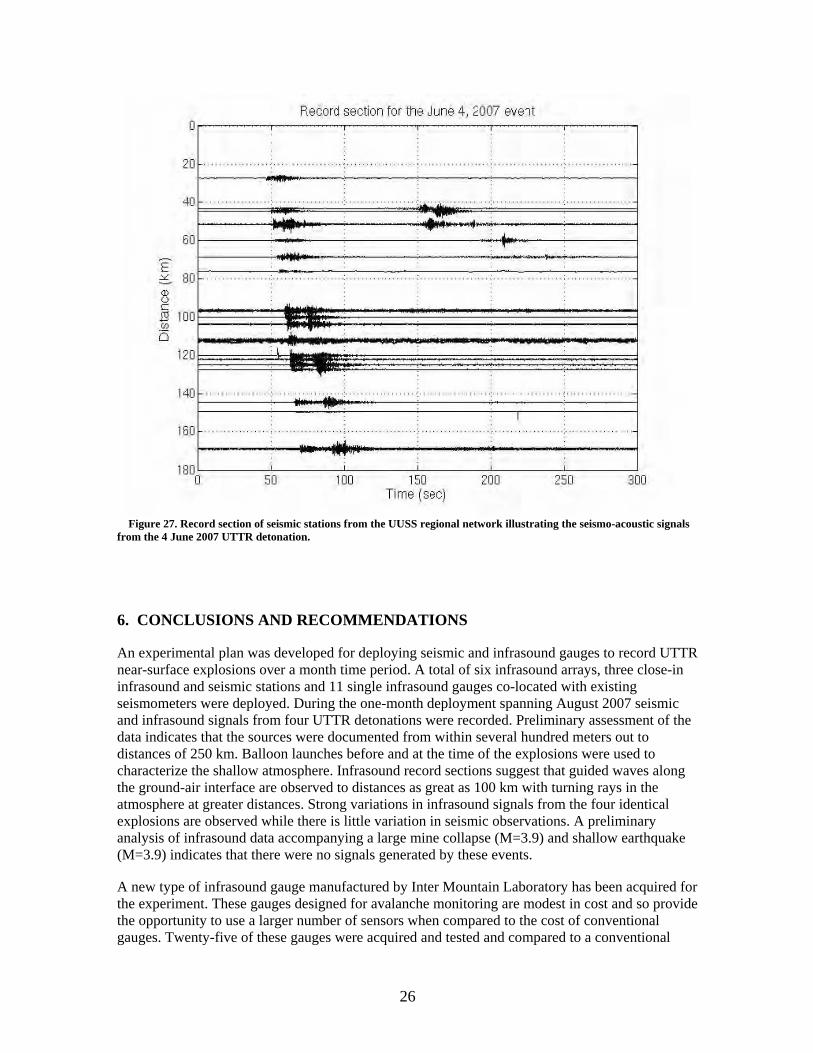
As part of the planning exercise for the summer of 2007 experiment a visit was made to UTTR and one of the rocket motor detonations was observed. The visit included discussions with UTTR personnel concerning atmospheric monitoring during the detonations. At the time of the detonation two of the infrasound arrays, BGU (Figure 25) and NOQ (Figure 26), were operating. Data from these two arrays as well as seismic observations across UUSS seismic network (Figure 27) provided the basis for the experiment plan as illustrated in Figure 1. The June 4, 2007 detonation was recorded both by the UUSS seismic network and by the 2 infrasound arrays (NOQ and BGU).
25
23Observation of the 4 June 2007 UTTR explosion at the array BGU
24Observation of the 4 June 2007 UTTR explosion at the array NOQ
26
25Figure 27. Record section of seismic stations from the UUSS regional network illustrating the seismo-acoustic signals from the 4 June 2007 UTTR detonation.
6. CONCLUSIONS AND RECOMMENDATIONS
An experimental plan was developed for deploying seismic and infrasound gauges to record UTTR near-surface explosions over a month time period. A total of six infrasound arrays, three close-in infrasound and seismic stations and 11 single infrasound gauges co-located with existing seismometers were deployed. During the one-month deployment spanning August 2007 seismic and infrasound signals from four UTTR detonations were recorded. Preliminary assessment of the data indicates that the sources were documented from within several hundred meters out to distances of 250 km. Balloon launches before and at the time of the explosions were used to characterize the shallow atmosphere. Infrasound record sections suggest that guided waves along the ground-air interface are observed to distances as great as 100 km with turning rays in the atmosphere at greater distances. Strong variations in infrasound signals from the four identical explosions are observed while there is little variation in seismic observations. A preliminary analysis of infrasound data accompanying a large mine collapse (M=3.9) and shallow earthquake (M=3.9) indicates that there were no signals generated by these events.
A new type of infrasound gauge manufactured by Inter Mountain Laboratory has been acquired for the experiment. These gauges designed for avalanche monitoring are modest in cost and so provide the opportunity to use a larger number of sensors when compared to the cost of conventional gauges. Twenty-five of these gauges were acquired and tested and compared to a conventional
27
infrasound gauge in our laboratory. This comparison indicates that these gauges will be useful in recording signals in the 1-10 Hz band and can be pushed to lower frequencies based on good coherence with signals from conventional gauges to periods as long as 50 seconds.
Three infrasound arrays have been installed at UUSS seismic sites in Utah and continue to operate (Table 2). The infrasound array at NOQ, installed in May 2006, is regularly recording infrasound signals including repeated sources from mining explosions at Bingham Canyon Mine and Trident rocket motor detonation at UTTR. The variability of these signals and the ability to make infrasound observations on some of the seismic stations as part of the UUSS regional network has motivated a preliminary modeling study. This study suggests that short-term variations in the troposphere may greatly affect not only the amplitude but also the wave characteristics in the so-called zone of silence.
Data Submission to PASSCAL
Data recorded from Utah experiment was converted to the miniseed format according to the manual written by the Data Group of PASSCAL. It was successfully submitted to the Data Group on January 16, 2008. Data information including network name, experiment name and project investigator is summarized in Table 4.
4Table 4. Data Information
Assigned Network Name Experiment Name Project Investigators ZO Utah-07 Hayward, Stump, Pankow, Burlacu
28
ACKNOWLEDGEMENTS
Instruments for the planned portable deployment described in Figure 1 are being provided by PASSCAL. Contract FA8718-05-C-0020, Air Force Research Laboratory, has supported the array deployments at NOQ,BGU and EPU separately. Contract FA2521-06-C-8007 has supported a portion of the assessment of the new IML gauges. The deployment of infrasound gauges at sites N12, M13, M14 and P13 were supported by EarthScope and thus NSF and in particular with the help of Bob Busby.
29
REFERENCES
Dighe, K., R. Whitaker, W. Armstrong. (1998) Modeling Study of Infrasonic Detection of a 1 kt
Atmospheric Blast. 20th Annual Seismic Research Symposium on Monitoring. Santa Fe, New Mexico Gibson, R. and D. Norris (2006), User’s Guide for InfraMAP, Version 5.1. DTRA01-01-C-0084. Hart, D. and C. Young (2005), MatSeis, User’s manual, version 1.10, Sandia National Laboratories. McKenna, S. M. H. (2005). Infrasound Wave Propagation at Near-Regional and Tele-Infrasonic Distances, Ph.D. Thesis, Southern Methodist University. Mutschlecner, J.P. and R.W. Whitaker (2005). Infrasound from earthquakes, J. Geophy. Res., 110,
D01108. Patton, H.J., J. L. Bonner, and I. Gupta (2003). Modeling a CLVD + Monopole Explosion
Source For the Shagan Depth of Burial Explosions. Poster Presentation at the 25th Annual Seismic Research Review on Nuclear Monitoring Technologies, Tucson, AZ.
ReVelle, D.O. (2004). Discrimination between earthquakes and mining blasts using infrasound, Knowledge Base Report, Los Alamos National Laboratory, 34pp.
Stump, B., R. Burlacu, C Hayward, J. Bonner, K. Pankow, A. Fisher and S. Nava (2007). Sesimic and Infrasound Energy Generation and Propagation at Local and Regional Distances: Phase 1 – Divine Strake Experiment. 29th Monitoring Research Review: Ground-Based Nuclear Explosion Monitoring Technologies, 25-27 September 2007, Denver, Colorado, LA-UR-07-5613, Los Alamos, NM.
Stump, B., R. Burlacu, C Hayward, J. Bonner, K. Pankow, A. Fisher and S. Nava (2006). Sesimic and Infrasound Energy Generation and Propagation at Local and Regional Distances: Phase 1 – Divine Strake Experiment, Annual Report Contract FA8718-06-C-0028, October 2006.
Yang, X., B. W. Stump, and D. C. Pearson (1999). Moment tensor inversion of single-hole mining cast blasts, Geophys. J. Int., 139, 679-690.

30