Segmentation of the Rectus Abdominis Muscle Anterior ...
9
Segmentation of the Rectus Abdominis Muscle Anterior Fascia for the Analysis of Deep Inferior Epigastric Perforators Ricardo J. Ara´ ujo (B ) and H´ elder P. Oliveira INESC TEC, Faculdade de Engenharia, Universidade do Porto, Porto, Portugal {ricardo.j.araujo,helder.f.oliveira}@inesctec.pt Abstract. The segmentation of the anterior fascia of the rectus abdo- minis muscle is an important step towards the analysis of abdominal vasculature. It may advance Computer Aided Detection tools that sup- port the activity of clinicians who study vessels for breast reconstruction using the Deep Inferior Epigastric Perforator flap. In this paper, we pro- pose a two-fold methodology to detect the anterior fascia in Computer- ized Tomographic Angiography volumes. First, a slice-wise thresholding is applied and followed by a post-processing phase. Finally, an interpo- lation framework is used to obtain a final smooth fascia detection. We evaluated our method in 20 different volumes, by calculating the mean Euclidean distance to manual annotations, achieving subvoxel error. Keywords: Medical image · Segmentation · Abdominal anterior fascia 1 Introduction In the United States, breast cancer is the leading cause of cancer death in women aged 20 to 59 years, being only surpassed by lung cancer in higher ages. This tendency occurs at a worldwide level. It is estimated that more than 230.000 new cases of breast cancer will affect women in the United States during 2016 [1]. The mastectomy, a surgical procedure where the whole breast is removed, is highly recurrent and has even been increasing in some institutions [2, 3]. Reconstruction methods allow to recreate the breast shape, improving women’s self-confidence and their image after the breast(s) removal. Among the existing options, the Deep Inferior Epigastric Perforator (DIEP) flap has become the state-of-art technique for autologous tissue based breast reconstruction [4]. In this procedure, skin, fat and vessels are moved from the abdominal region to the chest, without interfering with the rectus abdominis muscle. The harvested vessels are the DIEPs, regularly known as perforators. They have origin in bifur- cations of the Deep Inferior Epigastric Arteries (DIEAs) and then perforate the rectus abdominis muscle, heading to the superficial tissues of the abdomen. As microsurgery techniques are involved in the DIEP flap, medical imaging has been used for preoperative planning. The clinician characterizes the existing c Springer International Publishing AG 2017 L.A. Alexandre et al. (Eds.): IbPRIA 2017, LNCS 10255, pp. 537–545, 2017. DOI: 10.1007/978-3-319-58838-4 59
Transcript of Segmentation of the Rectus Abdominis Muscle Anterior ...

Segmentation of the Rectus Abdominis MuscleAnterior Fascia for the Analysis of Deep Inferior
Epigastric Perforators
Ricardo J. Araujo(B) and Helder P. Oliveira
INESC TEC, Faculdade de Engenharia, Universidade do Porto, Porto, Portugal{ricardo.j.araujo,helder.f.oliveira}@inesctec.pt
Abstract. The segmentation of the anterior fascia of the rectus abdo-minis muscle is an important step towards the analysis of abdominalvasculature. It may advance Computer Aided Detection tools that sup-port the activity of clinicians who study vessels for breast reconstructionusing the Deep Inferior Epigastric Perforator flap. In this paper, we pro-pose a two-fold methodology to detect the anterior fascia in Computer-ized Tomographic Angiography volumes. First, a slice-wise thresholdingis applied and followed by a post-processing phase. Finally, an interpo-lation framework is used to obtain a final smooth fascia detection. Weevaluated our method in 20 different volumes, by calculating the meanEuclidean distance to manual annotations, achieving subvoxel error.
Keywords: Medical image · Segmentation · Abdominal anterior fascia
1 Introduction
In the United States, breast cancer is the leading cause of cancer death in womenaged 20 to 59 years, being only surpassed by lung cancer in higher ages. Thistendency occurs at a worldwide level. It is estimated that more than 230.000 newcases of breast cancer will affect women in the United States during 2016 [1].
The mastectomy, a surgical procedure where the whole breast is removed,is highly recurrent and has even been increasing in some institutions [2,3].Reconstruction methods allow to recreate the breast shape, improving women’sself-confidence and their image after the breast(s) removal. Among the existingoptions, the Deep Inferior Epigastric Perforator (DIEP) flap has become thestate-of-art technique for autologous tissue based breast reconstruction [4]. Inthis procedure, skin, fat and vessels are moved from the abdominal region tothe chest, without interfering with the rectus abdominis muscle. The harvestedvessels are the DIEPs, regularly known as perforators. They have origin in bifur-cations of the Deep Inferior Epigastric Arteries (DIEAs) and then perforate therectus abdominis muscle, heading to the superficial tissues of the abdomen.
As microsurgery techniques are involved in the DIEP flap, medical imaginghas been used for preoperative planning. The clinician characterizes the existing
c© Springer International Publishing AG 2017L.A. Alexandre et al. (Eds.): IbPRIA 2017, LNCS 10255, pp. 537–545, 2017.DOI: 10.1007/978-3-319-58838-4 59

538 R.J. Araujo and H.P. Oliveira
perforators, since the viability of the flap depends upon several features of theharvested perforator(s) [5]. This step requires the extraction of characteristicsfrom the subcutaneous and intramuscular portions of the perforators. The ante-rior fascia of the rectus abdominis muscle separates both of these regions, henceits automatic segmentation facilitates the use of computer based routines to auto-matically retrieve the required measures. Furthermore, the automatic detectionof the fascia would help to determine the origin of each perforator subcutaneouscourse, which is required to create an accurate map of the dissection locations.
To the best of our knowledge, the literature does not include a method tar-geting this specific problem. Even then, the segmentation of abdominal organssuch as the liver, spleen, pancreas and kidneys, has been actively studied in thepast years. Recent trends regarding this topic concern the simultaneous segmen-tation of these organs, by using manually labeled atlases to get target specificpriors and, then, obtain segmentations through the graph cuts method [6,7].
In this paper, we propose a semi-automatic method for the segmentationof the anterior fascia of the rectus abdominis muscle, in the region where theperforators arise. It relies on the binarization of the intensities in the area ofinterest and further refinement, in order to obtain a first segmentation of theanterior fascia. Then, a local interpolation framework is proposed to remove theinfluence of structures in the neighborhood of the anterior fascia.
2 Rectus Abdominis Muscle Anterior FasciaSegmentation
In this section, we present a methodology that extracts the anterior fascia layerof the rectus abdominis muscle in the region that is relevant for DIEP analysis.Such region is defined as the volume that includes the end of the subcutaneouscourse of each perforator and the locations where DIEAs enter the posteriorlamella of the rectus muscle (Fig. 1 shows these landmarks in a sagittal viewrepresentation of the local anatomy). A margin was also considered, in order toprevent discarding portions of vessels which have a tortuous path.
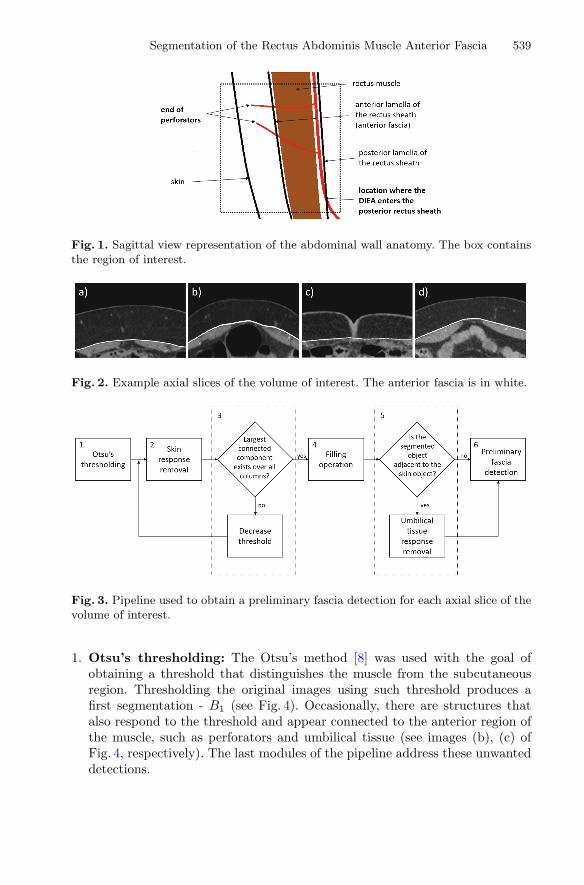
In terms of image intensities, the fascia cannot be distinguished from therectus abdominis muscle. Hence, it is considered to be the boundary betweenthis muscle and the subcutaneous region, characterized by a transition frompixels with low intensity (subcutaneous region) to pixels with higher intensity(muscle), which exists over all the columns of each axial slice of the volume ofinterest. Figure 2 shows example axial slices of a volume and the correspondinganterior fascia location.
2.1 Preliminary Fascia Segmentation
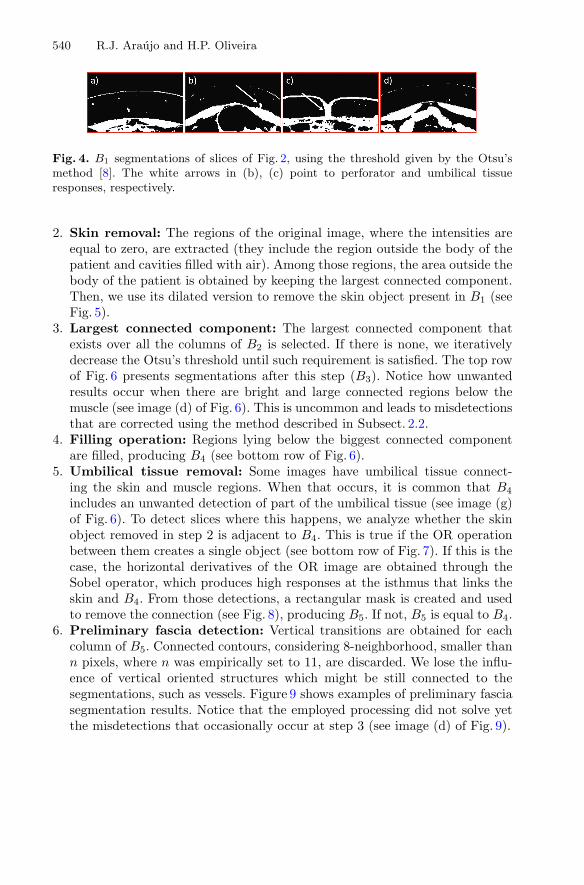
To obtain a preliminary segmentation of the anterior fascia, the pipeline pre-sented in Fig. 3 was applied to each axial slice of the volume of interest. Let Bs
be the binary image after step s. The involved steps are described below:
Segmentation of the Rectus Abdominis Muscle Anterior Fascia 539
Fig. 1. Sagittal view representation of the abdominal wall anatomy. The box containsthe region of interest.
Fig. 2. Example axial slices of the volume of interest. The anterior fascia is in white.
Fig. 3. Pipeline used to obtain a preliminary fascia detection for each axial slice of thevolume of interest.
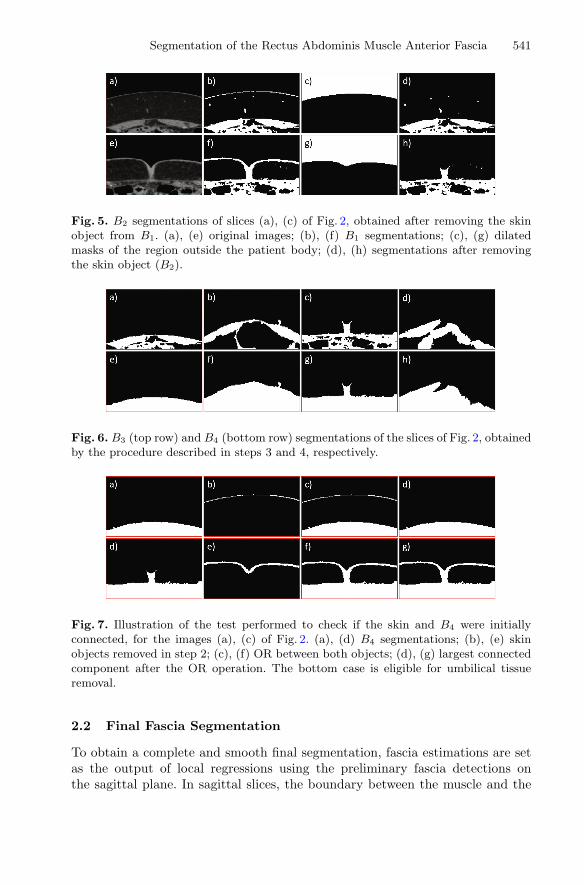
1. Otsu’s thresholding: The Otsu’s method [8] was used with the goal ofobtaining a threshold that distinguishes the muscle from the subcutaneousregion. Thresholding the original images using such threshold produces afirst segmentation - B1 (see Fig. 4). Occasionally, there are structures thatalso respond to the threshold and appear connected to the anterior region ofthe muscle, such as perforators and umbilical tissue (see images (b), (c) ofFig. 4, respectively). The last modules of the pipeline address these unwanteddetections.
540 R.J. Araujo and H.P. Oliveira
Fig. 4. B1 segmentations of slices of Fig. 2, using the threshold given by the Otsu’smethod [8]. The white arrows in (b), (c) point to perforator and umbilical tissueresponses, respectively.
2. Skin removal: The regions of the original image, where the intensities areequal to zero, are extracted (they include the region outside the body of thepatient and cavities filled with air). Among those regions, the area outside thebody of the patient is obtained by keeping the largest connected component.Then, we use its dilated version to remove the skin object present in B1 (seeFig. 5).
3. Largest connected component: The largest connected component thatexists over all the columns of B2 is selected. If there is none, we iterativelydecrease the Otsu’s threshold until such requirement is satisfied. The top rowof Fig. 6 presents segmentations after this step (B3). Notice how unwantedresults occur when there are bright and large connected regions below themuscle (see image (d) of Fig. 6). This is uncommon and leads to misdetectionsthat are corrected using the method described in Subsect. 2.2.
4. Filling operation: Regions lying below the biggest connected componentare filled, producing B4 (see bottom row of Fig. 6).
5. Umbilical tissue removal: Some images have umbilical tissue connect-ing the skin and muscle regions. When that occurs, it is common that B4
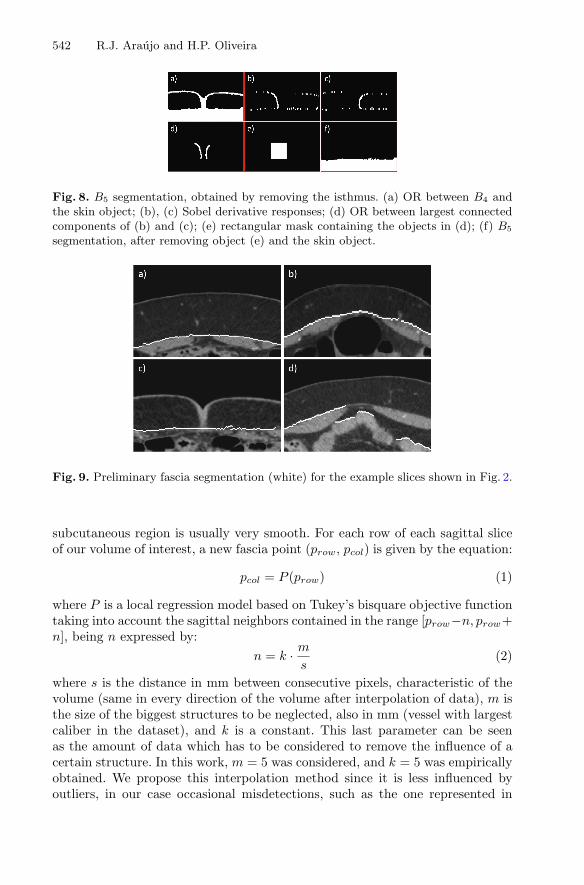
includes an unwanted detection of part of the umbilical tissue (see image (g)of Fig. 6). To detect slices where this happens, we analyze whether the skinobject removed in step 2 is adjacent to B4. This is true if the OR operationbetween them creates a single object (see bottom row of Fig. 7). If this is thecase, the horizontal derivatives of the OR image are obtained through theSobel operator, which produces high responses at the isthmus that links theskin and B4. From those detections, a rectangular mask is created and usedto remove the connection (see Fig. 8), producing B5. If not, B5 is equal to B4.
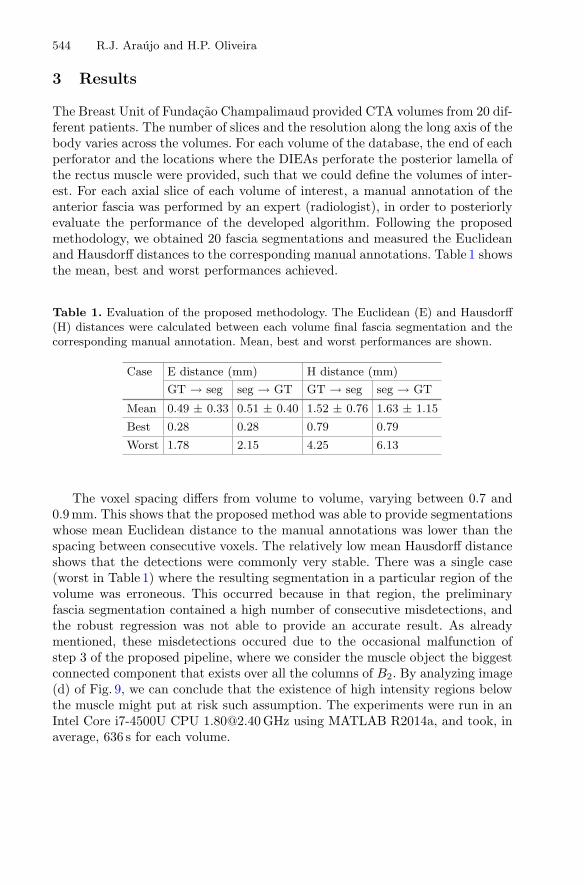
6. Preliminary fascia detection: Vertical transitions are obtained for eachcolumn of B5. Connected contours, considering 8-neighborhood, smaller thann pixels, where n was empirically set to 11, are discarded. We lose the influ-ence of vertical oriented structures which might be still connected to thesegmentations, such as vessels. Figure 9 shows examples of preliminary fasciasegmentation results. Notice that the employed processing did not solve yetthe misdetections that occasionally occur at step 3 (see image (d) of Fig. 9).
Segmentation of the Rectus Abdominis Muscle Anterior Fascia 541
Fig. 5. B2 segmentations of slices (a), (c) of Fig. 2, obtained after removing the skinobject from B1. (a), (e) original images; (b), (f) B1 segmentations; (c), (g) dilatedmasks of the region outside the patient body; (d), (h) segmentations after removingthe skin object (B2).
Fig. 6. B3 (top row) and B4 (bottom row) segmentations of the slices of Fig. 2, obtainedby the procedure described in steps 3 and 4, respectively.
Fig. 7. Illustration of the test performed to check if the skin and B4 were initiallyconnected, for the images (a), (c) of Fig. 2. (a), (d) B4 segmentations; (b), (e) skinobjects removed in step 2; (c), (f) OR between both objects; (d), (g) largest connectedcomponent after the OR operation. The bottom case is eligible for umbilical tissueremoval.
2.2 Final Fascia Segmentation
To obtain a complete and smooth final segmentation, fascia estimations are setas the output of local regressions using the preliminary fascia detections onthe sagittal plane. In sagittal slices, the boundary between the muscle and the
542 R.J. Araujo and H.P. Oliveira
Fig. 8. B5 segmentation, obtained by removing the isthmus. (a) OR between B4 andthe skin object; (b), (c) Sobel derivative responses; (d) OR between largest connectedcomponents of (b) and (c); (e) rectangular mask containing the objects in (d); (f) B5
segmentation, after removing object (e) and the skin object.
Fig. 9. Preliminary fascia segmentation (white) for the example slices shown in Fig. 2.
subcutaneous region is usually very smooth. For each row of each sagittal sliceof our volume of interest, a new fascia point (prow, pcol) is given by the equation:
pcol = P (prow) (1)
where P is a local regression model based on Tukey’s bisquare objective functiontaking into account the sagittal neighbors contained in the range [prow−n, prow+n], being n expressed by:
n = k · ms
(2)
where s is the distance in mm between consecutive pixels, characteristic of thevolume (same in every direction of the volume after interpolation of data), m isthe size of the biggest structures to be neglected, also in mm (vessel with largestcaliber in the dataset), and k is a constant. This last parameter can be seenas the amount of data which has to be considered to remove the influence of acertain structure. In this work, m = 5 was considered, and k = 5 was empiricallyobtained. We propose this interpolation method since it is less influenced byoutliers, in our case occasional misdetections, such as the one represented in

Segmentation of the Rectus Abdominis Muscle Anterior Fascia 543
Fig. 10. Example sagittal slices of the volume of interest. Comparison between prelim-inary (top row) and final fascia segmentations (bottom row).
Fig. 11. Final fascia segmentation (white) for the example slices shown in Fig. 2.
image (d) of Fig. 9. A comparison between the preliminary and final fascia, insagittal view, can be seen in Fig. 10. The results for the axial slices that have beenused as example are present in Fig. 11. These figures show that this interpolationframework is able to model the smooth anterior fascia boundary, while neglectingneighbor structures and misdetections coming from step 3.
544 R.J. Araujo and H.P. Oliveira
3 Results
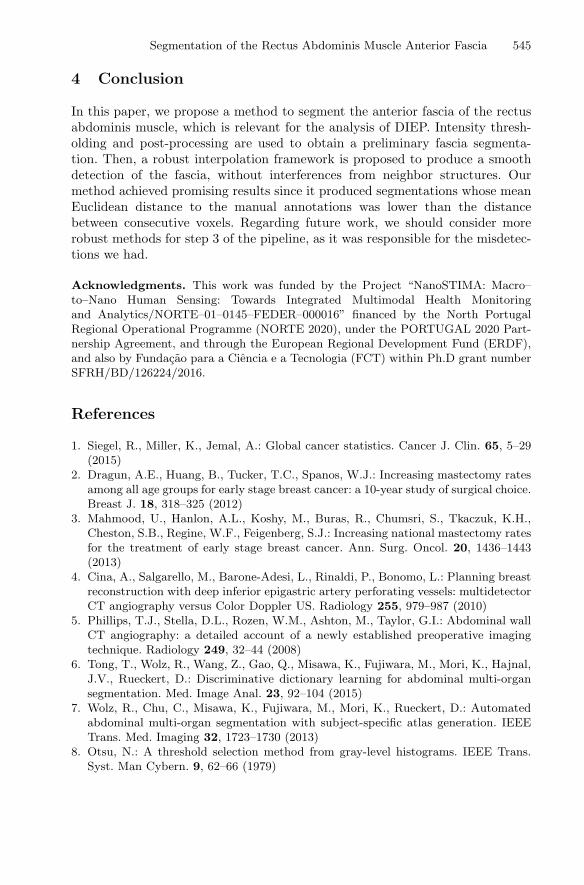
The Breast Unit of Fundacao Champalimaud provided CTA volumes from 20 dif-ferent patients. The number of slices and the resolution along the long axis of thebody varies across the volumes. For each volume of the database, the end of eachperforator and the locations where the DIEAs perforate the posterior lamella ofthe rectus muscle were provided, such that we could define the volumes of inter-est. For each axial slice of each volume of interest, a manual annotation of theanterior fascia was performed by an expert (radiologist), in order to posteriorlyevaluate the performance of the developed algorithm. Following the proposedmethodology, we obtained 20 fascia segmentations and measured the Euclideanand Hausdorff distances to the corresponding manual annotations. Table 1 showsthe mean, best and worst performances achieved.
Table 1. Evaluation of the proposed methodology. The Euclidean (E) and Hausdorff(H) distances were calculated between each volume final fascia segmentation and thecorresponding manual annotation. Mean, best and worst performances are shown.
Case E distance (mm) H distance (mm)
GT → seg seg → GT GT → seg seg → GT
Mean 0.49 ± 0.33 0.51 ± 0.40 1.52 ± 0.76 1.63 ± 1.15
Best 0.28 0.28 0.79 0.79
Worst 1.78 2.15 4.25 6.13
The voxel spacing differs from volume to volume, varying between 0.7 and0.9 mm. This shows that the proposed method was able to provide segmentationswhose mean Euclidean distance to the manual annotations was lower than thespacing between consecutive voxels. The relatively low mean Hausdorff distanceshows that the detections were commonly very stable. There was a single case(worst in Table 1) where the resulting segmentation in a particular region of thevolume was erroneous. This occurred because in that region, the preliminaryfascia segmentation contained a high number of consecutive misdetections, andthe robust regression was not able to provide an accurate result. As alreadymentioned, these misdetections occured due to the occasional malfunction ofstep 3 of the proposed pipeline, where we consider the muscle object the biggestconnected component that exists over all the columns of B2. By analyzing image(d) of Fig. 9, we can conclude that the existence of high intensity regions belowthe muscle might put at risk such assumption. The experiments were run in anIntel Core i7-4500U CPU [email protected] GHz using MATLAB R2014a, and took, inaverage, 636 s for each volume.
Segmentation of the Rectus Abdominis Muscle Anterior Fascia 545
4 Conclusion
In this paper, we propose a method to segment the anterior fascia of the rectusabdominis muscle, which is relevant for the analysis of DIEP. Intensity thresh-olding and post-processing are used to obtain a preliminary fascia segmenta-tion. Then, a robust interpolation framework is proposed to produce a smoothdetection of the fascia, without interferences from neighbor structures. Ourmethod achieved promising results since it produced segmentations whose meanEuclidean distance to the manual annotations was lower than the distancebetween consecutive voxels. Regarding future work, we should consider morerobust methods for step 3 of the pipeline, as it was responsible for the misdetec-tions we had.
Acknowledgments. This work was funded by the Project “NanoSTIMA: Macro–to–Nano Human Sensing: Towards Integrated Multimodal Health Monitoringand Analytics/NORTE–01–0145–FEDER–000016” financed by the North PortugalRegional Operational Programme (NORTE 2020), under the PORTUGAL 2020 Part-nership Agreement, and through the European Regional Development Fund (ERDF),and also by Fundacao para a Ciencia e a Tecnologia (FCT) within Ph.D grant numberSFRH/BD/126224/2016.
References
1. Siegel, R., Miller, K., Jemal, A.: Global cancer statistics. Cancer J. Clin. 65, 5–29(2015)
2. Dragun, A.E., Huang, B., Tucker, T.C., Spanos, W.J.: Increasing mastectomy ratesamong all age groups for early stage breast cancer: a 10-year study of surgical choice.Breast J. 18, 318–325 (2012)
3. Mahmood, U., Hanlon, A.L., Koshy, M., Buras, R., Chumsri, S., Tkaczuk, K.H.,Cheston, S.B., Regine, W.F., Feigenberg, S.J.: Increasing national mastectomy ratesfor the treatment of early stage breast cancer. Ann. Surg. Oncol. 20, 1436–1443(2013)
4. Cina, A., Salgarello, M., Barone-Adesi, L., Rinaldi, P., Bonomo, L.: Planning breastreconstruction with deep inferior epigastric artery perforating vessels: multidetectorCT angiography versus Color Doppler US. Radiology 255, 979–987 (2010)
5. Phillips, T.J., Stella, D.L., Rozen, W.M., Ashton, M., Taylor, G.I.: Abdominal wallCT angiography: a detailed account of a newly established preoperative imagingtechnique. Radiology 249, 32–44 (2008)
6. Tong, T., Wolz, R., Wang, Z., Gao, Q., Misawa, K., Fujiwara, M., Mori, K., Hajnal,J.V., Rueckert, D.: Discriminative dictionary learning for abdominal multi-organsegmentation. Med. Image Anal. 23, 92–104 (2015)
7. Wolz, R., Chu, C., Misawa, K., Fujiwara, M., Mori, K., Rueckert, D.: Automatedabdominal multi-organ segmentation with subject-specific atlas generation. IEEETrans. Med. Imaging 32, 1723–1730 (2013)
8. Otsu, N.: A threshold selection method from gray-level histograms. IEEE Trans.Syst. Man Cybern. 9, 62–66 (1979)