Segmentation for a Customer-Centric Approach - 2012 Marketing Priorities Survey Results
27
1 The contents of these pages are copyright © 2012 Frost & Sullivan. All rights reserved. growth team membership™ Co-Sponsor Segmentation for a Customer-Centric Approach americas 2012 marketing priorities survey results TWEET ABOUT THE SURVEYS #2012priorities
-
Upload
frost-sullivan -
Category
Business
-
view
709 -
download
0
Transcript of Segmentation for a Customer-Centric Approach - 2012 Marketing Priorities Survey Results

1
The contents of these pages are copyright © 2012 Frost & Sullivan. All rights reserved.
growth team m e m b e r s h i p™
Co-Sponsor
Segmentation for a Customer-Centric Approach
americas
2012 marketing priorities survey results
TWEET ABOUT THE SURVEYS
#2012priorities

2
The contents of these pages are copyright © 2012 Frost & Sullivan. All rights reserved.
2012 survey resultsgrowth team m e m b e r s h i p™
CONTENTS
INTRO
Executive Summary . . . . . . . . . . . . . . . . . . . . . . . . . . . . . . . . . . . . 3
Survey Purpose and Respondents . . . . . . . . . . . . . . . . . . . . . . . . . . . . 4
What is the Growth Team Membership™ . . . . . . . . . . . . . . . . . . . . . . . . 5
Marketing Overarching Challenges . . . . . . . . . . . . . . . . . . . . . . . . . . . . 6
Key Marketing Challenges . . . . . . . . . . . . . . . . . . . . . . . . . . . . . . . . 7SECTION
1
Respondent Demographics . . . . . . . . . . . . . . . . . . . . . . . . . . . . . . . . 25SECTION
4
Marketing Resource Trends . . . . . . . . . . . . . . . . . . . . . . . . . . . . . . . 11SECTION
2
Special Interest Topic: Demand Generation . . . . . . . . . . . . . . . . . . . . . . . 18SECTION
3

3
The contents of these pages are copyright © 2012 Frost & Sullivan. All rights reserved.
2012 survey resultsgrowth team m e m b e r s h i p™
Growth Team Membership™ research.
Introduction
Marketing Survey Executive Summary
SECTION 1: Key Marketing Challenges
Key Internal Challenge Key Internal Challenge Root CauseDeveloping a value proposition Insufficient personnel
SECTION 2: Marketing Resource Trends
Budgets Resources Resource AllocationMarketing typically has an annual budget under $1 million
2012 budgets will increase moderately and staffing levels will remain constant
Marketers are allocating equal resources to their traditional and online communications and content development
SECTION 3: Demand Generation
Demand Generation Effectiveness
Demand Generation Activities Demand Generation Focus for 2012
Most respondents indicate their effectiveness is “Average”
Marketers indicate that their teams are best at employing campaigns by vertical
Marketing’s priority is developing segment‑specific campaigns

4
The contents of these pages are copyright © 2012 Frost & Sullivan. All rights reserved.
2012 survey resultsgrowth team m e m b e r s h i p™
Growth Team Membership™ research.
Introduction
Survey Purpose and Respondents
Co-SponsorSurvey PopulationMethodologyResearch Objective
To understand the most pressing challenges shaping marketing executives’ 2012 planning
Web-based survey platform Manager-level and above marketing executives from companies throughout North and South America
233survey
respondents

5
The contents of these pages are copyright © 2012 Frost & Sullivan. All rights reserved.
2012 survey resultsgrowth team m e m b e r s h i p™
Growth Team Membership™ research.
Introduction
What is the Growth Team Membership™?
GTM is a subscription program that supports executives within the functions that report to the CEO
GTM provides best practices, events, and services that enable executives to address challenges within their companies
CorporateStrategy
Corporate Development
Marketing
CompetitiveIntelligence
MarketResearch
SalesLeadership
R&D/Innovation
Investors/Finance
CEOMarketing
CEO’s Growth Team™ GTM: Creating Client Value
GTM’s case-based best practices help executives:
Speed the design and implementation of initiatives by not reinventing the wheel
Save money and reduce risk by avoiding mistakes made by other companies
Accelerate problem-solving with a cross-industry perspective
Improve their functions’ and companies’ performance and productivity
[email protected] www.gtm.frost.com slideshare.net/FrostandSullivantwitter.com/Frost_GTM

6
The contents of these pages are copyright © 2012 Frost & Sullivan. All rights reserved.
2012 survey resultsgrowth team m e m b e r s h i p™
Growth Team Membership™ research.
Introduction
Marketing Overarching Challenges Sample Solutions from GTM
What’s Keeping Marketing Executives Up at Night in 2012?
Contact us at GTMResearch@frost .com .
Developing a Value PropositionMarketing executives tend to guess why customers buy, instead of collaborating with Sales or assessing the market . Over time, mixed messages become diffused and weaken the value proposition .
Learn how Kronos collaborated with Sales to refine the value proposition based on key differentiators, and embedded it with the sales force via improved messaging techniques .
Prioritizing Markets and Market Segments
Marketing executives must increase their familiarity with prospects to prioritize segments based on fit with core capabilities .
Learn how Tandberg made customer segmentation the foundation of its customer-centric business model .
Creating Effective Demand Generation Using Social MediaEmployees and customers are using social media—whether you harness it or not is up to you . Marketers need to enable practitioners with best practices in social networking to speak with one voice and engage prospects .
Learn how Cisco created a Social Media Center of Excellence aimed at improving employees’ capabilities in listening, planning, engaging, and measuring .

7
The contents of these pages are copyright © 2012 Frost & Sullivan. All rights reserved.
2012 survey resultsgrowth team m e m b e r s h i p™
Growth Team Membership™ research.
INTRO
SECTION
1
SECTION
2
SECTION
4
SECTION
3
SECTION
1 Key Marketing Challenges

8
The contents of these pages are copyright © 2012 Frost & Sullivan. All rights reserved.
2012 survey resultsgrowth team m e m b e r s h i p™
Growth Team Membership™ research.
Section 1
Challenge 1 Developing a compelling value proposition (22%)
Challenge 2 Understanding changing customer preferences and needs/incorporating voice of the customer (13%)
Challenge 3 Improving sales and marketing integration (12%)
Challenge 4 Prioritizing markets and market segments (12%)
Challenge 5 Measuring marketing ROI (11%)
Top Five Key Marketing Challenges
SURVEY QUESTION: What are the top five functional challenges shaping your marketing strategy?
Note: The respondents were asked to rank their top five challenges. The percentage values indicate how many respondents listed that particular challenge as their first through fifth challenge.

9
The contents of these pages are copyright © 2012 Frost & Sullivan. All rights reserved.
2012 survey resultsgrowth team m e m b e r s h i p™
Growth Team Membership™ research.
Section 1
B-to-B marketers’ challenges are focused on differentiation, while B-to-C marketers are occupied with supporting the sales force effectively
Top Five Marketing Challenges (By Business Model)
B-to-B B-to-C
Challenge 1 Developing a compelling value proposition (23%) Developing an effective channel strategy (22%)
Challenge 2Understanding changing customer preferences and needs/incorporating voice of the customer (14%)
Developing a compelling value proposition (13%)
Challenge 3 Prioritizing markets and market segments (12%) Improving sales and marketing integration (21%)
Challenge 4 Measuring marketing ROI (13%)Driving sales usage of marketing collateral, tools, and resources (17%)
Challenge 5 Cultivating brand attributes to increase brand differentiation (10%)
Identifying and qualifying sales-ready leads (12%)
Note: The respondents were asked to rank their top five challenges. The percentage values indicate how many respondents listed that particular challenge as their first through fifth challenge.

10
The contents of these pages are copyright © 2012 Frost & Sullivan. All rights reserved.
2012 survey resultsgrowth team m e m b e r s h i p™
Growth Team Membership™ research.
Section 1
Understaffing is the predominant cause of Marketing’s challenges
SURVEY QUESTION: Please indicate the root cause—staff, process, technology/systems, or strategic alignment—of your top five marketing challenges.
Root Cause of Top Five Marketing ChallengesTop Five Marketing Challenges
Challenge 1 Developing a compelling value proposition Staff: Limited resources (29%)
Challenge 2Understanding changing customer preferences and needs/incorporating voice of the customer
Staff: Limited resources (35%)
Challenge 3 Improving sales and marketing integration
Strategic Alignment: Insufficient senior management support (24%)
Challenge 4 Prioritizing markets and market segments Staff: Limited resources (33%)
Challenge 5 Measuring marketing ROI Process: Ineffective process (44%)

11
The contents of these pages are copyright © 2012 Frost & Sullivan. All rights reserved.
2012 survey resultsgrowth team m e m b e r s h i p™
Growth Team Membership™ research.
INTRO
SECTION
1
SECTION
2
SECTION
4
SECTION
3
SECTION
2 Marketing Resource Trends
12
The contents of these pages are copyright © 2012 Frost & Sullivan. All rights reserved.
2012 survey resultsgrowth team m e m b e r s h i p™
Growth Team Membership™ research.
Section 2
F
F
FF
FF
0%
10%
20%
30%
40%
50%
42%
34%
24%
34%
8%10%
13%
3%
6%8%
13%
40%
27%
8%10%
6%
9%
5%
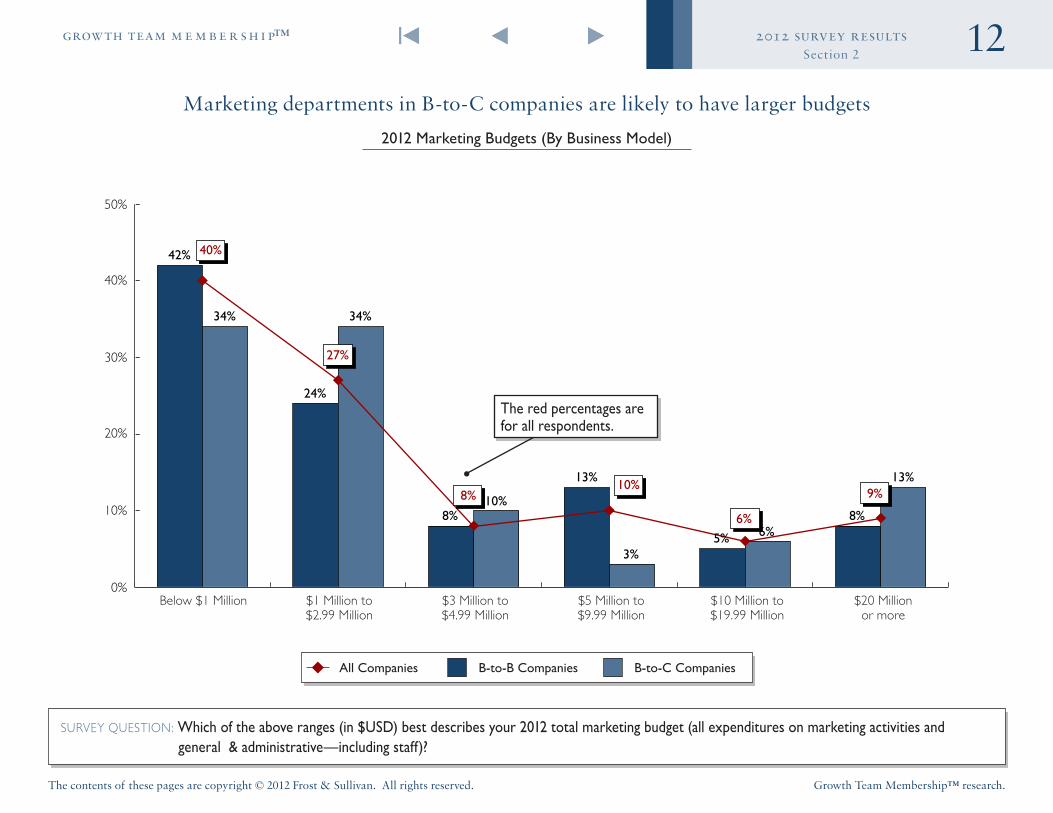
Marketing departments in B-to-C companies are likely to have larger budgets
2012 Marketing Budgets (By Business Model)
SURVEY QUESTION: Which of the above ranges (in $USD) best describes your 2012 total marketing budget (all expenditures on marketing activities and general & administrative—including staff)?
The red percentages are for all respondents .
Below $1 Million $1 Million to $2.99 Million
$3 Million to $4.99 Million
$5 Million to $9.99 Million
$10 Million to $19.99 Million
$20 Million or more
All Companies B-to-B Companies B-to-C Companies

13
The contents of these pages are copyright © 2012 Frost & Sullivan. All rights reserved.
2012 survey resultsgrowth team m e m b e r s h i p™
Growth Team Membership™ research.
Section 2
B-to-C companies allocate three times more to their marketing budget (as a percentage of revenue) than B-to-B companies
Percent of Revenue Dedicated to Marketing Budget (By Business Model)
SURVEY QUESTION: What is your 2012 total marketing budget (from the previous question) as a percentage of your company’s total 2011 revenue?
All Companies B-to-B Companies B-to-C Companies0.00%
0.25%
0.50%
0.09%
0.06%
0.18%

14
The contents of these pages are copyright © 2012 Frost & Sullivan. All rights reserved.
2012 survey resultsgrowth team m e m b e r s h i p™
Growth Team Membership™ research.
Section 2
F
F F
F
F
F
F
F F F0%
10%
20%
30%
40%40%
20%
10%12%
10%
5%
0%
10%
5% 5%
2%
5%
10% 10%
0% 0% 0%
5%
0%
5%
35%
10% 10%
0%
5%
2%
10%
0% 1% 0%
B-to-C marketing departments are more likely to allocate resources to training and channel partner programs
Marketing Resource Allocations (By Business Model)
SURVEY QUESTION: How have you allocated your 2012 marketing budget across the above activities (allocation must total 100%)?
Personnel/Staffing
Marketing Communications: Traditional Media
Marketing Communications:
Online/Digital Media
Channel Partner Programs
Marketing Automation
Platform
Customer Relationship Management
(CRM) Software and Maintenance
Content Development (white papers,
brochures, social media, and trade show support)
Knowledge Management
Systems
Training Other
All Companies B-to-B Companies B-to-C Companies

15
The contents of these pages are copyright © 2012 Frost & Sullivan. All rights reserved.
2012 survey resultsgrowth team m e m b e r s h i p™
Growth Team Membership™ research.
Section 2
The majority of marketers expect staffing levels to stay the same in 2012
Marketing Staffing Changes (By Business Model)
SURVEY QUESTION: In comparison to 2011, your 2012 marketing staffing will…
5%
1%
52%
39%
Stay the Same
Decrease Moderately Decrease Substantially Increase Substantially
Increase Moderately
All Companies
B-to-C Companies
B-to-B Companies
7%4%
58%
27%
Stay the Same
Decrease Moderately Decrease Substantially Increase Substantially
Increase Substantially
Increase Moderately
3% 3%
4%
51%
42%
4%
Stay the Same
Decrease Moderately
Increase Moderately

16
The contents of these pages are copyright © 2012 Frost & Sullivan. All rights reserved.
2012 survey resultsgrowth team m e m b e r s h i p™
Growth Team Membership™ research.
Section 2
Marketing foresees a moderate increase in budgets for 2012
Marketing Budget Changes (By Business Model)
SURVEY QUESTION: In comparison to 2011, your 2012 marketing budget will…
15%
2%2%
31% 44%Stay the Same
Decrease Moderately
Decrease Substantially Increase Substantially Increase Substantially
Increase Moderately
All Companies
B-to-C Companies
B-to-B Companies
17%
3%
37%
40%
Stay the Same
Decrease Moderately
Decrease Substantially Increase Substantially
Increase Moderately
9%8%
3%
29%46%
14%
Stay the Same
Decrease Moderately
Decrease Substantially
Increase Moderately

17
The contents of these pages are copyright © 2012 Frost & Sullivan. All rights reserved.
2012 survey resultsgrowth team m e m b e r s h i p™
Growth Team Membership™ research.
Section 2
B-to-B and B-to-C companies report similar levels of performance and effectiveness
Marketing Effectiveness (By Business Model)
SURVEY QUESTION: How would you rate the performance or effectiveness of your function compared to others within your industry?
All Companies B-to-B Companies
B-to-C Companies
9% 11%
3%
38% 39%
35%
40%39%
45%
13% 11%
17%
Above AverageAbove Average
Above Average
Exceptional Exceptional
Exceptional
Below Average Below Average
Below Average
AverageAverage
Average

18
The contents of these pages are copyright © 2012 Frost & Sullivan. All rights reserved.
2012 survey resultsgrowth team m e m b e r s h i p™
Growth Team Membership™ research.
INTRO
SECTION
1
SECTION
2
SECTION
4
SECTION
3SECTION
3 Special Interest Topic: Demand Generation

19
The contents of these pages are copyright © 2012 Frost & Sullivan. All rights reserved.
2012 survey resultsgrowth team m e m b e r s h i p™
Growth Team Membership™ research.
Section 3
The majority of B-to-B companies are satisfied with their ability to generate demand
Demand Generation Effectiveness (By Business Model)
SURVEY QUESTION: How would you rate the effectiveness of your marketing department’s demand generation activities (driving awareness and consideration)?
All Companies B-to-B Companies
B-to-C Companies
4%
18%
3%
26%
4%
17%
48% 50%
45%
22%
28%
35%
Above Average
Above Average
Above Average
Exceptional
Exceptional
Exceptional
Below Average
Below Average
Below Average
Average
Average
Average

20
The contents of these pages are copyright © 2012 Frost & Sullivan. All rights reserved.
2012 survey resultsgrowth team m e m b e r s h i p™
Growth Team Membership™ research.
Section 3
Social media and mobile marketing tactics are identified as respondents’ weakest demand generation capabilities
Demand Generation Activities Effectiveness (All Companies)
SURVEY QUESTION: How would you rate the effectiveness of your marketing department’s ability to execute the above demand generation activities?
Develop lead qualification criteria with
Sales
Clean and qualify leads
Allocate spend across demand
generation platforms
Identify and integrate
appropriate content for each
stage of the buying cycle
Integrate social media tactics
Integrate mobile marketing tactics
Employ campaigns
customized by vertical
Leverage customer
segmentation
Generate new customer segments
0%
50%
100%
6%
24%
43%
20%
7%
8%
27%
46%
16%
3%
7%
22%
50%
18%
3%
8%
23%
46%
20%
3%
18%
37%
29%
12%
4%
33%
33%
20%
12%
2%
6%
18%
43%
26%
7%
2%
23%
44%
24%
7%
5%
24%
50%
18%
3%
Do Not Use Below Average Average Above Average Best-in-Class

21
The contents of these pages are copyright © 2012 Frost & Sullivan. All rights reserved.
2012 survey resultsgrowth team m e m b e r s h i p™
Growth Team Membership™ research.
Section 3
B-to-B companies are uncertain about their ability to use mobile marketing tactics
Demand Generation Activities Effectiveness (B-to-B Companies)
SURVEY QUESTION: How would you rate the effectiveness of your marketing department’s ability to execute the above demand generation activities?
Develop lead qualification criteria with
Sales
Clean and qualify leads
Allocate spend across demand
generation platforms
Identify and integrate
appropriate content for each
stage of the buying cycle
Integrate social media tactics
Integrate mobile marketing tactics
Employ campaigns
customized by vertical
Leverage customer
segmentation
Generate new customer segments
0%
50%
100%
7%
23%
39%
24%
7%
7%
24%
44%
21%
4%
7%
20%
50%
19%
4%
8%
23%
48%
17%
4%
21%
31%
30%
13%
5%
39%
31%
18%
10%
2%
6%
20%
41%
27%
6%
2%
20%
45%
25%
8%
4%
22%
52%
18%
4%
Do Not Use Below Average Average Above Average Best-in-Class
22
The contents of these pages are copyright © 2012 Frost & Sullivan. All rights reserved.
2012 survey resultsgrowth team m e m b e r s h i p™
Growth Team Membership™ research.
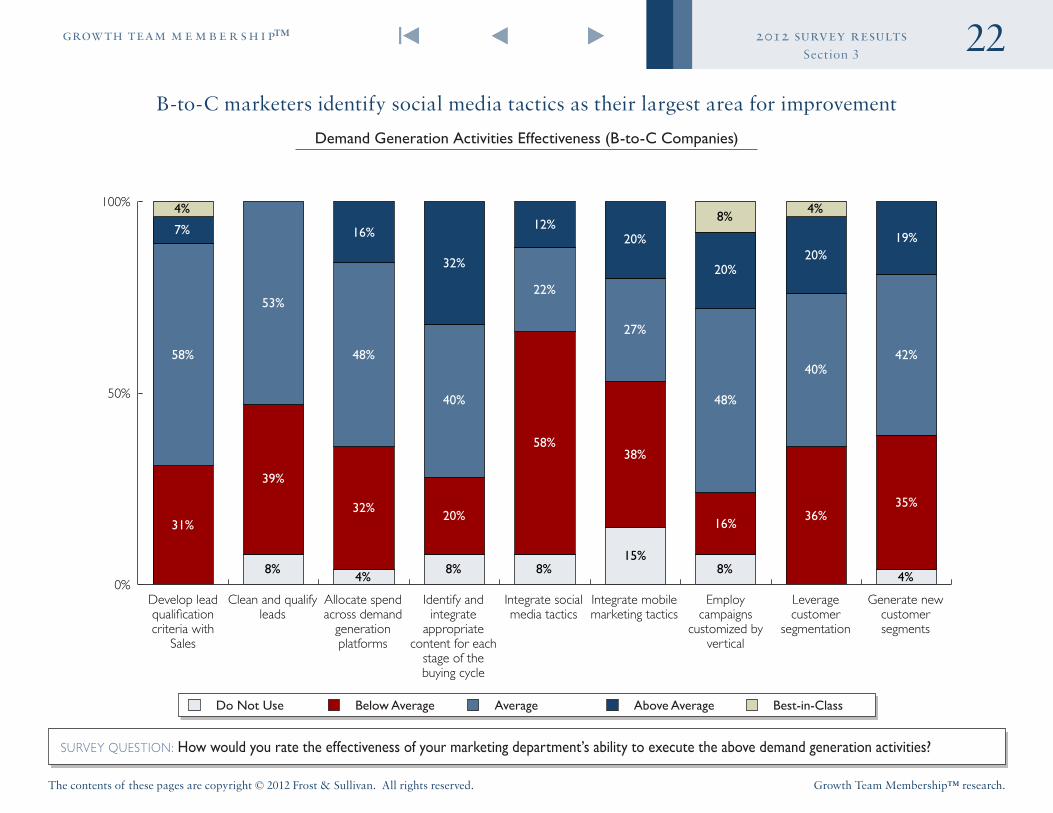
Section 3
B-to-C marketers identify social media tactics as their largest area for improvement
Demand Generation Activities Effectiveness (B-to-C Companies)
SURVEY QUESTION: How would you rate the effectiveness of your marketing department’s ability to execute the above demand generation activities?
Develop lead qualification criteria with
Sales
Clean and qualify leads
Allocate spend across demand
generation platforms
Identify and integrate
appropriate content for each
stage of the buying cycle
Integrate social media tactics
Integrate mobile marketing tactics
Employ campaigns
customized by vertical
Leverage customer
segmentation
Generate new customer segments
0%
50%
100%
31%
58%
7%
4%
8%
39%
53%
4%
32%
48%
16%
8%
20%
40%
32%
8%
58%
22%
12%
15%
38%
27%
20%
8%
16%
48%
20%
8%
36%
40%
20%
4%
4%
35%
42%
19%
Do Not Use Below Average Average Above Average Best-in-Class
23
The contents of these pages are copyright © 2012 Frost & Sullivan. All rights reserved.
2012 survey resultsgrowth team m e m b e r s h i p™
Growth Team Membership™ research.
Section 3
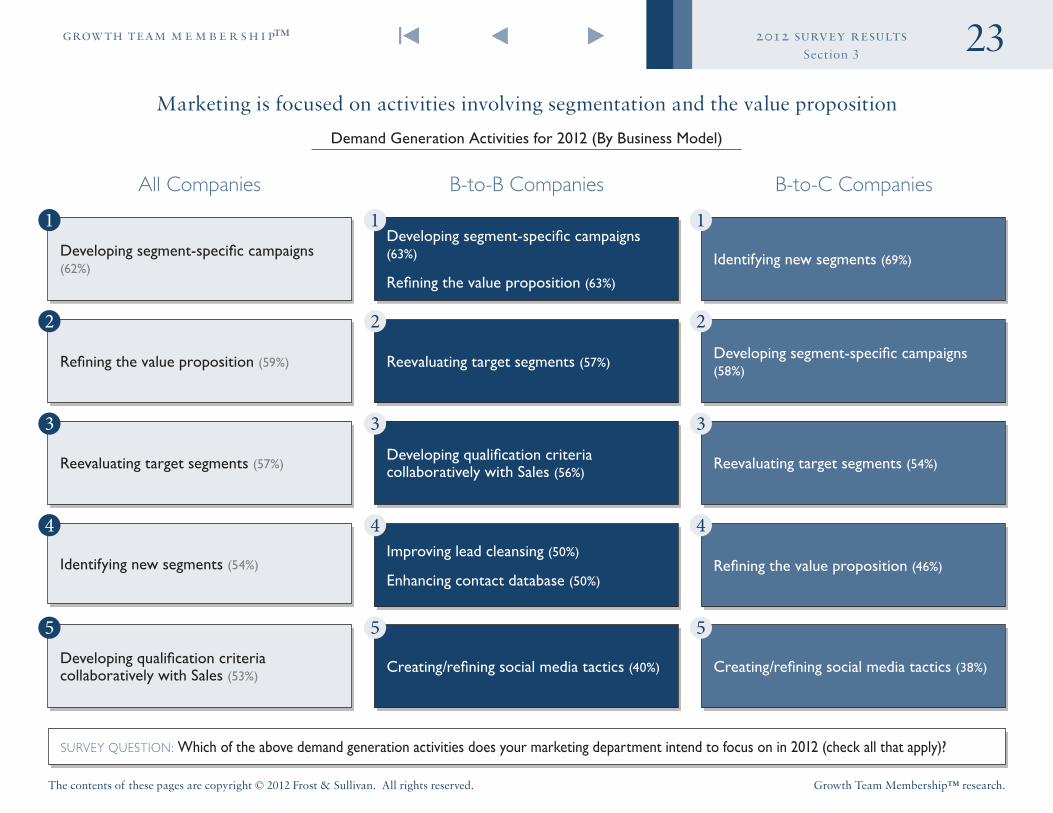
Marketing is focused on activities involving segmentation and the value proposition
Demand Generation Activities for 2012 (By Business Model)
SURVEY QUESTION: Which of the above demand generation activities does your marketing department intend to focus on in 2012 (check all that apply)?
Creating/refining social media tactics (40%)
Developing segment‑specific campaigns (62%)
Developing segment‑specific campaigns (63%)
Refining the value proposition (63%)
Identifying new segments (69%)
Reevaluating target segments (57%)Developing qualification criteria collaboratively with Sales (56%)
Reevaluating target segments (54%)
Refining the value proposition (59%) Reevaluating target segments (57%)Developing segment‑specific campaigns (58%)
Identifying new segments (54%)Improving lead cleansing (50%)
Enhancing contact database (50%)Refining the value proposition (46%)
Developing qualification criteria collaboratively with Sales (53%)
Creating/refining social media tactics (38%)
All Companies B-to-B Companies B-to-C Companies

24
The contents of these pages are copyright © 2012 Frost & Sullivan. All rights reserved.
2012 survey resultsgrowth team m e m b e r s h i p™
Growth Team Membership™ research.
Section 3
B-to-C companies rely less on email campaigns and more on virtual events, in comparison to their peers in B-to-B companies
Media Mix for Demand Generation Activities (By Business Model)
SURVEY QUESTION: What is the percentage mix of media tactics (listed above) associated with your demand generation activities (total must equal 100%)?
All Companies B-to-B Companies B-to-C Companies
20% 20% 10%
Social Media
5% 5% 5%
Live Events
25% 25% 20%
Virtual Events
4% 2% 5%
Internet (search engine optimization)
10% 10% 5%

25
The contents of these pages are copyright © 2012 Frost & Sullivan. All rights reserved.
2012 survey resultsgrowth team m e m b e r s h i p™
Growth Team Membership™ research.
INTRO
SECTION
1
SECTION
2
SECTION
4
SECTION
3
SECTION
4 Respondent Demographics

26
The contents of these pages are copyright © 2012 Frost & Sullivan. All rights reserved.
2012 survey resultsgrowth team m e m b e r s h i p™
Growth Team Membership™ research.
Section 4
Respondent Demographics
SURVEY QUESTION: Please indicate the type of enterprise, business model, and revenue that best represents your company .
N = 227
N = 233N = 233
Enterprise Type Business Model
Company Revenue
47%
3%5%
45%
21%
5%
74%
Public
Private
Hybrid
B-to-B Company
Venture Capital
0%
20%
40%
32%
15%
9%
29%
15%
Below $100 Million
$100 Million to $499.99 Million
$500 Million to $999.99 Million
$1 Billion to $11 Billion
More than $11 Billion
B-to-C Company (Indirect)
B-to-C Company (Direct)
The majority of the respondents come from B-to-B companies .
The majority of the respondents come from privately held companies .

27
The contents of these pages are copyright © 2012 Frost & Sullivan. All rights reserved.
2012 survey resultsgrowth team m e m b e r s h i p™
Growth Team Membership™ research.
Section 4
SURVEY QUESTION: Please indicate which industry categories best describe your company (check all that apply) .
Respondent Demographics: Top Five Participating Industries
N = 233
Energy and Power Systems
Electronics and Security
Chemicals, Materials, and Food
Healthcare and Life Sciences
Information and Communication Technologies
0% 20% 40%
30%
29%
24%
22%
21%