
woodlandsbank.com€¦ · Segment Reporting Public business enterprises are required to report...
44
Transcript of woodlandsbank.com€¦ · Segment Reporting Public business enterprises are required to report...


2

3

4

WOODLANDS FINANCIAL SERVICES COMPANY AND SUBSIDIARIESCONSOLIDATED BALANCE SHEETS
DECEMBER 31, 2018 AND 2017
(in thousands except per share amounts)
2018 2017
Cash and due from banks 6,099$ 7,072$ Interest-bearing deposits with banks 218 12,033 Government money market funds 4,319 456 Federal funds sold 12,396 500
Cash and cash equivalents 23,032 20,061
Available-for-sale securities 72,710 71,580 Held-to-maturity securities 425 375 Loans and leases, net 294,958 281,728 Bank premises and equipment, net 9,698 10,029 Accrued interest receivable 1,190 1,133 Deferred tax assets, net 1,276 769 Cash surrender value of life insurance 8,630 8,409 Restricted stock 1,045 1,085 Other assets 1,347 1,239
Total assets 414,311$ 396,408$
LiabilitiesNon-interest bearing 83,008$ 77,433$ Interest bearing 274,323 263,937
Total deposits 357,331 341,370
Long-term debt 13,000 14,000 Accrued interest payable 196 125 Other liabilities 2,860 2,225
Total liabilities 373,387 357,720
Stockholders' equityCommon stock, $5.00 par value, 10,000,000 shares
authorized; 1,541,725 and 1,540,380 shares issued andoutstanding in 2018 and 2017, respectively 7,709 7,702
Preferred stock, $5.00 par value, 4,000,000 sharesauthorized; no shares issued or outstanding - -
Additional paid-in capital 8,189 8,161 Retained earnings 25,448 21,776 Accumulated other comprehensive income (422) 1,049
Total stockholders' equity 40,924 38,688
Total liabilities and stockholders' equity 414,311$ 396,408$
LIABILITIES AND STOCKHOLDERS' EQUITY
ASSETS
The accompanying Notes are an integral part of these Consolidated Financial Statements.4
5

WOODLANDS FINANCIAL SERVICES COMPANY AND SUBSIDIARIESCONSOLIDATED STATEMENTS OF INCOME
YEARS ENDED DECEMBER 31, 2018 AND 2017
(in thousands except per share amounts)2018 2017
Interest incomeInterest and fees on loans and leases 14,302$ 13,065$ Interest on cash and cash equivalents 142 153 Interest and dividends on investments:
Taxable 1,175 1,045 Tax-exempt 754 837 Dividends 151 117
Interest on Federal funds sold 96 6 Total interest income 16,620 15,223
Interest expenseInterest on deposits 2,150 1,405 Interest on borrowed funds 255 267
Total interest expense 2,405 1,672
Net interest income 14,215 13,551
Provision for loan losses 240 360 Net interest income, after provision
for loan losses 13,975 13,191
Other incomeService charges and other fees 839 809 Other operating income 1,455 1,272 Trust department income 1,076 1,052 Gain on sale of loans and other assets, net 95 171 Gain (loss) on investment securities, net 1,127 (123)
Total other income 4,592 3,181
Other expensesSalaries and employee benefits 6,863 6,631 Occupancy expense 670 649 Furniture and equipment expense 470 455 FDIC insurance premiums 156 180 Data processing expense 824 702 Professional fees 267 270 Other operating expenses 2,679 2,549
Total other expenses 11,929 11,436
Income before income taxes 6,638 4,936 Provision for income taxes 1,178 1,762
Net income 5,460$ 3,174$
Net income per common share 3.54$ 2.06$
The accompanying Notes are an integral part of these Consolidated Financial Statements.5
6

WOODLANDS FINANCIAL SERVICES COMPANY AND SUBSIDIARIESCONSOLIDATED STATEMENTS OF COMPREHENSIVE INCOME
YEARS ENDED DECEMBER 31, 2018 AND 2017
(in thousands except per share amounts)
2018 2017
Net income 5,460$ 3,174$
Other comprehensive income, net of tax:Unrealized holding (losses) gains arising during the year (581) 94 Less: Reclassification adjustment for gains (losses)
included in net income 890 (81)
Other comprehensive income (1,471) 175
Comprehensive income 3,989$ 3,349$
The accompanying Notes are an integral part of these Consolidated Financial Statements.6
7

WOODLANDS FINANCIAL SERVICES COMPANY AND SUBSIDIARIESSTATEMENTS OF CHANGES IN STOCKHOLDERS' EQUITY
YEARS ENDED DECEMBER 31, 2018 AND 2017
(in thousands except per share amounts)Accumulated
Additional Other TotalCommon Paid-in Retained Comprehensive Stockholders'
Stock Capital Earnings Income Equity
Balance, December 31, 2016 7,694$ 8,138$ 20,037$ 701$ 36,570$
Net income 3,174 3,174
Other comprehensive income 175 175
Adjustment for tax law change (173) 173 -
Issuance of 1,570 sharesunder employee stockpurchase plan 8 23 31
Cash dividends declared($.82 per share) (1,262) (1,262)
Balance, December 31, 2017 7,702 8,161 21,776 1,049 38,688
Net income 5,460 5,460
Other comprehensive income (1,471) (1,471)
Issuance of 1,345 sharesunder employee stockpurchase plan 7 28 35
Cash dividends declared($1.16 per share) (1,788) (1,788)
Balance, December 31, 2018 7,709$ 8,189$ 25,448$ (422)$ 40,924$
The accompanying Notes are an integral part of these Consolidated Financial Statements.7
8

WOODLANDS FINANCIAL SERVICES COMPANY AND SUBSIDIARIESCONSOLIDATED STATEMENTS OF CASH FLOWS
YEARS ENDED DECEMBER 31, 2018 AND 2017
(in thousands except per share amounts)2018 2017
Operating activitiesNet income 5,460$ 3,174$ Adjustments to reconcile net income
to net cash provided by operating activities:Provision for loan losses 240 360 Depreciation 373 397 Amortization of securities (net of accretion) 328 499 Gain on sale of investment securities, loans and other assets, net (1,222) (48) Increase in cash surrender value of life insurance (221) (200) Sale of mortgage loans originated for sale 6,057 8,154 Mortgage loans originated for sale (5,484) (8,153) Deferred taxes (116) 329 Increase in accrued interest receivable (57) (17) Decrease (increase) in other assets 25 (160) Increase in accrued interest payable 71 10 Increase in other liabilities 635 159
Net cash provided by operating activities 6,089 4,504 Investing activities
Purchase of available-for-sale securities (17,558) (17,260) Purchase of held-to-maturity securities (100) (100) Proceeds from sales and repayments of available-for-sale securities 15,365 16,179 Proceeds from repayments of held-to-maturity securities 50 - Net increase in loans and leases (13,995) (5,131) Proceeds from sale of other real estate - 830 Purchase of bank owned life insurance - (884) Proceeds from restricted stock 40 43 Purchase of bank premises and equipment (128) (190)
Net cash used in investing activities (16,326) (6,513) Financing activities
Net increase in deposits 15,961 3,873 Decrease in short-term borrowings - (1,000) Repayments on long-term borrowings (1,000) (69) Dividends paid to stockholders of common stock (1,788) (1,262) Proceeds from issuance of common stock 35 31
Net cash provided by financing activities 13,208 1,573 Net increase (decrease) in cash and cash equivalents 2,971 (436)
Cash and cash equivalents at January 1 20,061 20,497 Cash and cash equivalents at December 31 23,032$ 20,061$
The accompanying Notes are an integral part of these Consolidated Financial Statements.8
9

Note 1 – Nature of Operations and Summary of Significant Accounting Policies Nature of Operations
Woodlands Financial Services Company (Company) is a Pennsylvania corporation organized as a financial services holding company of Woodlands Bank (Bank) and Woodlands Stock Corporation. The Bank is a state chartered commercial bank located in Williamsport, Pennsylvania and operates as a traditional community bank, providing commercial and consumer banking and trust services in Lycoming and Clinton Counties and the surrounding market area.
Basis of Presentation
The Financial Statements of the Company have been consolidated with those of its wholly-owned subsidiaries, Woodlands Bank and Woodlands Stock Corporation, eliminating all intercompany items and transactions.
All information is presented in thousands of dollars, except per share amounts.
The Company has evaluated subsequent events through February 27, 2019, the date that these financial statements were available to be issued, and concluded no events or transactions occurred during that period requiring recognition or disclosure.
Segment Reporting
Public business enterprises are required to report financial and descriptive information about their reportable operating segments. The Company has determined that its only reportable segment is community banking.
Use of Estimates
The preparation of financial statements in conformity with accounting principles generally accepted in the United States (GAAP) requires management to make estimates and assumptions that affect the reported amount of assets and liabilities and disclosure of contingent assets and liabilities at the date of the financial statements and the reported amounts of revenue and expenses during the reporting period. Actual results could differ from those estimates. Material estimates that are particularly susceptible to significant change relate to the determination of the allowance for losses on loans and the valuation of investment securities.
Per Share Data
Earnings per share of common stock have been computed on the basis of the weighted-average number of shares of common stock outstanding during the period. The number of common shares used in computing basic and diluted earnings per share and dividends per share was 1,541,058 in 2018 and 1,539,601 in 2017.
Investment Securities Management determines the appropriate classification of debt securities at the time of purchase and re-evaluates such designation as of each balance sheet date. Investments in securities are classified in two categories and accounted for as follows:
9 10
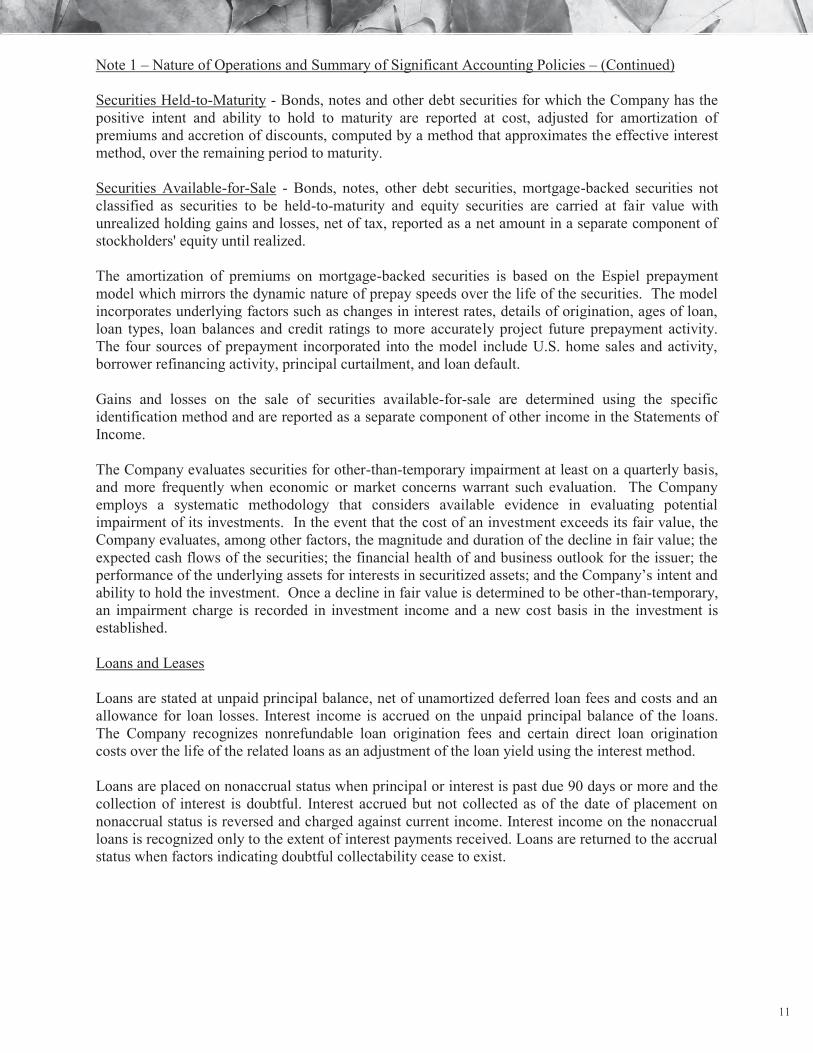
Note 1 – Nature of Operations and Summary of Significant Accounting Policies – (Continued) Securities Held-to-Maturity - Bonds, notes and other debt securities for which the Company has the positive intent and ability to hold to maturity are reported at cost, adjusted for amortization of premiums and accretion of discounts, computed by a method that approximates the effective interest method, over the remaining period to maturity. Securities Available-for-Sale - Bonds, notes, other debt securities, mortgage-backed securities not classified as securities to be held-to-maturity and equity securities are carried at fair value with unrealized holding gains and losses, net of tax, reported as a net amount in a separate component of stockholders' equity until realized. The amortization of premiums on mortgage-backed securities is based on the Espiel prepayment model which mirrors the dynamic nature of prepay speeds over the life of the securities. The model incorporates underlying factors such as changes in interest rates, details of origination, ages of loan, loan types, loan balances and credit ratings to more accurately project future prepayment activity. The four sources of prepayment incorporated into the model include U.S. home sales and activity, borrower refinancing activity, principal curtailment, and loan default.
Gains and losses on the sale of securities available-for-sale are determined using the specific identification method and are reported as a separate component of other income in the Statements of Income.
The Company evaluates securities for other-than-temporary impairment at least on a quarterly basis, and more frequently when economic or market concerns warrant such evaluation. The Company employs a systematic methodology that considers available evidence in evaluating potential impairment of its investments. In the event that the cost of an investment exceeds its fair value, the Company evaluates, among other factors, the magnitude and duration of the decline in fair value; the expected cash flows of the securities; the financial health of and business outlook for the issuer; the performance of the underlying assets for interests in securitized assets; and the Company’s intent and ability to hold the investment. Once a decline in fair value is determined to be other-than-temporary, an impairment charge is recorded in investment income and a new cost basis in the investment is established. Loans and Leases
Loans are stated at unpaid principal balance, net of unamortized deferred loan fees and costs and an allowance for loan losses. Interest income is accrued on the unpaid principal balance of the loans. The Company recognizes nonrefundable loan origination fees and certain direct loan origination costs over the life of the related loans as an adjustment of the loan yield using the interest method. Loans are placed on nonaccrual status when principal or interest is past due 90 days or more and the collection of interest is doubtful. Interest accrued but not collected as of the date of placement on nonaccrual status is reversed and charged against current income. Interest income on the nonaccrual loans is recognized only to the extent of interest payments received. Loans are returned to the accrual status when factors indicating doubtful collectability cease to exist.
10 11

Note 1 – Nature of Operations and Summary of Significant Accounting Policies – (Continued)
Allowance for Loan and Lease Losses
The allowance for loan and lease losses is established through provisions for loan and lease losses charged against income. Loans or leases deemed to be uncollectible are charged against the allowance for loan and lease losses, and subsequent recoveries, if any, are credited to the allowance. The allowance for loan and lease losses is maintained at a level considered adequate to provide for losses that can be reasonably anticipated. The allowance is evaluated on a regular basis by management and is based upon management’s periodic review of their ability to collect loans and leases in light of historical experience, the nature and volume of the loan and lease portfolio, adverse situations that may affect the borrower’s ability to repay, estimated value of any underlying collateral and prevailing economic conditions. This evaluation is inherently subjective as it requires estimates that are susceptible to significant revision as more information becomes available.
The allowance consists of specific, general, and unallocated components. The specific component relates to loans and leases that are classified as doubtful, substandard, or special mention. For such loans and leases that are also classified as impaired, an allowance is established when the discounted cash flows (or collateral value or observable market price) of the impaired loan or lease is lower than the carrying value of that loan or lease. The general component covers non-classified loans and leases and is based on historical loss experience adjusted for qualitative factors. An unallocated component is maintained to cover uncertainties that could affect management’s estimate of probable losses. The unallocated component of the allowance reflects the margin of imprecision inherent in the underlying assumptions used in the methodologies for estimating specific and general losses in the portfolio.
The Company considers a loan to be impaired, based upon current information and events, if it is probable that the Company will be unable to collect the scheduled payments of principal or interest according to the contractual terms of the loan agreement. The Company individually evaluates such loans for impairment. Factors considered by management in determining impairment include payment status and collateral value. The measurement of impaired loans is based on the present value of expected future cash flows discounted at the historical effective interest rate, except that all collateral - dependent loans are measured for impairment based on the fair value of the collateral less costs to sell. The Company does not accrue interest on impaired loans. While a loan is considered impaired, subsequent cash payments received either are applied to the outstanding principal balance or recorded as interest income, depending upon management’s assessment of the ultimate collectability of principal and interest. Large groups of smaller balance homogeneous loans are collectively evaluated for impairment.
Mortgage Banking Activity
Loans held for sale consist of residential mortgage loans originated by the Company. They are recorded at the lower of cost or estimated fair value on an aggregate basis. Gains and losses are included in the statements of income. Other Real Estate
Other real estate acquired through foreclosure or other means is recorded at the lower of its carrying value or fair value of the property at the transfer date, less estimated selling costs. Costs to maintain other real estate are expensed as incurred. Other real estate is included with other assets in the balance sheets. Other real estate owned as of December 31, 2018 and 2017 was $47 and $0, respectively.
11 12

Note 1 – Nature of Operations and Summary of Significant Accounting Policies – (Continued) Bank Premises and Equipment
Bank premises and equipment are stated at cost, less accumulated depreciation. Depreciation expense is computed using the straight-line method over the estimated useful lives of the assets. Repair and maintenance are expensed as incurred. When premises or equipment are retired or sold, the remaining cost and accumulated depreciation are removed from the accounts and any gain or loss is credited or charged to income. Advertising Expenses Advertising costs are expensed as incurred. Advertising expenses for the years ended December 31, 2018 and 2017, amounted to $283 and $261, respectively.
Income Taxes Provisions for income taxes are based on taxes payable or refundable for the current year (after exclusion of non-taxable income such as interest on state and municipal securities) as well as deferred taxes on temporary differences. Deferred income tax assets and liabilities are determined using the liability (or balance sheet) method. Under this method, the net deferred tax asset or liability is determined based on the tax effects of temporary differences between book and tax bases of the various balance sheet assets and liabilities and gives current recognition to changes in tax rates and laws. Management evaluated the Company’s tax positions and concluded that the Company had taken no uncertain tax positions that require adjustment to the financial statements. With few exceptions, the Company is no longer subject to income tax examinations by the U.S. Federal, state or local tax authorities for years before 2015. Cash Flows
For purposes of the Statements of Cash Flows, cash and cash equivalents include cash on hand, due from banks, interest bearing balances with banks, government money market funds and Federal funds sold for a one-day period. The Company paid interest and income taxes as follows:
Years Ended December 31, 2018 2017 Interest paid $ 2,334 $ 1,662 Income taxes paid $ 1,300 $ 1,500
Non-cash transactions during the years ended December 31, 2018 and 2017 included the change in unrealized (losses) gains on available-for-sale securities of ($1,862) and $266, respectively, and the acquisition of real estate in the settlement of loans of $47 and $341, respectively.
Long-Lived Assets The Company reviews the carrying value of long-lived assets for impairment whenever events or changes in circumstances indicate that carrying amounts of the assets might not be recoverable.
12 13

Note 1 – Nature of Operations and Summary of Significant Accounting Policies – (Continued) Trust Assets and Income
Assets held by the Company in a fiduciary or agency capacity for its customers are not included in the financial statements since such items are not assets of the Company. Trust income is reported on a cash basis, which is not materially different from the accrual basis.
Reclassifications
Certain prior year amounts have been reclassified to conform to the current year presentation.
Recent Accounting Pronouncements In May 2014, the FASB issued ASU 2014-09, Revenue from Contracts with Customers (Topic 606). The standard required revenue to be recognized in a manner to depict the transfer of goods or services to a customer at an amount that reflects the consideration expected to be received in exchange for those goods or services. The FASB issued several updates to the ASU, all of which clarified certain implementation guidance. The ASU and subsequent updates were effective for the Company on January 1, 2018. The adoption of ASU 2014-09 did not have a material impact on the financial statements. In January 2016, the FASB issued ASU 2016-01, Financial Instruments – Overall (Subtopic 825-10): Recognition and Measurement of Financial Assets and Financial Liabilities. The ASU was intended to improve the recognition, measurement, presentation and disclosure of financial instruments. ASU 2016-01 was effective for the Company on January 1, 2018. The adoption of ASU 2016-01 did not have a material impact on the financial statements. In February 2016, the FASB issued ASU 2016-02, Leases (Topic 842). Among many other provisions, the ASU requires lessees to recognize lease assets and lease liabilities on the balance sheet for all leases with terms longer than 12 months. Leases will be classified as either finance or operating, with classification affecting the pattern of expense recognition in the income statement. ASU 2016-02 will be effective for the Company on January 1, 2019. The adoption of ASU 2016-02 is not expected to have a material impact on the financial statements. In June 2016, the FASB issued ASU 2016-13, Financial Instruments – Credit Losses (Topic 326): Measurement of Credit Losses on Financial Instruments, which creates a new credit impairment standard for financial assets measured at amortized cost and available-for-sale debt securities. The ASU requires financial assets measured at amortized cost (including loans, trade receivables and held-to-maturity debt securities) to be presented at the net amount expected to be collected, through an allowance for credit losses that are expected to occur over the remaining life of the asset, rather than incurred losses. The ASU requires that credit losses on available-for-sale debt securities be presented as an allowance rather than as a direct write-down. The measurement of credit losses for newly recognized financial assets (other than certain purchased assets) and subsequent changes in the allowance for credit losses are recorded in the statement of income as the amounts expected to be collected change. ASU 2016-13 will be effective for the Company on January 1, 2021. We are currently evaluating the impact the standard will have on the Company’s financial statements.
13 14

Note 1 – Nature of Operations and Summary of Significant Accounting Policies – (Continued) In August 2016, the FASB issued ASU 2016-15, Statement of Cash Flows (Topic 230): Classification of Certain Cash Receipts and Cash Payments. The ASU provides guidance on eight specific statement of cash flows classification issues and is intended to reduce diversity in practice. ASU 2016-15 was effective for the Company on January 1, 2018. The adoption of ASU 2016-15 did not have a material impact on the Company’s financial statements. In November 2016, the FASB issued ASU 2016-18, Statement of Cash Flows (Topic 230): Restricted Cash (a consensus of the FASB Emerging Issues Task Force), which provides guidance on the presentation of restricted cash or restricted cash equivalents in the statement of cash flows. ASU 2016-18 will be effective for the Company beginning on January 1, 2019. ASU 2016-18 must be applied using a retrospective transition method with early adoption permitted. The adoption of ASU 2016-18 is not expected to have a material impact on the financial statements. In March 2017, the FASB issued ASU 2017-08, Receivables—Nonrefundable Fees and Other Costs (Subtopic 310-20): Premium Amortization on Purchased Callable Debt Securities, which shortens the amortization period for certain callable debt securities held at a premium to the earliest call date. The amendments do not require an accounting change for securities held at a discount; the discount continues to be amortized to maturity. ASU 2017-08 is effective for the Company for annual periods beginning after December 15, 2018, and the interim periods included within those annual periods, with early adoption permitted. The Company is currently evaluating the impact of the adoption of this guidance on its financial statements. In February 2018, the FASB issued ASU 2018-02, Income Statement – Reporting Comprehensive Income, The ASU provides updated guidance which permits entities to reclassify stranded tax effects in accumulated other comprehensive income to retained earnings as a result of the Tax Cuts and Jobs Act enacted by the U.S. Federal government on December 22, 2017. The updated guidance is effective for interim and annual reporting periods beginning after December 15, 2018, with early adoption permitted. The Company elected to adopt this change in accounting principle in the fourth quarter of 2017 and applied the change as of the beginning of 2017, which resulted in a decrease to retained earnings and an increase to accumulated other comprehensive income of $173 in 2017 on the Company’s consolidated statements of equity. In August 2018, the FASB issued ASU 2018-13, Fair Value Measurement (Topic 820): Disclosure Framework—Changes to the Disclosure Requirements for Fair Value Measurement, which modifies the disclosure requirements for fair value measurements by removing, modifying, or adding certain disclosures. ASU 2018-13 is effective for the Company for fiscal years, and interim periods within those fiscal years, beginning after December 15, 2019. An entity is permitted to early adopt any removed or modified disclosures and delay adoption of the additional disclosures until their effective date. The adoption of ASU 2018-13 is not expected to have a material impact on the financial statements. Note 2 – Restrictions on Cash and Due from Banks
Banks are required to maintain reserves, in the form of cash balances with the Federal Reserve Bank, against their deposit liabilities. The Company may, from time to time, maintain balances with financial institutions in excess of federally insured limits.
14 15

Note 3 – Investment Securities The amortized cost and fair value of investment securities are as follows:
December 31, 2018
Amortized Cost
Gross Unrealized
Gains
Gross Unrealized
Losses Fair Value Available-for-sale: U.S. Government securities $ 988 $ - $ 1 $ 987 U.S. Government agencies and corporations 7,130 16 27 7,119 State and political subdivisions 26,164 142 163 26,143 Corporate securities 8,211 - 49 8,162 Mortgage-backed securities 30,752 52 505 30,299 Total available-for-sale $ 73,245 $ 210 $ 745 $ 72,710 Held-to-maturity: Other securities $ 425 $ - $ 2 $ 423
December 31, 2017
Amortized Cost
Gross Unrealized
Gains
Gross Unrealized
Losses Fair Value Available-for-sale: U.S. Government agencies and corporations $ 4,663 $ 33 $ 16 $ 4,680 State and political subdivisions 32,258 589 18 32,829 Corporate securities 5,982 44 - 6,026 Mortgage-backed securities 26,227 38 331 25,934 Subtotal 69,130 704 365 69,469 Equity securities 1,122 989 - 2,111 Total available-for-sale $ 70,252 $ 1,693 $ 365 $ 71,580 Held-to-maturity: Other securities $ 375 $ - $ - $ 375
The amortized cost and estimated fair value of debt securities at December 31, 2018, by contractual maturity, are presented in the following table. Expected maturities will differ from contractual maturities because borrowers may have the right to call or repay obligations with or without call or repayment penalties.
15 16

Note 3 – Investment Securities – (Continued) Available-for-Sale Held-to-Maturity Amortized
Cost
Fair Value Amortized
Cost
Fair Value Due in one year or less $ 4,454 $ 4,472 $ 75 $ 75 Due after one year through five years
15,244
15,205
350
348
Due after five years through ten years
11,108
11,114
-
-
Due after ten years 11,687 11,620 - - Subtotal 42,493 42,411 425 423 Mortgage-backed securities 30,752 30,299 - - Total debt securities $ 73,245 $ 72,710 $ 425 $ 423 Proceeds from sales of available-for-sale debt securities during 2018 and 2017 were $5,735 and $6,759, respectively. Gross gains and gross losses realized on these sales were $48 and $1 during 2018 and $27 and $172 during 2017, respectively. Investment securities with a carrying value of $63,813 at December 31, 2018 and $55,275 at December 31, 2017, were pledged as collateral for public deposits and other items as provided by law. Gross unrealized losses and fair values, aggregated by investment category and length of time individual securities have been in a continuous unrealized loss position are shown below.
16
December 31, 2018
Less than 12 Months
12 Months or Greater Total Estimated
Fair Value
Gross Unrealized
Losses
Estimated Fair
Value
Gross Unrealized
Losses
Estimated Fair
Value
Gross Unrealized
Losses U.S. Government securities $ 988
$ 1
$ -
$ -
$ 988
$ 1
U.S. Government agencies and corporations -
-
2,618
27
2,618
27 State and political subdivisions 9,066
120
2,356
43
11,422
163 Corporate securities 2,457
49
-
-
2,457
49
Mortgage-backed securities 5,598
28
18,979
477
24,577
505
Other securities 323 2 - - 323 2
Totals $ 18,432
$ 200
$ 23,953
$ 547
$ 42,385
$ 747
17

Note 3 – Investment Securities – (Continued)
The table at December 31, 2018 includes thirty-three (33) securities that have unrealized losses for less than twelve months and thirty-five (35) securities that have been in an unrealized loss position for twelve or more months. The table at December 31, 2017 includes fourteen (14) securities that have unrealized losses for less than twelve months and twenty-one (21) securities that have been in an unrealized loss position for twelve or more months. Investment securities, other than mortgage-backed securities - The unrealized losses on the Company’s investments in investment securities, other than mortgage-backed securities, were caused by interest rate increases. The contractual terms of those investments do not permit the issuer to settle the securities at a price less than the amortized cost bases of the investments. Because the Company does not intend to sell the investments and it is not more likely than not that the Company will be required to sell the investments before recovery of their amortized cost bases which may be maturity, the Company does not consider those investments to be other-than-temporarily impaired at December 31, 2018. Mortgage-backed securities - The unrealized losses on the Company’s investment in Mortgage-backed securities were caused by interest rate increases. The contractual cash flows of those investments are guaranteed by an agency of the U.S. government. Accordingly, it is expected that the securities would not be settled at a price less than the amortized cost bases of the Company’s investments. Because the decline in market value is attributable to changes in interest rates and not credit quality, and because the Company does not intend to sell the investments and it is not more likely than not that the Company will be required to sell the investments before recovery of their amortized cost bases, which may be maturity, the Company does not consider those investments to be other-than-temporarily impaired at December 31, 2018.
17
December 31, 2017
Less than 12 Months
12 Months or Greater Total Estimated
Fair Value
Gross Unrealized
Losses
Estimated Fair
Value
Gross Unrealized
Losses
Estimated Fair
Value
Gross Unrealized
Losses U.S. Government agencies and corporations $ 2,484
$ 14
$ 145
$ 2
$ 2,629
$ 16 State and political subdivisions 1,900
9
495
9
2,395
18 Mortgage-backed securities 13,294
136
10,166
195
23,460
331
Totals $ 17,678
$ 159
$ 10,806
$ 206
$ 28,484
$ 365
18
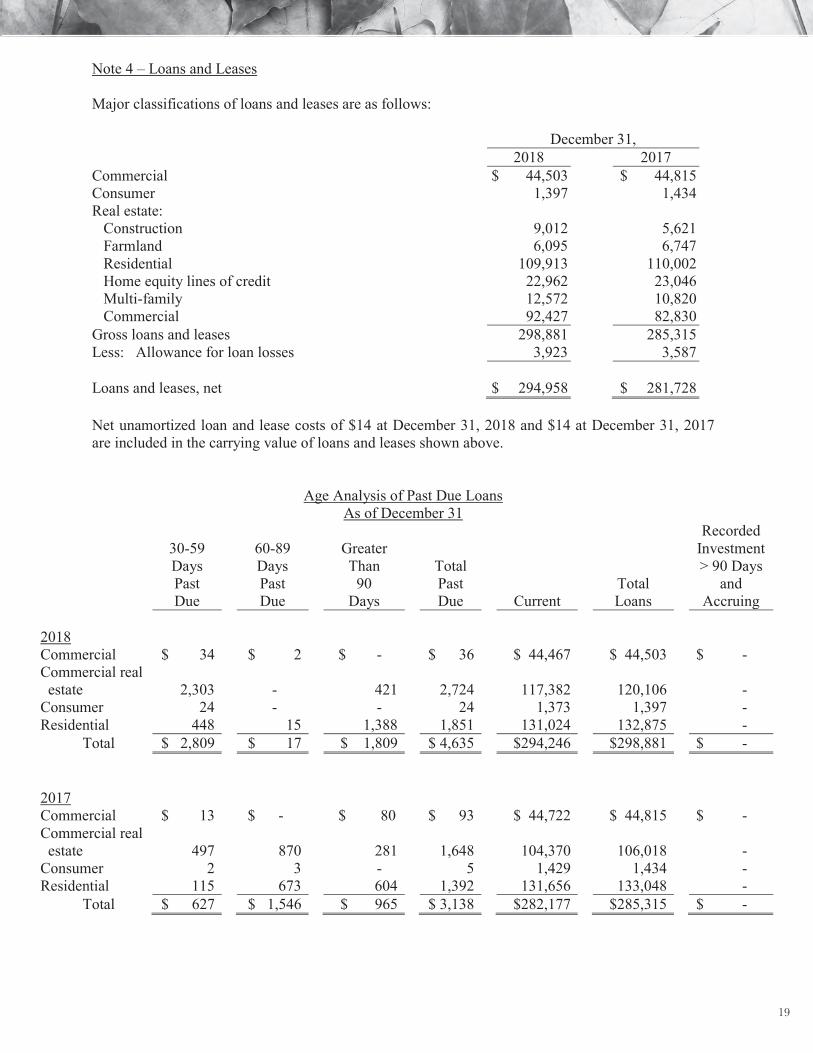
Note 4 – Loans and Leases Major classifications of loans and leases are as follows: December 31, 2018 2017 Commercial $ 44,503 $ 44,815 Consumer 1,397 1,434 Real estate: Construction 9,012 5,621 Farmland 6,095 6,747 Residential 109,913 110,002 Home equity lines of credit 22,962 23,046 Multi-family 12,572 10,820 Commercial 92,427 82,830 Gross loans and leases 298,881 285,315 Less: Allowance for loan losses 3,923 3,587 Loans and leases, net $ 294,958 $ 281,728 Net unamortized loan and lease costs of $14 at December 31, 2018 and $14 at December 31, 2017 are included in the carrying value of loans and leases shown above.
Age Analysis of Past Due Loans
As of December 31
30-59 Days Past Due
60-89 Days Past Due
Greater Than
90 Days
Total Past Due Current
Total Loans
Recorded Investment > 90 Days
and Accruing
2018 Commercial $ 34 $ 2 $ - $ 36 $ 44,467 $ 44,503 $ - Commercial real estate 2,303 - 421 2,724 117,382 120,106 - Consumer 24 - - 24 1,373 1,397 - Residential 448 15 1,388 1,851 131,024 132,875 - Total $ 2,809 $ 17 $ 1,809 $ 4,635 $294,246 $298,881 $ - 2017 Commercial $ 13 $ - $ 80 $ 93 $ 44,722 $ 44,815 $ - Commercial real estate 497 870 281 1,648 104,370 106,018 - Consumer 2 3 - 5 1,429 1,434 - Residential 115 673 604 1,392 131,656 133,048 - Total $ 627 $ 1,546 $ 965 $ 3,138 $282,177 $285,315 $ -
18 19

Note 4 – Loans and Leases – (Continued)
Credit Quality Indicators. As part of the on-going monitoring of the credit quality of the Corporation’s loan portfolio, management tracks certain credit quality indicators including trends related to (i) loan delinquency, (ii) the level of classified commercial loans, (iii) net charge-offs, (iv) non-performing loans (see details above) and (v) the general economic conditions in the State of Pennsylvania.
The Corporation utilizes a risk grading matrix to assign a risk grade to each of its commercial and residential loans. Loans are graded on a scale of 1 to 10. A description of the general characteristics of the 10 risk grades is as follows: Pass Credits (Rating 1 through 5): Loans that are adequately protected by the current sound worth and debt service capacity of the borrower, guarantor, or the underlying collateral generally are considered pass credits. Similarly, loans to sound borrowers that are renewed or restructured in accordance with prudent underwriting standards are considered pass credits. Watch (Rating 6): Watch credits are current and performing, but certain credit characteristics may have become impaired. Watch credits are those that require additional monitoring but do not fall into the problem asset grade. Special Mention (Rating 7): A Special Mention asset has potential weaknesses that deserve management's close attention. If left uncorrected, these potential weaknesses may result in deterioration of the repayment prospects for the asset or in the institution's credit position at some future date. Special Mention assets are not adversely classified and do not expose an institution to sufficient risk to warrant adverse classification. Substandard Assets (Rating 8): A substandard asset is inadequately protected by the current sound worth and paying capacity of the obligor or of the collateral pledged, if any. Assets so classified must have a well-defined weakness or weaknesses that jeopardize the liquidation of the debt. They are characterized by the distinct possibility that the institution will sustain some loss if the deficiencies are not corrected. Doubtful Assets (Rating 9): An asset classified doubtful has all the weaknesses inherent in one classified substandard with the added characteristic that the weaknesses make collection or liquidation in full, on the basis of currently existing facts, conditions, and values, highly questionable and improbable. Loss Assets (Rating 10): Assets classified loss are considered uncollectible and of such little value that their continuance as bankable assets is not warranted. This classification does not mean that the asset has absolutely no recovery or salvage value, but rather it is not practical or desirable to defer writing off this basically worthless asset even though partial recovery may be affected in the future.
19
Credit Risk Profile by Payment Activity
Consumer 2018 2017 Performing $ 1,394 $ 1,434 Nonperforming 3 - Total $ 1,397 $ 1,434
20

Note 4 – Loans and Leases – (Continued) Credit Quality Indicators as of December 31, 2018 and 2017 Commercial Credit Exposure Credit Risk Profile by Credit Worthiness Category
Commercial Commercial Real Estate
2018 2017 2018 2017
Pass $ 38,239 $ 41,497 $ 98,019 $ 82,558 Watch 4,812 5 6,572 5,789 Special mention - 3,163 1,642 10,515 Substandard 1,452 150 13,873 7,156 Doubtful - - - - Loss - - - - Total $ 44,503 $ 44,815 $ 120,106 $ 106,018
Impaired Loans. Loans are considered impaired when, based on current information and events, it is probable the Corporation will be unable to collect all amounts due in accordance with the original contractual terms of the loan agreement, including scheduled principal and interest payments. Impairment is evaluated in total for smaller-balance loans of a similar nature and on an individual loan basis for other loans. If a loan is impaired, a specific valuation allowance is allocated, if necessary, so that the loan is reported net, at the present value of estimated future cash flows using the loan’s existing rate or at the fair value of collateral if repayment is expected solely from the collateral. Interest payments on impaired loans are typically applied to principal unless collectability of the principal amount is reasonably assured, in which case interest is recognized on a cash basis. Impaired loans, or portions thereof, are charged off when deemed uncollectible.
20
Residential Credit Exposure Credit Risk Profile by Credit Worthiness Category
Residential 2018 2017 Pass $ 130,612 $ 130,515 Watch 715 347 Special mention - 272 Substandard 1,548 1,914
$ 132,875 $ 133,048
21

Note 4 – Loans and Leases – (Continued)
Impaired Loans For the Year Ended December 31, 2018
Unpaid Average Interest Recorded Principal Related Recorded Income Investment Balance Allowance Investment Recognized With no related allowance recorded: Commercial Real Estate $ 9,228 $ 9,228 $ - $ 9,502 $ 362 Commercial 724 1,636 - 784 80 Consumer - - - - - Residential Real Estate 1,204 1,220 - 1,229 42 With an allowance recorded:
Commercial Real Estate - - - - - Commercial 642 642 627 664 34 Consumer 3 3 3 4 - Residential Real Estate 544 544 120 554 30 Total: $ 12,345
$ 13,273
$ 750
$ 12,737
$ 548
Commercial Real Estate $ 9,228
$ 9,228
$ -
$ 9,502
$ 362 Commercial $ 1,366 $ 2,278 $ 627 $ 1,448 $ 114 Consumer $ 3 $ 3 $ 3 $ 4 $ - Residential Real Estate $ 1,748 $ 1,764 $ 120 $ 1,783 $ 72
Impaired Loans
For the Year Ended December 31, 2017
Unpaid Average Interest Recorded Principal Related Recorded Income Investment Balance Allowance Investment Recognized With no related allowance recorded: Commercial Real Estate $ 1,258 $ 1,284 $ - $ 1,047 $ 47 Commercial - 961 - 66 5 Consumer - - - - - Residential Real Estate 911 927 - 923 42 With an allowance recorded:
Commercial Real Estate 371 371 87 371 5 Commercial - - - - - Consumer - - - - - Residential Real Estate 757 757 282 767 43 Total: $ 3,297
$ 4,300
$ 369
$ 3,174
$ 142
Commercial Real Estate $ 1,629
$ 1,655
$ 87
$ 1,418
$ 52 Commercial $ - $ 961 $ - $ 66 $ 5 Consumer $ - $ - $ - $ - $ - Residential Real Estate $ 1,668 $ 1,684 $ 282 $ 1,690 $ 85
21 22

Note 4 – Loans and Leases – (Continued) Non-Accrual and Past Due Loans. Loans are considered past due if the required principal and interest payments have not been received as of the date such payments were due. Loans are placed on non-accrual status when, in management’s opinion, the borrower may be unable to meet payment obligations as they become due, as well as when required by regulatory provisions. Loans may be placed on non-accrual status regardless of whether or not such loans are considered past due. When interest accrual is discontinued, all unpaid accrued interest is reversed. Interest income is subsequently recognized only to the extent cash payments are received in excess of principal due. Loans are returned to accrual status when all the principal and interest amounts contractually due are brought current and future payments are reasonably assured with the minimum of a six month positive payment history.
Non-accrual loans at December 31, 2018 and 2017, segregated by class of loans, were as follows:
2018 2017
Commercial $ 642 $ - Commercial real estate 3,735 2,056 Consumer 3 - Residential real estate 1,708 1,469 $ 6,088 $ 3,525
Allowance for Credit Losses and Recorded Investment in Loans For The
Year Ended December 31, 2018
Commercial Commercial
Real Estate
Consumer Residential Unallocated
Total Allowance for credit losses:
Beginning balance $ 844 $ 1,364 $ 12 $ 1,280 $ 87 $ 3,587 Provision 383 - 15 (106) (52) 240 Loans charged off - - (12) (50) - (62) Recoveries 90 7 1 60 - 158 Ending balance $ 1,317 $ 1,371 $ 16
$ 1,184 $ 35
$ 3,923
Ending balance: Individually evaluated for impairment 627
-
3
120
-
750 Ending balance: Collectively evaluated for impairment $ 690
$ 1,371
$ 13
$ 1,064
$ 35
$ 3,173
Loans: Ending balance $ 44,503 $ 120,106 $ 1,397 $ 132,875 $298,881 Ending balance: Individually evaluated for impairment 1,366
9,228
3
1,748
12,345 Ending balance: Collectively evaluated for impairment
$ 43,137
$ 110,878
$ 1,394
$ 131,127
$286,536
22 23

Note 4 – Loans and Leases – (Continued)
Allowance for Credit Losses and Recorded Investment in Loans For The Year Ended December 31, 2017
Commercial
Commercial Real Estate Consumer Residential Unallocated
Total Allowance for credit losses:
Beginning balance $ 940 $ 984 $ 10 $ 1,249 $ 36 $ 3,219 Provision (92) 364 10 27 51 360 Loans charged off (113) (337) (8) (1) - (459) Recoveries 109 353 - 5 - 467 Ending balance $ 844 $ 1,364 $ 12
$ 1,280 $ 87
$ 3,587
Ending balance: Individually evaluated for impairment -
87
-
282
-
369 Ending balance: Collectively evaluated for impairment $ 844
$ 1,277
$ 12
$ 998
$ 87
$ 3,218
Loans: Ending balance $ 44,815 $ 106,018 $ 1,434 $ 133,048 $285,315 Ending balance: Individually evaluated for impairment -
1,629
-
1,668
3,297 Ending balance: Collectively evaluated for impairment
$ 44,815
$ 104,389
$ 1,434
$ 131,380
$282,018 The allowance for possible loan losses is a reserve established through a provision for possible loan losses charged to expense, which represents management’s best estimate of probable losses that have been incurred within the existing portfolio of loans. The allowance, in the judgment of management, is necessary to reserve for estimated loan losses and risks inherent in the loan portfolio. The Corporation’s allowance for possible loan loss methodology includes allowance allocations calculated in accordance with ASC Topic 310, “Receivables” and allowance allocations calculated in accordance with ASC Topic 450, “Contingencies.” Accordingly, the methodology is based on historical loss experience by type of credit and internal risk grade, specific homogeneous risk pools and specific loss allocations, with adjustments for current events and conditions. The Corporation’s process for determining the appropriate level of the allowance for possible loan losses is designed to account for credit deterioration as it occurs. The provision for possible loan losses reflects loan quality trends, including the levels of and trends related to non-accrual loans, past due loans, potential problem loans, criticized loans and net charge-offs or recoveries, among other factors. The provision for possible loan losses also reflects the totality of actions taken on all loans for a particular period. In other words, the amount of the provision reflects not only the necessary increases in the allowance for possible loan losses related to newly identified criticized loans, but it also reflects actions taken related to other loans including, among other things, any necessary increases or decreases in required allowances for specific loans or loan pools.
23
24

Note 4 – Loans and Leases – (Continued)
The Company has no commitments to loan additional funds to borrowers whose loans have been modified. The Company grants commercial and consumer loans to customers primarily in Lycoming and Clinton Counties, Pennsylvania. The Company has a concentration of loans secured by real estate. Although the Company has a diversified loan portfolio, a substantial portion of its debtors’ ability to honor their contracts is dependent on, among other things, the economic conditions within Lycoming and Clinton Counties. Transactions in the allowance for loan and lease losses are summarized as follows: Years Ended December 31, 2018 2017 Beginning balance $ 3,587 $ 3,219 Provision charged to operations 240 360 Loans charged off (62) (459) Recoveries of loans previously charged off 158 467 Ending balance $ 3,923 $ 3,587
The Company considers a loan to be a troubled debt restructuring when for economic or legal reasons related to a borrower's financial difficulties, the Company grants a concession to the borrower that it would not otherwise consider. The Company may consider granting a concession in an attempt to protect as much of its investment as possible.
The restructuring of a loan may include, but is not necessarily limited to (1) the transfer from the borrower to the Bank of real estate, receivables from third parties, other assets, or an equity interest in the borrower in full or partial satisfaction of the loan (2) the issuance or other granting of an equity interest to the Company by the borrower to satisfy fully or partially a debt unless the equity interest is granted pursuant to existing terms for converting the debt in to an equity interest (3) a modification of the loan terms, such as a reduction of the stated interest rate, principal, or accrued interest or an extension of the maturity date at a stated interest rate lower than the current market rate for new debt with similar risk, or (4) a reduction of the face amount or maturity amount of the debt as stated in the instrument or other agreement and (5) a reduction of accrued interest.
24 25

Note 4 – Loans and Leases – (Continued) The outstanding balance of troubled debt restructurings at December 31, 2018 and December 31, 2017 was $3,423 (all classified as non-accrual) and $366 ($199 of loans in accrual status and $167 of loans classified as non-accrual), respectively. Troubled debt restructurings during the years ending December 31, 2018 and 2017 are as follows:
2018
Troubled Debt Restructurings
Number of Contracts
Pre-Modification Outstanding
Recorded Investment
Outstanding Recorded Investment at December 31
Commercial -
$ -
$ - Commercial Real Estate 4
3,158
3,136
Residential -
-
- Consumer -
-
-
Total 4
$ 3,158
$ 3,136
The Bank did not forgive debt with the modification of the loans. The Bank received $95 in recoveries and did not recognize a write down for potential collateral shortfall during 2018. Troubled Debt Restructurings that Subsequently Defaulted During the 12 Months Ended December 31, 2018
Number of Contracts
Recorded Investment
Commercial - $ - Commercial Real Estate 1 1,785 Residential Real Estate 1 195 Consumer - - Total 2 $ 1,980
2017
Troubled Debt Restructurings
Number of Contracts
Pre-Modification Outstanding
Recorded Investment
Outstanding Recorded Investment at December 31
Commercial -
$ -
$ - Commercial Real Estate -
-
-
Residential 1
200
199 Consumer -
-
-
Total 1
$ 200
$ 199
25 26

Note 4 – Loans and Leases – (Continued) Troubled Debt Restructurings that Subsequently Defaulted During the 12 Months Ended December 31, 2017
Number of Contracts
Recorded Investment
Commercial 1 $ - Commercial Real Estate - - Residential Real Estate 2 89 Consumer - - Total 3 $ 89
Note 5 – Bank Premises and Equipment Bank premises and equipment are summarized as follows: December 31, 2018 2017 Land $ 3,009 $ 3,009 Bank premises 9,508 9,456 Furniture and equipment 1,983 1,993 Capitalized software 380 380 Total 14,880 14,838 Less: accumulated depreciation 5,182 4,809 Bank premises and equipment, net $ 9,698 $ 10,029
Depreciation of bank premises and equipment charged to operations amounted to $373 and $397 for the years ended December 31, 2018 and 2017, respectively. Note 6 – Cash Surrender Value of Life Insurance The Company has purchased Bank Owned Life Insurance (BOLI) policies on certain officers. The policies are split-dollar life insurance policies which provide for the Company to receive the cash value of the policy and to split the residual proceeds with the officer’s designated beneficiary upon the death of the insured, while the officer is employed at the Company. The majority of the residual proceeds are retained by the Company per the individual agreements with the insured officers. Note 7 – Restricted Stock Restricted stock at December 31, 2018 and 2017 consisted of Federal Home Loan Bank (FHLB), Federal Reserve Bank (FRB) and Atlantic Central Bankers Bank (ACBB) stock, which are required investments in order to participate in various programs including an available line of credit program. All restricted stock is stated at par value as they are restricted to purchases and sales with the various institutions.
26 27

Note 8 – Deposits The composition of deposits is as follows:
December 31, 2018 2017 Demand - non-interest bearing $ 83,008 $ 77,433 Demand - interest bearing 76,345 67,966 Savings 120,558 125,783 Money markets 3,346 4,419 Time - over $250,000 10,494 7,707 Time - other 63,580 58,062
Total $ 357,331 $ 341,370 The scheduled maturities of time deposits at December 31, 2018 are as follows:
2019 $ 24,617 2020 20,398 2021 18,898 2022 4,233 2023 5,522 Thereafter 406 Total $ 74,074
Time deposits of $250,000 or more totaled $10,494 and $7,707 at December 31, 2018 and 2017, respectively. Interest expense related to these deposits was $133 and $98 in 2018 and 2017, respectively. Note 9 – Short-Term Borrowings Securities sold under agreements to repurchase and Federal funds purchased generally mature within 1 to 30 days. Federal Home Loan Bank advances mature within one year of issuance date. A summary of short-term borrowings is as follows: Years Ended December 31, 2018 2017 Amount outstanding at year-end $ - $ - Average interest rate at year-end - - Maximum amount outstanding at any month-end $ - $ 1,000 Average amount outstanding $ - $ 833 Average interest rate - 0.99%
There were no investment securities pledged to secure repurchase agreements at December 31, 2018 or 2017.
27 28

Note 9 – Short-Term Borrowings – (Continued) The Bank has the availability of Federal funds credit lines of $5,500. There was no outstanding balance on the line at December 31, 2018 or 2017. The Bank has available three types of borrowings with the Federal Home Loan Bank (FHLB). Advances under the FHLB “Open RepoPlus” are short-term borrowings maturing within one year and bear interest at a variable rate based on a requested interest payment frequency. Advances under the FHLB “RepoPlus” and “Mid-Term Repo” are borrowings maturing from 1 day to 3 years and bear interest at a fixed rate or an adjustable rate set at the time of funding. The Bank has a borrowing limit under this arrangement of approximately $108,902, exclusive of any outstanding advances. All advances are collateralized by the Bank’s FHLB stock and certain permitted bank loans and securities under a floating-lien agreement. Note 10 – Long-Term Debt Long-term debt consists of separate loans with the FHLB. These loans bear interest at rates which range from 1.32% to 2.08% per annum and mature at various dates through the year 2021. The following table summarizes the maturities of borrowed funds at December 31, 2018:
2019 $ 1,000 2020 11,000 2021 1,000 Total $ 13,000
Note 11 – Income Taxes The components of applicable income taxes are as following:
Years Ended December 31, 2018 2017 Current payable $ 1,294 $ 1,433 Deferred (benefit) provision (116) 329 Provision for income taxes $ 1,178 $ 1,762
28 29

Note 11 – Income Taxes – (Continued) The tax effects of deductible and taxable temporary differences that give rise to significant portions of the deferred tax assets and deferred tax liabilities are as follows: December 31, 2018 2017 Deferred tax assets: Allowance for loan losses $ 846 $ 775 Deferred expenses 442 392 Deferred security losses - 18 Unrealized holding loss on available-for-sale securities 112 - Total 1,400 1,185 Deferred tax liabilities: Premises and equipment 110 120 Securities discount accretion 10 7 Investment in limited partnership 4 10 Unrealized holding gain on available-for-sale securities - 279 Total 124 416 Deferred tax asset, net $ 1,276 $ 769
The reconciliation between the expected statutory income tax rate and the effective income tax rate is as follows: Years Ended December 31, 2018 2017 Amount % Amount % Provision at statutory rate $ 1,393 21.0 $ 1,678 34.0 Tax-exempt income (256) (3.9) (446) (9.0) Nondeductible interest expense 7 0.1 10 0.2 Tax Cut and Jobs Act impact - - 471 9.5 Other items 34 0.5 49 1.0 Total $ 1,178 17.7 $ 1,762 35.7 2017 Tax Legislation
On December 22, 2017, the President of the United States signed into law the Tax Cuts and Jobs Act tax reform legislation. This legislation made significant changes in U.S. tax law including a reduction in the corporate tax rates, changes to net operating loss carryforwards and carrybacks, and a repeal of the corporate alternative minimum tax. The legislation reduced the highest U.S. corporate tax rate from 35% to 21%, effective January 1, 2018. As a result of the enacted law, the Company was required to revalue deferred tax assets and liabilities at the enacted rate during 2017. This revaluation resulted in an additional charge of $471 to income tax expense in continuing operations and a corresponding reduction in the net deferred tax assets. The other provisions of the Tax Cuts and Jobs Act did not have a material impact on the 2017 financial statements.
2930

Note 12 – Commitments and Contingencies The Bank leases facilities and office equipment under noncancellable operating leases which expire in various years through 2044. The minimum annual rental commitments under these leases at December 31, 2018 are as follows:
2019 $ 11 2020 10 2021 11 2022 8 2023 4 Thereafter 102 Total $ 146
The total rental expense for these operating leases in 2018 and 2017 amounted to $16 and $26, respectively.
Note 13 – Employee Benefit Plans The Company maintains a defined contribution benefit plan under Section 401(k) of the Internal Revenue Code, which covers substantially all eligible employees. This plan permits employees to make contributions, which are matched by the Company based on a percentage of the employee’s compensation, subject to certain restrictions. The cost of this plan is charged to operating expense annually as benefit costs are incurred. The Company’s contribution to the plan was $167 and $164 for the years ended December 31, 2018 and 2017, respectively. The Company has a supplemental non-qualified, non-funded retirement plan, for which the Company has purchased cost recovery life insurance on the lives of the participants. The Company is the owner and beneficiary of such policies. The amount of the coverage is designed to provide sufficient revenues to cover all costs of the plan if assumptions made as to mortality experience, policy earnings and other factors are realized. As of December 31, 2018 and 2017, the cash surrender value of these policies was $6,427 and $6,653, respectively.
Note 14 – Employee Stock Purchase Plan The Company has an employee stock purchase plan that allows participating employees to purchase, through payroll deductions, shares of the Company’s common stock at 90% of the fair market value at specified dates. Under the plan, employees purchased 1,345 shares in 2018 and 1,570 shares in 2017. At December 31, 2018, 12,559 common shares are available for issuance under this plan.
30 31

Note 15 – Related Party Transactions In the normal course of business, loans are extended to directors, executive officers and their associates. In management’s opinion, all of these loans are on substantially the same terms and conditions as loans to other individuals and businesses of comparable creditworthiness. A summary of loan activity for those directors, executive officers, and their associates is as follows: Years Ended December 31,
Beginning Balance Additions Reductions
Ending Balance
2018 $ 12,367 $ 5,106 $ 4,207 $ 13,266 2017 $ 12,232 $ 5,787 $ 5,652 $ 12,367
The Company held related party deposits of $5,354 and $4,839 at December 31, 2018 and 2017, respectively. Note 16 – Other Comprehensive Income
Accounting principles generally require that recognized revenue, expenses, gains and losses be included in net income. Although certain changes in assets and liabilities, such as unrealized gains and losses on available-for-sale securities, are reported as a separate component of the equity section of the balance sheets, such items, along with net income, are components of comprehensive income. A summary of other comprehensive income for the years ended December 31, 2018 and 2017 is as follows: 2018 2017 Components of other comprehensive income: Unrealized holding (losses) gains arising during the year $ (735) $ 143 Reclassification adjustment for investment securities: (Gains) losses included in net income during the year (1,127) 123 Net unrealized (losses) gains (1,862) 266 Tax effect 391 (91) Other comprehensive income $ (1,471) $ 175
Note 17 – Off-Balance Sheet Risk In the normal course of business, there are outstanding commitments and contingent liabilities, created under prevailing terms and collateral requirements such as commitments to extend credit, financial guarantees and letters of credit, which are not reflected in the accompanying Financial Statements. The Company does not anticipate any losses as a result of these transactions. These instruments involve, to varying degrees, elements of credit and interest rate risk in excess of the amount recognized in the Balance Sheets.
The contract or notional amounts of those instruments reflect the extent of involvement the Company has in particular classes of financial instruments.
31 32

Note 17 – Off-Balance Sheet Risk – (Continued) Financial instruments whose contract amounts represent credit risk at December 31, 2018 and 2017 are as follows: 2018 2017 Commitments to extend credit $ 4,672 $ 18,749 Unfunded commitments under lines of credit $ 80,840 $ 72,745 Standby letters of credit $ 1,982 $ 1,810
Commitments to extend credit are agreements to lend to a customer as long as there is no violation of any condition established in the contract. Commitments generally have expiration dates of one year or less or other termination clauses and may require payment of a fee. Since many of the commitments are expected to expire without being drawn upon, the total commitment amounts do not necessarily represent future cash requirements.
Standby letters of credit are conditional commitments issued to guarantee the performance of a customer to a third party. The credit risk involved in issuing letters of credit is essentially the same as that involved in extending loan facilities to customers. Various actions and proceedings are presently pending to which the Company is a party. Management is of the opinion that the aggregate liabilities, if any, arising from such actions would not have a material adverse effect on the financial position of the Company.
Note 18 – Regulatory Matters The Company and the Bank are subject to various regulatory capital requirements administered by its primary federal regulator, the Federal Reserve Bank (FRB) and the Commonwealth of Pennsylvania Department of Banking and Securities. Failure to meet the minimum regulatory capital requirements can initiate certain mandatory, and possible additional discretionary, actions by regulators that, if undertaken, could have a direct material effect on the Company’s financial statements. Under the capital adequacy guidelines and the regulatory framework for prompt corrective action, the Company and the Bank must meet specific capital guidelines that involve quantitative measures of their assets, liabilities, and certain off-balance sheet items as calculated under regulatory accounting practices. The Company’s and the Bank’s capital amounts and classification are also subject to qualitative judgments by the regulators about components, risk weightings, and other factors.
Quantitative measures established by regulation to ensure capital adequacy require the Company and the Bank to maintain minimum amounts and ratios (set forth in the following Capital Adequacy table) of Tier I, Common Equity Tier I and Total Capital to risk-weighted assets and of Tier I Capital to average assets (Leverage ratio). The table also presents the Company's actual capital amounts and ratios. Management believes, as of December 31, 2018 and 2017, that the Company and the Bank meet all capital adequacy requirements to which they are subject. As of December 31, 2018 and 2017, the Bank was categorized as well capitalized under the regulatory framework for prompt corrective action. To be categorized as "well capitalized", the Bank must maintain minimum ratios as set forth in the table. There are no conditions or events since December 31, 2018 that management believes have changed the Bank's categorization.
32 33
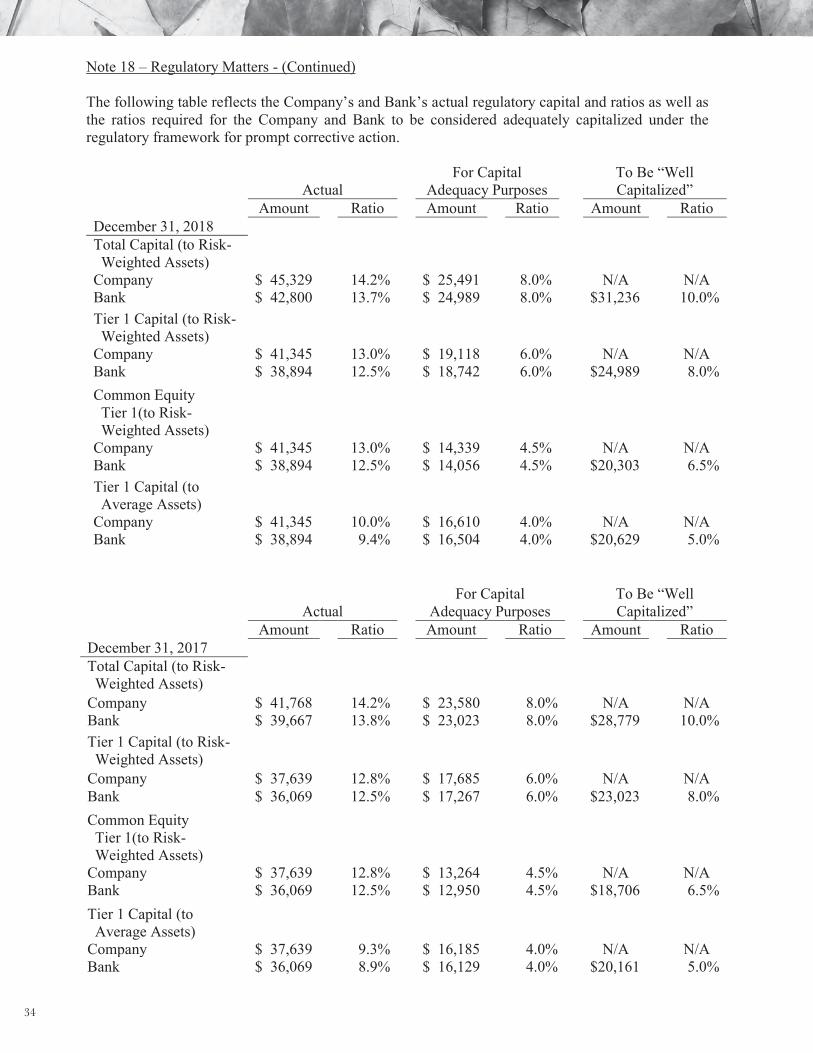
Note 18 – Regulatory Matters - (Continued) The following table reflects the Company’s and Bank’s actual regulatory capital and ratios as well as the ratios required for the Company and Bank to be considered adequately capitalized under the regulatory framework for prompt corrective action.
Actual For Capital
Adequacy Purposes To Be “Well Capitalized”
Amount Ratio Amount Ratio Amount Ratio December 31, 2018 Total Capital (to Risk- Weighted Assets) Company $ 45,329 14.2% $ 25,491 8.0% N/A N/A Bank $ 42,800 13.7% $ 24,989 8.0% $31,236 10.0% Tier 1 Capital (to Risk- Weighted Assets) Company $ 41,345 13.0% $ 19,118 6.0% N/A N/A Bank $ 38,894 12.5% $ 18,742 6.0% $24,989 8.0% Common Equity Tier 1(to Risk- Weighted Assets) Company $ 41,345 13.0% $ 14,339 4.5% N/A N/A Bank $ 38,894 12.5% $ 14,056 4.5% $20,303 6.5% Tier 1 Capital (to Average Assets) Company $ 41,345 10.0% $ 16,610 4.0% N/A N/A Bank $ 38,894 9.4% $ 16,504 4.0% $20,629 5.0%
Actual For Capital
Adequacy Purposes To Be “Well Capitalized”
Amount Ratio Amount Ratio Amount Ratio December 31, 2017 Total Capital (to Risk- Weighted Assets) Company $ 41,768 14.2% $ 23,580 8.0% N/A N/A Bank $ 39,667 13.8% $ 23,023 8.0% $28,779 10.0% Tier 1 Capital (to Risk- Weighted Assets) Company $ 37,639 12.8% $ 17,685 6.0% N/A N/A Bank $ 36,069 12.5% $ 17,267 6.0% $23,023 8.0% Common Equity Tier 1(to Risk- Weighted Assets) Company $ 37,639 12.8% $ 13,264 4.5% N/A N/A Bank $ 36,069 12.5% $ 12,950 4.5% $18,706 6.5% Tier 1 Capital (to Average Assets) Company $ 37,639 9.3% $ 16,185 4.0% N/A N/A Bank $ 36,069 8.9% $ 16,129 4.0% $20,161 5.0%
33 34

Note 18 – Regulatory Matters - (Continued) Restrictions imposed by Federal Reserve Regulation H limit dividend payments in any year to the current year’s net income plus the retained net income of the prior two years without the approval of the Federal Reserve Bank. Accordingly, Bank dividends in 2019 may not exceed Bank net income for 2019 plus $5,585. Additionally, banking regulations limit the amount of dividends that may be paid to the Company by the Bank without prior approval of the Bank’s regulatory agency. Retained earnings against which dividends may be paid without prior approval of the banking regulators amounted to approximately $27,887 at December 31, 2018, subject to the minimum capital ratio requirements noted above. The Bank is subject to regulatory restrictions that limit its ability to loan or advance funds to the Company. At December 31, 2018, the regulatory lending limit amounted to approximately $6,438. This statement has not been reviewed or confirmed for accuracy or relevance by the Federal Deposit Insurance Corporation.
Note 19 –Fair Value of Financial Instruments
The following table presents information about the Company’s assets and liabilities measured at fair value on a recurring and nonrecurring basis as of December 31, 2018 and 2017, and indicates the fair value hierarchy of the valuation techniques utilized by the Company to determine such fair value. In general, fair values determined by Level 1 inputs utilize quoted prices (unadjusted) in active markets for identical assets or liabilities that the Company has the ability to access. Fair values determined by Level 2 inputs utilize information other than the quoted prices included in Level 1 that are observable for the asset or liability, either directly or indirectly. Level 2 inputs include quoted prices for similar assets and liabilities in active markets, and inputs other than quoted prices that are observable for the asset or liability, such as interest rates and yield curves that are observable at commonly quoted intervals. Level 3 inputs are unobservable inputs for the asset or liability, and include situations where there is little, if any, market activity for the asset or liability. In certain cases, the inputs used to measure fair value may fall into different levels of the fair value hierarchy. In such cases, the level in the fair value hierarchy within which the fair value measurement, in its entirety, falls has been determined based on the lowest level input that is significant to the fair value measurement. The Company’s assessment of the significance of a particular input to the fair value measurement in its entirety requires judgment, and considers factors specific to the asset or liability.
34 35

Note 19 –Fair Value of Financial Instruments – (Continued)
35
Fair Value Measurements at December 31, 2018 Using Quoted Prices
in Active Markets for
Identical Instrument (Level 1)
Significant Other
Observable Input
(Level 2)
Significant Unobservable
Input (Level 3) Total
Assets Measured at Fair Value on a Recurring Basis:
Available-for-sale securities:
U.S. Government agencies and corporations $ -
$ 8,107
$ -
$ 8,107
States and political subdivisions -
26,142
-
26,142
Corporate securities - 8,162 - 8,162 Mortgage-backed securities - 30,299 - 30,299 Equity securities - - - - Assets Measured at Fair Value on a Nonrecurring Basis:
Impaired loans $ - $ - $ 11,595 $ 11,595 Restricted stock - - 1,045 1,045
Fair Value Measurements at December 31, 2017 Using Quoted Prices
in Active Markets for
Identical Instrument (Level 1)
Significant Other
Observable Input
(Level 2)
Significant Unobservable
Input (Level 3) Total
Assets Measured at Fair Value on a Recurring Basis:
Available-for-sale securities:
U.S. Government agencies and corporations $ -
$ 4,680
$ -
$ 4,680
States and political subdivisions -
32,829
-
32,829
Corporate securities - 6,026 - 6,026 Mortgage-backed securities - 25,934 - 25,934 Equity securities 2,111 - - 2,111 Assets Measured at Fair Value on a Nonrecurring Basis:
Impaired loans $ - $ - $ 2,928 $ 2,928 Restricted stock - - 1,085 1,085
36
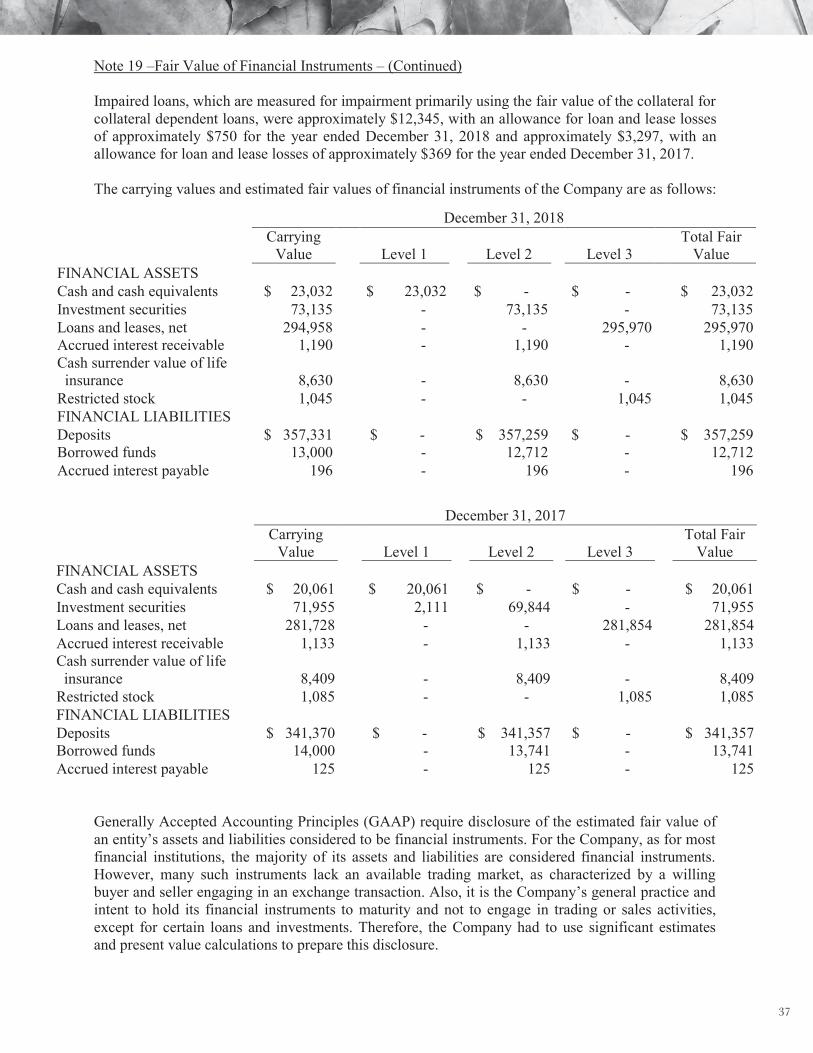
Note 19 –Fair Value of Financial Instruments – (Continued) Impaired loans, which are measured for impairment primarily using the fair value of the collateral for collateral dependent loans, were approximately $12,345, with an allowance for loan and lease losses of approximately $750 for the year ended December 31, 2018 and approximately $3,297, with an allowance for loan and lease losses of approximately $369 for the year ended December 31, 2017. The carrying values and estimated fair values of financial instruments of the Company are as follows:
Generally Accepted Accounting Principles (GAAP) require disclosure of the estimated fair value of an entity’s assets and liabilities considered to be financial instruments. For the Company, as for most financial institutions, the majority of its assets and liabilities are considered financial instruments. However, many such instruments lack an available trading market, as characterized by a willing buyer and seller engaging in an exchange transaction. Also, it is the Company’s general practice and intent to hold its financial instruments to maturity and not to engage in trading or sales activities, except for certain loans and investments. Therefore, the Company had to use significant estimates and present value calculations to prepare this disclosure.
36
December 31, 2018
Carrying
Value Level 1 Level 2 Level 3 Total Fair
Value FINANCIAL ASSETS Cash and cash equivalents $ 23,032 $ 23,032 $ - $ - $ 23,032 Investment securities 73,135 - 73,135 - 73,135 Loans and leases, net 294,958 - - 295,970 295,970 Accrued interest receivable 1,190 - 1,190 - 1,190 Cash surrender value of life insurance 8,630 - 8,630 -
8,630
Restricted stock 1,045 - - 1,045 1,045 FINANCIAL LIABILITIES Deposits $ 357,331 $ - $ 357,259 $ - $ 357,259 Borrowed funds 13,000 - 12,712 - 12,712 Accrued interest payable 196 - 196 - 196
December 31, 2017
Carrying
Value Level 1 Level 2
Level 3 Total Fair
Value FINANCIAL ASSETS Cash and cash equivalents $ 20,061 $ 20,061 $ - $ - $ 20,061 Investment securities 71,955 2,111 69,844 - 71,955 Loans and leases, net 281,728 - - 281,854 281,854 Accrued interest receivable 1,133 - 1,133 - 1,133 Cash surrender value of life insurance 8,409 - 8,409 -
8,409
Restricted stock 1,085 - - 1,085 1,085 FINANCIAL LIABILITIES Deposits $ 341,370 $ - $ 341,357 $ - $ 341,357 Borrowed funds 14,000 - 13,741 - 13,741 Accrued interest payable 125 - 125 - 125
37

Note 19 –Fair Value of Financial Instruments – (Continued) Changes in the assumptions or methodologies used to estimate fair values may materially affect the estimated amounts. Also, management is concerned that there may not be reasonable comparability between institutions due to the wide range of permitted assumptions and methodologies in the absence of active markets. This lack of uniformity gives rise to a high degree of subjectivity in estimating financial instrument fair values. Estimated fair values have been determined by the Company using the best available data and an estimation methodology suitable for each category of financial instruments. The estimation methodologies used at December 31, 2018 and December 31, 2017 are outlined below. The methodologies for estimating the fair value of financial assets and financial liabilities that are measured at fair value on a recurring or non-recurring basis are discussed in the fair value measurements section above. The estimated fair value approximates carrying value for cash and cash equivalents, accrued interest and the cash surrender value of life insurance policies. The methodologies for other financial assets and financial liabilities are discussed below: Investment securities - The fair value of investment securities is based on quoted market prices, where available. If quoted market prices are not available, external pricing services that approximate fair value are used. Loans - Fair values are estimated for portfolios of loans with similar financial characteristics. For variable-rate loans that reprice frequently and with no significant change in credit risk, fair values are based on carrying amounts. The fair values for other loans are estimated using discounted cash flow analysis, based on interest rates currently being offered for loans with similar terms to borrowers of similar credit quality. Restricted stock - All restricted stock is stated at par value as they are restricted to purchases and sales with the various institutions. Deposits - The fair value of deposits with no stated maturity is the amount payable on demand as of December 31, 2018 and 2017. For time deposits, fair value is estimated by discounting the contractual cash flows using a discount rate equal to the rate currently offered for similar deposits of similar maturities. Borrowed Funds – Rates available to the Company for borrowed funds with similar terms and remaining maturities are used to estimate the fair value of borrowed funds.
37 38

Note 20 – Condensed Financial Statements of Parent Company The condensed financial statements for Woodlands Financial Services Company are as follows:
December 31, BALANCE SHEETS 2018 2017
ASSETS Cash and cash equivalents $ 2,172 $ 163 Investment in subsidiaries 38,743 38,509 Other assets 9 16 Total Assets $ 40,924 $ 38,688
LIABILITIES AND STOCKHOLDERS’ EQUITY
Stockholders’ Equity $ 40,924 $ 38,688 Total Liabilities and Stockholders’ Equity $ 40,924 $ 38,688 Years Ended December 31, STATEMENTS OF INCOME 2018 2017 Dividends from subsidiaries $ 3,788 $ 1,262 Equity in undistributed earnings of subsidiaries 1,705 1,943 Other income 4 1 Expenses (37) (32) Net Income $ 5,460 $ 3,174
Years Ended December 31,
STATEMENTS OF CASH FLOWS 2018 2017 Operating Activities: Net income $ 5,460 $ 3,174 Adjustments to reconcile net income to net cash provided by operating activities
Equity in undistributed earnings of subsidiaries (1,705) (1,943) Decrease in other assets 7 3 Net cash provided by operating activities 3,762 1,234 Investing Activities: Investment in subsidiaries - - Net cash used by investing activities - - Financing Activities: Issuance of common stock 35 31 Dividends paid (1,788) (1,262) Net cash used by financing activities (1,753) (1,231) Increase in cash and cash equivalents 2,009 3 Cash and cash equivalents at January 1 163 160 Cash and cash equivalents at December 31 $ 2,172 $ 163
38 39

4040

41


![Reportable Claims [PDF, 2MB]](https://static.fdocuments.us/doc/165x107/5868cb291a28ab3f7c8b6c73/reportable-claims-pdf-2mb.jpg)


