
SEERISK: COMMON RISK ASSESSMENT METHODOLOGY FOR THE DANUBE ... · PDF fileERISK 0 SEERISK:...
113
ERISK 0 SEERISK: COMMON RISK ASSESSMENT METHODOLOGY FOR THE DANUBE MACRO-REGION Activity: WP3 3.1 Author: University of Vienna National Directorate General for Disaster Management Version Final Date 20/06/2013
Transcript of SEERISK: COMMON RISK ASSESSMENT METHODOLOGY FOR THE DANUBE ... · PDF fileERISK 0 SEERISK:...

ERISK
0
SEERISK: COMMON RISK ASSESSMENT METHODOLOGY FOR THE DANUBE
MACRO-REGION
Activity: WP3 3.1
Author: University of Vienna
National Directorate General for Disaster Management
Version Final
Date 20/06/2013

1
This project is funded by the European Union
This publication has been produced with the assistance of the European Union. The contents of this
publication are the sole responsibility of the University of Vienna and can in no way be taken to reflect
the views of the European Union.
ERISK
2
SUMMARY
The latest report for IPCC (2012) suggests that a significant increase in frequency and magnitude of
natural hazards related to climate change (e.g. floods, heat waves, drought, wild fires, etc.) is to be
expected at a global scale. There is therefore a need to improve the level of preparedness, the
institutional gaps and the weak territorial planning as well as the level of public awareness in order to
reduce the potentially catastrophic consequences of natural hazards related to climate change. The
SEERISK project aims at putting in practice the EC guidelines for risk assessment and mapping in the
partner countries, contributing in this way in the improvement of coherence and consistency among risk
assessment practices implemented in the partner countries. The present document is a presentation of
the proposed common methodology for risk assessment and mapping. The methodology is based on the
EC Guidelines for risk assessment and mapping but at the same time it considers local drawbacks such as
the lack of records of historic events, spatial data and other relevant data, offering alternatives for the
implementation of risk assessment and the production of risk maps.
In the first chapter, the introduction provides information regarding the aim of the SEERISK project and
the background of the development of the methodology (questionnaire).The second chapter highlights
the aim of the common methodology for risk assessment and mapping which is the integration of the EC
Guidelines and the harmonization of the risk assessment process among the partner countries.
Moreover, the methodology focuses on the production of risk matrices and risk maps for different types
of hazards. Being solution oriented the methodology deals with problems related to the lack of data by
offering alternatives. The third chapter introduces briefly the EC Guidelines for risk assessment and
mapping. The fourth chapter is dedicated to the presentation of the Common methodology. In this
chapter the methodology is presented as a general workflow that theoretically can work for any type of
hazard, whereas later, the same workflow is presented for each hazard separately. First, the
methodological steps for the risk assessment are presented: a) the context and risk identification, b) the
risk analysis (hazard and vulnerability analysis) and finally c) the risk evaluation. In this chapter the
different types of risk assessment (qualitative, semi-quantitative and quantitative) are explained.
Moreover, detailed methodological steps for the development for risk matrices are also given.
Important tools for risk assessment such as risk curves, F-N curves and vulnerability curves are also
explained and demonstrated within this chapter. The general workflow for risk assessment and mapping
is shown in three figures:

3
a. Hazard assessment: providing information about alternative solutions in case the amount or
quality of data is not adequate and finally an exit strategy. Future steps are also proposed.
b. Impact assessment: providing information on alternatives, exit solution and future steps.
c. Risk assessment: demonstrating the combination of hazard and impact information in order to
implement risk assessment and produce a risk map.
The workflow is described separately for qualitative and for quantitative risk assessment. The final step
is to include changes not only regarding the climate but also the socio-economic setting. In chapters 5-9
the methodology is presented modified for each type of natural hazards that is going to be considered in
the SEERISK project: floods, heat waves, droughts, extreme winds, wild fire. Basic information on each
natural hazard and its special characteristics to be considered is given at the beginning of each chapter.
The methodology for each type of hazard is presented followed by an example of risk assessment for the
specific hazard (only for floods, heat wave and drought) using a virtual city (RISKVille) and virtual sets of
data. In chapter 10, the major drawback in conducting risk assessment in the partner countries, the lack
of data, is confronted. Recommendations for better documentation of the hazard and the impact are
presented in order to improve the quality of data for future risk assessment. Finally, in Chapter 12, a list
of the main terms related to risk assessment is presented.

4
CONTENTS
SUMMARY ..................................................................................................................................................................... 2
Contents ........................................................................................................................................................................ 4
List of Figures ................................................................................................................................................................. 6
List of tables ................................................................................................................................................................... 7
1. Introduction .......................................................................................................................................................... 8
2. Aim of the Common methodology ....................................................................................................................... 8
3. EC Guidelines and theoretical background ........................................................................................................... 9
4. Common methodology ....................................................................................................................................... 10
4.1 Methodological steps for risk assessment ........................................................................................................ 10
4.2 Context and Risk Identification ......................................................................................................................... 13
4.2.1 Context ....................................................................................................................................................... 13
4.2.2 Basis ........................................................................................................................................................... 13
4.2.3 Methodology for the Development of risk scenarios ................................................................................ 17
4.3 Risk Analysis ...................................................................................................................................................... 22
4.3.1 Hazard Analysis .......................................................................................................................................... 22
4.3.2 Impact analysis ........................................................................................................................................... 23
4.3.3 Qualitative, Quantitative and Semi-quantitative risk analysis ................................................................... 23
4.3.4 Risk matrix .................................................................................................................................................. 23
4.3.5 Risk Curve ................................................................................................................................................... 27
4.4 Risk Evaluation .................................................................................................................................................. 28
4.5 Risk Mapping ..................................................................................................................................................... 28
4.5.1 Types of Risk Assessment and Mapping .................................................................................................... 29
4.5.2 Vulnerability Curves ................................................................................................................................... 40
4.5.3 F-N Curves .................................................................................................................................................. 40
4.6 Consideration of climate change and future scenarios ..................................................................................... 41
5. Floods .................................................................................................................................................................. 45
5.1 SEERISK risk assessment methodology for Flood hazard .................................................................................. 45
5.1.1 Hazard assessment .................................................................................................................................... 45

5
5.1.2 Impact assessment ..................................................................................................................................... 49
5.1.3 Risk assessment and mapping ................................................................................................................... 53
5.1.4 Flood risk assessment – an example .......................................................................................................... 53
6. Heat waves .......................................................................................................................................................... 59
6.1 SEERISK risk assessment methodology for heat wave hazard .......................................................................... 59
6.1.1 Hazard assessment .................................................................................................................................... 59
6.1.2 Impact assessment ..................................................................................................................................... 60
6.1.3 Risk assessment and mapping ................................................................................................................... 66
6.1.4 Heatwave risk assessment - an example ................................................................................................... 66
7. Droughts ............................................................................................................................................................. 70
7.1 SEERISK risk assessment methodology for drought hazard .............................................................................. 70
7.1.1 Hazard assessment .................................................................................................................................... 70
7.1.2 Impact assessment ..................................................................................................................................... 74
7.1.3 Drought risk assessment and mapping ...................................................................................................... 74
7.1.4 Drought risk assessment-an example ........................................................................................................ 78
8. Extreme wind ...................................................................................................................................................... 81
8.1 SEERISK risk assessment methodology for extreme wind hazard ..................................................................... 81
8.1.1 Hazard assessment .................................................................................................................................... 81
8.1.2 Impact assessment ..................................................................................................................................... 84
8.1.3 Risk assessment and mapping ................................................................................................................... 84
9. Wild fires ............................................................................................................................................................. 88
9.1 SEERISK risk assessment methodology for wildfire hazard ............................................................................... 89
9.1.1 Hazard assessment .................................................................................................................................... 89
9.1.2 Impact assessment ..................................................................................................................................... 92
10. Recommendations for future data collection ..................................................................................................... 96
10.1 Data regarding the hazard ............................................................................................................................... 96
10.2 Data regarding the impact ............................................................................................................................ 100
11. Terminology ...................................................................................................................................................... 103
12. References ........................................................................................................................................................ 110

6
LIST OF FIGURES
Figure 1. The risk assessment process within risk management (IEC/FDIS31010, 2009) ................................................................ 11
Figure 2. The Risk Assessment Procedure (modified from (AEMC, 2010)) ..................................................................................... 12
Figure 3. Establishing the Context and the Basis for the Risk Assessment Procedure .................................................................... 14
Figure 4. The risk matrix (EC, 2010) (where (1), (2), (3) etc. the different ratings of impact and likelihood) ................................. 24
Figure 5. Plotted historical data on the risk matrix (modified from (AEMC, 2010))........................................................................ 27
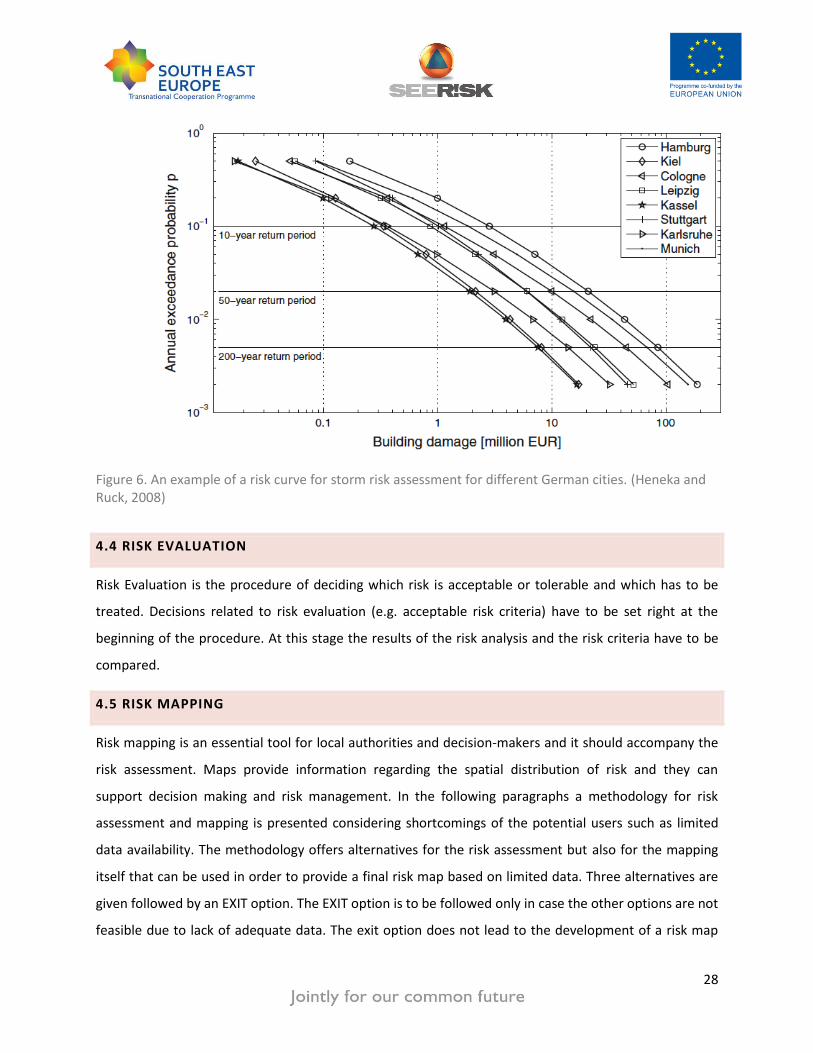
Figure 6. An example of a risk curve for storm risk assessment for different German cities. (Heneka and Ruck, 2008) ................ 28
Figure 7. General workflow for qualitative hazard assessment ...................................................................................................... 31
Figure 8. General workflow for qualitative impact assessment ...................................................................................................... 32
Figure 9. Qualitative Risk Assessment and Mapping ...................................................................................................................... 34
Figure 10. General workflow for Quantitative Hazard Assessment and Mapping .......................................................................... 36
Figure 11. General workflow for quantitative impact assessment and mapping ........................................................................... 38
Figure 12. Quantitative Risk Assessment and Mapping .................................................................................................................. 39
Figure 13. Vulnerability curves for extreme wind for different types of buildings (Cechet et al., 2011) ........................................ 40
Figure 14. F-N curves for landslide events in Hong Kong indication also the acceptable level of risk in two different versions
(GEC, 1998) ..................................................................................................................................................................................... 41
Figure 15. Consideration of changes in climate and in socio-economic change are essential in risk assessment (Malet et al.,
2012) ............................................................................................................................................................................................... 43
Figure 16. Consideration of Global change for future risk assessment .......................................................................................... 44
Figure 17. Workflow for qualitative flood hazard assessment ....................................................................................................... 47
Figure 18. Workflow for quantitative flood hazard assessment and mapping ............................................................................... 48
Figure 19. Workflow for qualitative flood impact assessment and mapping ................................................................................. 50
Figure 20. Workflow for quantitative flood impact assessment and mapping ............................................................................... 51
Figure 21. Qualitative and Quantitative Flood Risk mapping.......................................................................................................... 52
Figure 22. Building map of the virtual town RISKVille ..................................................................................................................... 54
Figure 23. Flood extent map for the virtual town RISKVille ............................................................................................................ 55
Figure 24. Flood vulnerability map for the virtual town RISKVille .................................................................................................. 56
Figure 25. Flood risk matrix for the virtual town RISKVille .............................................................................................................. 57
Figure 26. Flood risk map for the virtual town RISKVille ................................................................................................................. 58
Figure 27. Workflow for qualitative heat wave hazard assessment ............................................................................................... 61
Figure 28. Workflow for quantitative heat wave hazard assessment ............................................................................................. 62
Figure 29. Workflow for qualitative heat wave impact assessment and mapping ......................................................................... 63
Figure 30. Workflow for quantitative heat wave hazard assessment and mapping ....................................................................... 64
Figure 31. Qualitative and quantitative risk assessment for heat wave ......................................................................................... 65
Figure 32. Heat wave intensity map of the virtual town RISKVille .................................................................................................. 67
Figure 33. Heat wave vulnerability map for the virtual town RISKVille .......................................................................................... 68
Figure 34. Heat wave risk map for the virtual town RISKVille ......................................................................................................... 69
7
Figure 35. Workflow for qualitative drought hazard assessment and mapping ............................................................................. 72
Figure 36. Workflow for quantitative drought hazard assessment and mapping ........................................................................... 73
Figure 37. Workflow for qualitative drought impact assessment and mapping ............................................................................. 75
Figure 38. Workflow for quantitative drought impact assessment and mapping .......................................................................... 76
Figure 39. Qualitative and Quantitative Risk Assessment and Mapping for droughts .................................................................... 77
Figure 40. Map of crop types in the virtual town RISKVille ............................................................................................................. 79
Figure 41. Vulnerability map of crop types for droughts in in the virtual town RISKVille ............................................................... 80
Figure 42. Qualitative extreme wind hazard assessment ............................................................................................................... 82
Figure 43. Quantitative hazard assessment for extreme wind ....................................................................................................... 83
Figure 44. Qualitative impact assessment for extreme wind.......................................................................................................... 85
Figure 45. Quantitative impact assessment for extreme wind ....................................................................................................... 86
Figure 46. Extreme wind risk assessment and mapping procedure ................................................................................................ 87
Figure 47. Workflow for qualitative wildfire hazard assessment and mapping .............................................................................. 90
Figure 48. Workflow for quantitative wildfire hazard assessment and mapping ........................................................................... 91
Figure 49. Workflow for qualitative wildfire impact assessment and mapping .............................................................................. 93
Figure 50. Workflow for quantitative wildfire impact assessment and mapping ........................................................................... 94
Figure 51. Qualitative and quantitative risk assessment and mapping for wildfires ...................................................................... 95
Figure 52. a) Basic information regarding the event (type, date, duration etc.) and the impact (Hübl et al., 2002) to be continued
in b) c) and d) .................................................................................................................................................................................. 97
Figure 53. b) Basic information regarding the event and the impact (Hübl et al., 2002) ................................................................ 98
Figure 54. c) Detailed information regarding the process in this case for floods and debris flows (Hübl et al., 2002) ................... 99
Figure 55. d) Complementary map and respective information (Hübl et al., 2002) ..................................................................... 100
Figure 56. The form for data collection regarding the condition/type of the building and its surroundings especially designed for
mass movements (Papathoma-Köhle et al., 2012) ....................................................................................................................... 101
Figure 57. The form for data collection regarding the actual impact of the process on the specific building designed for debris
flow Terminology (Papathoma-Köhle et al., 2012) ....................................................................................................................... 102
LIST OF TABLES
Table 1. Options for Risk Metric for different elements at risk in qualitative and quantitative risk assessment ........................... 15
Table 2. The actions included in hazard and vulnerability analysis (EC, 2010) ............................................................................... 22
Table 3. Different expressions of likelihood/probability of occurrence (AEMC, 2010) ................................................................... 25
Table 4. Different impact levels for different elements at risk (AEMC, 2010) ................................................................................ 26
Table 5. Overview of the projected changes (up to 2100) for weather and climate variables as well as hazard types (modified
from (IPCC, 2012, p. 119-120)) ....................................................................................................................................................... 41
Table 6. Drought Indices (Belal et al., 2012) ................................................................................................................................... 71

8
1. INTRODUCTION
There is evidence that the frequency and magnitude of climate related hazards will increase in the near
future (IPCC, 2012). However, low level of awareness, weak preparedness, institutional gaps and weak
territorial planning may often lead to catastrophic consequences following hazardous events. The main
aim of SEERISK is to improve the coherence and consistency among risk assessments and emergency
preparedness within the partner countries at local and national level. One of the steps that has to be
taken in order to reach this goal is the development of a common methodology for the risk assessment
regarding natural hazards related to climate change. The types of hazards that the project focuses on
(floods, heat waves, wild fires, droughts, and extreme winds) are the hazards that the pilot areas, in the
partner countries, are mostly exposed to. Finally, a challenge that the project has to deal with is on one
hand, to consider and apply the “EC Risk Assessment and Mapping Guidelines” and on the other, to
adjust the methodology to the local setup. For this reason a questionnaire regarding common practices
in risk assessment and mapping (or on hazard and vulnerability assessment separately), damage
assessment, data availability and institutional background was completed by each partner. The results of
this questionnaire were analysed and were strongly considered during the development of the common
methodology. The methodology was developed by the University of Vienna and it was strongly
supported from NDGDM (Hungary). Moreover, the entire consortium of SEERISK contributed by giving
feedback on earlier versions of the methodology during several workshops and by completing the
questionnaire regarding the status quo in each partner country and the data availability.
2. AIM OF THE COMMON METHODOLOGY
The common risk assessment methodology has been developed in order to improve the consistency in
risk assessment among Southeast European countries and provide the local authorities and other end-
users with a tool that will enable them to conduct risk assessment and mapping for a range for hazard
types, scales and elements at risks. The methodology is not covering the entire risk management
process but it rather focuses on the assessment and mapping of risks posed by climate change related
processes.
The risk assessment methodology presented here aims at:
a) The integration of the EC guidelines in risk assessment and mapping.
9
b) Taking into consideration the individual challenges of the end users such as the lack of data
c) Being solution oriented. It offers practical solutions to overcome obstacles in order to
deliver the final products (risk matrices, risk maps and risk scenarios).
d) The production of risk matrices by the users based on past recorded events.
e) The production of risk scenarios.
f) The production of risk maps for different types of hazards and elements at risk.
g) Harmonisation of the risk assessment process in the partner countries that leads to outputs
that are comparable.
The overall aim of the methodology is to provide a tool for local authorities that can assist them in the
implementation of risk assessment. The document provides the description of the common
methodology but also recommendations for future data collection regarding future catastrophic events
and a glossary with the main terms used in risk assessment.
3. EC GUIDELINES AND THEORETICAL BACKGROUND
The “EC guidelines for risk assessment and mapping” were produced in order to improve the coherence
and consistency among the risk assessment methods used by the Member States at national level and to
make them more comparable between the Member States (EC, 2010). Among others the EC guidelines
will “contribute to establish, by 2014, a coherent risk management policy linking threat and risk
assessments to decision making, as stated in the recently adopted communication from the commission
on the "EU Internal Security Strategy In Action: five steps towards a more secure Europe" (EC, 2010).
The EC guidelines provide a definitions of the most important terms in risk assessment and a thorough
explanation of the risk assessment process, analysing the actions that should be included in the different
stages of the process (risk identification, risk analysis and risk evaluation) as well as comprehensive
guidance for the development of risk matrices and scenarios. Special emphasis is given to risk mapping
which, according to the guidelines, is a valuable tool for the support of risk assessment. The EC
guidelines are used as a basis for the development of the SEERISK common methodology presented
here.
10
4. COMMON METHODOLOGY
The following document describes a common methodology for risk assessment that can be used by the
partners of SEERISK project in order to conduct risk assessment and risk mapping for a range of climate
change related types of hazards, such as floods, heat waves, extreme winds, wild fires and drought. The
common methodology considers drawbacks such as lack of significant sets of data and it offers
alternative steps in order to provide a methodology that is feasible and usable also with limited data
availability. Therefore, the methodology is solution oriented. Moreover the methodology has been
designed in accordance to the “EC Guidelines for Risk Assessment and Mapping“ (EC, 2010). It provides a
step wise approach regarding the risk assessment procedure, a methodology on the development of risk
matrices and scenarios and finally a step wise approach based on alternative solutions for risk mapping.
The methodology for risk mapping presented here is for all of the hazard types that are going to be the
focus of SEERISK.
4.1 METHODOLOGICAL STEPS FOR RISK ASSESSMENT
The risk assessment process is part of the greater risk management process as it is demonstrated in
Figure 1. Risk assessment incorporates three steps: risk identification, risk analysis and risk evaluation.
These three steps often overlap each other and one does not necessarily have to be completed for the
next one to begin. The actions that are involved in each step are thoroughly described in the EC
guidelines (EC, 2010).

11
Figure 1. The risk assessment process within risk management (IEC/FDIS31010, 2009)
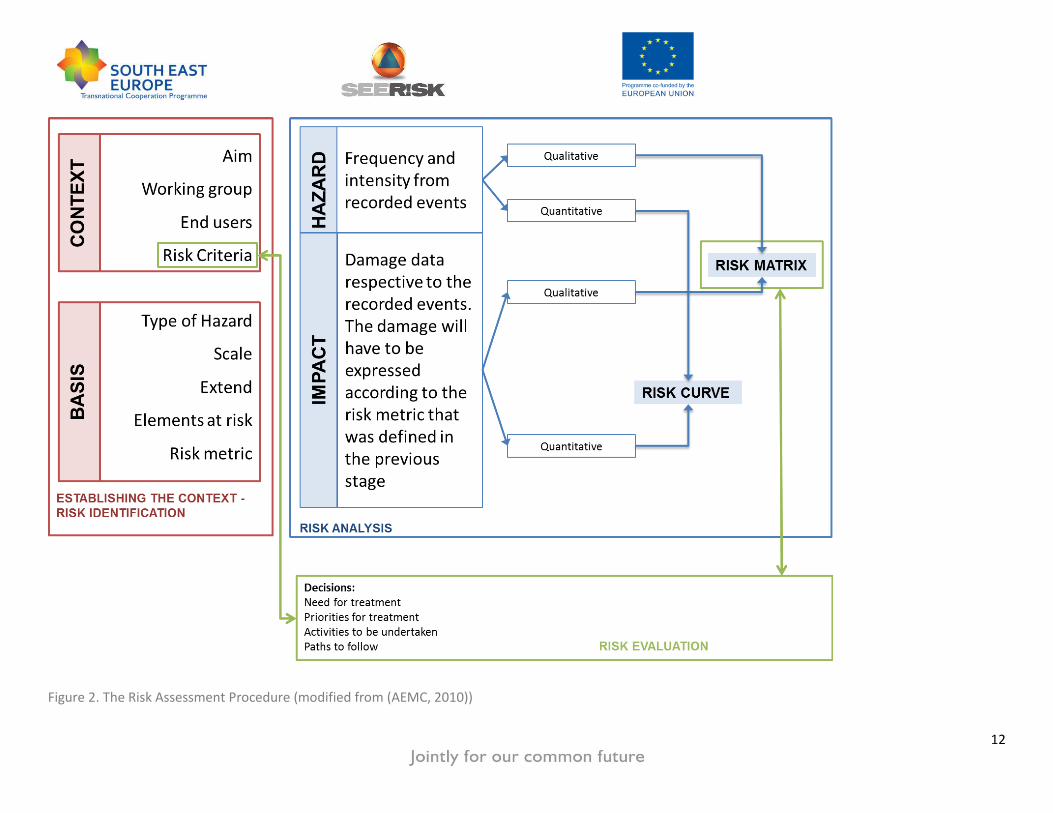
The SEERISK common risk assessment methodology is shown in Figure 2 . In this figure it is clear that the
risk assessment process incorporates three steps: 1. establishing the context and risk identification, 2.
risk analysis and finally 3. risk evaluation. However, the three steps are interconnected and often
overlap (e.g. establishment of risk criteria in step 1. and the levels of risk matrix in step 2. are used
during risk evaluation, step 3.). In the following paragraphs the steps of the risk assessment procedure
are shortly analysed and explained.
12
Figure 2. The Risk Assessment Procedure (modified from (AEMC, 2010))
13
4.2 CONTEXT AND RISK IDENTIFICATION
4.2.1 CONTEXT
The context of the risk assessment has to be determined from the beginning of the risk assessment
procedure. First, the aim of the risk assessment has to be determined. The reason for conducting risk
assessment has to be made clear (e.g. emergency planning, prioritization of funding allocation, a base
for decision making, etc.). The working group that will work for the implementation of the risk
assessment has to be identified at this stage together with the end users of the final product. The end-
users are very important because they will define the focus of the risk assessment as well as the
simplicity and the presentation of the results. Last but not least the risk criteria-meaning, the terms of
reference against the significance of a risk-are evaluated (IEC/FDIS31010, 2009). These criteria may
include number of deaths or other socioeconomic factors, damage costs or benefits, legal requirements
(Figure 3). These criteria have to be determined from the working group and they will be unique for
each pilot area and type of hazard.
4.2.2 BASIS
The basis of the risk assessment has to do with the details of the procedure. First of all, the type of
hazard or types of hazards, in case a multi-risk assessment is required, has to be determined. Following,
the scale of the risk assessment has to be clarified before the data collection for the risk mapping. The
scale may be from local to national but it may also be site or catchment specific. The next step is to
define the extent of the area under investigation. The limitation of the study area may be administrative
borders or limits that will be set from the working group. Finally, the elements at risk and the risk metric
have to be defined. The elements at risk are elements located within the hazard zones such as buildings,
lives, infrastructure, agricultural or touristic areas etc. The risk metric defines the way risk is going to be
measured according to the element at risk under consideration. For example, if the element at risk is
population, the risk metric has to be also determined. In this case the risk metric may be number of
deaths, number of evacuated or homeless, hospital admissions and so forth. In Table 1 the difference
between elements at risk and risk metric as well as risk metric options for each element at risk are
demonstrated.

14
Figure 3. Establishing the Context and the Basis for the Risk Assessment Procedure
15
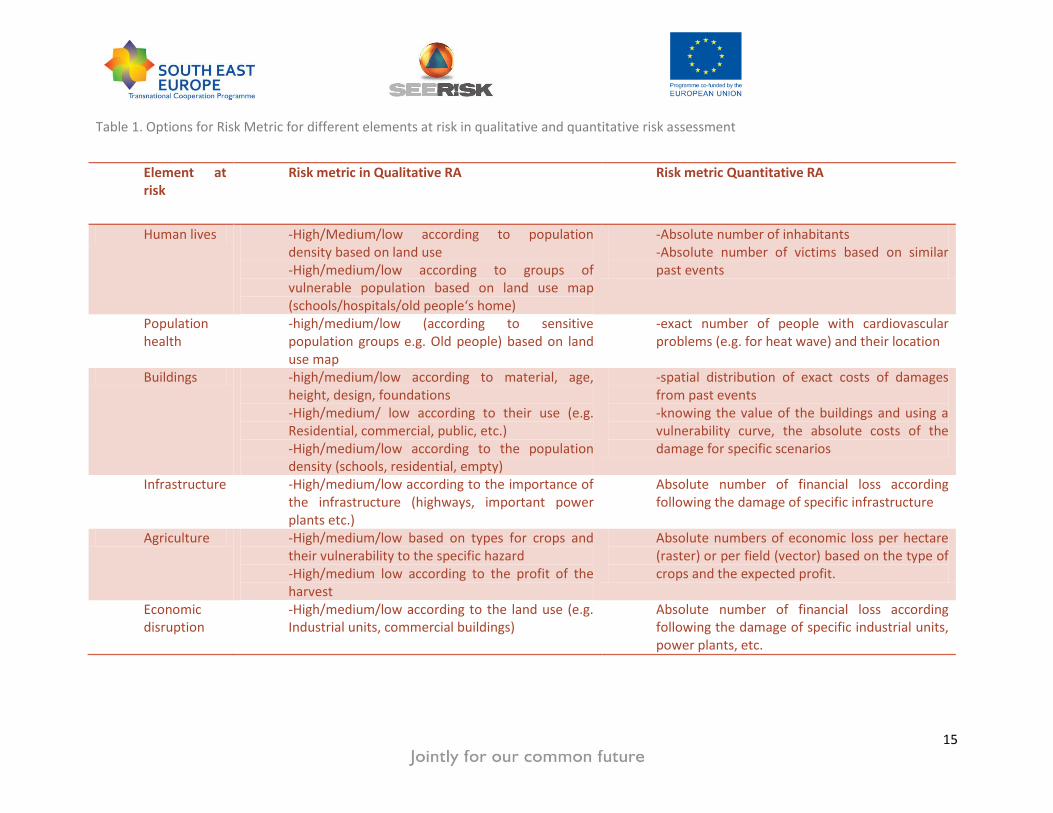
Table 1. Options for Risk Metric for different elements at risk in qualitative and quantitative risk assessment
Element at risk
Risk metric in Qualitative RA Risk metric Quantitative RA
Human lives -High/Medium/low according to population density based on land use -High/medium/low according to groups of vulnerable population based on land use map (schools/hospitals/old people‘s home)
-Absolute number of inhabitants -Absolute number of victims based on similar past events
Population health
-high/medium/low (according to sensitive population groups e.g. Old people) based on land use map
-exact number of people with cardiovascular problems (e.g. for heat wave) and their location
Buildings -high/medium/low according to material, age, height, design, foundations -High/medium/ low according to their use (e.g. Residential, commercial, public, etc.) -High/medium/low according to the population density (schools, residential, empty)
-spatial distribution of exact costs of damages from past events -knowing the value of the buildings and using a vulnerability curve, the absolute costs of the damage for specific scenarios
Infrastructure -High/medium/low according to the importance of the infrastructure (highways, important power plants etc.)
Absolute number of financial loss according following the damage of specific infrastructure
Agriculture -High/medium/low based on types for crops and their vulnerability to the specific hazard -High/medium low according to the profit of the harvest
Absolute numbers of economic loss per hectare (raster) or per field (vector) based on the type of crops and the expected profit.
Economic disruption
-High/medium/low according to the land use (e.g. Industrial units, commercial buildings)
Absolute number of financial loss according following the damage of specific industrial units, power plants, etc.

16
17
4.2.3 METHODOLOGY FOR THE DEVELOPMENT OF RISK SCENARIOS
Risk scenarios are “representations of one single-risk or multi-risk situation leading to significant
impacts, selected for the purpose of assessing in more detail a particular type of risk for which it is
representative, or constitutes an informative example or illustration” (EC, 2010). In order to define a
scenario information and detailed description of the following should be given: hazard characteristics,
general context and vulnerabilities, possible consequences and the current level of preparedness. In the
following paragraphs the steps for defining the above mentioned aspects are described.
HAZARD CHARACTERISTICS
Step 1.1: Identifying the hazard to be analysed
In this step the type of natural hazard needs to be identified and described by using hazard specific traits
in order to be distinguishable from other types of hazards. The choice of hazard type has to be justified
as well: is this a dominant hazard in the pilot area or in the region causing regular disasters? Do the
meteorological, hydrological and geographical circumstances justify that this hazard type causes
problems regularly?
Step 1.2: Specifying and describing the causing factor of the event1
The causing factor or phenomena which triggered the disaster should be also described. The causing
factor can be either a single or multiple set of events or phenomena and/or their combinations. A
causing factor could be for example a quick change in air temperature which melts the accumulated
snow in the mountainous area and as a result, is generating a massive flood. Since SEERISK is focusing on
climate change adaptation the causing factor can only be an event triggered by natural processes. Thus,
human activities such as industrial influences will be ignored. Describing the causing factor should be as
precise as possible and it should be based on evidence/experience from past events.
Step 1.3: Defining likelihood
The likelihood of the worst case credible scenario of a specific hazard type has to be based on factual,
historic disaster data. When defining likelihood of the worst case credible scenario the causing factors of
1 (2009) Scenarios National Risk Assessment, National Safety and Security; The Netherlands
(2012) National Risk Register of Civil Emergencies; Cabinet Office; The United Kingdom
18
the hazard also need to be taken into account. The likelihood can be a textual description, for example,
stating that based on the past records/experience, the worst case scenario of a specific hazard event is
likely to happen once every 100 years. In order to be as specific as possible the results of the risk matrix
should be used as a basis.
Step 1.4: Defining the intensity of the event
The intensity of the event describes the magnitude of the worst case credible scenario disaster
expressed in a textual format. Portraying intensity in a detailed description helps to comprehend the
seriousness of the disaster event.
CONTEXT OF THE INCIDENT: DISASTER CIRCUMSTANCE AND VULNERABILITY DETAILS
Step 2.1: Defining and delineating the location and the size of the affected area
This step defines the geographical location and the territory being affected by the natural hazard. In
order to be familiar with the geographical conditions it is important to determine the wide (regional),
the narrow (urban) and the closest (urban district) surroundings of the scenario (a map for each level
should be included). Subsequently, the size of the area of the affected territory has to be defined. This
could be expressed in a dynamic way to show how the situation develops/worsen over time. For
example, the size of a flooded or a burning territory is likely to increase hourly over time. This can be
best demonstrated by using the table provided in the template (see Annex) where 2 factors (time and
affected area) of a disaster event are portrayed in a timeline.
This step is not applicable for some disaster types. For example, drought has a larger geographical
relevance (country level) than an urban area and heat waves have to be analysed in a longer period of
time (more than 5 consecutive days) with hardly any spatial relevance (although urban heat island effect
is a good reference to analyse heat wave from a spatial perspective).
Step 2.2: Defining the time and the duration of the event
Defining the exact time and the time of the day (dawn, morning, noon, afternoon, evening, night) is a
crucial step as different consequences could be expected in different times of the day. During night-time
for example an intense and rapid disaster would raid urban population unexpectedly. Therefore, they
would have less time to take action.
During daytime it is more likely that people are not at home so it is likely that they can react in a timely
manner.

19
The time of the onset should be provided as well. The time of onset is the time period from the
beginning of the event until it reaches its peak. The length of the period can be different for each hazard
type and for different events. For example the time of onset for heat waves can be days while in case of
thunderstorm this value can be measured in hours or even minutes.
It is also important to define the season (spring, summer, autumn, winter) when the event happens. A
warm summer evening would result in a different circumstance than a cold winter morning. Weekdays
or a weekend would also have different effects on the consequences of the disaster. These variables
should be carefully taken into account when designing the scenario.
It is apparent that disaster events of different natural hazard types have different duration, therefore
scenarios for different hazard types will spread over different time frames. The duration of the each
hazard event shall be provided.
Step 2.3: Defining population number and density data
Since disaster management’s highest priority is to protect human lives it is very important to provide not
just the mere number of the population in the affected area but to also to carefully define the
population density within the affected area, the number of the affected people, the number of people
who need to be evacuated. This information should be included in a timeline table which dynamically
demonstrates the number of people affected and the number of people need to be evacuated over
time.
Step 2.4: Defining general circumstances and the degree of vulnerability and exposure of people, the
built-up and the natural environment
The general composition and conditions of the built-up and the natural environment, the infrastructure
and the urban population should be described in a textual format. It is important to provide a picture
about the composition of the buildings in the affected area: what is the predominant building type in
the area which will be impacted the most by the disaster? Homesteads, houses, semi-detached houses,
tall block of flats, office buildings, warehouses, industrial buildings, etc.? It is a priority to take stock of
the important public buildings such as schools, hospitals, nursery homes, kindergartens etc.
The natural environment, the predominant vegetation and/or agricultural land use type should be
defined as well as areas under natural protection and other ecologically vulnerable areas.
It is also important to provide the approximate and general condition of the buildings in order to know
the level of vulnerability. This can be done by using a three level description: poor/adequate/good
condition of the buildings in the affected area. This classification should be also applied for each of the
20
relevant urban critical infrastructure element: roads, canals, power lines, utilities (sewage, gas and
water), railways, airports, underpasses, telecommunication wires (internet, telephone). Concerning the
vulnerability of the people in the affected area, textual description on the predominant general health
condition and the age composition shall be provided.
DESCRIBING CONSEQUENCES
This section of the scenario development methodology is the most important step as all the information
which was provided in the previous chapters is now being used for analysing the impacts by
comprehensively looking at the whole event by taking into account all the critical elements of the risk
scenario.
Step 3.1: Defining the affected elements at risk (people, environment, objects)
This chapter narrows down the impacts and focuses on those elements which are affected the most by
the disaster event. Following through previous chapters by taking into account the type of hazard, the
causing factors, the likelihood, the intensity, the place, the time and the vulnerability characteristics,
specific and predominant impact elements (people, urban objects like buildings and critical
infrastructure, environment) have to be identified. The decision on the affected elements has to be
based on past evidence/experience of historic disaster events.
Step 3.2: Indicating the nature and the extent of the consequence (impact analysis)
After specifying the type of affected element(s) the impact analysis shall be implemented as a last step
of the risk scenario development. When describing the consequences in a textual format all the previous
steps of the risk scenario have to be taken into consideration in order to provide a broad picture of the
disaster event. In general it should demonstrate what could happen to (a) specific element(s) at risk: if
one type of hazard, caused by different factors, with a given intensity and likelihood, in a given place, in
a given time, over a given time period, among given circumstances happens.
Impact analysis should also cover substantive impact assessment by looking at different impact
measurement factors expressed in a textual description based on past evidence/experience. These are2:
Physical impacts:
Fatalities: number of people that die due to the worst case scenario
2 (2009) Scenarios National Risk Assessment, National Safety and Security; The Netherlands
21
Seriously injured and acutely ill: number of people got injured or got ill due to the event
Physical hardship: number of people who lacks basic necessities such as drinking water and
food. This normally occurs if the evacuation takes longer time
Damage in the built-up environment: number of affected houses; magnitude of the damage in
the infrastructure
Economic impacts:
The total damage caused by the disaster expressed in monetary terms (euros).
Ecological impacts:
Damage to flora and fauna and landscape: short qualitative description of the loss occurred due
to the natural disaster
Social and psychological impacts:
Disruption of the everyday life: the number of people whose life will be disrupted during the
disaster event
Social/Psychological impact: the number of people who will feel insecure and unsafe a week
after the disaster
Only relevant (hazard specific) impacts shall be analysed when developing your scenario so there may be
cases where the assessment of some of the above impacts is not applicable (e.g. heat wave and the
damage in the built-up environment).
PREPAREDNESS OF THE DISASTER MANAGEMENT AND NATIONAL AUTHORITIES
In the beginning of the risk scenario guideline an assumption was emphasized which states that the
existing policy on measures aimed at prevention, preparation and repression is taken into account.
Hence the general preparedness of the disaster management (DM) bodies and/or national authorities
shall be described by providing information about the existing preventive and preparatory DM measures
and staff.
The preparedness of the DM institutions will be described in a more detailed nature at a later stage of
the SEERISK project when the disaster management scenarios (not to be confused with the risk scenario)
will be developed for disaster field simulation exercises.

22
4.3 RISK ANALYSIS
Risk analysis is the process that involves the comprehension of risk and the determination of its level EC
2010). According to the EC guidelines, risk analysis should be based on quantitative data, however this is
not always possible (EC, 2010). In the present document, we offer alternatives for quantitative and
qualitative risk analysis which are possible also in cases of limited data availability. Generally, risk
analysis should involve the assessment of the probability of occurrence of an event (or hazard) and the
assessment of its impact on the elements at risk. In other words, risk analysis should address: Hazard
Analysis and Vulnerability Analysis. The various actions that are incorporated in hazard and vulnerability
analysis are shown in Table 2.
Table 2. The actions included in hazard and vulnerability analysis (EC, 2010)
Hazard Analysis Vulnerability analysis
(a) Geographical analysis (location, extent)
(b) Temporal analysis (frequency, duration, etc.)
(c) Dimensional analysis (scale, intensity)
(d) Probability of occurrence
(a) Identification of elements and people
potentially at risk (exposure)
(b) Identification of vulnerability factors/ impacts
(physical, economic,
environmental, social/political)
(c) Assessment of likely impacts
(d) Analysis of self-protection capabilities reducing
exposure or vulnerability
4.3.1 HAZARD ANALYSIS
At this stage the hazard or hazard(s) that will be considered for the risk assessment have to be analysed.
Records of past events have to be investigated first in order to derive two important types of
information: the probability of occurrence (derived from the frequency of historic events) and the
intensity (and extent) of each event. The type of hazard and the quality of the past records influence the
reliability of the results. The type of information available may be either qualitative (resulting e.g. to a
high/medium/low probability) or quantitative resulting in probability and/or intensity that can be

23
described in absolute numbers, (e.g. 100, 30, 10 year flood). In Table 2 the types of analysis included in
hazard analysis are shown.
4.3.2 IMPACT ANALYSIS
In this step, information regarding the impact of specific events has to be collected and analysed. In
earlier stages of the risk assessment procedure the element at risk under investigation and the risk
metric have been already identified. Impact analysis involves the collection of information regarding the
specific element at risk and the risk metric (e.g. number of deaths, damage in €). Moreover, the
identification of the elements at risk (exposure) in the study area and their characteristics that affect
their vulnerability (vulnerability factors and indicators) has to be included. On the other hand,
protection capabilities and coping capacities should also be investigated and considered in the impact
analysis (Table 2).
4.3.3 QUALITATIVE, QUANTITATIVE AND SEMI-QUANTITATIVE RISK ANALYSIS
Risk assessment may be qualitative, quantitative or semi quantitative. Qualitative risk assessment
methods classify risk as high, medium and low whereas quantitative risk assessment methods express
risk in quantitative terms such as number of lives lost or damage in euros (€). Semi-quantitative
methods use risk indices to express risk. In the present document we are dealing only with qualitative
and quantitative risk assessment methods.
4.3.4 RISK MATRIX
After executing the hazard and impact analysis in a qualitative form in steps 1 and 2, the risk matrix can
be developed (step 3). The risk matrix is based on historical data and for this reason has to be unique for
the specific pilot area such as for the element at risk and the type of hazard considered. In order to
develop a risk matrix like the one shown in Figure 4, the following sub-steps have to be carried out:
The likelihood or probability of occurrence of a specific hazard
The impact of this specific hazard on the selected element at risk
The risk levels, meaning the risk rating (e.g.low, medium, high very high) and the description of
each category.

24
Figure 4. The risk matrix (EC, 2010) (where (1), (2), (3) etc. the different ratings of impact and likelihood)
The example risk matrix in Figure 4 by the EC guidelines has 5 impact categories and 5 likelihood
categories. This is only a suggestion. The risk matrix may have as many impact and likelihood categories
as necessary based on the type and quality of data used.
LIKELIHOOD RATING
The likelihood rating is the first essential step of the development of a risk matrix. According to
(IEC/FDIS31010, 2009), there are three different approaches in estimating the likelihood of an event:
a) Use of historic data
b) Probability forecasts
c) Expert opinion
The choice of one of the above approaches depends on the availability of past records, data, resources,
and experts for the specific process in the study area. According to (IEC/FDIS31010, 2009), the
probability scale may have any number of points. The probability range has to be relevant to the case
study area and the chosen hazard type. The probability scale may span the range relevant to the study
area, considering that the lowest probability must be acceptable for the highest defined consequence
(IEC/FDIS31010, 2009). As an example, Table 3 shows the different ways in which likelihood can be
expressed.

25
Table 3. Different expressions of likelihood/probability of occurrence (AEMC, 2010)
In the pilot studies case definitions for each of the 5 likelihood classes have to be provided together with
a clear description of each class.
IMPACT RATING
After rating the likelihood, impact rating is the next major step in developing the risk matrix. Before the
impact rating the experts at the pilot area have to decide on the element at risk that they focus on (e.g.
human lives, material damage) and the risk metric (e.g. number of deaths, €). According to these two
pieces of information impact rating can be determined. For example:
Catastrophic: more than 1 deaths per 10.000 inhabitants
Major: more than 1 deaths per 100.000 inhabitants
Moderate: more than 1deaths per 1.000.000 inhabitants
Minor: Isolated cases of serious injuries
Insignificant: minor injuries.
The intervals can be absolute numbers or descriptions as shown above. However, the descriptions of the
consequence intervals have to be thoroughly explained. An example of consequence rating taken from
the Australia national emergency risk assessment guidelines is shown in Table 4. In order to have
credible intervals, the impact rating has to be based on real past events and their consequences or
expert judgment. The range of impacts should extend form the highest credible impact to the lowest
impact of concern (IEC/FDIS, 2009)

26
Table 4. Different impact levels for different elements at risk (AEMC, 2010)

27
RISK LEVELS RATING
Risk levels rating is the last step in the development of a risk matrix. After having rated the impact and
the probability based on records of past events the experts of the pilot areas have to decide what high,
medium and low risk is for them. This decision might also be connected to specific actions. For example,
low risk (green) might mean no action, medium risk (yellow/orange) might mean alert and high risk (red)
might mean evacuation. This step is also very much connected to the third stage of risk assessment, the
risk evaluation. At this stage, the decision-makers have to identify which risks they are going to accept
and which ones they are going to treat. In order to check the reliability of the risk rating real events can
be plotted on the risk matrix (according to their probability and impact) and see if they agree with the
level of risk that they coincide with. (see Figure 5).
Figure 5. Plotted historical data on the risk matrix (modified from (AEMC, 2010))
4.3.5 RISK CURVE
In case information regarding the probability of occurrence and the impact is available in quantitative
form then a risk curve can be developed. The risk curve shows the relationship between the probability
of occurrence and the respective loss (Figure 6). The risk curves in Figure 6 show that the building
damage related to storms in Germany is higher following low probability events. The specific curves can
be used to compare building damage potential of different cities in Germany.
28
Figure 6. An example of a risk curve for storm risk assessment for different German cities. (Heneka and Ruck, 2008)
4.4 RISK EVALUATION
Risk Evaluation is the procedure of deciding which risk is acceptable or tolerable and which has to be
treated. Decisions related to risk evaluation (e.g. acceptable risk criteria) have to be set right at the
beginning of the procedure. At this stage the results of the risk analysis and the risk criteria have to be
compared.
4.5 RISK MAPPING
Risk mapping is an essential tool for local authorities and decision-makers and it should accompany the
risk assessment. Maps provide information regarding the spatial distribution of risk and they can
support decision making and risk management. In the following paragraphs a methodology for risk
assessment and mapping is presented considering shortcomings of the potential users such as limited
data availability. The methodology offers alternatives for the risk assessment but also for the mapping
itself that can be used in order to provide a final risk map based on limited data. Three alternatives are
given followed by an EXIT option. The EXIT option is to be followed only in case the other options are not
feasible due to lack of adequate data. The exit option does not lead to the development of a risk map
29
but usually to another type of map (e.g. impact or exposure) that may also be used by the authorities
and the decision-makers. The following paragraphs describe the methodology for risk assessment and
mapping for qualitative and for quantitative risk assessment.
4.5.1 TYPES OF RISK ASSESSMENT AND MAPPING
Following risk analysis and evaluation the authorities, decision makers or experts need to take some
decisions and plan the risk treatment. In order to do this the spatial pattern or risk has to be visualised.
Risk mapping is a tool for the local authorities and can be used for emergency planning, prevention
measures planning, loss estimation for future events, but also for risk awareness and education
programmes involving the public. Theoretically, risk mapping is the “overlay” (combination and analysis)
of hazard mapping and impact mapping. Risk assessment can be qualitative (it can be expressed as high,
medium or low) or quantitative (it can be expressed as possible damage (in €) lives lost in absolute
numbers). In qualitative mapping, the hazard and the impact are also expressed in qualitative terms (e.g.
high, medium, low).
QUALITATIVE
QUALITATIVE HAZARD ASSESSMENT AND MAPPING
Figure 7 describes the general workflow for qualitative hazard assessment and mapping. If a hazard map
for the specific hazard type and required scale already exists it can be directly used for risk mapping. If
such a map is not available, the probability of intensity of a hazard can be described in qualitative terms
by using information from historic data to define the probability of occurrence (high, medium, low) for
different parts of the study area (alternative 1). The result can be mapped and the map can then be used
for risk mapping. If no data on previous events are available or only incomplete and/or unreliable
datasets are available, then expert judgment can be used to identify low, medium and high hazard zones
in the study area (alternative 2). A raster map of the area can be adequately attributed according to the
hazard level. In case this is also not possible then the methodology offers an exit strategy. However, the
exit strategy does not lead to the development of a risk map. By using the exit strategy the expert will
use the whole administrative unit or area of interest to conduct only impact consequence mapping. An
impact map is not a risk map but it is still some valuable spatial information that can be of interest to the

30
authorities and decision makers. In case the production of a hazard map is possible, the expert can move
to the next step of the risk assessment and mapping and continue with the impact analysis. However,
the hazard map and the reliability of the information it provides should be validated and improved by
taking in to consideration future events. In case the development of a hazard map is not possible, the
exit strategy could be used. Nevertheless, the experts should make sure that in the future hazardous
events will be recorded thoroughly. In this way, information will be available in the future for the
development of a detailed hazard map. The sub-chapter regarding documentation of events at the end
of this document provides information regarding this topic.

31
Figure 7. General workflow for qualitative hazard assessment

32
Figure 8. General workflow for qualitative impact assessment

33
QUALTITAVE IMPACTASSESSMENT AND MAPPING
Impacts can be assessed and mapped by using different alternatives, according to the data availability,
in the same way the hazard assessment is conducted. In case an impact or vulnerability map is already
available it can be overlaid with the hazard map for risk mapping. If such a map is not available then an
impact map has to be made (alternative 1) by using information regarding the damages of past events or
information on the vulnerability of the elements at risk. The element at risk under investigation (e.g.
people) and the risk metric (e.g. lives lost) has been identified in previous stages of the risk assessment.
In this way, a map of potential losses can be developed and the raster map of the study area can be
attributed accordingly (high, medium, low). In case historical information is not available then a similar
map can be developed by suing expert judgement (alternative 2) and information on land use. The exit
strategy proposes the use of a land use map (e.g. in the case of human casualties: residential areas-high,
commercial areas-medium, industrial areas-low) that will lead to exposure mapping. The resulting maps
of the first three alternatives have to be validated in the future and the exit strategy has to include a
step for improvement of data collection techniques regarding damages of hazardous events (Figure 8).
QUALITATIVE RISK ASSESSMENT AND MAPPING
The two qualitative maps (hazard and impact) can be overlaid in GIS. Each pixel will be given a colour
which will indicate a risk level according to the matrix and according to its level of hazard and impact. In
this way the whole map can be attributed indicating areas of high, medium, low risk (the risk categories
can be more than 3). In Figure 9 the process of combining the hazard and the impact map and the
development of the risk map is described.

34
Figure 9. Qualitative Risk Assessment and Mapping
35
QUANTITATIVE
In case the data regarding past events are available in quantitative form the development of a
quantitative risk map is possible. The process to be followed is similar to the one described for
qualitative risk assessment and mapping offering alternatives in case of lack of required data. Similarly
to the qualitative risk assessment and mapping a map indicating the spatial distribution of probability
and intensity levels has to be developed following by a map showing the potential impacts in the study
area.
QUANTITATIVE HAZARD ASSESSMENT AND MAPPING
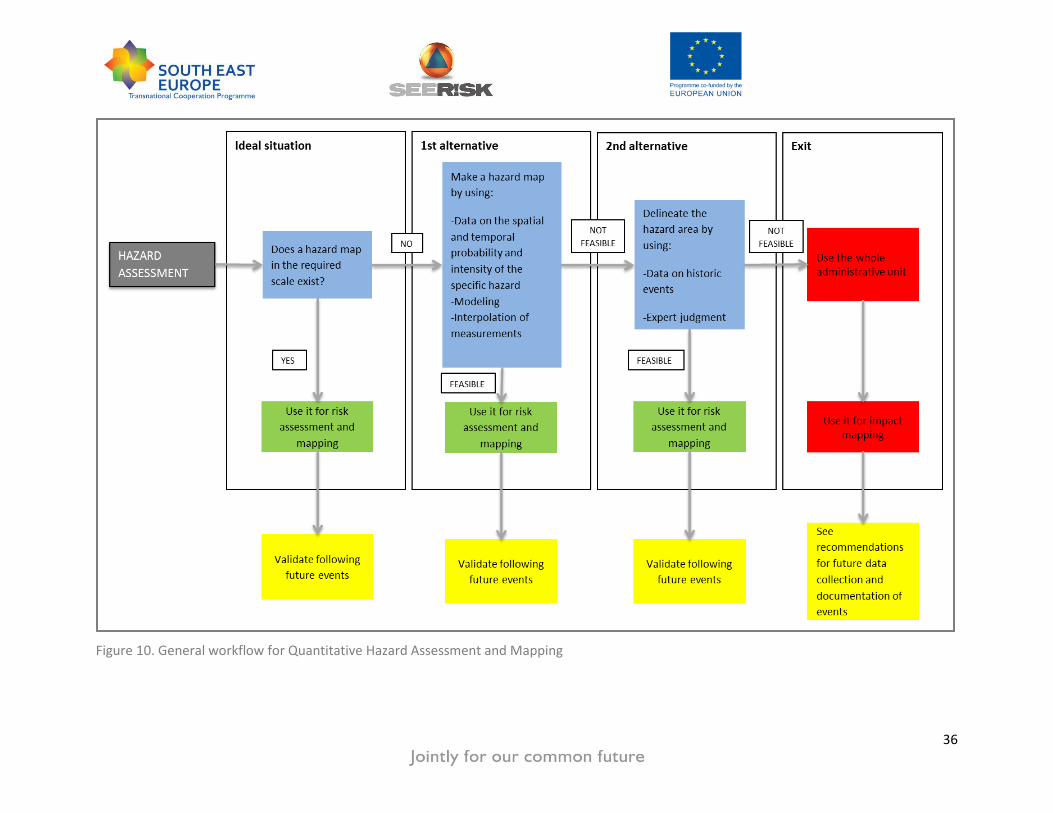
In Figure 10 the process of the development of a hazard map using quantitative data is described. The
hazard map maybe deterministic (showing the distribution of the intensity of a specific hazard scenario)
or probabilistic (showing the distribution of the probability of occurrence in the study area) .Ideally, such
a hazard map exists, but if not, the first alternative suggests that a quantitative hazard map has to be
developed. Such a map can be created by using detailed historical data in order to map the probability
(expressed as e.g. return period or annual probability) or the spatial distribution of intensity classes.
Methods and techniques to develop a hazard map vary significantly and they are dependent on the type
of hazard and available data. Often, hazards can be modelled or in other cases point data can be
interpolated. However, in order to model a hazard or to map the spatial distribution of its intensity a
very large amount of detailed data is required that is often not available. In case the development of
such a map is not possible due to lack of quantitative data then the second alternative should be used.
According to the second alternative, expert judgement should be used to indicate the areas where the
probability of occurrence is higher than others in quantitative terms. The exit strategy is similar to the
one described in the qualitative risk mapping procedure and the future steps indicated with yellow are
also similar.
36
Figure 10. General workflow for Quantitative Hazard Assessment and Mapping
37
QUANTITATIVE IMPACT ASSESSMENT AND MAPPING
In Figure 11 the steps for developing a quantitative impact map are demonstrated. If such a map is not
available then the possible impact can be mapped by using existing vulnerability curves. By knowing the
intensity of an event at different regions in the study area we can assess the degree of loss for the
element at risk. More information regarding vulnerability curves is given in the following paragraphs. On
the other hand, such a map can be also developed by mapping exact damage data of previous events
when these are available. The second alternative proposes the use of expert judgement in combination
with land use information and historic data. The exit strategy is similar to the one described in the
qualitative risk mapping procedure and the future steps indicated with yellow are also similar.
QUANTITATIVE RISK ASSESSMENT AND MAPPING
The procedure of using the information of the maps developed above for risk assessment and mapping
is described in Figure 12. The equivalent of the risk matrix for quantitative data is the risk curve. The risk
curve shows the relationship between the probability of occurrence and the impact of the event. Risk
curves can be used to assess the risk in areas where the probability is known but the damage is not. F-N
curves are similar to the risk curves only that they refer to human lives rather than material loss. More
information on F-N curves and risk curves is given elsewhere in this document. By using the risk curves
or the F-N curves the risk in different areas or pixels of the map can be assessed and visualised. The
resulting risk map may be raster or vector according to the original data used for the development of
the hazard and impact map.

38
Figure 11. General workflow for quantitative impact assessment and mapping

39
Figure 12. Quantitative Risk Assessment and Mapping

40
4.5.2 VULNERABILITY CURVES
Vulnerability curves are functions that express the relationship between the intensity of a
process and the respective degree of loss. They are normally used for buildings and since they
are based on damage data from a significant amount of buildings they are common for types of
hazards that involve large amount of buildings (e.g. earthquakes, floods) and less common for
types of hazards that affect individual buildings (e.g. rock falls). In Figure 13 a vulnerability curve
made for different types of buildings influenced by different gusts is shown.
Figure 13. Vulnerability curves for extreme wind for different types of buildings (Cechet et al., 2011)
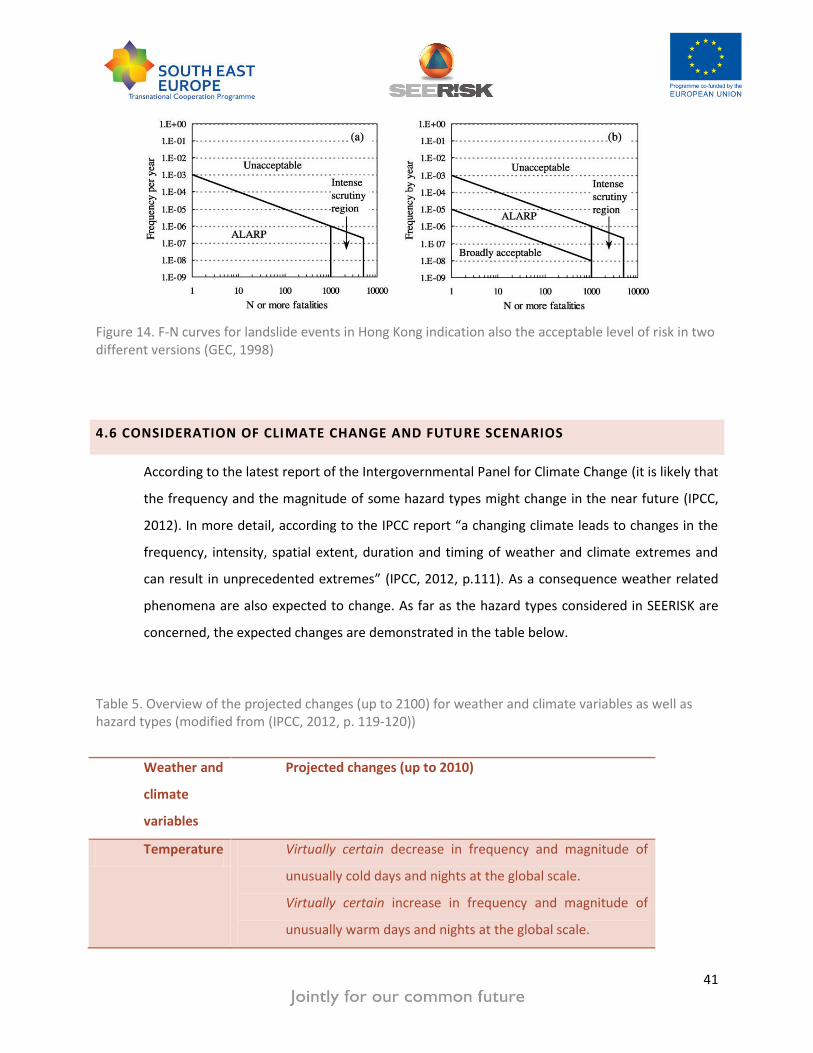
4.5.3 F-N CURVES
The functions expressing the relationship between events of a specific annual probability and
the number of human casualties are called F-N curves. According IEC/FDIS31010 (2009) to F-N
curves “show the cumulative frequency (F) at which N or more members of the population that
will be affected. High values of N that may occur with a high frequency F are of significant
interest because they may be socially and politically unacceptable”.
An F-N curve for landslides is demonstrated in Figure 14. The figure shows that F-N curves can
also be used in order to visualise the limit between acceptable and unacceptable risk.
41
Figure 14. F-N curves for landslide events in Hong Kong indication also the acceptable level of risk in two different versions (GEC, 1998)
4.6 CONSIDERATION OF CLIMATE CHANGE AND FUTURE SCENARIOS
According to the latest report of the Intergovernmental Panel for Climate Change (it is likely that
the frequency and the magnitude of some hazard types might change in the near future (IPCC,
2012). In more detail, according to the IPCC report “a changing climate leads to changes in the
frequency, intensity, spatial extent, duration and timing of weather and climate extremes and
can result in unprecedented extremes” (IPCC, 2012, p.111). As a consequence weather related
phenomena are also expected to change. As far as the hazard types considered in SEERISK are
concerned, the expected changes are demonstrated in the table below.
Table 5. Overview of the projected changes (up to 2100) for weather and climate variables as well as hazard types (modified from (IPCC, 2012, p. 119-120))
Weather and
climate
variables
Projected changes (up to 2010)
Temperature Virtually certain decrease in frequency and magnitude of
unusually cold days and nights at the global scale.
Virtually certain increase in frequency and magnitude of
unusually warm days and nights at the global scale.

42
Very likely increase in length, frequency, and/or intensity of
warm spells or heat waves over most land areas.
Precipitation Likely increase in frequency of heavy precipitation events or
increase in proportion of total rainfall from heavy falls over
many areas of the globe, in particular in the high latitudes
and tropical regions, and in winter in the northern mid-
latitudes
Winds Low confidence in projections of extreme winds (with the
exception of wind extremes associated with tropical
cyclones).
Hazard type Projected changes (up to 2010)
Droughts Medium confidence in projected increase in duration and
intensity of droughts in some regions of the world, including
southern Europe and the Mediterranean region, central
Europe, central North America, Central America and Mexico,
northeast Brazil, and southern Africa.
Floods Medium confidence (based on physical reasoning) that
projected increases in heavy precipitation would contribute
to rain-generated local flooding in some catchments or
regions. Very likely earlier spring peak flows in snowmelt-
and glacier-fed rivers
Other High confidence that changes in heat waves, glacial retreat,
and/or permafrost degradation will affect high mountain
phenomena such as slope instabilities, mass movements,
and glacial lake outburst floods. High confidence that
changes in heavy precipitation will affect landslides in some
regions.
However, the severity of the impacts does not depend only on the process itself but also on the level
and spatial distribution of vulnerability and exposure. In Table 5 the changes in the risk pattern coming
43
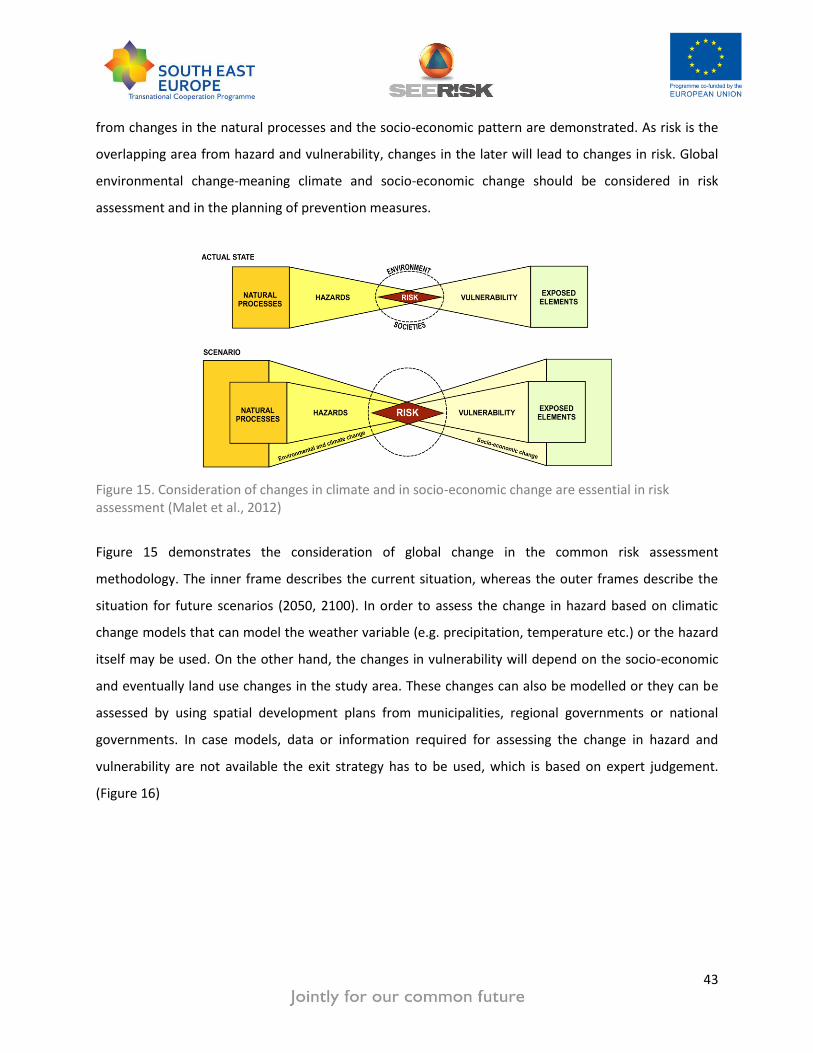
from changes in the natural processes and the socio-economic pattern are demonstrated. As risk is the
overlapping area from hazard and vulnerability, changes in the later will lead to changes in risk. Global
environmental change-meaning climate and socio-economic change should be considered in risk
assessment and in the planning of prevention measures.
Figure 15. Consideration of changes in climate and in socio-economic change are essential in risk assessment (Malet et al., 2012)
Figure 15 demonstrates the consideration of global change in the common risk assessment
methodology. The inner frame describes the current situation, whereas the outer frames describe the
situation for future scenarios (2050, 2100). In order to assess the change in hazard based on climatic
change models that can model the weather variable (e.g. precipitation, temperature etc.) or the hazard
itself may be used. On the other hand, the changes in vulnerability will depend on the socio-economic
and eventually land use changes in the study area. These changes can also be modelled or they can be
assessed by using spatial development plans from municipalities, regional governments or national
governments. In case models, data or information required for assessing the change in hazard and
vulnerability are not available the exit strategy has to be used, which is based on expert judgement.
(Figure 16)

44
Figure 16. Consideration of Global change for future risk assessment
45
5. FLOODS
According to the Flood Directive (EC, 2007), “flood means the temporary covering by water of land not
normally covered by water. This shall include floods from rivers, mountain torrents, Mediterranean
ephemeral water courses and floods from the sea in coastal areas, and may exclude floods from
sewerage systems”. In SEERISK only riverine slow rising floods will be considered. Flood causes may be
meteorological (rainstorms, snow melt, ice jams), hydrological (ground water level, soil moisture.
Impervious cover) or anthropogenic (land use, human occupancy of flood plains or engineering works)
(WMO, 1990). Flood can result in death and injury of people. However, damage and destruction of
buildings and infrastructure, loss and damage of building contents and goods and loss of livestock or
destruction of crops may also be caused by floods. In order to conduct flood risk assessment the
following is required:
1. Information regarding past events (type of flood, date, time and duration, flood extent,
damage in €, number of people dead or injured, etc.)
2. Information from gauges (water levels) for different times
3. Information of elements at risk located within the flood plain.
The flood risk assessment methodology presented below is in line with and has considered the EC Flood
directive (EC, 2007). According to this directive the member states should complete the preliminary risk
maps by the end of 2011 and the completed flood hazard and risk maps by the end of 2013. The
presented methodology may enable this process and give an extra support for the preparation of these
maps.
5.1 SEERISK RISK ASSESSMENT METHODOLOGY FOR FLOOD HAZARD
5.1.1 HAZARD ASSESSMENT
Qualitative flood hazard assessment: If a flood hazard map does exist then it can be directly used as a
basis for risk mapping. If not, a flood hazard map has to be developed based on historical data (first
alternative). In absence of historical data, expert judgement may be used in order to delineate the flood
extent for different return periods in the study area (second alternative). If this is also difficult, then the
exit strategy suggests that the whole catchment should be considered (Figure 17).
46
Quantitative flood hazard assessment: Flood is a relative common hazard type and, for this reason, it is
one of the best documented ones. Municipalities have often flood hazards map (mainly maps that show
the flood extent for different return periods), however, they may also have measurements regarding the
water level for different dates (from gauges), as well as measurements of the water discharge. These
data in combination with information regarding the topography (e.g. DEM or a topographic map) can be
used in order to model the flood extent of different return periods (Figure 18).
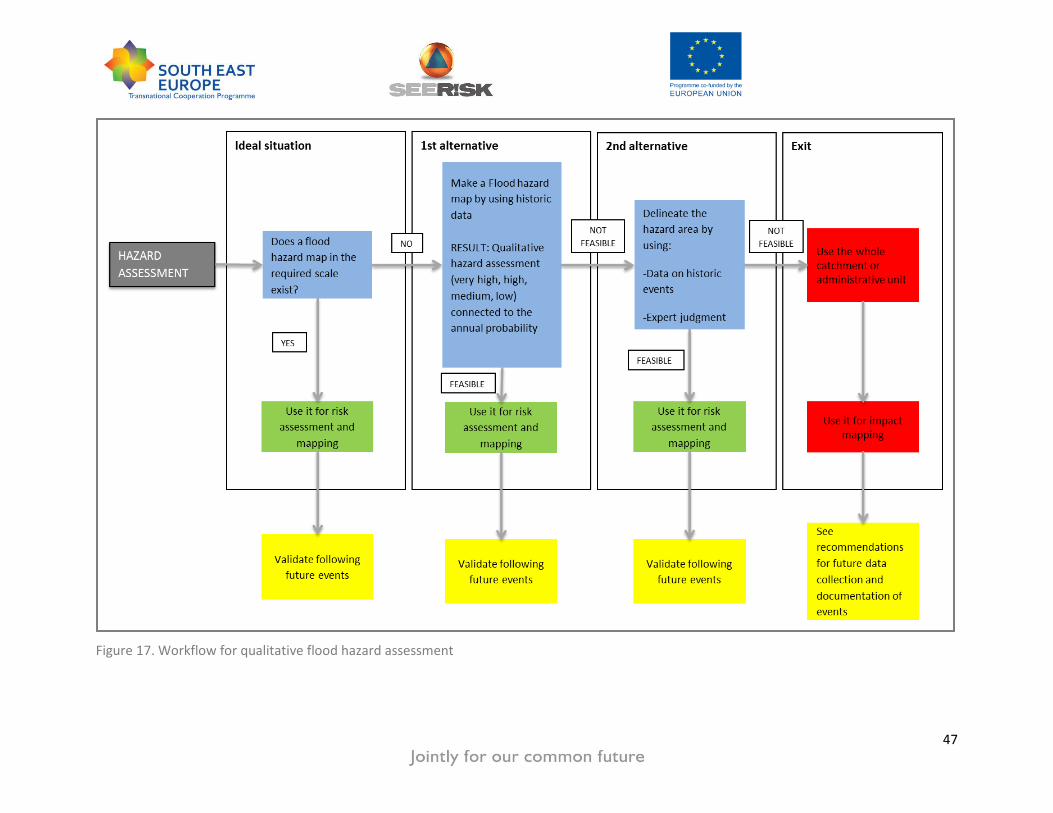
47
Figure 17. Workflow for qualitative flood hazard assessment

48
Figure 18. Workflow for quantitative flood hazard assessment and mapping

49
5.1.2 IMPACT ASSESSMENT
Qualitative: Qualitative flood impact assessment requires qualitative data regarding past events or the
vulnerability of elements at risk. In case a flood impact map exists it should be directly used for risk
assessment and mapping (ideal situation). Otherwise, a qualitative impact map should be produced
based on historic events or qualitative information on the elements at risk. This would be a map
showing where high/medium/low impact was located following specific flood events (first alternative).
In case historic data regarding flood events are sparse or non-existent a potential impact map may be
developed based on expert judgement and land use information (second alternative). If this is also not
feasible, then the exit option has to be chosen. The exit option suggests the use of a land use map to
visualise potential exposure that can be used for exposure mapping rather for risk mapping (Figure 19).
Quantitative: Quantitative risk assessment is based on the use of vulnerability curves (first alternative).
There are numerous vulnerability curves available for flood events. However, vulnerability curves are
developed using data from specific events in areas with a specific type of buildings and architecture and
for this reason they are not always transferable. However if enough information on past events exist
(e.g. water depth and respective damage) a site-specific vulnerability curve may be developed. If no
existing vulnerability curve fits the characteristics of the study area and not enough data are available
for the development of a new one, then the second alternative should be used. This is to develop an
impact map by using expert judgement and land use information. The exit option is to make an exposure
map based on land use information (Figure 20).

50
Figure 19. Workflow for qualitative flood impact assessment and mapping

51
Figure 20. Workflow for quantitative flood impact assessment and mapping

52
Figure 21. Qualitative and Quantitative Flood Risk mapping

53
5.1.3 RISK ASSESSMENT AND MAPPING
In Figure 21 the way hazard assessment, impact assessment and resulting maps are combined in order
to produce a risk map is shown. Qualitative data will lead to the production of a risk matrix that will then
be used as a base for the production of a qualitative flood risk map. Quantitative data will be used to
produce a risk curve and finally, a quantitative flood risk map. The workflow of the methodology for
floods is demonstrated in the following example.
5.1.4 FLOOD RISK ASSESSMENT – AN EXAMPLE
The process described above can be demonstrated through an example. In the following example a
virtual town called RISKVille has been created. In
Figure 22 the building use map of RISKVille is shown. The building use varies from residential to
commercial and industrial. Open spaces such as parks, parking places and stadiums are also included.
The main transport networks are also shown as well as the river that flows through the city. A working
group was formulated in order to conduct risk assessment and mapping for floods with focus on the
buildings of the area and the impact on the local economy. For this reason, buildings that are related to
local industry are highly vulnerable, commercial buildings are moderate vulnerable and residential and
public buildings have low vulnerability. The working group included local authorities, scientists and
experts form the local university and disaster managers. The working group decided that the scale will
be local and that the extent of the study would be the administrative unit of RISKVille. Records of past
events of affecting RISKVille were investigated and the authorities produced the risk matrix shown in
Figure 25. The flood extent map for four return periods (10years, 30years, 100 and 50 years) is shown in
Figure 23. In
Figure 24 the vulnerability (low, medium, high, very high) of the different buildings based on their impact on the local economy is shown. The maps of
Figure 24 and Figure 23 will be overlaid and risk values will be given based on the risk matrix (Figure 25).
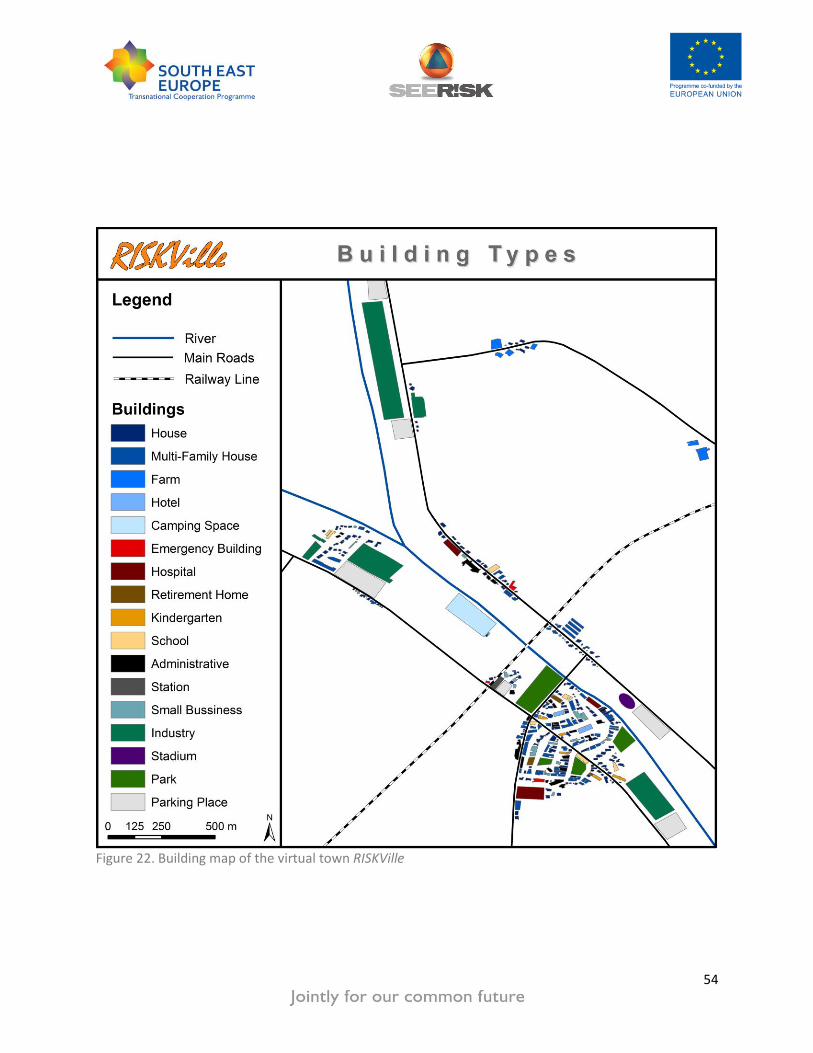
54
Figure 22. Building map of the virtual town RISKVille

55
Figure 23. Flood extent map for the virtual town RISKVille

56
Figure 24. Flood vulnerability map for the virtual town RISKVille
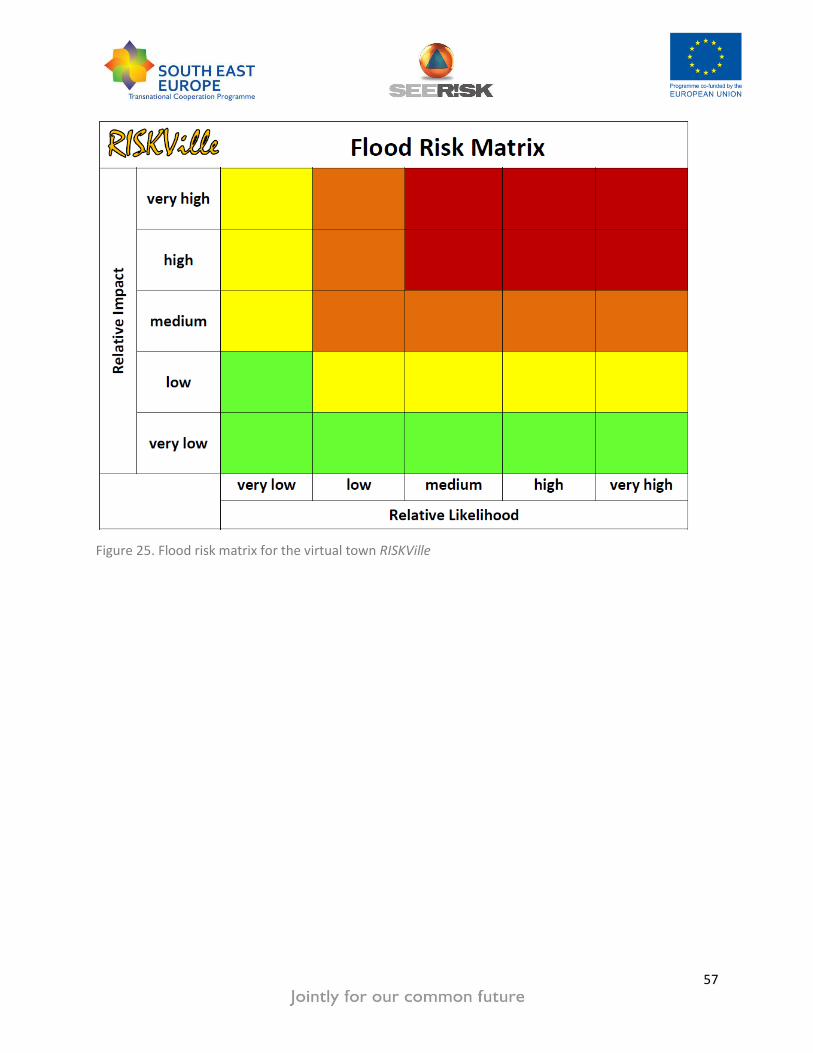
57
Figure 25. Flood risk matrix for the virtual town RISKVille
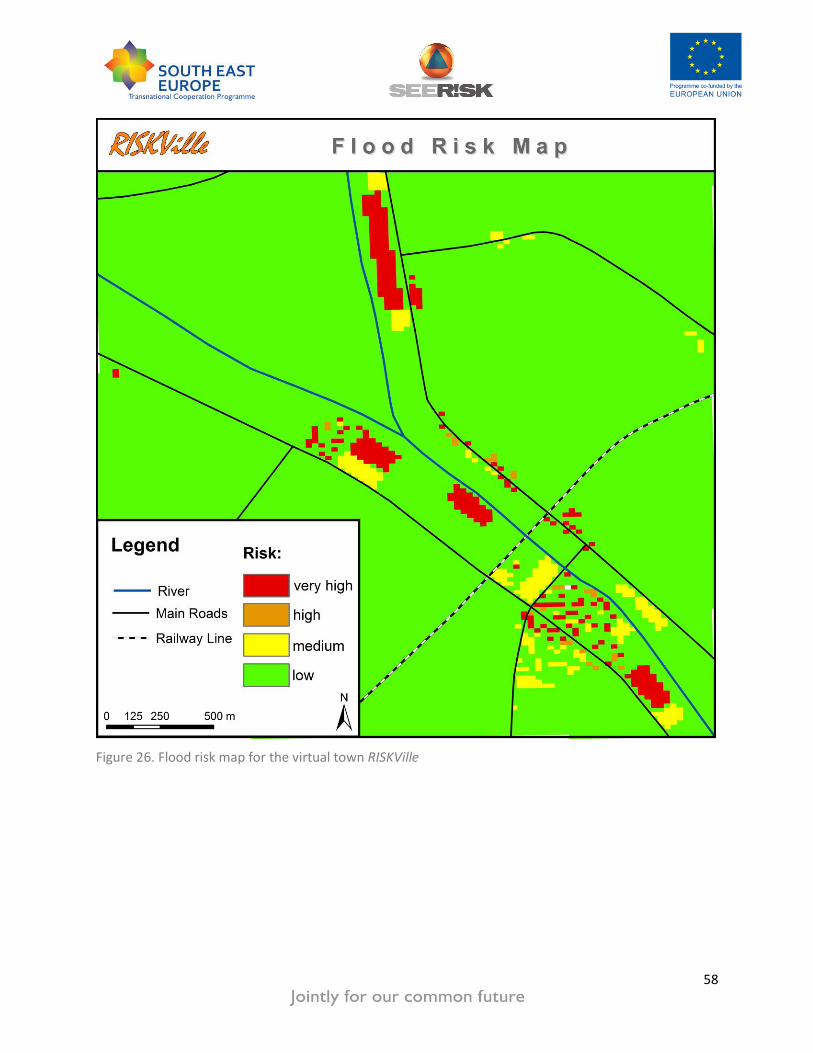
58
Figure 26. Flood risk map for the virtual town RISKVille
59
6. HEAT WAVES
According to Meehl and Tebaldi (2004), there is no universal definition for heat waves. The definitions
given to heat waves usually quantify the temperature of night time maxima and daytime minima as well
as the duration (Meehl and Tebaldi, 2004). Most local, regional or national governments have such a
temperature threshold above which a heat wave can be defined. The latest IPCC report (2012) suggests
that there is a “virtually certain increase in frequency and magnitude of unusually warm days and nights
at the global scale”. The same report also suggests that there is a “very likely increase in length,
frequency, and/or intensity of warm spells or heat waves over most land areas”. Heat waves are often
associated with excess in mortality. The elderly are mainly at risk, whereas, there is no evidence of
mortality attributable to heat waves in children. However, the risk of heat illness exists for the entire
population (Kovats and Ebi, 2006). Risk assessment for heat waves has mainly human lives as focus. In
the following chapters the above described methodology is presented for heat waves.
6.1 SEERISK RISK ASSESSMENT METHODOLOGY FOR HEAT WAVE HAZARD
6.1.1 HAZARD ASSESSMENT
Qualitative heat wave hazard assessment: The spatial variability of the probability of occurrence does
not make sense at local scale since the heat wave probability is the same for the entire area. However,
the spatial variation of the temperature is very important and it should be considered. In Figure 12 it is
shown that a hazard map can be probabilistic (the map shows the spatial distribution of the annual
probability of occurrence in a specific area) or deterministic (the map shows the distribution of different
intensities in the study area under a specific). In this case, a deterministic map will be provided that will
show the temperature variations during a heat wave event in the study area. If such a map does not
exist (ideal situation), a heat wave intensity map has to be produced based on meteorological data (if
possible) indicating the areas where the temperature was higher or lower during a heat wave event
(first alternative). If this is not possible, expert judgement may be used together with information on the
land use (second alternative). In this way, high, low or medium intensity areas may be indicated based
on e.g. the island effect (urban city centre) or the cooling effect from forests and parks. The exit strategy
would be to use the whole administrative unit without any temperature variation (Figure 27).

60
Quantitative heat wave hazard assessment: In case there is more than one meteorological station in the
area or satellite data in the required scale, a quantitative heat wave intensity map can be made showing
the exact temperature variation during a specific event in the study area (first alternative). The second
alternative would be that this map would be made by an expert based on experience and data on
previous events. The exit strategy would be to use the whole administrative unit (Figure 28).
6.1.2 IMPACT ASSESSMENT
Qualitative heat wave impact assessment: In case detailed data regarding the distribution of different
age groups (e.g. elderly) or people with cardiovascular health problems, people living alone or elderly
people living on the top floor do not exist, a qualitative impact map has to be created. The first
alternative suggests the production of an impact map based on casualties of past events and their
location. The second alternative proposes the development of an impact map based on a land use map,
expert judgement and possible data on historic events. The exit strategy leads to exposure mapping by
using a land use map (Figure 29).
Quantitative heat wave impact assessment: According to the first alternative, potential impact may be
expressed in absolute numbers of population or percentage of population that will be potentially
affected. This can be done by specific data on historical events, indicating the number and the location
of population that were admitted to the hospital. Another way would be the mapping of characteristics
that determine human vulnerability to heat waves, such as, absolute numbers and location of elderly
people, people without air-condition or people with cardiovascular health problems. The second
alternative suggests the use of land use information in combination with expert judgement. The exit
option is again the use of a land use map that can be used to map exposure (Figure 30).

61
Figure 27. Workflow for qualitative heat wave hazard assessment

62
Figure 28. Workflow for quantitative heat wave hazard assessment

63
Figure 29. Workflow for qualitative heat wave impact assessment and mapping

64
Figure 30. Workflow for quantitative heat wave hazard assessment and mapping
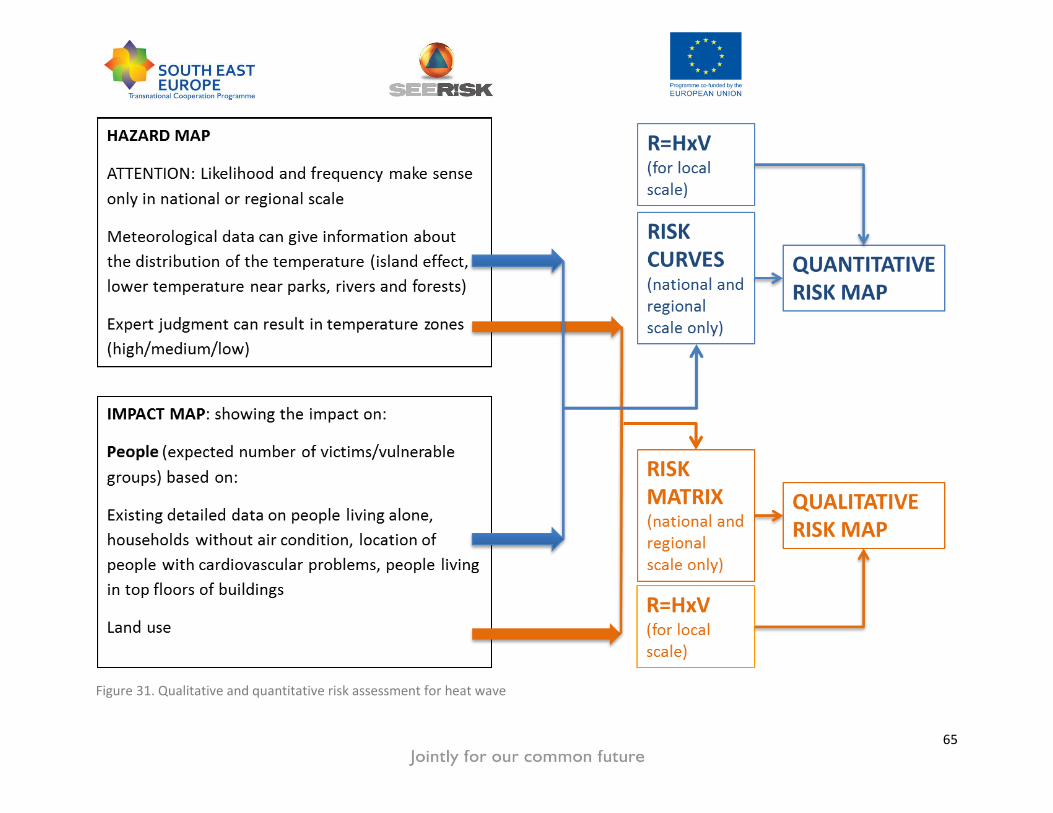
65
Figure 31. Qualitative and quantitative risk assessment for heat wave

66
6.1.3 RISK ASSESSMENT AND MAPPING
In Figure 31 the procedure of combining hazard and vulnerability information and maps in order to
develop a risk map is shown. In the case of local scale the development of a risk matrix is not suggested.
In the case the maps can be overlaid using the following equation:
R=H*V (UNISDR, 2004)
Where: R is the risk, H is the hazard expressed as hazard intensity and V is the vulnerability (potential
impact)
The same applies for the risk curves for local scale. Their use is not suggested since the probability of
occurrence at a local scale remains the same for the whole study area. In this case again the formula
above may be used in order to give a risk value to an element at risk or a pixel.
6.1.4 HEATWAVE RISK ASSESSMENT - AN EXAMPLE
The procedure above can be demonstrated through an example by using the virtual town called RISKVille this time for heat wave risk mapping. In
Figure 32 , a heat wave intensity map is shown. The map indicates the area where the temperature will
be higher based on the land use. Within and around the urban city centre the temperature is expected
to be higher due to the island effect, whereas, in areas that are close to parks, or agricultural areas the
temperature is expected to be slightly lower (green areas). In Figure 33 the spatial variation of the
vulnerability to heat waves is demonstrated. The vulnerability is being based on the use of buildings and,
consequently, the location of vulnerable population (e.g. old people homes, hospitals, etc.). Finally, in
Figure 34 a heat wave risk map is demonstrated.

67
Figure 32. Heat wave intensity map of the virtual town RISKVille
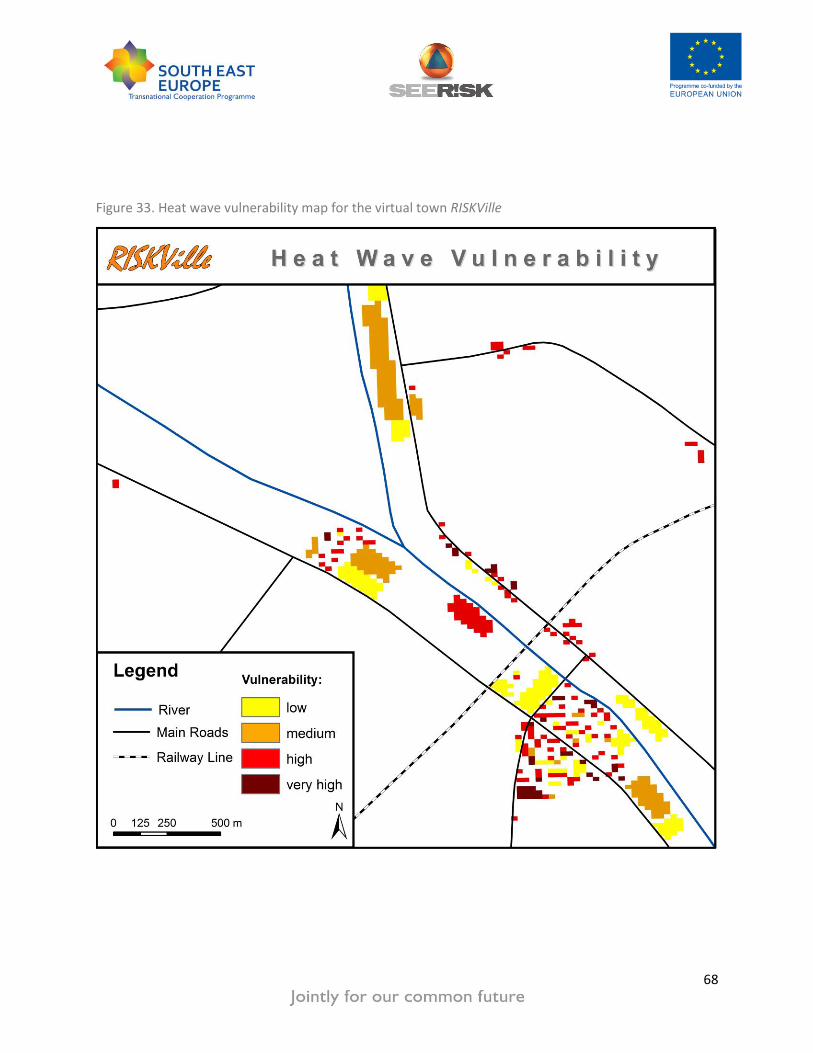
68
Figure 33. Heat wave vulnerability map for the virtual town RISKVille

69
Figure 34. Heat wave risk map for the virtual town RISKVille

70
7. DROUGHTS
There are many conceptual definitions for drought (relative and general terms) and operational
definitions that attempt to identify the onset, severity, and termination of drought periods (Belal et al.,
2012).
The impacts of drought may be environmental but also economic and social. (Belal et al., 2012)
The assessment of drought risk is a challenging task and it should include the following:
1. Identification of the frequency spatial extend and severity of the phenomenon
2. Identification and quantification of the vulnerability of the elements at risk such as people, agriculture
etc.
3. Drought risk pattern identification as a result of the above steps. (Belal et al., 2012)
According to the IPCC (2012, p. 13) SREX report “There is medium confidence that droughts will intensify
in the 21st century in some seasons and areas, due to reduced precipitation and/or increased
evapotranspiration”. This applies to many regions in the world including the Mediterranean region and
central Europe. However, there is medium confidence and not high due to definitional issues, lack of
data and inability of models to include all the factors that influence droughts (IPCC, 2012).
7.1 SEERISK RISK ASSESSMENT METHODOLOGY FOR DROUGHT HAZARD
7.1.1 HAZARD ASSESSMENT
Qualitative drought hazard assessment: The mapping of the hazard at local scale will have to be
deterministic rather than probabilistic, as the annual probability of occurrence will be the same in the
entire study area. The spatial distribution of different drought intensities in a qualitative way will have to
be based on a map showing the different soil types in the study area, since different types of soils have
also a different capacity in maintaining humidity (first alternative). In case soil information is not
available, expert judgment and experience from previous events will have to be used, in order to
develop a qualitative hazard map (second alternative). The exit option suggests the use of the whole
administrative unit (Figure 35).
Quantitative drought hazard assessment: In case quantitative data exist drought intensity may be
identified by sing one of the indices shown in Table 6 (first alternative). In case the required data for the

71
calculation of such indices are not available, expert judgement will have to be used for the development
of a hazard map. The exit option suggests the use of the whole administrative unit (Figure 36).
Table 6. Drought Indices (Belal et al., 2012)
Drought Index Description
Standardised Precipitation Index (SPI) It is calculated from the long-term record of precipitation in
each location (at least 30 years).
Palmer Drought Severity Index (PDSI) It is calculated from precipitation, temperature and soil
moisture data.
Crop Moisture Index (CMI) CMI is a derivative of PDSI which was developed from moisture
accounting procedures as the function of the
evapotranspiration anomaly and the moisture excesses in the
soil.
Surface Water Supply index (SWSI) It is used for frequency analysis to normalize long term data
such as precipitation, snow pack, stream flow and reservoir
level.

72
Figure 35. Workflow for qualitative drought hazard assessment and mapping

73
Figure 36. Workflow for quantitative drought hazard assessment and mapping
74
7.1.2 IMPACT ASSESSMENT
Qualitative drought impact assessment: Droughts have a direct impact on the agriculture of the area.
The first alternative for the production of a map showing the potential impact of droughts in the study
area is based on the types of crops. If this information is available, together with knowledge regarding
the capacity of each type of crops to survive without water or information regarding its sensitivity to
lack of precipitation, an impact map can be made. In case this information is not available, expert
judgement together with experience from past events may be used (Figure 37).
Quantitative drought impact assessment: The impact can be quantitatively assessed by considering not
only the type of crops but also the value of the plants (that may need to be replanted) and the harvest
profit that will be lost. In this way, a map showing the potential impact in absolute numbers can be
made. Existing vulnerability curves or historic data may be also used, if available (first alternative). If the
required data are not available, a quantitative map showing the potential impact may be developed by
using expert judgement and experience from past events (second alternative). The exit option suggests
the use of a land use map in order to visualise exposure (Figure 38).
7.1.3 DROUGHT RISK ASSESSMENT AND MAPPING
In Figure 39 the procedure for qualitative and quantitative drought risk assessment is shown.
Hazard and vulnerability information and maps have to be overlaid in order to develop a risk map. In
case of local scale, the development of a risk matrix is not suggested. In this case, the maps can be
overlaid using the following equation:
R=H*V (UNISDR, 2004)
Where: R is the risk, H is the hazard expressed as hazard intensity and V is the vulnerability (potential
impact)
The same applies for the risk curves for local scale. Their use is not suggested since the probability of
occurrence at local scale remains the same for the whole study area. In this case, the formula above may
be used in order to give a risk value to an element at risk or a pixel.

75
Figure 37. Workflow for qualitative drought impact assessment and mapping
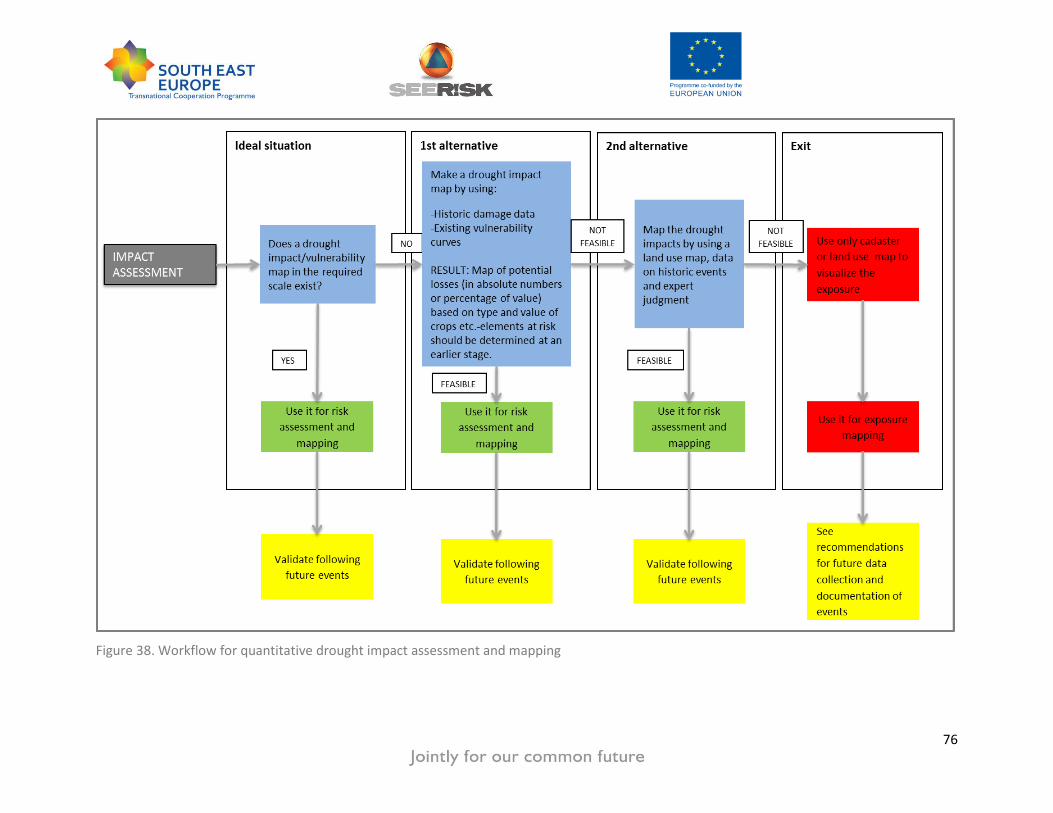
76
Figure 38. Workflow for quantitative drought impact assessment and mapping
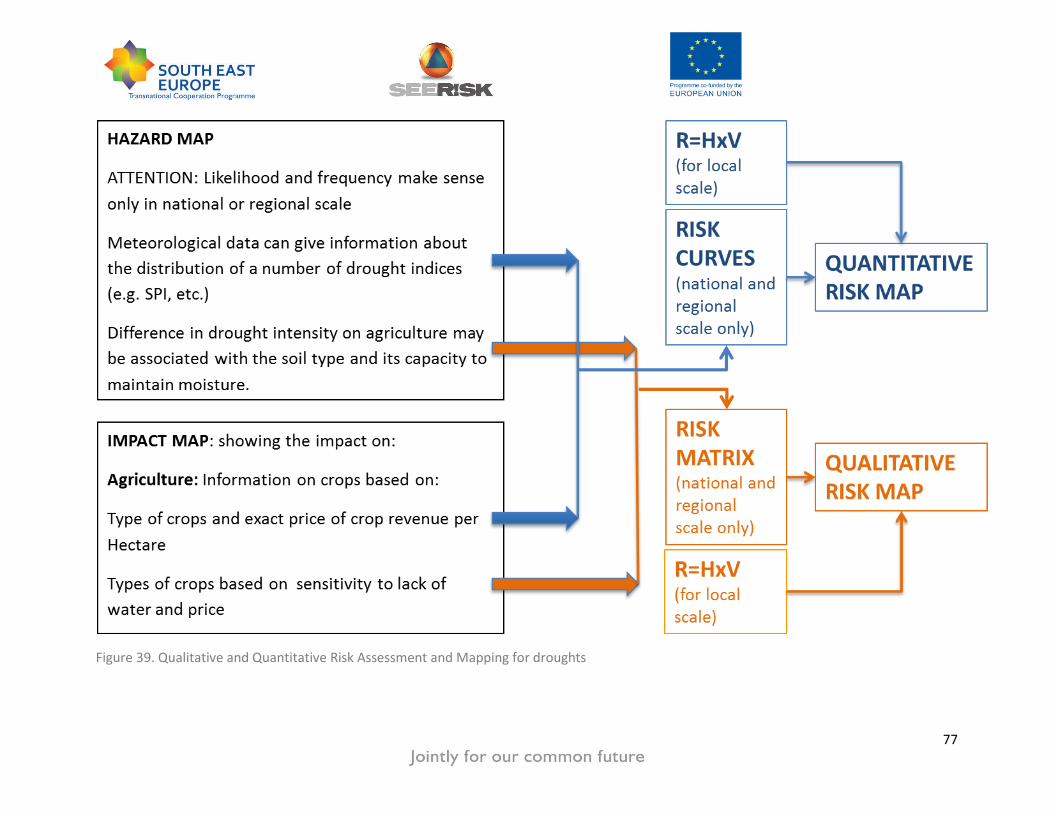
77
Figure 39. Qualitative and Quantitative Risk Assessment and Mapping for droughts

78
7.1.4 DROUGHT RISK ASSESSMENT-AN EXAMPLE
The procedure described above can be demonstrated through an example. The virtual city RISKVille will
be used for the demonstration. Risk assessment and mapping will be carried out focusing on the
economic impact on the agricultural sector due to droughts. As the probability of occurrence is the same
for the study area and there is no other information available for soils properties etc., only an exposure
map will be developed. RISKVille is surrounded by agricultural areas. In Figure 40, the different crop
types in RISKVille are shown. The profit that each hectare of each type of crop generates per year is
known. In the following figure (
Figure 41), the potential economic impact from a drought is shown, expressed as €/hectare.

79
Figure 40. Map of crop types in the virtual town RISKVille

80
Figure 41. Vulnerability map of crop types for droughts in in the virtual town RISKVille

81
8. EXTREME WIND
Extreme winds may cause significant damage to the built environment and also pose a serious threat to
human safety (IPCC, 2012). Wind speed is usually measured in km/h and its force in the Beaufort scale.
At local scale, the magnitude of extreme wind shows variations due to differences in topography, the
existence of buildings, the influence of other surrounding structures etc. The impact of extreme winds
on structures are related to the building type, the construction (roof and wall type and material), the
building age, the number of storeys, and the replacement value (Cechet R.P., 2010). In general, direct
building damage concerns mainly roofs, walls, claddings and openings, whereas indirect damage is
associated with windborne debris (e.g. trees) (Heneka and Ruck, 2008).
8.1 SEERISK RISK ASSESSMENT METHODOLOGY FOR EXTREME WIND HAZARD
8.1.1 HAZARD ASSESSMENT
Qualitative extreme wind hazard assessment: The assessment of the wind hazard at national scale
involves the collection of data regarding past events in order to identify the annual probability. As far as
local scale is concerned, the annual probability is the same for the whole study area. In this case, the
spatial variation of intensity should be considered. The intensity of the wind depends mainly on the
surrounding structures (size, height, orientation) and the topography of the area (first alternative). If
data regarding these characteristics are limited, expert judgement should be used additionally (second
alternative) in order to develop a qualitative hazard map. The exit option would be the use of the whole
administrative unit (Figure 42).
Quantitative extreme wind hazard assessment:
In case detailed data regarding wind speeds and directions of past events, the topography, the height,
shape, size and orientation and exact location of structures exist, extreme wind events can be modelled
and a detailed hazard map can be made (first alternative). A hazard map showing the different wind
intensities in absolute numbers can be also made in absence of detailed data by using expert
judgement. The exit option would be the use of the whole administrative unit (Figure 43).

82
Figure 42. Qualitative extreme wind hazard assessment

83
Figure 43. Quantitative hazard assessment for extreme wind

84
8.1.2 IMPACT ASSESSMENT
Qualitative extreme wind impact assessment: By collecting data regarding previous damages and their
location a qualitative impact map can be made. If data on damages of previous events are not available,
an impact map showing potential damage can be made, based on vulnerability indicators such as, in the
case of buildings, type and quality of roof, height, size and quality of windows etc. (first alternative). A
similar map can be made by using expert judgement and land use data or other relevant information in
lack of detailed data (second alternative). The exit option suggests the use of a land use map to visualise
exposure (Figure 44
Quantitative extreme wind impact assessment: The impact can be assessed and mapped in a
quantitative way, if data regarding past events exist (e.g. number of victims and their location, location
and exact costs of damages). If not, vulnerability curves may be used to assess potential loss of buildings
under different intensity scenarios. Expert judgement should be used in the second alternative, in case
data regarding past damages and vulnerability curves do not exist. The exit option suggests the use of a
land use map for exposure mapping (Figure 45).
8.1.3 RISK ASSESSMENT AND MAPPING
In Figure 46 the procedure of combining hazard and vulnerability/impact maps and information in order
to produce risk maps is shown. At local scale, the development of a risk matrix is not suggested. In case
of extreme winds at local scale, the probability is the same for the whole study area. Instead the
following equation should be used:
R=H*V (UNISDR, 2004)
Where: R is the risk, H is the hazard expressed as hazard intensity and V is the vulnerability (potential
impact)
The same applies for the risk curves for local scale. Their use is not suggested since the probability of
occurrence at a local scale remains the same for the whole study area. In this case, the equation above
may be used in order to give a risk value to an element at risk or a pixel.
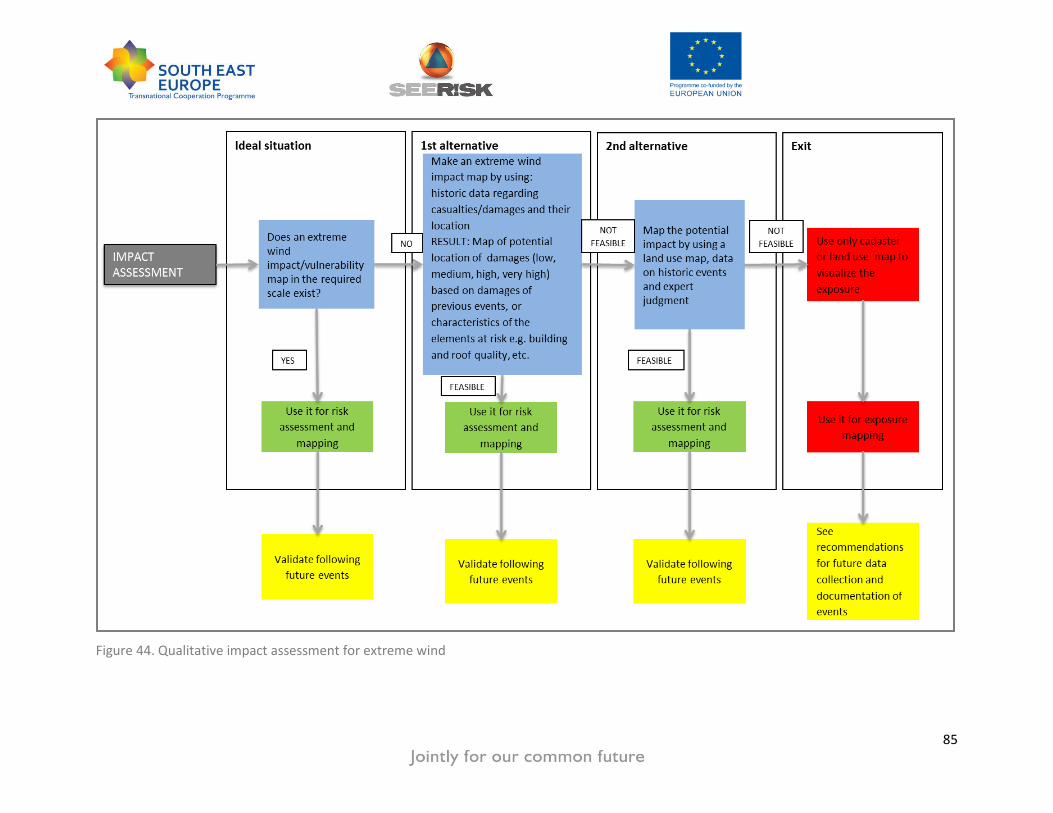
85
Figure 44. Qualitative impact assessment for extreme wind

86
Figure 45. Quantitative impact assessment for extreme wind

87
Figure 46. Extreme wind risk assessment and mapping procedure
88
9. WILD FIRES
After Goldammer (2002) there are several reasons why unprecedented numbers of catastrophic fires
and areas affected can be identified in South East European countries. First, the traditionally centrally
managed structures for protection have been replaced by decentralizes structures, which may not be
equally prepared. Secondly, agricultural areas are abandoned, young people move into the cities, thus,
there is a decreasing number of people available for fire fighting in rural areas. Another reason is
economically driven arson, as well as, decreasing land use intensity leading to an increase in available
biomass for fuel, which influences the intensity and increases the difficulty of controlling the fire. As a
last reason Goldammer (2002) states the decreasing interest of urbanized public to the protection of
forest against fire, as well as, a lack of coordination between states in SE Europe.
Further, the increase of wildfire occurrence, including human-caused fires, varies within the region and
is driven by the facts stated above. Additionally, this increase is also driven by the regional climate
change which induces an increase of extreme droughts (Goldammer, 2002).
Regarding wildfire risk assessment, the more technical engineer’s view would incorporate vulnerability
and elements at risk respectively, leading to the probability of occurrence of a wildfire and the expected
damages caused by the fire (Hardy 2005). There are two types of fire hazard: characteristic and
uncharacteristic (Hardy, 2005). The term “uncharacteristic” refers to fires with undesirable
consequences (Hardy, 2005).
A lot of risk assessment models used by agencies focus on fuel type and structure, frequency of fire,
potential fire behaviour, fire fighting resources, response time and values exposed (Braun, 2003).
Therefore, the fire risk assessment is concentrated on the process and the integration of variables
reflecting the vulnerability or capacity to withstand towards fire (Braun, 2003). This underlines the
importance of assessing the impact according to the risk metric selected (Figure 49 and Figure 50).
Referring to damage minimisation O´Bryan (2002) addresses the indicator of “risk” as key issue. He
further points out three key components of risk to fire damage:
1) Actual fire intensity: influenced by fuel, weather and topography, expressed as kW/m.
2) Vulnerability: as fire intensity increases more damage can be expected; however, this may not
apply to an individual asset but to a broader area.

89
3) Suppression: the difficulty of fire suppression increases with increasing fire intensity, thus, the
chance of preventing damage by suppression decreases.
(O´Bryan, 2002)
In order to decrease the risk of fire, it is necessary not only to take into consideration reducing wildfire
intensity level, but also to reduce the vulnerability of the assets, as well as, improving suppression
(O´Bryan, 2002). Therefore, he concludes that “ … to minimise level of damage over the lifetime of an
asset, minimise risk of fire damage and risk of fire incidence each year.” (O´Bryan, 2002). This conclusion
highlights again the importance of a comprehensive wildfire risk assessment including vulnerability
aspects as described in the following subchapters.
9.1 SEERISK RISK ASSESSMENT METHODOLOGY FOR WILDFIRE HAZARD
9.1.1 HAZARD ASSESSMENT
Qualitative wildfire hazard assessment: The spatial variability as well as the extent of wildfires can vary
strongly. In this case, a map showing the annual probability of occurrence of a wildfire for a specific
season of the year or a map showing different relative intensities of one event (low, medium, high) will
be provided. If this is not possible due to lack of data, an expert needs to be consulted (second
alternative) to combine and complete with the data available the qualitative hazard maps. In case the
second alternative is not possible, the whole area without differentiations may be considered and only
impact mapping can be done – exit strategy (Figure 47).
Quantitative wildfire hazard assessment: The first step would be to check for an existing wildfire hazard
map of the target area. If this is not available, the first alternative would be to apply existing
probabilistic models based on data of wildfires in the past e.g. duration, intensity, date etc.. The second
alternative is consulting expert judgement; however, it should be either intensity and/or probability that
needs to be defined for the different classes. The quantitative hazard map needs to show intensity and
probability of occurrence in numbers (kW/m or percentage). The exit strategy is impact mapping for the
whole area (Figure 48).

90
Figure 47. Workflow for qualitative wildfire hazard assessment and mapping
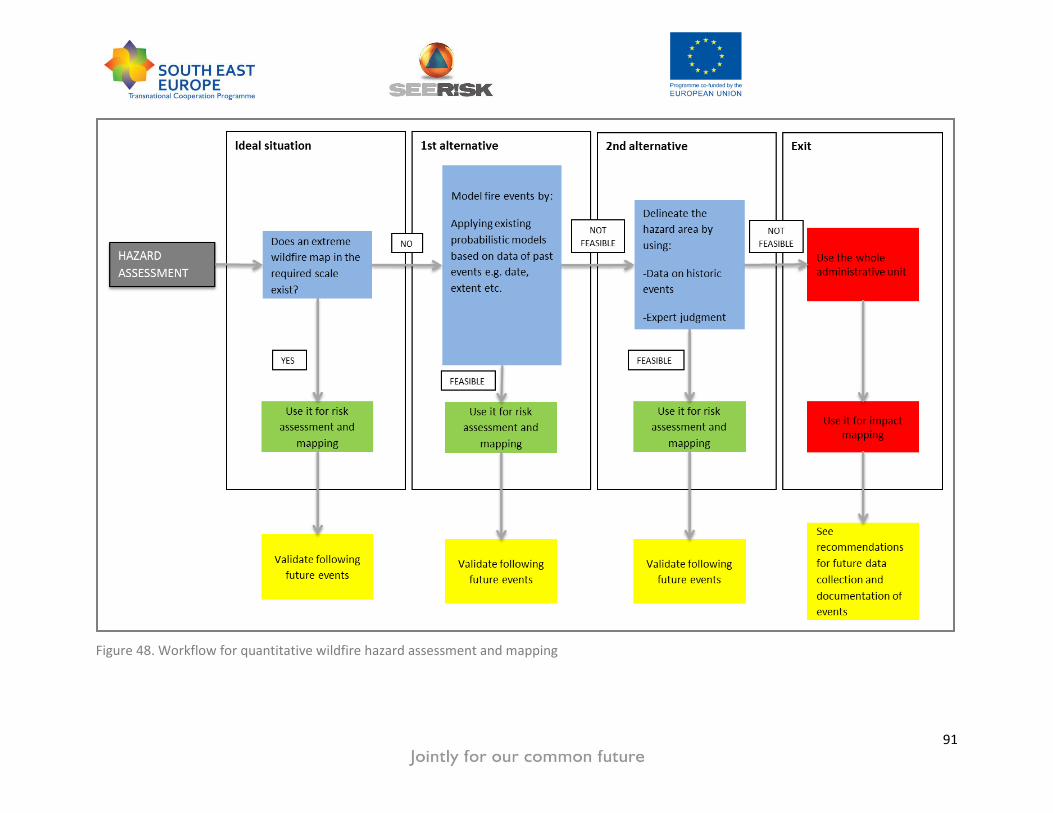
91
Figure 48. Workflow for quantitative wildfire hazard assessment and mapping

92
9.1.2 IMPACT ASSESSMENT
Qualitative wildfire impact assessment: If no detailed data on population structure, density etc. is
available a qualitative assessment has to be considered. A possibility would be to consider areas with
high, medium and low probabilities of fatalities based on data of past events. Another possibility would
be to consider an estimation of population density e.g. higher in cities than in smaller municipalities etc..
The second alternative would be to use expert judgement and historic data. In this way, areas which are
highly vulnerable to wildfires e.g. buildings where people with restricted mobility live could be identified
and mapped. The exit strategy in this case would be to delineate residential areas from the land use
map and therewith map the exposure to wildfires (Figure 49).
Quantitative wildfire impact assessment: The first alternative to an impact map to wildfires would be
the exact number and distribution of people over the study area. Further assessment could be made by
additional criteria like mobility, health and age of population in designated areas. Additionally, data on
past fatalities or injuries could support a detailed impact analysis. In case the element at risk under
consideration is the built environment, the material of the buildings and the surroundings (e.g. proximity
to vegetation) should be considered. The result of this step would be a map of potential losses in either
absolute numbers (number of buildings/euros) or percentage based on fatalities/building damages. As a
second alternative a similar approach as the qualitative assessment is suggested. However, the expert
judgement should be combined with data of historic events and possible numbers of fatalities in the
past (Figure 50).
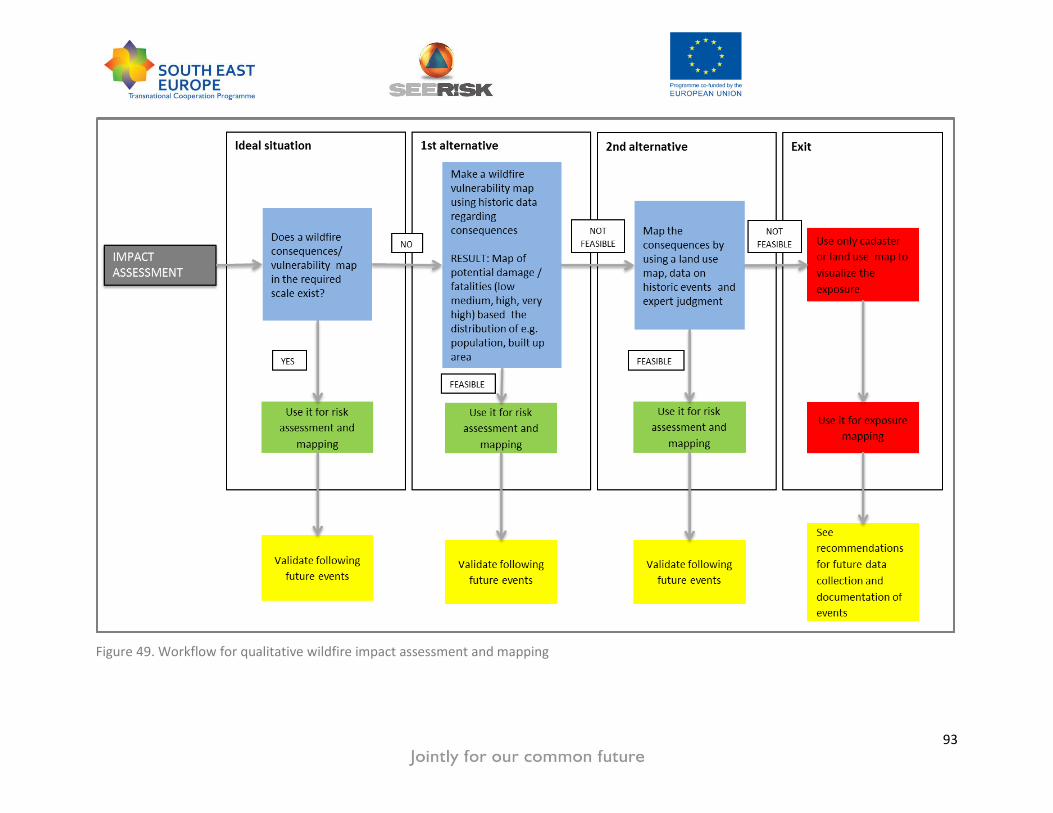
93
Figure 49. Workflow for qualitative wildfire impact assessment and mapping

94
Figure 50. Workflow for quantitative wildfire impact assessment and mapping
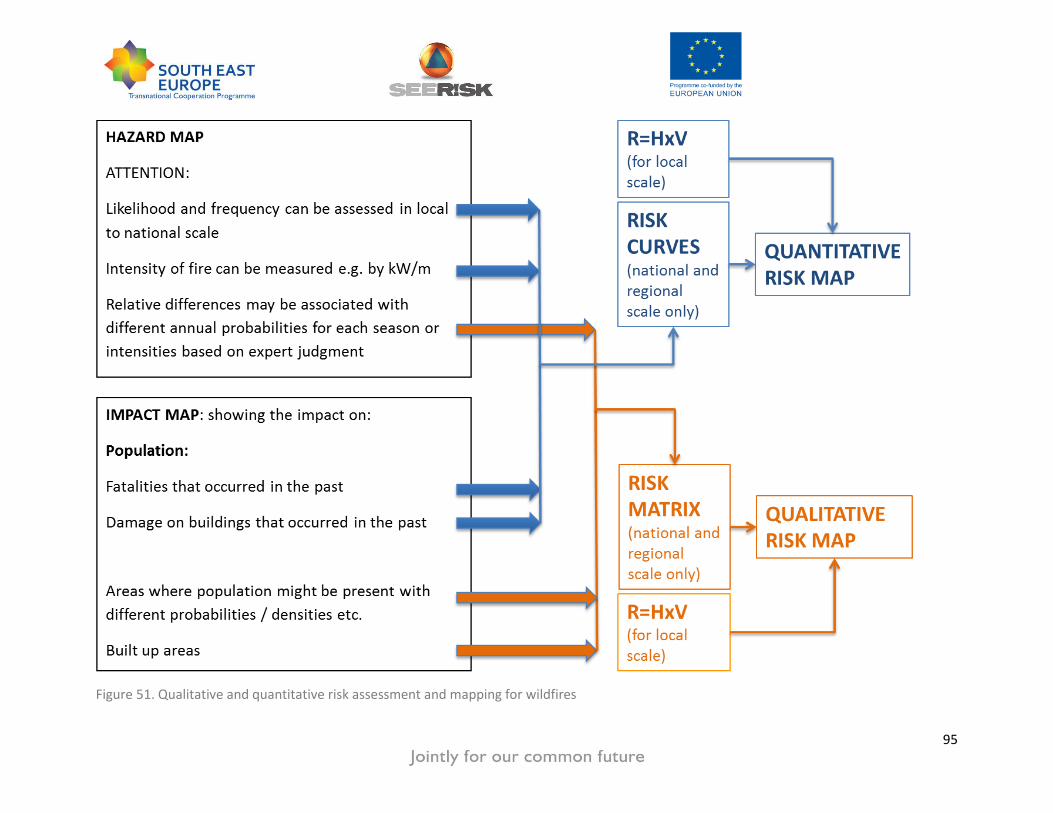
95
Figure 51. Qualitative and quantitative risk assessment and mapping for wildfires

96
10. RECOMMENDATIONS FOR FUTURE DATA COLLECTION
The results of the questionnaire on methods used and data availability clearly showed that the most
significant drawback for carrying out a risk assessment is the lack of relevant data. The methodology
itself offers some alternatives (e.g. expert judgement) in order to cover this gap. However,
recommendations for future data collection may improve the data quality in the future and provide a
better basis for risk assessment. There are two types of data that should be collected and that can be
used later for risk assessment: data regarding the hazard and data regarding the impact on the
population and the built and natural environment.
10.1 DATA REGARDING THE HAZARD
There are several established forms for data collection regarding the hazards characteristics. One of the
projects that dealt with events documentation was DOMODIS. DOMODIS stands for Documentation of
Mountain Disasters and although it does not cover the range of hazards that SEERISK focuses on, it is still
an interesting source of information regarding event documentation. An example of a form for event
documentation from DOMODIS is presented. The documentation form includes two sheets of basic data
(Figure 52 and Figure 53), one sheet which is hazard specific (Figure 54 and Figure 55) and one sheet
regarding the mapping of the process (Figure 55). It is obvious that although the physical process
(hazard) is documented in detail, the damages are not. The information may anyway be useful for risk
assessment but it is not useful for detailed vulnerability assessment and for understanding how the
elements at risk react to the impact of a hazardous event. DOMODIS documentation has is currently
used as a basis for the organisation of event documentation. For example, in South Tyrol, the local
authorities have created a database where most of the hazards are documented.

97
Figure 52. a) Basic information regarding the event (type, date, duration etc.) and the impact (Hübl et al., 2002) to be continued in b) c) and d)
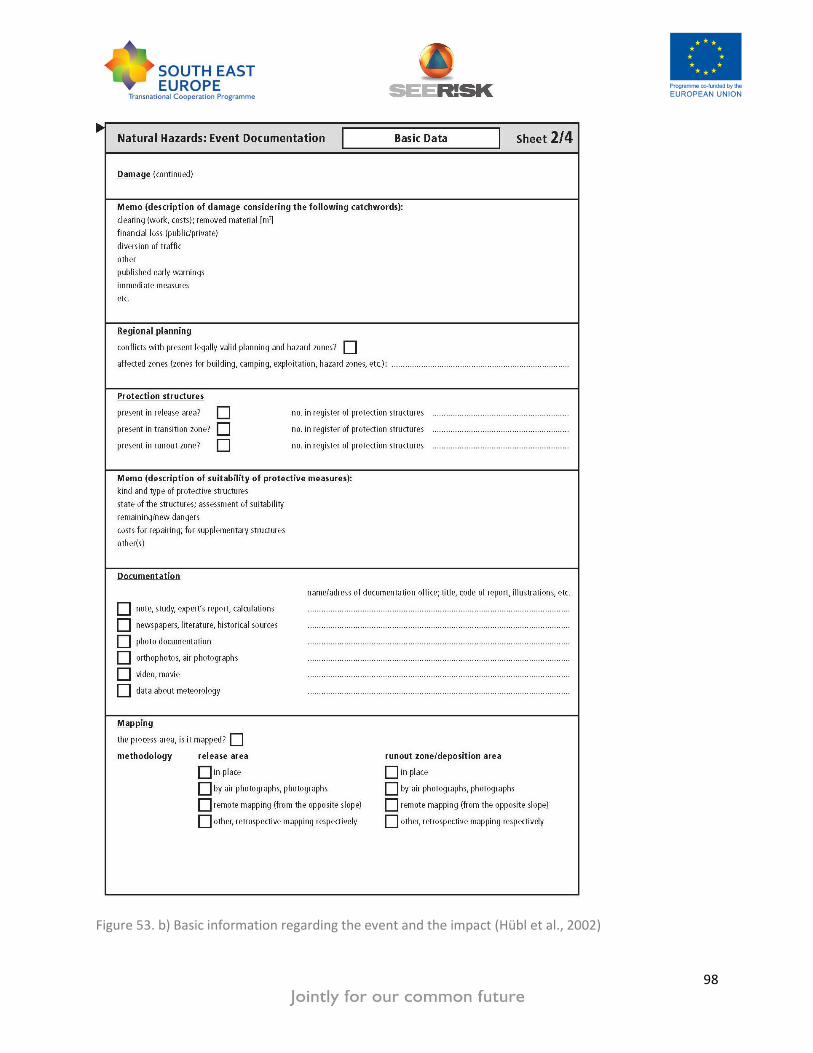
98
Figure 53. b) Basic information regarding the event and the impact (Hübl et al., 2002)

99
Figure 54. c) Detailed information regarding the process in this case for floods and debris flows (Hübl et al., 2002)
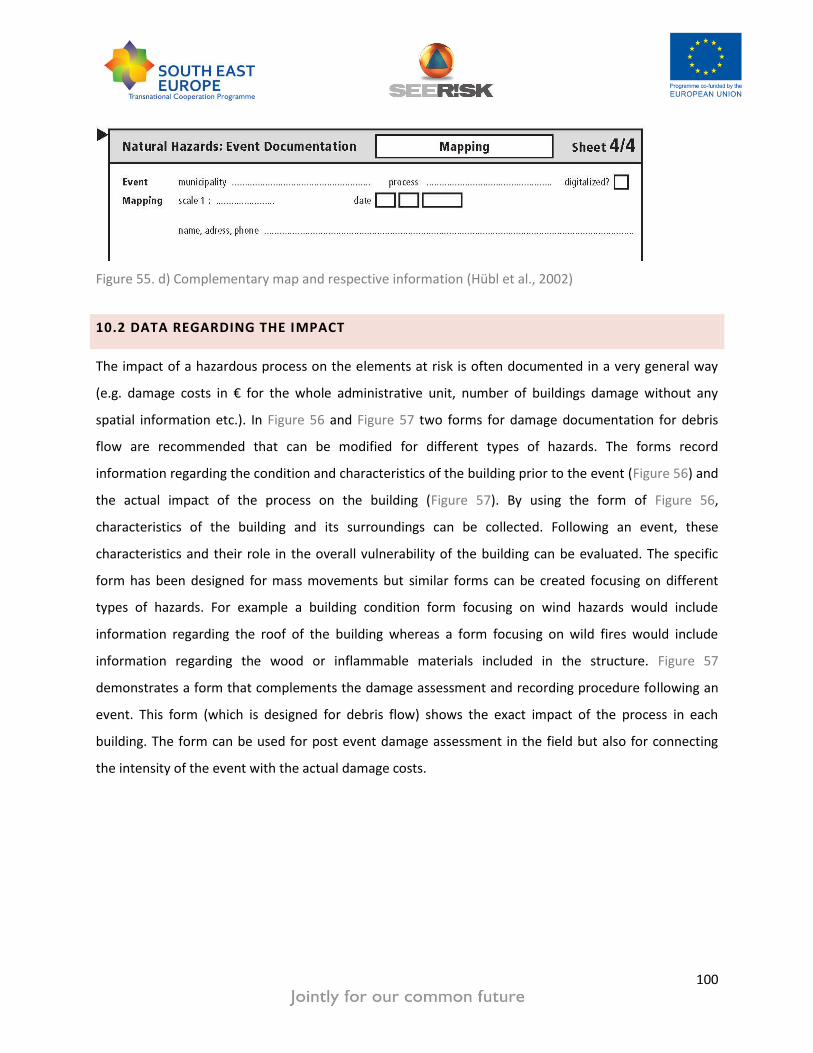
100
Figure 55. d) Complementary map and respective information (Hübl et al., 2002)
10.2 DATA REGARDING THE IMPACT
The impact of a hazardous process on the elements at risk is often documented in a very general way
(e.g. damage costs in € for the whole administrative unit, number of buildings damage without any
spatial information etc.). In Figure 56 and Figure 57 two forms for damage documentation for debris
flow are recommended that can be modified for different types of hazards. The forms record
information regarding the condition and characteristics of the building prior to the event (Figure 56) and
the actual impact of the process on the building (Figure 57). By using the form of Figure 56,
characteristics of the building and its surroundings can be collected. Following an event, these
characteristics and their role in the overall vulnerability of the building can be evaluated. The specific
form has been designed for mass movements but similar forms can be created focusing on different
types of hazards. For example a building condition form focusing on wind hazards would include
information regarding the roof of the building whereas a form focusing on wild fires would include
information regarding the wood or inflammable materials included in the structure. Figure 57
demonstrates a form that complements the damage assessment and recording procedure following an
event. This form (which is designed for debris flow) shows the exact impact of the process in each
building. The form can be used for post event damage assessment in the field but also for connecting
the intensity of the event with the actual damage costs.

101
Figure 56. The form for data collection regarding the condition/type of the building and its surroundings
especially designed for mass movements (Papathoma-Köhle et al., 2012)

102
Figure 57. The form for data collection regarding the actual impact of the process on the specific
building designed for debris flow Terminology (Papathoma-Köhle et al., 2012)

103
11. TERMINOLOGY
Acceptable risk
Degree of human and material loss that is perceived by the community or relevant authorities as
tolerable in actions to minimize disaster risk (UNDHA, 1992).
Adaptation
In human systems, the process of adjustment to actual or expected climate and its effects, in order to
moderate harm or exploit beneficial opportunities. In natural systems, the process of adjustment to
actual climate and its effects; human intervention may facilitate adjustment to expected climate (IPCC,
2012).
Climate change
A change in the state of the climate that can be identified (e.g., by using statistical tests) by changes in
the mean and/or the variability of its properties and that persists for an extended period, typically
decades or longer. Climate change may be due to natural internal processes or external forcings, or to
persistent anthropogenic changes in the composition of the atmosphere or in land use (IPCC, 2012).
Climate Extreme (see also extreme weather event ):
The occurrence of a value of a weather or climate variable above (or below) a threshold value near the
upper (or lower) ends of the range of observed values of the variable. For simplicity, both extreme
weather events and extreme climate events are referred to collectively as ‘climate extremes (IPCC,
2012).
Climate variability
The climatic differences from one year to the next (Smith, 2004).
Cold wave
Marked cooling of the air, or the invasion of very cold air, over a large area (WMO, 1990).
Consequences
Negative effects of a disaster expressed in terms of human impacts, economic and environmental
impacts, and political/social impacts (EC, 2010).
Coping capacity
The ability of people, organizations and systems, using available skills and resources, to face and manage
adverse conditions, emergencies or disasters (UNISDR, 2009).

104
Critical Infrastructure
An asset, system or part thereof located in Member States that is essential for the maintenance of vital
societal functions, the health, safety, security, and economic and social well-being of people, and where
the disruption or destruction of which would have a significant impact in a Member State as a result of
the failure to maintain those functions (EC, 2008).
Debris flows
Debris flows are rapid gravity-induced mass movements that consist of sediment saturated with water
that owe their destructive power to the interaction of solid and fluid forces (Iverson, 1997).
Disaster
Severe alterations in the normal functioning of a community or society due to hazardous physical events
interacting with vulnerable social conditions, leading to widespread hum, material, economic, or
environmental effects that require immediate emergency response to satisfy critical human needs that
may require external support for recovery (IPCC, 2012).
Disaster risk management
Processes for designing, implementing, and evaluating strategies, policies, and measures to improve the
understanding of disaster risk, foster disaster risk reduction and transfer, and promote continuous
improvement in disaster preparedness, response, and recovery practices, with the explicit purpose of
increasing human security, well-being, quality of life, resilience, and sustainable development (IPCC,
2012).
Disaster risk reduction
The concept and practice of reducing disaster risks through systematic efforts to analyse and manage
the causal factors of disasters, including through reduced exposure to hazards, lessened vulnerability of
people and property, wise management of land and the environment, and improved preparedness for
adverse events (UNISDR, 2009).
Domino Effects (Cascading failure)
It means that there is a high probability that occurrence of certain natural hazard is likely to trigger
secondary hazards. In other words, primary and secondary hazards tend to couple whereas the chain
might be longer than just two events – e.g. an earthquake will cause a landslide that will dam the river
valley and consequent failure of the dam creates a flash flood, etc. (Delmonaco et al., 2007).
105
Drought
Drought can be defined as a condition of abnormal dry weather resulting in a serious hydrological
imbalance, with consequences such as losses of standing crops and shortage of water needed by people
and livestock (Alexander, 2003).
Economic and environmental impacts
The sum of the costs of cure or health care, cost of immediate or longer-term emergency measures,
costs of restoration of buildings, infrastructure, property, cultural heritage, costs of environmental
restoration and other environmental costs (EC, 2010).
Exposure
People, property, systems, or other elements present in hazard zones that are thereby subject to
potential losses. (EC, 2010)
Extreme weather event
The occurrence of a value of weather or climate variable above (or below) a threshold value near the
upper (or lower) ends (“tails”) of the range of observed values of the variable (IPCC, 2012).
Flash flood
Flash floods are an extreme, though short-lived, form of inundation. They usually occur under stationary
or slowly moving clusters of thunderstorms, or result from motionless or slowly progressing storms
which have an unabated inflow of air that has high moisture content. They usually last less than 24
hours but the resulting rainfall intensity greatly exceeds infiltration capacity (Alexander, 2003).
Flood
A flood can be defined as the height or stage, of water above some given point such as the banks of a
river channel (Alexander, 2003).
‘Flood’ means the temporary covering by water of land not normally covered by water. This shall include
floods from rivers, mountain torrents, Mediterranean ephemeral water courses, and floods from the sea
in coastal areas, and may exclude floods from sewerage systems (EC, 2007).
Hazard
A dangerous phenomenon, substance, human activity or condition that may cause loss of life, injury or
other health impacts, property damage, loss of livelihoods and services, social and economic disruption,
or environmental damage (EC, 2010).
Hazard assessments
106
Hazard assessments determine the probability of occurrence of a certain hazard of certain intensity (EC,
2010).
Hazard map
Type of a map that portrays levels of a particular hazard (or hazards) (EC, 2010).
Heat waves
A period of abnormally and uncomfortably hot and unusually humid weather. Typically a heat wave lasts
two or more days (NOAA, 2012).
Human impacts
The quantitative measurement of the following factors: number of deaths, number of severely injured
or ill people, and number of permanently displaced people (EC, 2010).
Hydro-meteorological hazards
Process or phenomenon of atmospheric, hydrological or oceanographic nature that may cause loss of
life, injury or other health impacts, property damage, loss of livelihoods and services, social and
economic disruption, or environmental damage (UNISDR, 2009).
Mudflows
Mudflows are a type of landslides. They have been variously defined, by must contain between 20 and
80 per cent of fine sediments (which are usually an admixture of sand, silt and clay) and be saturated
with water (Alexander, 2003).
Multi-risk assessments
To determine the total risk from several hazards either occurring at the same time or shortly following
each other, because they are dependent from one another or because they are caused by the same
triggering event or hazard; or merely threatening the same elements at risk (vulnerable/ exposed
elements) without chronological coincidence (EC, 2010).
Political/social impacts
Usually rated on a semi-quantitative scale and may include categories such as public outrage and
anxiety, encroachment of the territory, infringement of the international position, violation of the
democratic system, and social psychological impact, impact on public order and safety, political
implications, psychological implications, and damage to cultural assets (EC, 2010).
107
Preparedness
The knowledge and capacities developed by governments, professional response and recovery
organizations, communities and individuals to effectively anticipate, respond to, and recover from, the
impacts of likely, imminent or current hazard events or conditions. (UNISDR, 2009)
Prevention
The outright avoidance of adverse impacts of hazards and related disasters (UNISDR, 2009).
Public awareness
The extent of common knowledge about disaster risks, the factors that lead to disasters and the actions
that can be taken individually and collectively to reduce exposure and vulnerability to hazards (UNISDR,
2009).
Recovery
The restoration, and improvement where appropriate, of facilities, livelihoods and living conditions of
disaster-affected communities, including efforts to reduce disaster risk factors (UNISDR, 2009).
Response
The provision of emergency services and public assistance during or immediately after a disaster in
order to save lives, reduce health impacts, ensure public safety and meet the basic subsistence needs of
the people affected (UNISDR, 2009).
Resilience
The capacity of a system, community or society potentially exposed to hazards to adapt resisting or
changing in order to reach and maintain an acceptable level of functioning and structure (UNISDR,
2004).
Risk
A combination of the consequences of an event (hazard) and the associated likelihood/probability of its
occurrence (EC, 2010).
The probability of harmful consequences, or expected losses (deaths, injuries, property, livelihoods,
economic activity disrupted or environment damaged) resulting from interactions between natural or
human induced hazards and vulnerable conditions.
Conventionally risk is expressed by the notation
Risk = Hazards x Vulnerability (UNISDR, 2004)
Risk analysis
The process to comprehend the nature of risk and to determine the level of risk (EC, 2010).

108
Risk assessment
The overall process of risk identification, risk analysis, and risk evaluation (EC, 2010).
A methodology to determine the nature and extent of risk by analysing potential hazards and evaluating
existing conditions of vulnerability that could pose a potential threat or harm to people, property,
livelihoods and the environment on which they depend. (UNISDR, 2009)
The process of conducting a risk assessment is based on a review of both the technical features of
hazards such as their location, intensity, frequency and probability; and also the analysis of the physical,
social, economic and environmental dimensions of vulnerability and exposure, while taking particular
account of the coping capabilities pertinent to the risk scenarios. (UNISDR, 2009)
Risk evaluation
The process of comparing the results of risk analysis with risk criteria to determine whether the risk
and/or its magnitude is acceptable or tolerable. (EC, 2010)
Risk identification
Risk identification is the process of finding, recognizing and describing risks (EC, 2010).
Risk map
It portrays levels of risk across a geographical area. Such maps can focus on one risk only or include
different types of risks (EC, 2010).
Risk Matrix
A graphical representation of risk relating the relative likelihood of occurrence and the relative impact
(human, economic/environmental, political/social) of a hazard or risk scenario (EC, 2010).
Risk scenario
A representation of one single-risk or multi-risk situation leading to significant impacts, selected for the
purpose of assessing in more detail a particular type of risk for which it is representative, or constitutes
an informative example or illustration (EC, 2010).
Rock falls
Movements of debris (mainly rock transported through the air. They occur on steep faces where
bedrock weaknesses, such as joints, bedding and exfoliation surfaces are present (Smith, 2004).
Shallow landslides
Landslides can be defined as the downslope movement of soil, rock, or debris due to gravitational forces
that can be triggered by heavy rainfall, rapid snow melting, slope undercutting, etc. (Crozier (1999);
Crozier and Glade (2005)).

109
Shallow rapid landslides normally occur on slopes covered by thin colluvium and exhibit an initial
translational sliding failure and a subsequent disaggregation to form into a debris flow. (Korck et al.,
2011).
Single risk assessments
To determine the singular risk (i.e. likelihood and consequences) of one particular hazard (e.g. flood) or
one particular type of hazard (e.g. flooding) occurring in a particular geographic area during a given
period of time (EC, 2010).
Snowstorm
Meteorological disturbance giving rise to a heavy fall of snow, often accompanied by strong winds
(WMO, 1990).
Thunderstorm
A local storm produced by a cumulonimbus cloud and accompanied by lightning and thunder (NOAA,
2012).
Uncertainties
Uncertainty exists where there is a lack of knowledge concerning outcomes. Uncertainty may result e.g.
from imprecise knowledge of risk, from model uncertainty which may be related to vague process
knowledge, or imprecise data measures, etc. Uncertainty may effect both in a risk approach, the
probability and the consequences (Schmidt-Thome et al., 2006).
Vulnerability
The characteristics and circumstances of a community, system or asset that make it susceptible to, or
unable to cope with the adverse effects of climate change (hazard). It expresses the part or percentage
of exposure that is likely to be lost due to a hazard (EC, 2010) (UNISDR, 2009).
or
The degree of loss to a given element, or set of elements, within the area affected by a hazard. It is
expressed on a scale of 0 (no loss) to 1 (total loss) (UNDRO, 1984).
Wildfires
Wildfire is a generic term for uncontrolled fires fuelled by natural vegetation. In general, high
temperatures and drought following an active period of vegetation growth provide the most dangerous
conditions (Smith, 2004).

110
12. REFERENCES
AEMC 2010. National Emergency Risk Assessment Guidelines. Australian Emergency Management Committee, Emergency Tasmanian State Emergency Service, Hobart.
ALEXANDER, D. 2003. Natural hazards. In: EDITOR(S), H. T. (ed.) Encyclopedia of Life Support Systems
(EOLSS). Oxford, UK: Eolss Publishers. BELAL, A.-A., EL-RAMADY, H. R., MOHAMED, E. S. and SALEH, A. M. 2012. Drought risk assessment using
remote sensing and GIS techniques. Arab J GeosciArab. BRAUN, K. 2003. Wildfire Risk – Integrating Community Resilience Or Vulnerability Attributes And
Hazard Assessments, To Provide A Comprehensive Risk Model. ICS Group. CECHET R.P., A. W. C., WEHNER M., SANABRIA L.A., THOMAS C., NADIMPALLI K., POWER L., DIVI C.B.,
YANG T. National Wind Risk Assessment (NWRA) for the Australian region. The Fifth International Symposium on Computational Wind Engineering (CWE2010), 2010 Chapel Hill, North Carolina, USA.
CECHET, R. P., ARTHUR, W. C., WEHNER, M., SANABRIA, L. A., THOMAS, C., YANG, T., WEHNER, M.,
BABU, D. and ANDERSON, H. National Wind Risk Assessment (NWRA). Greenhouse, The Science of Climate Change, 2011 Cairns, Australia.
CROZIER, M. J. 1999. Landslides. In: ALEXANDER, D. E. and FAIRBRIDGE, R. W. (eds.) Encyclopedia of
environmental science. Dordrecht: Kluwer. CROZIER, M. J. and GLADE, T. 2005. Landslide hazard and risk: issues, concepts, and approach. In:
GLADE, T., ANDERSON, M. G. and CROZIER, M. J. (eds.) Landslide hazard and risk. Chichester: Wiley.
DELMONACO, G., MARGOTTINI, C. and SPIZZICHINO, D. 2007. ARMONIA methodology for multi-risk
assessment and the harmonisation of different natural risk map (Del. 3.1.1). EC 2007. Council Directive 2007/60/EC of 23 October 2007 on the assessment and management of flood
risks. Official Journal of the European Union. European Comission. EC 2008. Council Directive 2008/114/EC of 8 December 2008 on the identification and designation of
European critical infrastructures and the assessment of the need to improve their protection. Official Journal of the European Union. European Commission.
EC 2010. Staff Working Paper on Risk Assessment and Mapping Guidelines for Disaster Management.
European Commission.

111
GEC 1998. Landslides and Boulder Falls from Natural Terrain: Interim Risk Guidelines. GEO Report Hong Kong: Geotechnical Engineering Office.
GOLDAMMER, J. G. 2002. Forest Fire Problems in South East Europe and Adjoining Regions: Challenges
and Solutions in the 21st Century. Fire and Emergency Safety. Sofia, Bulgaria. HARDY, C. C. 2005. Wildland fire hazard and risk: Problems, definitions, and context. Forest Ecology and
Management, 211, 73-82. HENEKA, P. and RUCK, B. 2008. A damage model for the assessment of storm damage to buildings.
Engineering Structures, 30, 3603-3609. HÜBL, J., KIENHOLZ, H. and LOIPERSBERGER, A. (eds.) 2002. DOMODIS - Documentation of Mountain
Disasters. State of Discussion in the European Mountain Areas. IEC/FDIS31010 2009. Risk management -- Risk assessment techniques. IPCC 2012. Managing the Risks of Extreme Events and Disasters to Advance Climate Change Adaptation.
In: FIELD, C. B., V. BARROS, T.F. STOCKER, D. QIN, D.J. DOKKEN, K.L. EBI, M.D. MASTRANDREA, K.J. MACH, G.-K. PLATTNER, S.K. ALLEN, M. TIGNOR, AND P.M. MIDGLEY. (ed.) A special report of Working Groups I and II of the Intergovernmental Panel on Climate Change Cambridge, UK and New York, NY, USA: Cambridge University Press.
IVERSON, R. M. 1997. The physics of debris flows. Reviews of Geophysics, 35, 245-296. KORCK, J., MAYER, B., RUDOLF-MIKLAU, F., GREMINGER, P., ZISCHG, A. and DAMM, M. 2011. Climate
adaptation and natural hazard management in the Alpine Space. In: DAMM, M. (ed.). München: Bavarian State Ministry of the Environment and Public Health.
KOVATS, R. S. and EBI, K. L. 2006. Heatwaves and public health in Europe. European Journal of Public
Health, 16, 592-599. MALET, J. P., REMAITRE, A., PUISSANT, A., SPICKERMANN, A., GLADE, T., PROMPER, C., PETSCHKO, C.,
BEGUERIA, S. and SANCHEZ, G. 2012. ChangingRISKS Changing pattern of landslide risks as a response to global changes in mountain areas. CIRCLE2 Climate Impact Research & Response Coordination for a Larger Europe EU FP7 ERA-NET Mid-term meeting. Innsbruck.
MEEHL, G. A. and TEBALDI, C. 2004. More Intense, More Frequent, and Longer Lasting Heat Waves in the
21st Century. Science, 305, 994-997. NOAA. 2012. National Weather Service Glossary [Online]. Available: http://w1.weather.gov/glossary/
(site last visited on 19.09.2012) [Accessed 19.09.2012. O´BRYAN, D. 2002. Wildfire risk management. Australian Journal of Emergency Management.
112
PAPATHOMA-KÖHLE, M., KEILER, M., TOTSCHNIG, R. and GLADE, T. 2012. Improvement of vulnerability curves using data from extreme events: debris flow event in South Tyrol. Natural Hazards, 64, 2083-2105.
SCHMIDT-THOME, P., KLEIN, J., R., A. and HURSTINEN, J. 2006. ARMONIA Deliverable 4.1.2 Report:
Technical Glossary of a Multi hazard Related Vulnerability and Risk Assessment Language-Final version.
SMITH, K. 2004. Environmental Hazards: Assessing Risks and Reducing Disaster, New York, Routledge. UNDHA 1992. Internationally Agreed Glossary of Basic Terms Related to Disaster Management. UNDRO 1984. Disaster prevention and mitigation—a compendium of current knowledge. UNISDR 2004. Living with risk: A global review of Disaster reduction Initiatives. Geneva: UN Publications. UNISDR 2009. Terminology on disaster risk reduction. WMO 1990. International Meteorological Vocabulary. Geneva.