SEED PREDATION ALONG AN ELEVATIONAL … · William K. Smith, Ph.D ... I am also indebted to Mireya...
52
SEED PREDATION ALONG AN ELEVATIONAL GRADIENT IN THE TROPICAL ANDES, PERU By RACHEL HILLYER A Thesis Submitted to the Graduate Faculty of WAKE FOREST UNIVERSITY in Partial Fulfillment of the Requirements for the Degree of MASTER OF SCIENCE in the Department of Biology May 2009 Winston-Salem, North Carolina Approved By: Miles R. Silman, Ph.D., Advisor ____________________________________ Examining Committee: Kathleen A. Kron, Ph.D. ____________________________________ William K. Smith, Ph.D. ____________________________________
-
Upload
trinhduong -
Category
Documents
-
view
218 -
download
2
Transcript of SEED PREDATION ALONG AN ELEVATIONAL … · William K. Smith, Ph.D ... I am also indebted to Mireya...

SEED PREDATION ALONG AN ELEVATIONAL GRADIENT IN THE TROPICAL ANDES, PERU
By
RACHEL HILLYER
A Thesis Submitted to the Graduate Faculty of
WAKE FOREST UNIVERSITY
in Partial Fulfillment of the Requirements
for the Degree of
MASTER OF SCIENCE
in the Department of Biology
May 2009
Winston-Salem, North Carolina
Approved By:
Miles R. Silman, Ph.D., Advisor ____________________________________
Examining Committee:
Kathleen A. Kron, Ph.D. ____________________________________
William K. Smith, Ph.D. ____________________________________

ii
ACKNOWLEDGEMENTS From the start, I’d like to thank my advisor, Dr. Miles Silman, for his patience, thoughtful guidance, and constant enthusiasm throughout this entire process. I’d also like to thank the members of my committee, Dr. Kathleen Kron and Dr. William Smith for lending their time and perspective to this project. I’ve also benefited from the support and insight of the entire Silman lab: Dr. Ken Feeley, Julie Wyatt, Josh Rapp, William Farfan Rios, and Karina García Cabrera. I am also indebted to Mireya Natividad Raurau Quisiyupanqui both for the use of the seed rain data and for being my middleman in Peru. I owe a huge thank you to my field assistants in Peru: Jhoel Delgado Salazar, Guido Vilcahuaman Fernandez, Reyner Tairo Loayza, and Adam Ccahuana Quispe for their many hours of hard work. Funding for this research was provided by the Moore Foundation. I’d like to thank my mom, dad, and brother for the love and support that brought me here. Finally, to my fellow grad students who became my closest allies: Heather Fairfield, Jacquelyn Grace, Paige Roe, and Hugh Bender, thanks for the never ending support when things were difficult and all the laughter when things were fun.

iii
TABLE OF CONTENTS
LIST OF TABLES……………………………………………………………………….v
LIST OF FIGURES………………………………………………………………………vi
ABSTRACT……………………………………………………………………………..vii
INTRODUCTION………………………………………………………………………...1
Differential Seed Predation on Plant Species …………………………………….2
Biotic Interactions along Gradients…………….…………………………………3
Predicting Extinctions Due to Climate Change………………………………..….4
METHODS………………………………………………………………………………..5
Study Site………………………………………………………………………….5
Study Species……………………………………………………………………...5
Seed Predation Experiments………………………………………………………6
Ecosystem Productivity Data..…………………………………………………….7
Analysis……………………………………………………………………………8
RESULTS…..……………………………………………………………………………10
Seed Predation…………………………………………………………………...10
Predictors of Seed Predation…………………………………………………..…11
DISCUSSION………………………………..…………………………………………..11
Species Differences…………………….………………………………………...11
Species-Elevation Interactions…………………………………………………...13
Alternative Hypotheses for Seed Predation Patterns.……………………………15
The Importance of Gradients in Biotic Interactions……………………………..16
LITERATURE CITED…………………………………………………………………..18

iv
FIGURE CAPTIONS……………………………………………………………………26
TABLES………………………………………………………………………….……...27
FIGURES………………………………………………………………………………...35
CURRICULUM VITAE…………………………………………………………………45

v
LIST OF TABLES
TABLES PAGE
1. Species used in seed predation experiments……………………………………..27
2. Elevation midpoints of species and genera……………………………………....28
3. Dates of installation and censuses of seed predation sites……………………….29
4. Cox proportional hazard model of seed survival………………………………...30
5. Generalized linear model of seed mortality vs. seed mass ……………………...31
6. Linear regressions of species seed mortality vs. elevation midpoints of genera...32
7. Linear regression of species seed mortality vs. elevation midpoints of species...33
8. Linear regression of measures of ecosystem productivity vs. elevation…………34

vi
LIST OF FIGURES
FIGURES PAGE
1. Experimental design………………………………………………………….35
2. Boxplot of species seed mortality …………………………………………...36
3. Seed mortality across the elevation gradient ………..……………………....37
4. Patterns of species seed mortality across elevation …………………...…….38
5. Seed mortality vs. seed mass………………………………………………...39
6. Seed mortality vs. elevation midpoint of genera…………………………….40
7. Seed mortality vs. elevation midpoint of species…………………………….41
8. Seed rain volume vs. elevation………………………………………………42
9. Woody biomass increment vs. elevation…………………...………………..43
10. Elevational ranges of rodents and carnivores in Manu National Park……….44

vii
ABSTRACT
The study of plant species response to climate change is primarily a study of plant
distributions along environmental gradients, on which biotic interactions exert a large
impact. Post-dispersal seed predation is a plant animal interaction that affects the
population dynamics, community structure, and diversity of plant species through time
and space. This thesis presents a comparative seed predation study of 24 species of
tropical trees across a 2.5 km elevation gradient in the Peruvian Andes. The following
questions were asked (1) does seed predation vary across the elevation gradient? (2) do
predation rates vary among species and are those rates predictable from species traits
such as seed size or current elevational range? And (3), what may be the underlying
cause of variation in seed predation rates in terms of ecosystem productivity and
associated animal communities? Species exhibited marked variation in total seed
predation and in seed predation across the elevation gradient. For all species combined
there was a significant decrease in seed predation at high elevations, resulting in an 5.6
increase in effective fecundity for trees at 3450 m. The overall trend in seed predation
across elevation potentially arises due to seed predator regulation via top-down forces in
the lowlands giving way to bottom-up (productivity) regulation at mid to high elevations.

1
INTRODUCTION
The study of plant species responses to climate change is at its core a study of
species distributions along environmental gradients. Most research in this area, both
modeling (see Malcom et al. 2002; Thomas et al., 2004 for overviews) and empirical
work (e.g. Ibañez et al., 2008) focus on changes in abiotic gradients. However, biotic
interactions are central to plant distributional ecology, and changes in biotic interactions
can have profound effects on species distributions (Weltzin et al., 1997; Leathwick and
Austin, 2001; Webb and Peart, 2001). Indeed in a major empirical study of plant
responses to climate change, a treatment intended to “control” for seed predators had
effects on plant recruitment that equaled or exceeded climate treatments (Iabñez et al.,
2008). How plant-animal interactions change across environmental gradients, even
through central in setting plant distributions, is little studied.
Post-dispersal seed predation is a quantitatively important plant-animal interaction
that can control population dynamics in time and space (Janzen, 1971; Hulme, 1998;
Silman et al., 2003). Seed predators affect plant populations through changes in
population dynamics (Harper, 1977; Crawley, 2000), community structure (Howe and
Brown, 1999), and species diversity (Hubbell 1980). In long-term studies of the
population dynamics of tropical trees, Silman et al. (2003) and Wyatt and Silman (2004)
found that population fluctuations in a major seed predator (white-lipped peccary)
controlled recruitment of the two dominant tropical tree species (Astrocaryum murumuru
and Iriartea deltoidea) in Western Amazonia. Rodents as seed predators have been
shown to have considerable impact on plant populations (Price and Jenkins, 1986), and

2
this can occur in manifold ways, such as controlling the desert grassland transition
(Brown and Heske, 1990), affecting the landscape level abundance of early successional
species (Orrock et al., 2006), and reducing seed recruitment in tropical canopy trees (De
Steven and Putz, 1984; Schupp, 1990). Seed addition experiments suggest that seed
limitation is important in many different terrestrial habitats (Silman, 1996; Svenning and
Wright, 2005; but see Hulme, 1998; Crawley, 2000) and when seeds have been protected
from herbivores, all protected seeds have ultimately germinated (Wenny, 2000). Changes
in seed predation have also been shown to interact with other species interactions to
radically alter distance- and frequency-dependent recruitment in tropical trees, a central
mechanism maintaining diversity in tropical forests (Janzen, 1970; Connell, 1978; Wright
and Duber, 2001; Wyatt and Silman, 2004).
Differential Seed Predation on Plant Species
Differential seed predation on plant species is reported in many studies (e.g.
Wilson and Whelan, 1990; Terborgh et al., 1993; Holl and Lulow, 1997; Blate et al.,
1998; Notman and Gorchov, 2001; Xiao et al., 2006), and the relative effects on species
can vary widely. In a study of grassland plants the seed predation of different species
ranged from 20 to 95% though there was no difference in the percentage of times species
were encountered by seed predators (Hulme, 1994). In the Chilean Andes seed removal
ranged from 3 % to 78 % across nine species of herbs and shrubs (Muñoz and Cavieres,
2006). The effect of seed predation on the population dynamics of species can also vary.
Seed predation significantly reduced seedling populations of two of five Papua New
Guinean tree species (Cerbera floribunda K. Schum. and Microcos grandiflora Burret)

3
while the seedling populations of the other three species were only minimally affected
(Jones et al., 2008).
Multiple suggestions for species differences in predation risk have been proposed.
Seed size can have multiple effects, from changing the suite of predators to which a
species is exposed, to nutritional return on search and handling time (Louda, 1989; Blate
et al., 1998). Seed size may also affect predation risk indirectly through differences in
germination rate, which in turn affects the period of time a seed is at risk of predation
(Silman 1996, Baraloto and Forget, 2007). Size-independent effects that affect predation
risk include variability in secondary chemistry (Janzen, 1969), caloric content (Kear,
1962), nutritional content (Kelrick et al., 1985), and seed density (Nilsson and Wästljung,
1987). Hulme (1993) relates predator preference to seed size and shape, nutritional
content, and toxicity. These seed traits may only affect predation rates in specific
situations as studies have found no preference by rodents for energetic content of seeds
(Kerley and Erasmus, 1991) or no relationship between seed mass and predation risk
(Moles et al., 2003).
Biotic Interactions along Gradients
Ecology was founded on the study of species distributions along environmental
gradients in response to abiotic factors (e.g. Cowles, 1899; Clements, 1916; Gleason,
1926; Whittaker, 1956), and that tradition continues today in bioclimatic niche modeling
(see Elith et al., 2006 for a thorough review). However, biotic interactions that have
quantifiable impacts on plant populations can also change over environmental gradients.
In populations of a temperate shrub (Haplopappus squarrosus H. and A.), seed predation
varies along an elevation gradient, seedling recruitment is proportional to the number of

4
seeds surviving predation, and juvenile recruitment is proportional to the number of
seedlings established (Louda, 1982). For example, the allocation of resources to growth
by cacti influences the fecundity of the cacti’s insect herbivores across time and space
(Miller et al., 2006). Decreasing ant abundance at increasing elevations decreases seed
dispersal of the common understory herbs Trillium and Hexastylis in temperate forests
(Zelikova et al., 2008). The abundance of and the damage caused by cactus eating insects
decreases with elevation (Miller et al., 2009). In alpine grasslands, seed predation is
higher at 2700 m than 2000 m due to the increased activity of ants and birds at the higher
elevation (Muñoz and Arroyo, 2002). In shrub lands seed predation was lowest at mid
elevations where vegetation provides more safe sites for seeds than the types of
vegetation at high and low elevations (Rey, 2002). All of these factors may affect plant
distributions in ways that greatly modify the relationship between plant distributions and
the abiotic environment.
Predicting Extinctions Due to Climate Change
Changes in species distributions along environmental gradients of temperature
and moisture form the foundation for predictions of species responses to global climate
change (Malcom et al., 2002; Thomas et al., 2004). In humid tropical systems, species
extinctions are tied to species abilities to migrate to higher elevations rather than
latitudinally, as in temperate systems (Colwell et al., 2008). Recent studies from Earth’s
highest biodiversity hotspot, the tropical Andes, predict a 4°C warming (Cramer et al.,
2004). Given the adiabatic lapse rate of 5.5 °C km-1, temperature changes of this

5
magnitude require that species must migrate upslope ~700-800 m by 2100 to remain in
equilibrium with climate, with recent studies predicting that migration rates less than
equilibrium lead to large-scale extinctions (Silman, 2007; Feely and Silman, in press).
This thesis presents a comparative seed predation study of 24 species of tropical
trees across a 2.5 km elevation gradient in the Peruvian Andes, representing ~14°C of
temperature change, to ask (1) does overall seed predation vary across the elevation
gradient? (2) do predation rates vary among species? If so, are predation rates
predictable from species traits such as seed size or current elevational range? And (3),
what may be the underlying cause of variation in seed predation rates in terms of
ecosystem productivity and associated animal communities?
METHODS
Study Site
The study was performed in the Kosñipata Valley on the southeastern flank of the
Peruvian Andes (13° 06’ S, 71° 36’ E; see www.andesconservation.org for more
information on the field site). In 2003 a network of 14 1 ha permanent plots was
established along an elevation gradient in primary montane forest from 800 m to 3450 m.
Eleven of the permanent plots were used in this study (Fig. 1a), nine of which also fall
within the boundaries of Manu National Park. Climate along the gradient is wet, with
annual precipitation ranging from 8 m in the lowlands to 2.4 m in the highlands, and
mean annual temperatures ranging from 23 – 8.5°C with increasing elevation. All trees
≥ 10 cm dbh (diameter at breast height [1.33 meters]) have been tagged and identified to

6
species. The majority of seed predators are thought to be rodents, but birds and insects,
particularly ants, consume seeds as well. Data for mammal communities in the area come
from Solari et al. (2006), birds from long-term and extensive surveys by multiple
investigators started in the 1970s (Terborgh et al., 1984; Walker et al., 2006) and ant data
from Webb (2008).
Study Species
The twenty-three native tree species used in this study (Table 1) were chosen to
represent a range of seed sizes and elevational ranges (species that grow in low, mid, and
high elevations). A tropical grass, Zea mays L., is considered to be edible by a broad
variety of rodents and was used as a control along the gradient. Seeds were collected in
July 2008 by searching the permanent plots and the forests at Wayqecha Cloud Forest
Research Center (~3000 m) and Pantiacolla Lodge (400 m). Seeds were gathered from
ripe fruits in the canopy or from beneath parent trees. Voucher samples were collected
from parent trees to confirm identification of species used. Only mature seeds with no
visible signs of damage were used in experiments, and all fleshy pulp was removed from
seeds manually. For species in the Arecaceae seeds include the stony endocarp that
surrounds the endosperm, whereas the entire fruit (pericarp) has been removed from the
seeds of the other species. Elevational ranges of genera and species were derived from
plot records (ABERG, 2009). Ranges were determined by taking the elevational midpoint
of each genus or species, accounting for the abundance of each genera/species at each
elevation (Feeley and Silman, in press).

7
Seed Predation Experiments
Experimental sites were established in August and September 2008 at eleven 1 ha
plots (Fig. 1a). Seed sites were located adjacent to previously installed fruit and seed
traps, with 25 seed sites stratified across each 1 ha plot (Fig. 1b). For three species, I.
deltoidea, Dictyocarium lamarkianum, and Z. mays, there were sufficient seeds to place
three seeds at each site, which was done to increase sample size. A single seed of the
remaining 21 species was used so that there were thirty seeds placed at each site. Seeds
were placed in a 5 x 6 array with 10 cm separating each seed (Fig. 1c). All seeds were
surrounded by an 8 cm high mesh screen inserted 3 cm into the dirt. The screen was to
delineate an area in which to search for seeds during recensuses and to prevent them from
washing away in high rainfall and was not adequate to exclude potential seed predators.
A total of 8,250 seeds were placed: 750 at each elevation, 275 of each species (825 of I.
deltoidea, D. lamarkianum, and Z. mays) and 25 seeds of each species at each elevation
(75 of I. deltoidea, D. lamarkianum, and Z. mays).
Predation experiments were recensused approximately 1, 4, and 10 weeks from
the date of installation (exact dates are listed in Table 3). Seeds were marked as absent if
they could not be located within the bounds of the mesh fence. Seeds that remained were
recorded as being intact, bitten, moldy, with larva, or germinating.
Ecosystem Productivity Data
Data on seed rain and woody biomass increment were used as indirect proxies for
productivity in order to examine the relationship between ecosystem productivity and
seed predation rates across the gradient. Data from one year of bi-weekly collections of

8
seeds and fruits from the 275 traps across the gradient were used for information on the
total biomass of seeds produced (M. N. Raurau, n.d.). Volume was calculated for each
seed by modeling it as an ellipsoid [(4/3)πlw2, where l is the measurement of the longest
dimension of the seed, and w is the measurement of the shortest dimension]. Annual seed
rain measurements include all seeds collected in litter traps from February to December
2007. Seasonal seed rain is the portion of seeds collected from August to November, the
months in which seed predation experiments were installed and censused. Annual woody
increment data were collected from dendrometers measurements of ~300 randomly
chosen trees ≥ 10cm dbh in 1 ha tree plots at each elevation (ABERG, 2009).
Analysis
All analyses use seed mortality totals from the third census at 10 weeks. Seed
mortality includes seeds that were bitten and absent seeds. The assumption was made
that seed removal equaled predation. Vander Wall et al. (2005) outline the objections to
this assumption, with the main objection being that seed removal may be functioning as
secondary dispersal, not predation, as removed seeds are sometimes cached and remain
viable. However, a literature review shows that <10% of all seeds removed are
secondarily dispersed, and that within these, survival and germination from cached seeds
is low (as seed predators return to eat the cached seeds) for both temperate and tropical
species: Quercus spp., 1.5-2.5% (Jensen and Nielsen, 1986); Fagus grandifolia, 0-4%
(Jensen, 1982); Gustavia superba, 0.75-10% (Forget 1992); Dipteryx panamensis, 0-2%
(Forget, 1993). Additionally, the mortality of seedlings germinating from cached seeds is
high (Forget, 1993; Vander Wall, 1994). Finally, if seed removal is an overestimate of

9
actual seed predation, this overestimation is made across all elevations.
Predation risk was modeled using failure-time analysis. Proportional hazards
failure time models are used when treatments are thought to increase the risk during times
of hazard, but not the timing of the hazard itself (Fox, 2001). A Cox proportional hazard
regression (Cox, 1972) was run using JMP v. 3.2.2 (SAS Institute Inc., Cary, NC, 1989-
2007). In a proportional hazards model, negative coefficients represent a decrease in the
hazard, thereby increasing the time to failure. Locally weighted scatter plot smoothing
(LOESS), a non parametric regression technique was used to fit lines through mortality
data. This method estimates the response of points individually, giving more weight to
points near the point for which the response is being estimated. LOESS does not require
the specification of a function (like linear or logistic regression) to fit a model, so it is
useful for modeling processes for which there are no theoretical expectations (Cleveland
and Devlin, 1988).
Seed mass, annual seed rain volume, and seasonal seed rain volume were log
transformed and percent mortality was arcsine transformed to meet assumptions of
normality. Linear regression was used to determine the relationship between elevation
and annual seed rain volume, seasonal seed rain volume, and woody biomass increment.
Linear regression was also used to model the seed mortality of species as a function of
the elevational range of genera and the elevational range of species. Elevational ranges
of genera were used as the seeds of congeners may share traits that make species
indistinguishable to rodents. A generalized linear model with a quasi-binomial error
distribution (to accommodate overdispersion of the data) was used to model the
relationship between species level seed mortality and seed mass (Crawley, 2005).

10
Spearman rank correlations were used to compare mortality at each elevation with annual
seed rain volume, seasonal seed rain volume, and wood growth. All analyses were done
using R v. 2.6.2 (R Development Core Team, 2008).
RESULTS
Seed Predation
There was high variability in the average predation rate for each species, from as
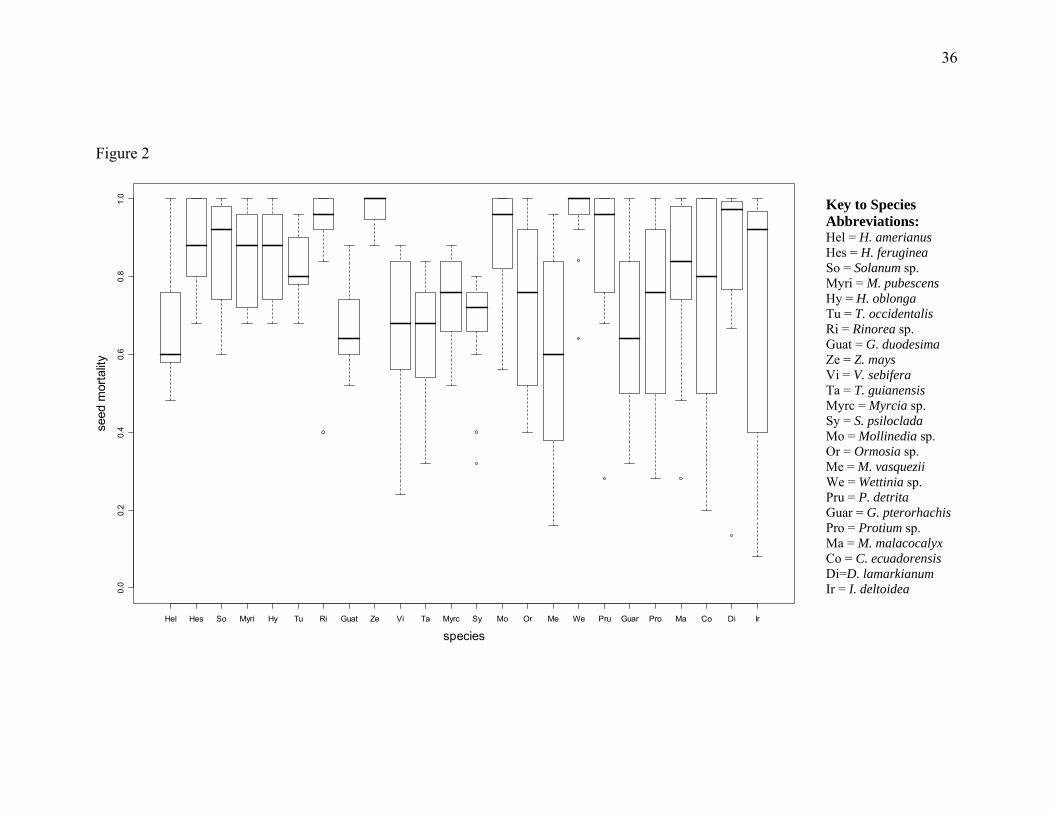
low as 59% in Meliosma vasquezii, to as high as 97% in Zea mays (Fig. 2; Species main
effect, p<0.001, Table 4). Mortality was not constant over elevation (Fig. 3; Elevation
main effect, p<0.001, Table 4). The survival of seeds (1 – mortality) increased 5.6x
between 2250m and 3450 m, (Pr(survive) 0.10 to 0.56; Fig. 3).
For all species, seed mortality was not constant over the elevation gradient, and
there was high variability in the pattern of predation on each species over the gradient
(Fig. 4; Species by Elevation interaction, p<0.001, Table 4). The five smallest seeds
(mass of 5 – 20 mg): Heliocarpus americanus, Hesperomeles ferruginea, Solanum sp.,
Myrica pubescens, and Hyeronima oblonga, have 100% mortality at 1000 m and then
gradually decline to 60 – 80% mortality over the gradient (Fig. 4). Many of the other
species, namely Tapirira guianensis, Myrcia sp., Mollinedia sp., Prunus detrita, Protium
sp., Matisia malacocalyx, Coussarea ecuadorensis, D. lamarckianum, and I. deltoidea,
closely follow the elevational trend seen for all species combined. Ormosia sp. and M.
vasquezii also appear to follow the overall trend despite high plot to plot variation (Fig. 4).
Zea mays was the only species to exhibit near constant, high mortality at all elevations.

11
Predictors of Seed Predation
Neither seed mass, elevational range, nor seasonal or annual measures of seed and
ecosystem productivity were significant predictors of seed predation rates. Seed
mortality exhibited no relationship with seed mass (linear regression, p=0.46, Table 5;
Fig. 5). There was no relationship between the elevational midpoint at the genus (linear
regressions, Table 6; Fig. 6) or species level (linear regressions, Table 7; Fig. 7). Woody
biomass production and annual seed production both decreased significantly with
elevation (linear regressions; wood growth: p=0.001, Table 8, Fig. 9; seed volume:
p=0.03, Table 8, Fig. 8a), though the trend in seasonal seed rain volume did not (p=0.12;
Table 8; Fig. 8b). However, neither wood growth (Spearman’s rho, ρ = 0.2909; p=0.52),
annual seed rain volume (Spearman’s rho, ρ = 0.1091; p=0.74), or seasonal seed rain
volume (Spearman’s rho, ρ = -0.2182; p=0.38) are correlated with seed mortality at each
elevation.
DISCUSSION
This study assessed seed predation rates across an elevation gradient running from
the Amazonian lowlands to Andean tree line using 24 species with elevation ranges
varying over 3 km and seeds ranging in size over four orders of magnitude. The study
found a large and significant effect of elevation on overall predation rate, large and
significant differences among species, and clear differences in the way that predation
rates varied among species across the elevation gradient. Across the elevation gradient
large and small-seeded species responded differently to changes in ecosystem

12
productivity and the associated seed predator community. The conclusions of this study
highlight the importance of taking gradients of biotic interactions into account when
considering species distributions.
Species Differences
Seed predation rates varied markedly among species, as demonstrated frequently
in the past (e.g. Wilson and Whelan, 1990; Holl and Lulow, 1997; Blate et al., 1998;
Notman and Gorchov, 2001; Xiao et al., 2006). Species also differed in their response to
elevation (Fig. 4), demonstrating that the interaction between species and seed predators
is changing with elevation, and in response to factors that vary among species. One
species trait measured in this study was seed mass, which was not a significant predictor
of seed mortality; large seeds were not eaten more frequently than small seeds (Fig 5).
Results from seed predation studies are equivocal in the importance of seed size on
predation, with it found to be a significant predictor of seed predation risk in some studies
(e.g. Louda, 1989; Hulme, 1993; Silman, 1996; Blate et al., 1998), and not in others (e.g.
Holl and Lulow, 1997; Meiners and Stiles, 1997; Moles et al., 2003). Given the broad
range of seed sizes used in this study, finding no effect of seed size on predation risk
without considering elevation is likely due to the fact that while a single type of predator
may prefer a particular seed size (Mendoza and Dirzo, 2007), the combined community
of predators may have no preference, such as when rodents prefer to eat larger seeds and
ants prefer to eat smaller seeds (Mittelbach and Gross, 1984). This result signifies that
the community of seed predators in the Kosñipata Valley is sufficiently broad to handle
seeds of all sizes.

13
Species-Elevation Interactions
Although there was no relationship between seed size and predation risk when
elevations were aggregated, seed size did lead to important differences in how seed
predation risk changes with elevation in different species. Small seeded species and
large-seeded species show different patterns in the relationship between seed predation
risk and elevation. The pattern exhibited by the five smallest seeds is markedly different
from that of other species (Fig 4). The mortality of these species at the lowest elevations
is higher than the mortality of large-seeded species, probably because seeds of all sizes
faced predation from rodents, but only small seeds faced additional predation from ants
(Mittelbach and Gross, 1984). Ants are established predators on seeds small enough for
them to handle (Davidson, 1977; Levey and Byrne, 1993) and can negatively impact
plant recruitment (Feldmann et al., 2000). The increased predation from ants would
gradually diminish along the elevation gradient as ant abundance also decreases with
elevation (Webb, 2008).
The seed predation risk of most other large-seeded species peaks at mid elevations
(~2250 m) and then gradually decreases (Fig. 4). This pattern, the same pattern seen
across the elevation gradient when species are aggregated (Fig. 3), appears to be driven
by elevational variation in seed predator abundance. Seed predation can vary directly
with seed predator populations; abundant seed predators eat more seeds (Schnurr et al.,
2002). Previous studies that have shown decreased effects of herbivores on plant
populations over elevation have attributed this decrease to a reduction in herbivore
abundance (Zelikova et al., 2008 and Miller et al., 2009). Seed predator abundance is set
both from the “top” by predators, and from the “bottom” by resource productivity. Top-

14
down forces can have important effects in tropical forests (e.g. Terborgh et al., 2006), but
it has also been hypothesized that the strength of top down regulation in a system
decreases when productivity decreases (Oksanen et al., 1981; Polis, 1999). Several
studies have supported this hypothesis in tropical terrestrial ecosystems (Loiselle and
Faji-Brener, 2002; Richards and Coley, 2007). In a system regulated by bottom up forces,
as productivity decreases, so do seed predator populations, thereby decreasing herbivory.
Two measures of productivity available for the Kosñipata Valley, wood growth and seed
rain volume, decrease with elevation. It is likely then that at high elevations reduced
productivity is limiting seed predator populations and thereby limiting seed predation
(although there is no direct correlation with seed mortality and productivity at the plot
level).
While the decreasing trend in seed mortality from mid to high elevations is
evident; less clear is what is happening at elevations 1000 m and lower. Total seed
mortality was lower at 1000 m than at elevations from 1500 to 2500 m (Fig. 3), a decline
that may be plot to plot variation or the beginning of a decreasing trend in seed predation,
giving seed mortality a unimodal response to elevation. The same balance of top down
and bottom up control of seed predator communities used to explain the high elevation
decrease also explains the low elevation decrease. Lowland forests are controlled by top
down forces, so that seed predator populations, and thereby seed predation, are reduced
by carnivores (Silman et al., 2003; Terborgh et al., 2008). Low elevations have the
productivity to support high populations of seed predators, but seed predators are held
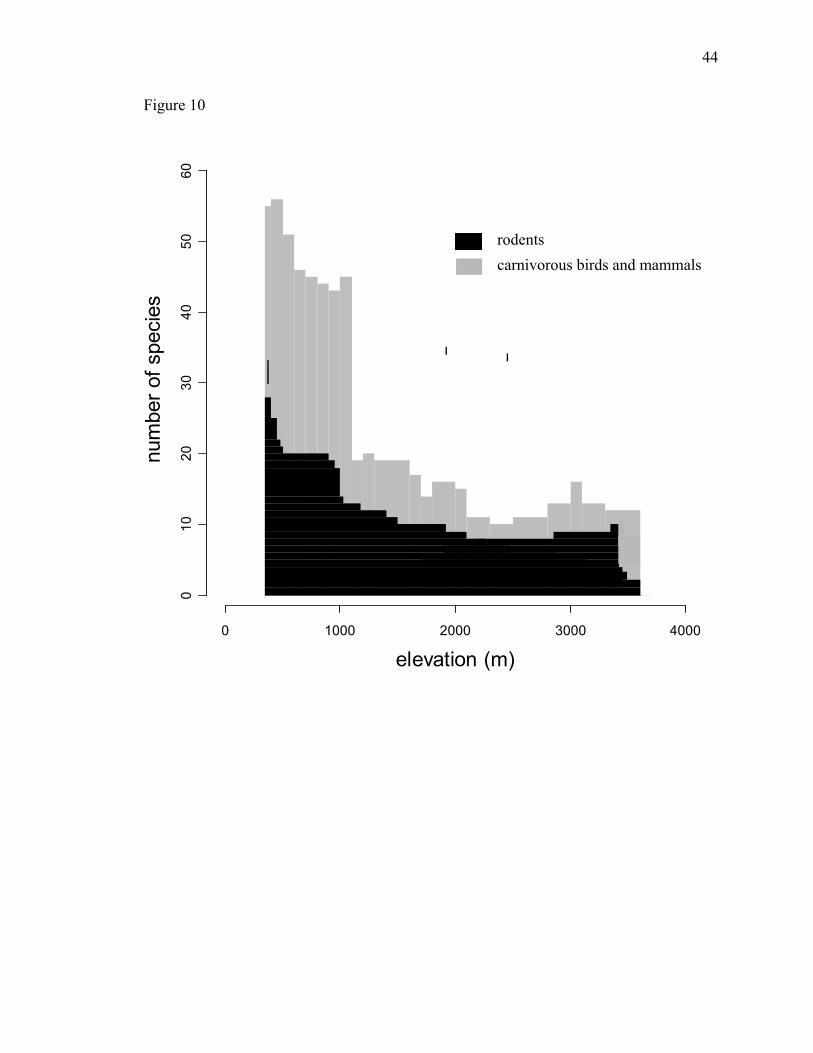
below carrying capacity by top down forces. Carnivore populations decrease with
elevation (Fig. 10), releasing pressure on seed predators. Released from carnivore

15
pressure, seed predator populations reach carrying capacity which is eventually reduced
at high elevations by limited productivity.
Alternative Hypotheses for Seed Predation Patterns
There is a strong case for changes in seed predator abundance driving seed
predation patterns, but there are several alternative hypotheses that should be considered.
Predator satiation hypotheses predict that seed survival will be higher during times of
seed abundance (Janzen, 1969; Schupp, 1990). Predator satiation can operate on a
specific and a community level, where the total presence of seeds an in area affects the
predation of a single species (Janzen, 1971). In this study, predator satiation, at least at
the community level, is an unlikely explanation for patterns as annual seed volume
decreased with elevation (where predation was also lower) and there was no relationship
with seasonal seed volume.
Other seed traits (not quantified in this study), such as secondary chemistry
(Janzen, 1969), caloric content (Kear, 1962), and nutritional content (Kelrick et al., 1985),
might cause differential seed predation among species, but would not be expected to
influence elevational patterns of predation risk, unless also considered in conjunction
with seed predator and carnivore abundance. Of the three of the genera represented in this
study with documented toxins in their seeds [quinolizidine alkaloids in Ormosia spp.
(Kinghorn et al., 1988), glycoalkaloids in Solanum spp. (Cipollini and Levy, 1997), and
cyanogenic glycosides in Prunus spp. (Frohne and Pfänder, 2005)], none had lower than
average mortality.

16
Finally, the novelty of seed predators/species interactions could influence
predation patterns along the gradient. In this study, high elevation species were moved
down range and low elevation species were moved up, so that all species were exposed to
predation in both novel and familiar territories. Two scenarios from the plant invasion
literature can be applied to this situation: the natural enemies hypothesis and the biotic
resistance hypothesis (Maron and Vilà, 2001). The natural enemies hypothesis suggests
that exotic species invade new areas easily because they are freed from the co-evolved
predators and herbivores in their native habitat (Elton, 2000). The biotic resistance
hypothesis suggests the opposite, that exotics fail to invade new areas because they are
strongly hindered by interactions with native species (Elton, 2000). Migrating species,
while not the foreign invaders typically considered in these hypotheses, are species trying
to establish under a novel suite of biotic interactions. If migrating species follow the
natural enemies hypothesis, low elevation species should experience lower predation at
high elevations. Under biotic resistance, predation on lowland species at high elevations
will equal or be greater than the predation on highland species. However, at none of the
elevations in this study was there a significant relationship between seed mortality and
the elevation midpoint, so neither the natural enemies or biotic resistance hypothesis
appear to be relevant to the patterns shown in this study. Variation in seed predator
abundance is the most likely driver of the significant variation in seed predation risk seen
in this study.
The Importance of Gradients of Biotic Interactions
Abiotic factors such as temperature and precipitation are typical elements of

17
bioclimatic models of species range predictions (Bakkenes et al., 2002; Thomas et al.,
2004). As shown in this study and others, there are also gradients of biotic interactions
which are less frequently taken into account when predicting species ranges (Davis et al.,
1998). Furthermore, the gradient in seed mortality translates into a large change in
effective fecundity for trees at high elevations. Trees growing at 3450 m can produce the
same number of seeds as their lower elevational counterparts, yet could potentially have
five times as many seeds available for establishment. Fecundity rates are essential
parameters in models predicting plant species migration rates (Pakeman, 2001; Higgins et
al., 2003) as migrating species are essentially dispersing into an empty landscape, where
there are no adults to supplement seed availability. For example, pines compete well in
post-fire landscapes in part because of their high fecundity rates (Richardson and Higgins,
1998). What remains to be answered is what impact this large change in fecundity has on
tree demography (sensu Yamada et al., 2007; Brodie et al., 2009).

18
LITERATURE CITED ABERG. 2009. Permanent tree plot network. www.andesconservation.org Baraloto, C. and P. M. Forget. 2007. Seed size, seedling morphology, and response to
deep shade and damage in neotropical rain forest trees. American Journal of Botany 94:901-911.
Bakkenes, M., J. R. M. Alkemade, F. Ihle, R. Leemans, and J. B. Latour. 2002. Assessing
effects of forecasted climate change on the diversity and distribution of European higher plants for 2050. Global Change Biology 8:390-407.
Blate, G. M., D. R. Peart, and M. Leighton. 1998. Post-dispersal predation on isolated
seeds: a comparative study of 40 tree species in a southeast Asian rainforest. Oikos 82:522-538.
Brodie, J. F., O. E. Helmy, W. Y. Brockelman and J. L. Maron. 2009. Functional
differences within a guild of tropical mammalian frugivores. Ecology 90:688-698. Brown, J. H., and E. J. Heske. 1990. Control of a desert-grassland transition by a
keystone rodent guild. Science 250:1705-1707. Cipollini, M. L. and D. J. Levey. 1997. Antifungal activity of Solanum fruit
glycoalkaloids: implications for frugivory and seed dispersal. Ecology 78:799-809. Clements, F. E. 1916. Plant succession: an analysis of the development of vegetation.
Carnegie Institute of Washington, Washington. Cleveland, W. S. and S. J. Devlin. 1988. Locally-weighted regression: an approach to
regression analysis by local fitting. Journal of the American Statistical Association 83:596-610.
Colwell, R. K., G. Brehm, C. L. Cardelús, A. C. Gilman, and J. T. Longino. 2008. Global
warming, elevation range shifts, and lowland biotic attrition in the wet tropics. Science 322:258-261.
Connell, J. H. 1978. Diversity in tropical rain forests and coral reefs. Science 199:1302-
1310. Cowles, H. C. 1899. The ecological relations of the vegetation on the sand dunes of Lake
Michigan. The Botanical Gazette 27:95-117. Cox, D. R. 1972. Regression models and life tables. Journal of the Royal Statistical
Society Series B (Methodological) 34:187-220.

19
Cramer, W., A. Bondeau, S. Schaphoff, W. Lucht, B. Smith, and S. Sitch. 2004. Tropical forests and the global carbon cycle: impacts of atmospheric carbon dioxide, climate change and rate of deforestation. Philosophical Transactions of the Royal Society London B 359:331-343.
Crawley, M. J. 2000. Seed predators and plant population dynamics. Pages 157-191 in M.
Fenner, editor. Seeds: the ecology o f regeneration in plant communities. CAB International, Wallingford, UK.
Crawley, M. J. 2005. Statistics: An introduction using R. Wiley, Chichester, UK. Davidson, D. W. 1977. Foraging ecology and community organization in desert seed
eating ants. Ecology 58: 725-737. Davis, A. J., L. S. Jenkinson, J. H. Lawton, B. Shorrocks, and S. Wood. 1998. Making
mistakes when predicting shifts in species range in reponse to global warming. Nature 391:783-786.
De Steven, D., and F. E. Putz. 1984. Impact of mammals on early recruitment of a
tropical canopy tree, Dipteryx panamensis, in Panama. Oikos 43:207-216.
Elith, J., C. H. Graham, R. P. Anderson, M. Dudík, S. Ferrier, A, Guisan, R. J. Hijmans, F. Huettmann, J. R. Leathwick, A. Lehmann, J. Li, L. G. Lohmann, B. A. Loiselle, G. Manion, C. Moritz, M. Nakamura, Y. Nakazawa, J. McC. Overton, A. T. Peterson, S. J. Phillips, K. Richardson, R. Scachetti-Pereira, R. E. Schapire, J. Soberón, S. Williams, M. S. Wisz and N. E. Zimmermann. 2006. Novel methods improve prediction of species’ distributions from occurrence data. Ecography 29:129-151.
Elton, C. S. 2000. The ecology of invasions by plants and animals. The University of
Chicago Press, Chicago. Feeley, K.J. and Silman, M.R. Extinction rates of Amazonian plant species. Proceedings
of the National Academy of Sciences USA. In press. Feldmann, M., M. Verhaagh, and E. W. Heymann. 2000. Sericomyrmex ants as seed
predators. Ecotropica 6:207-209. Forget, P. M. 1992. Seed removal and seed fate in Gustava suberba (Lecythidaceae).
Biotropica 24:408-414. Forget, P. M. 1993. Post-dispersal predation and scatterhoarding of Dipteryx panamensis
(Papilionaceae) seeds by rodents in Panama. Oecologia 94:255-261.

20
Fox, G. A., 2001. Failure-time analysis: Studying times to events and rates at which events occur. Pages 235-266 in S. M. Scheiner and J. Gurevitch, editors. Design and Analysis of Ecological Experiments. Oxford University Press, New York.
Frohne, D. and H. J. Pfänder, 2005. Poisonous plants: A handbook for doctors,
pharmacists, toxicologists, biologists and veterinarians, 2nd edition. Timber Press, Oregon.
Gleason, H. A. 1926. The individualistic concept of the plant association. Bulletin of the
Torrey Botanical Club 53:7-26. Harper, J. L. 1977. The population biology of plants. Academic Press, New York. Higgins, S. I., S. Lavorel, and E. Revilla. 2003. Estimating plant migration rates under
habitat loss and fragmentation. Oikos 101:354-366. Holl, K. D. and M. E. Lulow. 1997. Effects of species, habitat, and distance from the
edge on post-dispersal seed predation in a tropical rainforest. Biotropica 29:459-468.
Howe, H. F. and J. S. Browne. 1999. Effects of birds and rodents on synthetic tall-grass
communities. Ecology 80:1776-1781. Hubbell, S. P. 1980. Seed predation and the coexistence of tree species in tropical forests.
Oikos 35:214-229. Hulme, P. E. 1993. Post-dispersal seed predation by small mammals. Symposium of the
Zoological Society of London. 65:269-287. Hulme, P. E. 1994. Post-dispersal seed predation in grassland: Its magnitude and sources
of variation. Journal of Ecology 82:645-652. Hulme, P. E. 1998. Post-dispersal seed predation: consequences for plant demography
and evolution. Perspectives in Plant Ecology, Evolution and Systematics 1:32-46 Ibáñez, I., J. S. Clark, and M. C. Dietze. 2008. Evaluating the sources of potential
migrant species: implications under climate change. Ecological Applications 18:1664-1678.
Janzen, D .H. 1969. Seed-eaters versus seed size, number, toxicity and dispersal.
Evolution 23:1-27 Janzen, D. H. 1970. Herbivores and the number of tree species in tropical forests.
American Naturalist 104:501-528.

21
Janzen, D. H. 1971. Seed predation by animals. Annual Reviews of Ecology and Systematics 2:465-492.
Jensen, T. S. 1982. Seed production and outbreaks of non cyclic rodent populations in
deciduous forests. Oecologia 54:184-192. Jensen, T. S. and O. F. Nielsen. 1986. Rodents as seed dispersers in a heath-oak wood
succession. Oecologia 70:214-221. Jones, E. R., L. M. Curran, D. D. Wright, and A. L. Mack. 2008. Differential effects of
mammalian seed predators on the regeneration of five Papua New Guinean tree species and implications for sapling recruitment. Journal of Tropical Ecology 24:259-267.
Kear, J. 1962. Food selection in finches with special reference to inter-specific
differences. Proceedings of the Zoological Society, London. 138:163-204. Kelrick, M. I., J. A. MacMahon, R. R. Parmenter, and D. V. Sisson. 1985. Native seed
preferences of shrub-steppe rodents, birds and ants: the relationship of seed attributes and seed use. Oecologia 68:327-337.
Kerley, G. I. H. and T. Erasmus. 1991. What do mice select for in seeds? Oecologia
86:261-267. Kinghorn, D. A., R. A. Hussain, E. F. Robbins, M. F. Balandrin, C. H. Stirton, and S. V.
Evans. 1988. Alkaloid distribution in seeds of Ormosia, Pericopsis and Haplormosia. Phytochemistry 27:439-444.
Leathwick, J. R. and M. P. Austin. 2001. Competitive interactions between tree species in
New Zealand’s old growth indigenous forests. Ecology. 82:2560-2573. Levey D. J. and M. M. Byrne. 1993. Complex ant-plant interactions: Rain forest ants as
secondary dispersers and post-dispersal seed predators. Ecology 74:1802-1812. Loiselle, B. A. and A. G. Fargi-Brener. 2002. What’s up? An experimental comparison of
predation levels between canopy and understory in a tropical wet forest. Biotropica 34:327-330.
Louda, S. M. 1982. Distribution ecology: Variation in plant recruitment over a gradient in relation to insect seed predation. Ecological Monographs 52:25-41.
Louda, S. M. 1989. Predation in the dynamics of seed regeneration. Pages 25-49 in M. A.
Leck, V. T. Parker, and R. L. Simpson, editors. Ecology of Soil Seed Banks. Academic Press, California.

22
Malcom, J. R., A. Markham, R. P. Neilson, and M. Garaci. 2002. Estimated migration rates under scenarios of global climate change. Journal of Biogeography 29:835-849.
Maron J. L. and M. Vilà. 2001. When do herbivores affect plant invasion? Evidence for
the natural enemies and biotic resistance hypotheses. Oikos 95:361-373. Meiners, S. J. and E. W. Stiles, 1997. Selective predation on the seeds of woody plants.
Journal of the Torrey Botanical Society 124:67-70. Mendoza, E., and R. Dirzo. 2007. Seed-size variation determines interspecific differential
predation by mammals in a neotropcal rain forest. Oikos 116:1841-1852. Miller, T. E. X., S. M. Louda, and K. A. Rose. 2009. Impacts of insect herbivory on
cactus population dynamics: experimental demography across an environmental gradient. Ecological Monographs 79:155-172.
Miller, T. E. X., A. J. Tyre, and S. M. Louda. 2006. Plant reproductive allocation predicts
herbivore dynamics across spatial and temporal scales. American Naturalist 168:608-616.
Mittelbach, G. G. and K. L. Gross. 1984. Experimental studies of seed predation in old-
fields. Oecologia 65:7-13. Moles, A. T., D. I. Warton, and M. Westoby. 2003. So small-seeded species have higher
survival through seed predation than large-seeded species? Ecology 84:3148-3161. Muñoz, A. A. and M. T. K. Arroyo. 2002. Post-dispersal seed predation on Sisyrinchium
arenarium (Iridaceae) at two elevations in the central Chilean Andes. Arctic, Antarctic, and Alpine Research 34:178-184.
Muñoz, A. A. and L. A. Cavieres. 2006. A multi-species assessment of post-dispersal
seed predation in the central Chilean Andes. Annals of Botany 98:193-201. Nilsson, S. G. and U. Wästljung. 1987. Seed predation and cross-pollination in mast
seeding Beech (Fagus sylvatica). Ecology 68:260-265. Notman, E. and D. L. Gorchov. 2001. Variation in post-dispersal seed predation in
mature Peruvian lowland tropical forest and fallow agricultural sites. Biotropica 33:621-636.
Oksanen, L., S. D. Fretwell, J. Arruda, and P. Niemela. 1981. Exploitation ecosystems in
gradients of primary productivity. American Naturalist 118:240-261.

23
Orrock, J. L., D. J. Levey, B. J. Danielson, and E. I. Damschen. 2006. Seed predation, not seed dispersal, explains the landscape-level abundance of an early-successional plant. Journal of Ecology 94:838-845.
Pakeman, R. J. 2001. Plant migration rates and seed dispersal mechanisms. Journal of
Biogeography 28:795-800. Polis, G. A. 1999. Why are parts of the world green? Multiple factors control productivity
and distribution of biomass. Oikos 86:3-15. Price, M. V. and S. H. Jenkins. 1986. Rodents as seed consumers and dispersers. Pages
191-235 in D. R. Murray, editor. Seed Dispersal. Academic Press, Sydney. R Development Core Team. 2008. R: A language and environment for statistical
computing. R Foundation for Statistical Computing, Vienna, Austria. ISBN 3-900051-07-0, URL http://www.R-project.org.
Rey, P. J., J. L. Garrido, J. M. Alcantara, J. M. Ramirez, A. Aguilera, L. Garcia, A. J.
Manzaneda, and R. Fernandez. 2002. Spatial variation in ant and rodent post-dispersal predation of vertebrate-dispersed seeds. Functional Ecology 16:773-781.
Richards, L. A. and P. D. Coley. 2007. Seasonal and habitat differences affect the impact
of food and predation on herbivores: a comparison between gaps and understory of a tropical forest. Oikos 116:31-40.
Richardson, D. M., and S. I. Higgins. 1998. Pines as invaders in the Southern Hemisphere.
Pages 450–473 in D. M. Richardson, editor. Ecology and biogeography of Pinus. Cambridge University Press, Cambridge.
Schnurr, J. L., R. S. Ostfeld, C. D. Canham. 2002. Direct and indirect effects of masting on rodent populations and tree seed survival. Oikos 96:402-410.
Schupp, E. W. 1990. Annual variation in seedfall, post-dispersal predation, and
recruitment of a neotropical tree. Ecology 71:504-515. Silman, M. R. 1996. Regeneration from seed in a neotropical rain forest. Dissertation,
Duke University, Durham, North Carolina, USA. Silman, M. R., J. W. Terborgh, and R. A. Kiltie. 2003. Population regulation of a
dominant rain forest tree by a major seed predator. Ecology 84:431-438. Silman, M. R. 2007. Plant species diversity in Amazonia. Pages 269-288 in M. Bush and
J. Flenly, editors. Tropical rain forest responses to climate change. Praxis Publishing, Chichester, UK.

24
Solari, S., V. Pacheco, L. Luna, P. M. Velazco, and B. D. Patterson. 2006. Mammals of the Manu Biosphere Reserve. Pages 13–23 in B. D. Patterson, D. F. Stotz, and S. Solari, editors. Mammals and birds of the Manu Biosphere Reserve, Peru. Fieldiana: Zoology, n.s., No. 110.
Svenning, J. and S. J. Wright. 2005. Seed limitation in a Panamanian forest. Journal of
Ecology 93:853-862. Terborgh, J., J. W. Fitzpatrick, L. Emmons. 1984. Annotated checklist of bird and
mammal species of Cocha Cashu Biological Station, Manu National Park, Peru. Fieldiana Zoology, No 21.
Terborgh, J., K. Feeley, M. R. Silman, P. Núñez and V.B. Balukjian. 2006. Vegetation
dynamics of predator-free land-bridge islands. Journal of Ecology 94: 253-263. Terborgh, J., E. Losos, M. P. Riley, and M. Bolaños Riley. 1993. Predation by vertebrates
and invertebrates on the seeds of five Canopy tree species of an Amazonian forest. Plant Ecology, 107-108(1):375-386.
Terborgh, J., G. Nuñez-Iturri, N. C. A. Pitman, F. H. Cornejo Valverde, P. Alvarez, V.
Swamy, E. G. Pringle, C. E. T. Paine. 2008. Tree recruitment in an empty forest. Ecology 89:1757-1768.
Thomas, C. D., A. Cameron, R. E. Green, M. Bakkenes, L. J. Beaumont, Y. C.
Collingham, B. F. N. Erasmus, M. Ferreira de Siqueira, A. Grainger, L. Hannah, L. Hughes, B. Huntley, A. S. van Jaarsveld, G. F. Midgley, L. Miles, M. A. Ortega-Huerta, A. T. Peterson, O. L. Phillips, and S. E. Williams. 2004. Extinction risk from climate change. Nature 427:145-148.
Vander Wall, S. B. 1994. Seed fate pathways of antelope bitterbrush: dispersal be seed
caching yellow pine chipmunks. Ecology 75:1911-1926. Vander Wall, S. B. K. M. Kuhn, and M. J. Beck. 2005. Seed removal, seed predation, and
secondary dispersal. Ecology 86:801-806. Walker, B., D. F. Stotz, T. Pequeño, and J. W. Fitzpatrick. 2006. Birds of the Manu
Biosphere Reserve. Pages 23–49 in B. D. Patterson, D. F. Stotz, and S. Solari, editors. Mammals and birds of the Manu Biosphere Reserve, Peru. Fieldiana: Zoology, n.s., No. 110.
Webb, C. O. and D. R. Peart. 2001. High seed dispersal rates in faunally intact tropical
rain forest: theoretical and conservation implications. Ecology Letters 4:491-499. Webb, T. 2008. Ant diversity along an Andes-Amazon altitudinal gradient. Thesis. University of Oxford, Oxford, UK.

25
Weltzin, J. F., S. Archer, and R. K. Heitschmidt. 1997. Small mammal regulation of vegetation structure in a temperate savanna. Ecology 78:751-763.
Wenny, D. G. 2000. Seed dispersal, seed predation, and seedling recruitment of a
neotropcial montane tree. Ecological Monographs 70:331-351.
Whittaker R. H. 1956. Vegetation of the Great Smoky Mountains. Ecological Monographs 26:1-80.
Wilson, M.F. and Whelan, C. J. 1990. Variation in post-dispersal survival of vertebrate
dispersed seeds: effects of density, habitat, location, season, and species. Wright, S. J. and H. C. Duber. 2001. Poachers and forest fragmentation alter seed
dispersal, seed survival, and seedling recruitment in the palm Attalea butyraceae, with implications for tropical tree diversity. Biotropica 33:583-595.
Wyatt, J. L. and M. R. Silman. 2004. Distance-dependence in two Amazonian palms:
effects of spatial and temporal variation in seed predator communities. Oecologia 140:26-35.
Xiao, Z., Y. Wang, M. Harris, and Z. Zhang. 2006. Spatial and temporal variation of seed
predation and removal of sympatric large-seeded species in relation to innate seed traits in a subtropical forest, Southwest China. Forest Ecology and Management 222:46-54.
Yamada, T., P. A. Zuidema, A. Itoh, T. Yamakura, T. Ohkubo, M. Kanzaki, S. Tan, and
P. S. Ashton. 2007. Strong habitat preferences of a tropical rain forest tree does not imply large differences in population dynamics across habitats. Journal of Ecology 95:332-342.
Zelikova, T. J., R. R. Dunn, and N. J. Sanders. 2008. Variation in seed dispersal along an
elevational gradient in Great Smoky Mountains National Park. Acta Oecologica 32:155-162.

26
FIGURE CAPTIONS Figure 1. Experimental design: (a) 11 one hectare permanent plots along an altitudinal transect in the Kosñipata Valley, (b) 25 seed predation sites in each 1 hectare plot, and (c) 30 seeds at each site, 3 of I. deltoidea, D. lamarkianum, and Z. mays and 1 of all other species. Figure 2. The variability of seed predation within a species across the elevation gradient. The middle line represents the median value of seed mortality. Hinges are the 75th and 25th quartiles. Whiskers extend to the maximum and minimum values and outliers are represented by circles. Species are graphed in order of increasing seed mass. Figure 3. Seed predation across the elevational gradient. Seed mortality at each elevation is the aggregate seed mortality of all species. Points are fit with a nonparametric regression function using locally weighted scatter plot smoothing. Error bars are binomial confidence intervals. Nelevation=750. Figure 4. Individual species’ seed mortality over the elevational gradient, plots are ordered by seed mass from top right to bottom left. Nonparametric regressions were fit for each species using locally weighted scatter plot smoothing. Each point represents the number of seeds eaten out of 25 seeds (75 seeds, I. deltoidea, D. lamarkianum, and Z. mays) placed at each elevation. Error bars are binomial confidence intervals. Figure 5. The relationship between seed mortality and seed mass (g). Seed mortality of each species is the aggregate seed mortality of all elevations. The x axis uses a Log10 scale. Figure 6. Species seed mortality as a function of the elevational midpoint of genera (m) at each elevation. Points are the seed mortality of a species at the given elevation. Genera that do not occur in the plot network, Zea spp. and Rinorea spp., were not included in this analysis. Figure 7. Species seed mortality as a function of the elevational midpoint of species (m) at each elevation. Points are the seed mortality of a species at the given elevation. Species that did not occur in the plot network (Table 2) were not included in this analysis. Figure 8. Seed rain volume from litter traps as a function of elevation (m). (a) Seed rain from February to December (11 months). (b) Seed rain from August to November, the time during which seed predation experiments were installed and censused. Figure 9. Annual woody biomass increment (T/ha) as a function of elevation (m). Figure 10. Elevational ranges of rodents and carnivorous mammals and birds in Manu National Park. Derived from mammal census data by Solari et al. (2006) and bird census data from Terborgh (1982)

27
Table 1. Species used in seed predation experiments in order of decreasing seed mass. Volume (mm3) and mass (g) are mean measurements of 10 seeds ± standard deviation.
Species Family Order Mass (g) Volume (mm3)
Hesperomeles ferruginea Rosaceae Rosales 0.005 ± 0.002 92.0 ±19.6 Heliocarpus americanus Malvaceae Malvales 0.007 ± 0.003 77.4 ±19.7 Solanum sp. Solanaceae Solanales 0.010 ± 0.009 40.6 ±11.6 Myrica pubescens Myricaceae Fagales 0.013 ± 0.005 74.6 ±27.4 Hyeronima oblonga Euphorbiaceae Malpighiales 0.02 ± 0.01 165.7 ±13.0 Turpinia occidentalis Rosaceae Crossosomatales 0.04 ± 0.02 438.5 ±148.0 Rinorea sp. Violaceae Malpighiales 0.05 ± 0.02 803.1 ±113.3 Guatteria duodesima Annonaceae Magnoliales 0.12 ± 0.06 3920.8 ±813.5 Zea mays Poaceae Poales 0.17 ± 0.02 1305.6 ±256.3 Virola sebifera Fabaceae Magnoliales 0.23 ± 0.11 3947.6 ±430.3 Tapirira guianensis Anacardiaceae Sapinadales 0.29 ± 0.05 6529.7 ±1148.7 Myrcia sp. Myrtaceae Myrtales 0.30 ± 0.08 1829.9 ±473.3 Symplocos psiloclada Symplocaceae Ericales 0.33 ± 0.12 2721.8 ±1102.4 Mollinedia sp. Monimiaceae Laurales 0.35 ± 0.10 3489.5 ±693.2 Ormosia sp. Fabaceae Fabales 0.40 ± 0.06 3254.3 ±535.3 Meliosma vasquezii Sabiaceae Sabiales 0.46 ± 0.04 9343.2 ±924.5 Wettinia sp. Arecaceae Arecales 0.53 ± 0.09 4347.3 ±594.5 Prunus detrita Rosaceae Rosales 0.60 ± 0.11 6299.4 ±1042.4 Guarea pterorhachis Meliaceae Sapinadales 0.60 ± 0.29 7629.3 ±1255.6 Protium sp. Burseraceae Sapindales 0.65 ± 0.11 6021.3 ±1112.0 Matisia malacocalyx Malvaceae Malvales 1.24 ± 0.32 13998.7 ±2343.8 Coussarea ecuadorensis Rubiaceae Gentianales 1.45 ± 0.15 9230.8 ±3170.4 Dictyocaryum lamarckianum Arecaceae Arecales 3.02 ± 0.84 20485.7 ±3012.9
Iriartea deltoidea Arecaceae Arecales 3.56 ± 0.62 21800.6 ±3516.4

28
Table 2. Elevation midpoints derived from permanent plot records. Species are ordered from low elevation to high elevation. Midpoints were calculated taking into account abundance of each species/genera at each elevation. NAs occur where species or genera did not occur in plots.
species midpoint of
species elevation range (m)
midpoint of genus elevation
range (m) Heliocarpus americanus 471 471 Iriartea deltoidea 1264 1264 Virola sebifera 591 1319 Wettinia sp. na 1367 Matisia malacocalyx na 1379 Guarea pterorhachis na 1388 Coussarea ecuadorensis na 1430 Turpinia occidentalis na 1464 Ormosia sp. na 1500 Dictyocaryum lamarckianum 1579 1579 Protium sp. na 1633 Tapirira guianensis 1546 1659 Guatteria duodesima na 1725 Myrcia sp. na 1741 Mollinedia sp. na 1785 Hyeronima oblonga 1690 1829 Meliosma vasquezii na 2211 Prunus detrita 1718 2683 Solanum sp. na 2835 Hesperomeles ferruginea na 3000 Myrica pubescens 3000 3000 Symplocos psiloclada 3409 3187 Rinorea sp. na na Zea mays na na

29
Table 3. Dates of installation and censuses of seed predation sites. The number of days from installation are in parentheses.
Plot Installation First Census Second Census Third Census TU 3450 16 Aug 2008 23 Aug 2008 (8) 13 Sep 2008 (28) 24 Oct 2008 (70)TU 3250 17 Aug 2008 25 Aug 2008 (8) 14 Sep 2008 (28) 25 Oct 2008 (70)TU 3000 18 Aug 2008 26 Aug 2008 (8) 15 Sep 2008 (28) 26 Oct 2008 (70)TU 2750 19 Aug 2008 26 Aug 2008 (7) 16 Sep 2008 (28) 27 Oct 2008 (70)TU 2500 20 Aug 2008 26 Aug 2008 (6) 17 Sep 2008 (28) 28 Oct 2008 (70)TU 2250 28 Aug 2008 18 Sep 2008 (21) 25 Sep 2008 (28) 6 Nov 2008 (70)TU 2000 30 Aug 2008 19 Sep 2008 (20) 25 Sep 2008 (26) 8 Nov 2008 (71)TU 1750 31 Aug 2008 20 Sep 2008 (20) 25 Sep 2008 (25) 9 Nov 2008 (71) SP 1750 20 Sep 2008 26 Sep 2008 (6) 28 Oct 2008 (38) 29 Nov 2008 (71)SP 1500 2 Sep 2008 11 Sep 2008 (9) 26 Sep 2008 (24) 11 Nov 2008 (70)TO 1000 30 Aug 2008 14 Sep 2008 (15) 27 Sep 2008 (28) 8 Nov 2008 (71)

30
Table 4. Summary of Cox proportional hazard regression.
source DF χ2 p elevation 1 438.18 0.00 species 23 52.7 0.0004
species by elevation interaction 23 43.06 0.007

31
Table 5. Seed mortality of species aggregated over all elevations and seed mass modeled using a generalized linear model with a quasi-binomial error distribution.
coefficient residual deviation DFresiduals p
seed mass -0.08 616.29 22 0.46

32
Table 6: Linear regressions of seed mortality and the elevational midpoint of genera. At each elevation, the species seed mortality at that elevation was used. Genera that do not occur in the plot network, Zea spp. and Rinorea spp., were not included in this analysis.
elevation R2 DF Std. Errorresiduals
DFresiduals p
1000 0.18 1 0.32 20 0.06 1500 0.02 1 0.28 20 0.58 1750 6 x 10⁻⁶ 1 0.24 20 0.99 1850 0.01 1 0.27 20 0.60 2000 0.01 1 0.31 20 0.66 2250 0.04 1 0.20 20 0.38 2500 0.01 1 0.21 20 0.63 2750 0.002 1 0.22 20 0.85 3000 0.08 1 0.17 20 0.21 3250 0.03 1 0.22 20 0.48 3450 0.17 1 0.22 20 0.06

33
Table 7. Linear regressions of seed predation on and elevational midpoint of species. At each elevation the species mortality at that elevation was used. Only the 12 species that occurred in the plots (Table 2) were used in this analysis.
elevation R2 DF Std. Errorresiduals
DFresiduals p
1000 0.30 1 0.31 10 0.06 1500 0.02 1 0.22 10 0.65 1750 0.01 1 0.25 10 0.78 1850 0.01 1 0.24 10 0.76 2000 0.003 1 0.25 10 0.87 2250 0.03 1 0.20 10 0.59 2500 0.05 1 0.22 10 0.49 2750 3.6 x 10⁻⁴ 1 0.16 10 0.95 3000 0.18 1 0.18 10 0.17 3250 0.002 1 0.23 10 0.90 3450 0.32 1 0.23 10 0.06
34
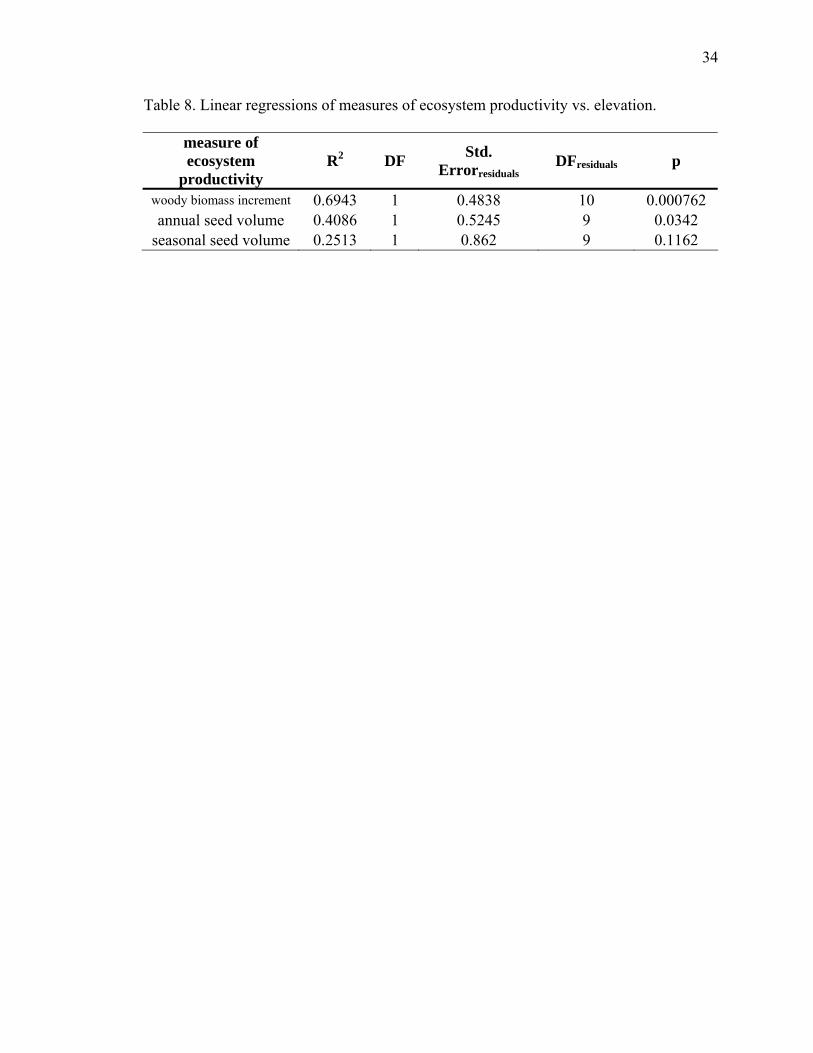
Table 8. Linear regressions of measures of ecosystem productivity vs. elevation.
measure of ecosystem
productivity R2 DF Std.
Errorresiduals DFresiduals p
woody biomass increment 0.6943 1 0.4838 10 0.000762 annual seed volume 0.4086 1 0.5245 9 0.0342
seasonal seed volume 0.2513 1 0.862 9 0.1162

35
Figure 1
C M He Z
S I
I
I
Pr D
D
DO Z
Z
He V
W T M My
S T
Gua Pr H
Myr
R
Gu
Mc) b)
1000 m
1500 m
1750 m 1850 m 2000 m
2250 m
2500 m
2750 m
3000 m 3250 m
3450 m
a) Amazon
Andes
1 hectare plot
PERU
Manu National
Park
36
Figure 2 Key to Species Abbreviations: Hel = H. amerianus Hes = H. feruginea So = Solanum sp. Myri = M. pubescens Hy = H. oblonga Tu = T. occidentalis Ri = Rinorea sp. Guat = G. duodesima Ze = Z. mays Vi = V. sebifera Ta = T. guianensis Myrc = Myrcia sp. Sy = S. psiloclada Mo = Mollinedia sp. Or = Ormosia sp. Me = M. vasquezii We = Wettinia sp. Pru = P. detrita Guar = G. pterorhachis Pro = Protium sp. Ma = M. malacocalyx Co = C. ecuadorensis Di=D. lamarkianum Ir = I. deltoidea
Hel Hes So Myri Hy Tu Ri Guat Ze Vi Ta Myrc Sy Mo Or Me We Pru Guar Pro Ma Co Di Ir
0.0
0.2
0.4
0.6
0.8
1.0
species
seed
mor
talit
y

37
Fig. 3
1000 1500 2000 2500 3000 3500
0.0
0.2
0.4
0.6
0.8
1.0
elevation (m)
seed
mor
talit
y

38
Figure 4
1000 2000 3000
0.0
0.2
0.4
0.6
0.8
1.0
elevation (m)
mor
talit
y
Hesperomeles ferruginea
1000 2000 3000
0.0
0.2
0.4
0.6
0.8
1.0
elevation (m)
mor
talit
y
Heliocarpus americanus
1000 2000 3000
0.0
0.2
0.4
0.6
0.8
1.0
elevation (m)
mor
talit
y
Solanum sp.
1000 2000 3000
0.0
0.2
0.4
0.6
0.8
1.0
elevation (m)
mor
talit
y
Myrica pubescens
1000 2000 3000
0.0
0.2
0.4
0.6
0.8
1.0
elevation (m)
mor
talit
y
Hyeronima oblonga
1000 2000 3000
0.0
0.2
0.4
0.6
0.8
1.0
elevation (m)
mor
talit
y
Turpinia occidentalis
1000 2000 3000
0.0
0.2
0.4
0.6
0.8
1.0
elevation (m)
mor
talit
y
Rinorea sp.
1000 2000 3000
0.0
0.2
0.4
0.6
0.8
1.0
elevation (m)
mor
talit
y
Guatteria duodesima
1000 2000 30000.
00.
20.
40.
60.
81.
0elevation (m)
mor
talit
y
Zea mays
1000 2000 3000
0.0
0.2
0.4
0.6
0.8
1.0
elevation (m)
mor
talit
y
Virola sebifera
1000 2000 3000
0.0
0.2
0.4
0.6
0.8
1.0
elevation (m)
mor
talit
y
Tapirira guianensis
1000 2000 3000
0.0
0.2
0.4
0.6
0.8
1.0
elevation (m)
mor
talit
y
Myrcia sp.
1000 2000 3000
0.0
0.2
0.4
0.6
0.8
1.0
elevation (m)
mor
talit
y
Symplocos psiloclada
1000 2000 3000
0.0
0.2
0.4
0.6
0.8
1.0
elevation (m)
mor
talit
y
Mollinedia sp.
1000 2000 3000
0.0
0.2
0.4
0.6
0.8
1.0
elevation (m)
mor
talit
y
Ormosia sp.
1000 2000 30000.
00.
20.
40.
60.
81.
0
elevation (m)
mor
talit
y
Meliosma vasquezii
1000 2000 3000
0.0
0.2
0.4
0.6
0.8
1.0
elevation (m)
mor
talit
y
Wettinia sp.
1000 2000 3000
0.0
0.2
0.4
0.6
0.8
1.0
elevation (m)
mor
talit
y
Prunus detrita
1000 2000 3000
0.0
0.2
0.4
0.6
0.8
1.0
elevation (m)
mor
talit
y
Guarea pterorhachis
1000 2000 3000
0.0
0.2
0.4
0.6
0.8
1.0
elevation (m)
mor
talit
y
Protium sp.
1000 2000 3000
0.0
0.2
0.4
0.6
0.8
1.0
elevation (m)
mor
talit
y
Matisia malacocalyx
1000 2000 3000
0.0
0.2
0.4
0.6
0.8
1.0
elevation (m)
mor
talit
y
Coussarea ecuadorensis
1000 2000 30000.
00.
20.
40.
60.
81.
0
elevation (m)
mor
talit
y
Dictyocarium lamarckianum
1000 2000 3000
0.0
0.2
0.4
0.6
0.8
1.0
elevation (m)
mor
talit
y
Iriartea deltoidea

39
Figure 5
0.005 0.010 0.020 0.050 0.100 0.200 0.500 1.000 2.000
0.6
0.7
0.8
0.9
seed mass (g)
seed
mor
talit
y

40
Figure 6
1500 2000 2500 3000
0.3
0.4
0.5
0.6
0.7
0.8
0.9
1.0
1000 m
elevation midpoint of genus (m)
seed
mor
tality
1500 2000 2500 3000
0.5
0.6
0.7
0.8
0.9
1.0
1500 m
elevation midpoint of genus (m)se
ed m
orta
lity1500 2000 2500 3000
0.70
0.75
0.80
0.85
0.90
0.95
1.00
1750 m
elevation midpoint of genus (m)
seed
mor
tality
1500 2000 2500 3000
0.6
0.7
0.8
0.9
1.0
1850 m
elevation midpoint of genus (m)
seed
mor
tality
1500 2000 2500 3000
0.3
0.4
0.5
0.6
0.7
0.8
0.9
1.0
2000 m
elevation midpoint of genus (m)
seed
mor
tality
1500 2000 2500 3000
0.6
0.7
0.8
0.9
1.0
2250 m
elevation midpoint of genus (m)
seed
mor
tality
1500 2000 2500 3000
0.5
0.6
0.7
0.8
0.9
1.0
2500 m
elevation midpoint of genus (m)se
ed m
orta
lity
1500 2000 2500 3000
0.4
0.5
0.6
0.7
0.8
0.9
1.0
2750 m
elevation midpoint of genus (m)
seed
mor
tality
1500 2000 2500 3000
0.4
0.5
0.6
0.7
0.8
0.9
3000 m
elevation midpoint of genus (m)
seed
mor
tality
1500 2000 2500 3000
0.2
0.3
0.4
0.5
0.6
0.7
0.8
0.9
3250 m
elevation midpoint of genus (m)
seed
mor
tality
1500 2000 2500 3000
0.2
0.4
0.6
0.8
3450 m
elevation midpoint of genus (m)
seed
mor
tality

41
Figure 7
500 1000 1500 2000 2500 3000 3500
0.3
0.4
0.5
0.6
0.7
0.8
0.9
1.0
1000 m
elevation midpoint of species (m)
seed
mor
tality
500 1000 1500 2000 2500 3000 3500
0.5
0.6
0.7
0.8
0.9
1.0
1500 m
elevation midpoint of species (m)se
ed m
orta
lity
500 1000 1500 2000 2500 3000 3500
0.70
0.75
0.80
0.85
0.90
0.95
1.00
1750 m
elevation midpoint of species (m)
seed
mor
tality
500 1000 1500 2000 2500 3000 3500
0.6
0.7
0.8
0.9
1.0
1850 m
elevation midpoint of species (m)
seed
mor
tality
500 1000 1500 2000 2500 3000 3500
0.3
0.4
0.5
0.6
0.7
0.8
0.9
1.0
2000 m
elevation midpoint of species (m)
seed
mor
tality
500 1000 1500 2000 2500 3000 3500
0.6
0.7
0.8
0.9
1.02250 m
elevation midpoint of species (m)
seed
mor
tality
500 1000 1500 2000 2500 3000 3500
0.5
0.6
0.7
0.8
0.9
1.0
2500 m
elevation midpoint of species (m)
seed
mor
tality
500 1000 1500 2000 2500 3000 3500
0.4
0.5
0.6
0.7
0.8
0.9
1.0
2750 m
elevation midpoint of species (m)
seed
mor
tality
500 1000 1500 2000 2500 3000 3500
0.4
0.5
0.6
0.7
0.8
0.9
3000 m
elevation midpoint of species (m)
seed
mor
tality
500 1000 1500 2000 2500 3000 3500
0.2
0.3
0.4
0.5
0.6
0.7
0.8
0.9
3250 m
elevation midpoint of species (m)
seed
mor
tality
500 1000 1500 2000 2500 3000 3500
0.2
0.4
0.6
0.8
3450 m
elevation midpoint of species (m)
seed
mor
tality

42
Figure 8
12.5
13.0
13.5
14.0
log
of s
eed
rain
vol
ume
(mm
^3)
1000 1500 2000 2500 3000 3500
11.0
11.5
12.0
12.5
13.0
13.5
14.0
elevation (m)
log
of s
eed
rain
vol
ume
(mm
^3)
(a)
(b)

43
Figure 9
1000 1500 2000 2500 3000 3500
1.5
2.0
2.5
3.0
3.5
4.0
elevation (m)
woo
dy b
iom
ass
incr
emen
t (T/
ha)
44
Figure 10
0 1000 2000 3000 4000
010
2030
4050
60
elevation (m)
num
ber o
f spe
cies
rodents carnivorous birds and mammals

45
CURRICULUM VITAE
Rachel A. Hillyer
Education: Florida Institute of Technology: Melbourne, Florida Bachelor of Science Degree: Biology, May 2007 Wake Forest University: Winston-Salem, North Carolina Master of Science Degree: Ecology, expected May 2009 Thesis title: Seed predation along an elevational gradient in the Tropical Andes, Peru.
Teaching: 2007 Teaching Assistant. Comparative Physiology. Wake Forest University 2008 Teaching Assistant. Ecology and Evolution. Wake Forest University Grants: Sigma Xi Grants-in-Aid of Research (2005) NSF Research Experience for Undergraduates (2005) Publications: Hillyer, R., B.G. Valencia, M.B. Bush, M.R. Silman, and M. Steinitz-Kannan. 2009. A
24,700-yr paleolimnological history from the Peruvian Andes. Quaternary Research. 71(1):71-82.