Sedimentary architecture and landforms of the Late Saalian ...
40
1 Sedimentary architecture and landforms of the Late Saalian (MIS 6) ice sheet margin, offshore the Netherlands Víctor Cartelle 1 , Natasha L.M. Barlow 1 , David M. Hodgson 1 , Freek S. Busschers 2 , Kim M. Cohen 3 , Bart M.L. Meijninger 2 , Wessel P. van Kesteren 4 1 School of Earth and Environment, University of Leeds, UK 5 2 TNO, Geological Survey of the Netherlands, Utrecht, The Netherlands 3Faculty of Geosciences, Utrecht University, Utrecht, The Netherlands 4 Fugro, Nootdorp, The Netherlands Correspondence to: Víctor Cartelle ([email protected]) Abstract. Reconstructing the growth and decay of palaeo-ice sheets is critical to understanding the relationships between 10 global climate and sea-level change, and to testing numerical ice sheet models. In this study, we integrate recently acquired high-resolution 2D-seismic reflection and borehole datasets from two windfarm sites offshore the Netherlands to investigate the sedimentary, geomorphological and glaciotectonic records left by the Saalian Drenthe substage glaciation, when Scandinavian land ice reached its southernmost extent in the southern North Sea (ca. 160 ka, Marine Isotope Stage 6). A complex assemblage of glaciogenic sediments and glaciotectonic structures are buried in the shallow subsurface. The northern 15 windfarm site revealed a set of NE-SW oriented subglacial meltwater channels filled with till and glaciofluvial sediments and an E-W trending composite ridge with local evidence of intense glaciotectonic deformation that denotes the maximum limit reached by the ice. Based on the identified glacial geomorphology, we refine the mapping of the maximum ice-sheet extent offshore the Netherlands, revealing that the ice margin morphology is more complex than previously envisaged, displaying a lobate shape. Ice retreat left an unusual paraglacial landscape characterised by the progressive infilling of topographic 20 depressions carved during the ice advance and a diffuse drainage network of outwash channels. The net direction of outwash was to the west and southwest into a nearby glacial basin. Antecedent topography influenced subglacial bed conditions, and their impact on ice dynamics during the glaciation and deglaciation stages. We demonstrate the utility of offshore windfarm data in refining palaeo ice margin limits, and the record of processes interactions preserved in buried landscapes to help inform longer-term drivers of change at low relief ice margins. 25 https://doi.org/10.5194/esurf-2021-47 Preprint. Discussion started: 23 June 2021 c Author(s) 2021. CC BY 4.0 License.
Transcript of Sedimentary architecture and landforms of the Late Saalian ...

1
Sedimentary architecture and landforms of the Late Saalian (MIS 6)
ice sheet margin, offshore the Netherlands
Víctor Cartelle1, Natasha L.M. Barlow1, David M. Hodgson1, Freek S. Busschers2, Kim M. Cohen3, Bart
M.L. Meijninger2, Wessel P. van Kesteren4
1School of Earth and Environment, University of Leeds, UK 5 2TNO, Geological Survey of the Netherlands, Utrecht, The Netherlands
3Faculty of Geosciences, Utrecht University, Utrecht, The Netherlands 4Fugro, Nootdorp, The Netherlands
Correspondence to: Víctor Cartelle ([email protected])
Abstract. Reconstructing the growth and decay of palaeo-ice sheets is critical to understanding the relationships between 10
global climate and sea-level change, and to testing numerical ice sheet models. In this study, we integrate recently acquired
high-resolution 2D-seismic reflection and borehole datasets from two windfarm sites offshore the Netherlands to investigate
the sedimentary, geomorphological and glaciotectonic records left by the Saalian Drenthe substage glaciation, when
Scandinavian land ice reached its southernmost extent in the southern North Sea (ca. 160 ka, Marine Isotope Stage 6). A
complex assemblage of glaciogenic sediments and glaciotectonic structures are buried in the shallow subsurface. The northern 15
windfarm site revealed a set of NE-SW oriented subglacial meltwater channels filled with till and glaciofluvial sediments and
an E-W trending composite ridge with local evidence of intense glaciotectonic deformation that denotes the maximum limit
reached by the ice. Based on the identified glacial geomorphology, we refine the mapping of the maximum ice-sheet extent
offshore the Netherlands, revealing that the ice margin morphology is more complex than previously envisaged, displaying a
lobate shape. Ice retreat left an unusual paraglacial landscape characterised by the progressive infilling of topographic 20
depressions carved during the ice advance and a diffuse drainage network of outwash channels. The net direction of outwash
was to the west and southwest into a nearby glacial basin. Antecedent topography influenced subglacial bed conditions, and
their impact on ice dynamics during the glaciation and deglaciation stages. We demonstrate the utility of offshore windfarm
data in refining palaeo ice margin limits, and the record of processes interactions preserved in buried landscapes to help inform
longer-term drivers of change at low relief ice margins. 25
https://doi.org/10.5194/esurf-2021-47Preprint. Discussion started: 23 June 2021c© Author(s) 2021. CC BY 4.0 License.
2
1 Introduction
The Greenland and Antarctic Ice Sheets have experienced net mass loss since the end of the Last Glacial (Alley et al., 2010;
Anderson et al., 2002; Prothro et al., 2020), and are continuing to shrink at increasing rates due to anthropogenically-driven
climatic change and oceanic warming (Hanna et al., 2020; Shepherd et al., 2020, 2019). Therefore, it is important to better
constrain the driving mechanisms of modern and future ice-sheet changes, and the potential for global and regional sea-level 30
rise. Observational data of modern ice sheet mass-balance cannot capture the temporal and spatial patterns of large-scale ice-
sheet decay. Therefore, there is a need to develop reconstructions of past ice-sheet advance and retreat to understand changes
on longer timescales to improve assessment of the duration and magnitude of ice-sheet instabilities; to understand lags in the
Earth-system response; and the potential for changes in relative sea level (RSL) (Carlson and Clark, 2012). Geological records
can be used to inform and calibrate models of ongoing ice-sheet retreat and sea-level rise, which may provide explanations for 35
modern-day observations and be used to estimate potential future changes (Clark and Huybers, 2009; Gilford et al., 2020;
Harrison et al., 2015; Kleman et al., 2007; Stokes et al., 2015).
To further understand ice sheet responses to differing climate states, we focus on ice-sheet advance and retreat during the
penultimate glacial cycle (late Marine Isotope Stage [MIS] 6) in NW Europe. This period directly preceded the Last
Interglacial (LIG; ca. 129-116 ka, MIS 5e) during which global temperatures were ~1oC warmer than pre-industrial values 40
(Otto-Bliesner et al., 2013), and global mean sea level was likely 6 to 9 m above present (Dutton et al., 2015). Together with
climatic forcing and associated ice sheet responses over the MIS 6/5 glacial termination, the distribution of global ice sheets
during MIS 6 is critical to understanding the nature of the LIG highstand regionally and globally. This is not trivial as much
evidence of MIS 6 glaciation and deglaciations was removed or heavily overprinted by glaciations during the Last Glacial.
Thus, the uncertainty in knowing the MIS 6 ice-sheet limits and the timing of deglaciation (Batchelor et al., 2019), represent 45
a weakness in glacial isostatic adjustment modelling, which is needed to understand rates and magnitudes of global and regional
LIG RSL change (Barlow et al., 2018; Dendy et al., 2017; Rohling et al., 2017).
Broadly speaking, the MIS 6 North European ice sheet reached a greater eastward and southward extent compared to the Last
Glacial Maximum (LGM, MIS 2), where it had terrestrial limits. Its marine-limited western extent was smaller than, or similar
to, that of the LGM (Batchelor et al., 2019; Ehlers and Gibbard, 2004). Over Germany and The Netherlands, the MIS 6 50
https://doi.org/10.5194/esurf-2021-47Preprint. Discussion started: 23 June 2021c© Author(s) 2021. CC BY 4.0 License.

3
maximum ice advance was more extensive than the LGM, but even here reconstructions of ice limits are largely derived from
spatially disparate field evidence that usually relate to small sectors of the ice sheet (e.g. Busschers et al., 2008; Gibbard and
Clark, 2011; Van den Berg and Beets, 1987). Offshore in the southern North Sea, the current geological constraints on the
position of the Saalian maximum ice margin is limited to that visible in first-generation geophysical data (Joon et al., 1990;
Laban, 1995; Oele, 1971) and re-processed seismic data originally acquired to map reservoir-geological features at much 55
greater depth (Moreau et al., 2012).
A wealth of new offshore geophysical data targeting the shallow subsurface (~0 to 100 m below seafloor) has become available
following significant investment into wind energy in the North Sea region. The high-resolution and high-density datasets from
windfarm site investigations , provide a stimulus into new late Quaternary submerged landscape research (e.g. Cotterill et al.,
2017; Eaton et al., 2020; Emery et al., 2019; Mellett et al., 2020). In the Dutch sector of the North Sea, two new windfarm 60
sites, Hollandse Kust Noord and Zuid, are located within previously mapped limits of the late Saalian ice sheet (Fig. 1). We
integrate recently acquired high-resolution 2D seismic reflection, borehole and cone penetration test (CPT) datasets to
investigate the sedimentary, geomorphological and glaciotectonic records left by the late Saalian glaciation offshore the Dutch
coast. We use this data to constrain the maximum extent and morphology of the ice sheet and provide insights into the style
and dynamics of the ice sheet during the phases of ice-sheet advance, maximum extent and retreat. 65
https://doi.org/10.5194/esurf-2021-47Preprint. Discussion started: 23 June 2021c© Author(s) 2021. CC BY 4.0 License.
4
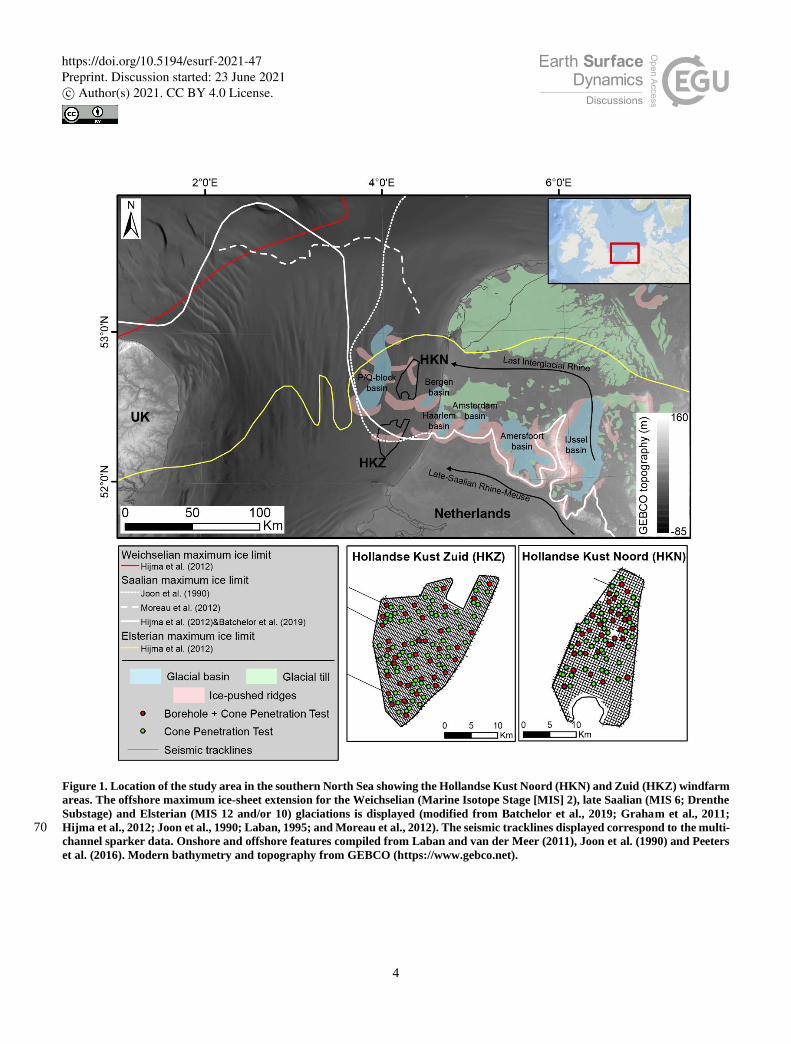
Figure 1. Location of the study area in the southern North Sea showing the Hollandse Kust Noord (HKN) and Zuid (HKZ) windfarm
areas. The offshore maximum ice-sheet extension for the Weichselian (Marine Isotope Stage [MIS] 2), late Saalian (MIS 6; Drenthe
Substage) and Elsterian (MIS 12 and/or 10) glaciations is displayed (modified from Batchelor et al., 2019; Graham et al., 2011;
Hijma et al., 2012; Joon et al., 1990; Laban, 1995; and Moreau et al., 2012). The seismic tracklines displayed correspond to the multi-70 channel sparker data. Onshore and offshore features compiled from Laban and van der Meer (2011), Joon et al. (1990) and Peeters
et al. (2016). Modern bathymetry and topography from GEBCO (https://www.gebco.net).
https://doi.org/10.5194/esurf-2021-47Preprint. Discussion started: 23 June 2021c© Author(s) 2021. CC BY 4.0 License.
5
2 Regional setting
The Hollandse Kust Noord [HKN] and Zuid [HKZ] windfarms are positioned near the southwestern rim of the Cenozoic North
Sea Basin (Van Balen et al., 2005; Ziegler, 1994). Its present-day structural configuration is the result of Late Jurassic–Early 75
Cretaceous rifting, followed by thermal cooling and subsidence (Glennie and Underhill, 2009; Zanella and Coward, 2003). Up
to 3500 m of Cenozoic sediment has accumulated in the central part of the basin (Knox et al., 2010). Increased Quaternary
subsidence has allowed a thick sedimentary succession to accumulate (up to 1250 m thick) (Arfai et al., 2018; Lamb et al.,
2018). The Quaternary record thins towards the southern edge of the basin reaching a thickness of 400 to 800 m at the location
of the HKN and HKZ windfarms (Cameron et al., 1984; Knox et al., 2010). The Quaternary record primarily consists of stacked 80
fluvial (primarily Eridanos and Rhine) and shallow marine (water depths up to 300 m, Kuhlmann, 2004) sediments with
multiple intercalations of glacial sediments.
The North Sea area experienced several major glaciations during the late Quaternary, of which the Elsterian (MIS 12 and/or
10), late Saalian (MIS 6) and late Middle Weichselian (MIS2) were the most extensive (Busschers et al., 2008; Cameron et al.,
1992; Caston, 1979; Ehlers and Gibbard, 2004; Gandy et al., 2020; Graham et al., 2011; Laban and van der Meer, 2011; Lauer 85
and Weiss, 2018; Lee et al., 2012; Zagwijn, 1973, 1983). In the Netherlands, the late Saalian ice sheet reached furthest south
(Fig. 1). A complex assemblage of glaciogenic sediments and glaciotectonic structures (ice-pushed ridges) surrounding tongue-
shaped basins have been identified and studied in the northern and central onshore Netherlands (Bakker, 2004; Bakker and
Van der Meer, 2003; Beets et al., 2006; Busschers et al., 2008; Van den Berg and Beets, 1987). Offshore , recorded evidence
is scarce, and the reconstruction of the late Saalian ice-sheet maximum extent is based on the study of sediments recovered in 90
limited boreholes and landforms imaged by seismic reflection methods (Graham et al., 2011; Joon et al., 1990; Laban, 1995;
Laban and van der Meer, 2011). Large tongue-shaped subglacial basins, smaller subglacial meltwater channel features, and in
a few exceptional circumstances, glaciotectonic deformations are present in previous generation low-resolution geophysical
data (Joon et al., 1990; Laban, 1995; Oele, 1971). West of the Dutch coastline these have been used to define the
southwesternmost Saalian ice-sheet limit near 3.5°E/52.5°N (Fig. 1, Joon et al., 1990). The presumed limits then run parallel 95
to the Dutch coastline (roughly N-S orientation) and eventually continue westward to the British sector along curved
https://doi.org/10.5194/esurf-2021-47Preprint. Discussion started: 23 June 2021c© Author(s) 2021. CC BY 4.0 License.
6
trajectories north of 53°N (Fig. 1, Gibbard et al., 2009; Graham et al., 2011; Laban and van der Meer, 2011; Lee et al., 2012;
Moreau et al., 2012).
3 Study area, materials and methods
3.1 Study area 100
The study area lies ~20 km west of the coastline of the Netherlands (Fig. 1) and comprises two windfarm sites, Hollandse Kust
Noord (HKN) and Hollandse Kust Zuid (HKZ). The combined area of both sites is ~480 km2, both are located in shallow
waters of less than 30 m and the distance between both windfarm sites is 17 km. Previous research (Joon et al., 1990) suggests
that HKN is positioned inside the maximum Saalian ice limit while HKZ is located on or just beyond the limit. In addition, the
two windfarm sites are located between two tongue-shaped glacial basins, a smaller one east of the study area (Bergen basin, 105
Fig. 1) and a much larger one west of the study area (P/Q-block basin, Fig. 1).
3.2 Materials
Geophysical surveys of the HKN and HKZ windfarm development areas were carried out by Fugro between 2016 and 2018
on behalf of The Netherlands Enterprise Agency (RVO). The datasets acquired during these surveys are publicly available and
stored by RVO (www.offshorewind.rvo). The data include both geophysical, geotechnical and geological investigations from 110
several phases. The shallow subsurface is imaged using sub-bottom profiler (SBP), single-channel sparker (SCS) and high-
resolution multi-channel sparker (MCS). The line spacing is variable for each system and site. In HKN, the grid line spacing
is 100 m in the NE-SW orientation and 2000 m in the NW-SE orientation for SBP and SCS, and 500x500 m for MCS. In HKZ,
the grid line spacing is 100 m in the NE-SW orientation and 2000 m in the NW-SE orientation for SBP, and 300 m in the NE-
SW orientation and 750 m in the NW-SE orientation for SCS and MCS. Application of tidal corrections for the three systems 115
gives depth relative to the lowest astronomical tide (LAT). Both the SCS and MCS seismic reflection data have been depth
converted by Fugro. A velocity of 1600 ms-1 was used for the SCS to convert from two-way travel time (TWT) to depth in
metres (m bLAT), and the MCS was depth-converted using a velocity field derived during seismic processing (Fugro, 2017a,
2016a, 2016b, 2016c, 2016d). The maximum vertical resolution is 0.7-1.8 m for MCS and 0.5 m for SCS, both with a mean
horizontal resolution of 2 m (Fugro, 2017a, 2016a, 2016b, 2016c, 2016d). 120
https://doi.org/10.5194/esurf-2021-47Preprint. Discussion started: 23 June 2021c© Author(s) 2021. CC BY 4.0 License.

7
The geotechnical investigations included a combination of boreholes (BHs), downhole sampling, and/or in situ testing through
cone penetration tests (CPTs) and targeted depths of 3 to 80 m. Boreholes were conducted using open-hole rotary drilling.
Twenty-eight locations were drilled and sampled in HKN, and 35 in HKZ (Fig. 1). CPTs completed in 66 and 137 locations
in HKN and HKZ (Fig. 1), respectively. Data from boreholes is limited to the borehole logs, sample descriptions and
photographs provided in reports by Fugro (Fugro, 2019, 2017b, 2017c, 2016e, 2016f). These reports also include results from 125
pollen analyses of a selection of boreholes (StrataData, 2019, 2017). Pollen sampling was low resolution, with only a few
samples per borehole, and analyses were conducted on samples that ranged from 5 to 60 cm of sediment.
3.3 Methods
The RVO-provided geophysical and geotechnical datasets are used in this study to investigate the landscape left by the late
Saalian glaciation. Interpretation of seismic facies and units was conducted in IHS Kingdom software according to the basic 130
principles of seismic stratigraphy (Mitchum, 1977; Mitchum et al., 1977; Mitchum and Vail, 1977). Seismic facies were
characterised following Mellett et al. (2013) and Mitchum et al. (1977) and were used to define seismic stratigraphic units.
Key horizons were mapped, interpreted and gridded to maps using the flex gridding algorithm in Kingdom Suite. Infill between
key horizons was characterised by their seismic facies (Table 1) and architecture, tied to relevant boreholes and CPT profiles
in key locations. The descriptions of the boreholes were cross-checked with photographs and improved where possible to 135
construct detailed measured sections. Where available, the pollen and palynomorph data generated as part of the Fugro
investigations were integrated into the analysis to cross-verify and support palaeo-environmental interpretations. The low-
resolution sub-sampling for palynological assessment in the RVO-commissioned surveys prevented a detailed correlation with
established chrono-biostratigraphic frameworks.
140
145
https://doi.org/10.5194/esurf-2021-47Preprint. Discussion started: 23 June 2021c© Author(s) 2021. CC BY 4.0 License.
8
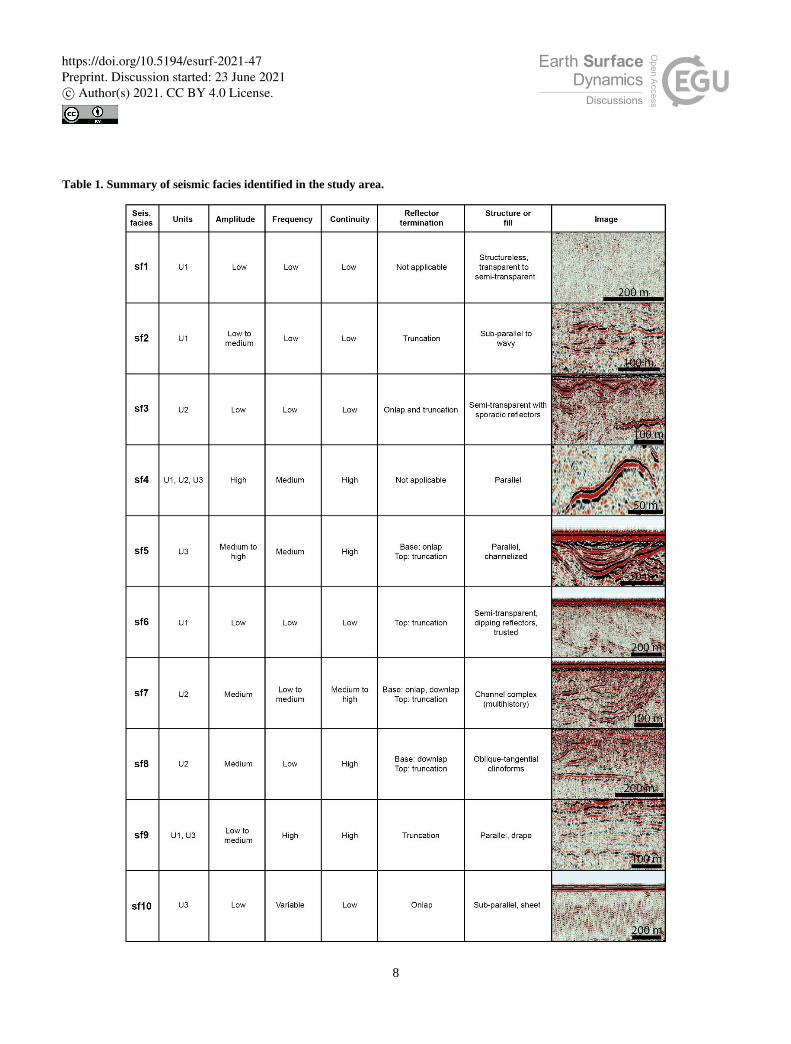
Table 1. Summary of seismic facies identified in the study area.
https://doi.org/10.5194/esurf-2021-47Preprint. Discussion started: 23 June 2021c© Author(s) 2021. CC BY 4.0 License.
9
4 Results and interpretation
Three seismic stratigraphic units (U1, U2 and U3) were defined by mapping two key surfaces (S1 and S2) based on the
integration of geophysical and geotechnical datasets from both windfarm sites. The seismic unit distribution varies spatially, 150
from north to south across the study area (Fig. 2). The correlation of seismic units between both windfarm sites is based on the
nature of their bounding surfaces, their sedimentological characteristics and pollen content. We have also examined available
legacy datasets between both windfarm sites, but they showed limited resolution or penetration.
The lower seismic unit (U1) is present throughout the study area. We do not distinguish a basal contact to U1 (Fig. 2). In
general, U1 is characterised by a weak acoustic response, and its internal structure is distinguished only locally in its upper 155
part, comprising sub-parallel, low frequency, low-to-medium amplitude reflectors that are truncated by disconformity S1.
Seismic unit 2 (U2) is only present in the north of the study area, infilling depressions of S1 (Fig. 2). U2 seismic facies are
generally transparent, but some low amplitude reflectors are distinguished to the south onlapping and downlapping the
underlying U1. The top of U2 is defined by disconformity S2, which truncates underlying units across the study area (Fig. 2).
The overlying seismic unit (U3) thickens southward, where it lies directly over U1, and S1 and S2 are coincident. The seismic 160
facies of U3 are highly variable. Both U1 and U3 comprise several stratigraphic units, but remain undifferentiated in this study
for simplicity.
Marked spatial differences in both the internal structure of the seismic units and the morphology of their bounding surfaces
exist across the study area (Fig. 2). Hence, we present detailed descriptions geographically and consider three sectors: northern
sector of HKN, middle sector of HKN, and southern sector of HKN and the HKZ windfarm, integrating both the geophysical 165
(seismic) and geotechnical (sampled boreholes, CPTs) datasets (Fig. 3).
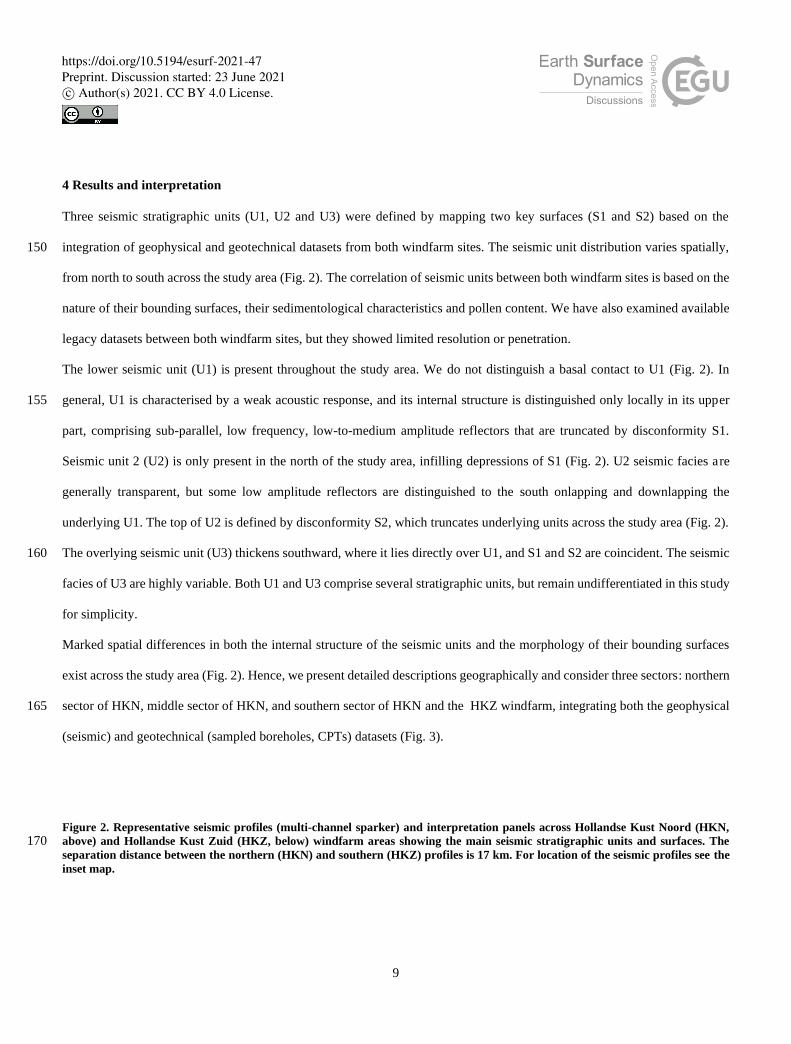
Figure 2. Representative seismic profiles (multi-channel sparker) and interpretation panels across Hollandse Kust Noord (HKN,
above) and Hollandse Kust Zuid (HKZ, below) windfarm areas showing the main seismic stratigraphic units and surfaces. The 170 separation distance between the northern (HKN) and southern (HKZ) profiles is 17 km. For location of the seismic profiles see the
inset map.
https://doi.org/10.5194/esurf-2021-47Preprint. Discussion started: 23 June 2021c© Author(s) 2021. CC BY 4.0 License.
10
https://doi.org/10.5194/esurf-2021-47Preprint. Discussion started: 23 June 2021c© Author(s) 2021. CC BY 4.0 License.
11
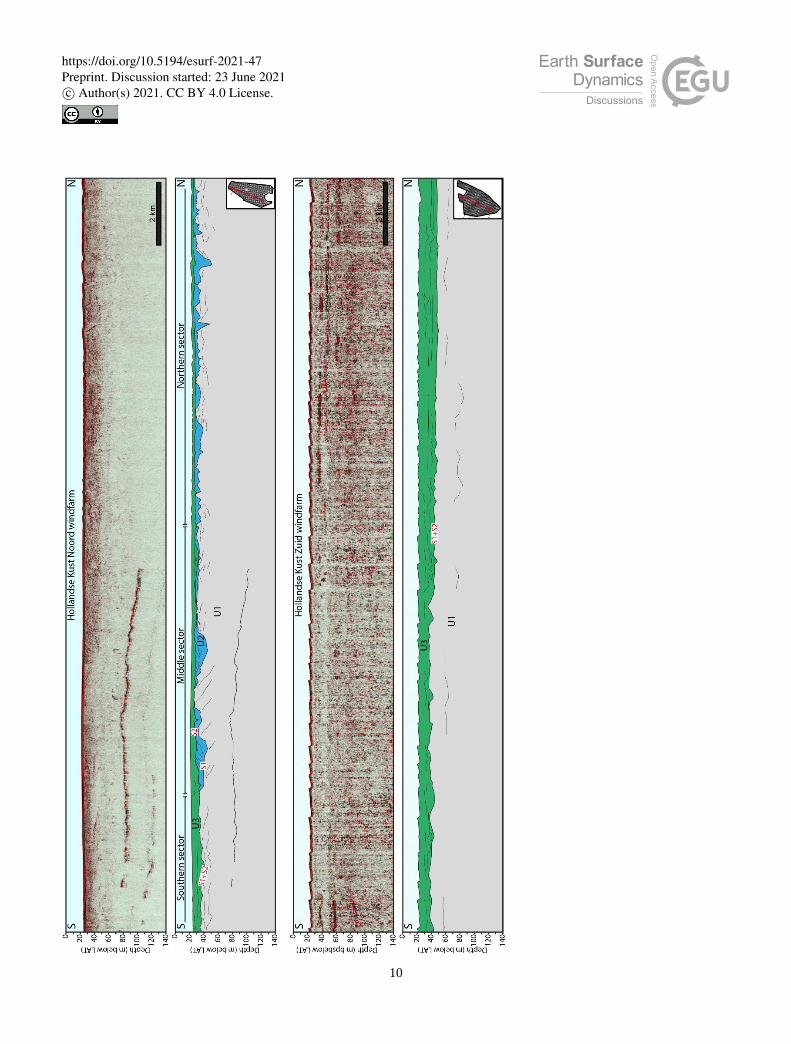
Figure 3. Seismic mapping and geological interpretation of HKN windfarm site. Left: Map of the depth of surface S1 (base of unit 175 U2, see also Figs. 2 and 4). Right: Landform interpretation showing subglacial meltwater channels, ice-pushed ridges, till deposits
and an outwash fan mapped in the study area. Meltwater direction during the early deglaciation has been inferred from the general
relief and slope of surface S1 and the distribution of glaciofluvial deposits.
4.1 Northern sector of HKN
4.1.1 Description 180
In the northern sector of HKN, the basal seismic U1 is generally characterised by a weak acoustic response, displaying
transparent and semi-transparent facies (sf1, Table 1). Locally, discontinuous slightly-wavy or sub-parallel reflectors are
observed in the upper part of the unit, truncated by S1 (sf2, Table 2). Most boreholes are located where U1 predominantly
displays transparent acoustic facies and comprise silty fine-to-medium sand. Rare dark organic clay and peat are recovered at
deeper levels (Fig. 4). 185
https://doi.org/10.5194/esurf-2021-47Preprint. Discussion started: 23 June 2021c© Author(s) 2021. CC BY 4.0 License.

12
Figure 4. Stratigraphic section (multi-channel sparker) through subglacial meltwater channels in the northern sector of HKN
windfarm area. Borehole HKN10 was recovered in one of these channels capturing the sedimentary characteristics of the three main
seismic stratigraphic units. Only the upper 50 m of the borehole are shown. Cone resistance from a CPT obtained in the same site is
displayed on the side of the borehole and in the seismic profiles. For location of the seismic profiles and the borehole see the inset 190 map (same map from Fig. 3). Grain size: C – clay, St – silt, fS – fine sand, mS – medium sand, cS – coarse sand, G – gravel. Vertical
dashed line indicates the position where the lines cross each other.
https://doi.org/10.5194/esurf-2021-47Preprint. Discussion started: 23 June 2021c© Author(s) 2021. CC BY 4.0 License.
13
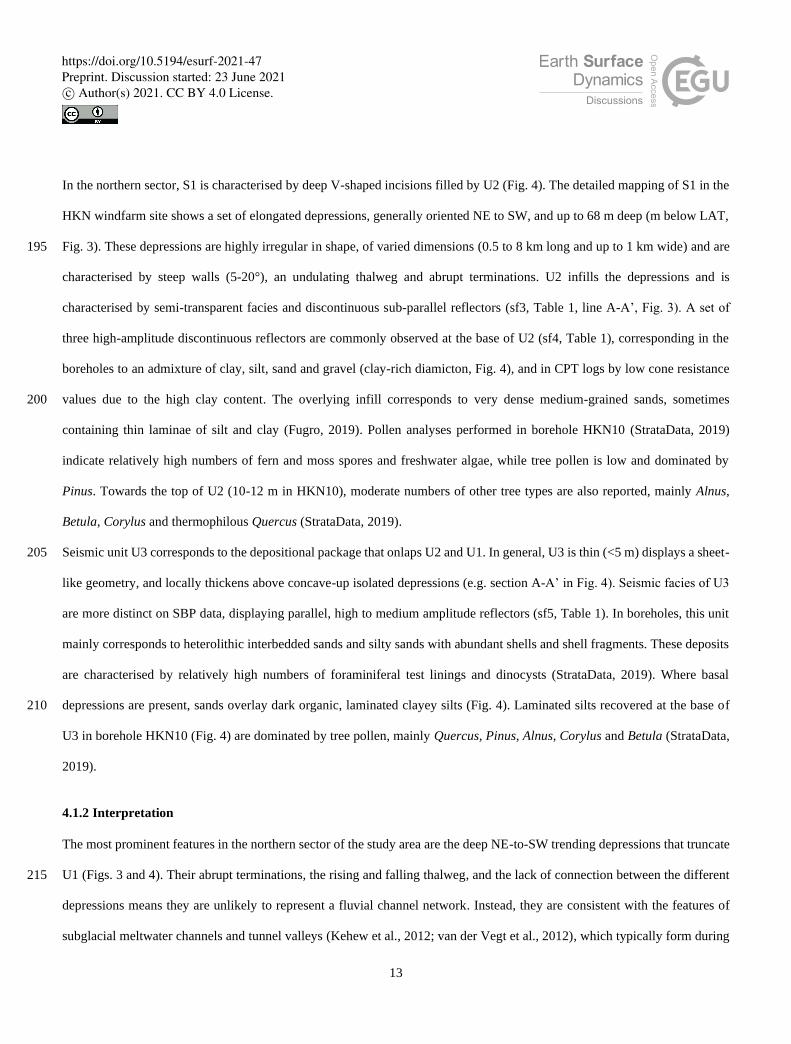
In the northern sector, S1 is characterised by deep V-shaped incisions filled by U2 (Fig. 4). The detailed mapping of S1 in the
HKN windfarm site shows a set of elongated depressions, generally oriented NE to SW, and up to 68 m deep (m below LAT,
Fig. 3). These depressions are highly irregular in shape, of varied dimensions (0.5 to 8 km long and up to 1 km wide) and are 195
characterised by steep walls (5-20°), an undulating thalweg and abrupt terminations. U2 infills the depressions and is
characterised by semi-transparent facies and discontinuous sub-parallel reflectors (sf3, Table 1, line A-A’, Fig. 3). A set of
three high-amplitude discontinuous reflectors are commonly observed at the base of U2 (sf4, Table 1), corresponding in the
boreholes to an admixture of clay, silt, sand and gravel (clay-rich diamicton, Fig. 4), and in CPT logs by low cone resistance
values due to the high clay content. The overlying infill corresponds to very dense medium-grained sands, sometimes 200
containing thin laminae of silt and clay (Fugro, 2019). Pollen analyses performed in borehole HKN10 (StrataData, 2019)
indicate relatively high numbers of fern and moss spores and freshwater algae, while tree pollen is low and dominated by
Pinus. Towards the top of U2 (10-12 m in HKN10), moderate numbers of other tree types are also reported, mainly Alnus,
Betula, Corylus and thermophilous Quercus (StrataData, 2019).
Seismic unit U3 corresponds to the depositional package that onlaps U2 and U1. In general, U3 is thin (<5 m) displays a sheet-205
like geometry, and locally thickens above concave-up isolated depressions (e.g. section A-A’ in Fig. 4). Seismic facies of U3
are more distinct on SBP data, displaying parallel, high to medium amplitude reflectors (sf5, Table 1). In boreholes, this unit
mainly corresponds to heterolithic interbedded sands and silty sands with abundant shells and shell fragments. These deposits
are characterised by relatively high numbers of foraminiferal test linings and dinocysts (StrataData, 2019). Where basal
depressions are present, sands overlay dark organic, laminated clayey silts (Fig. 4). Laminated silts recovered at the base of 210
U3 in borehole HKN10 (Fig. 4) are dominated by tree pollen, mainly Quercus, Pinus, Alnus, Corylus and Betula (StrataData,
2019).
4.1.2 Interpretation
The most prominent features in the northern sector of the study area are the deep NE-to-SW trending depressions that truncate
U1 (Figs. 3 and 4). Their abrupt terminations, the rising and falling thalweg, and the lack of connection between the different 215
depressions means they are unlikely to represent a fluvial channel network. Instead, they are consistent with the features of
subglacial meltwater channels and tunnel valleys (Kehew et al., 2012; van der Vegt et al., 2012), which typically form during
https://doi.org/10.5194/esurf-2021-47Preprint. Discussion started: 23 June 2021c© Author(s) 2021. CC BY 4.0 License.
14
phases of ice advance. The disrupted aspect of reflectors from the underlying seismic unit (U1, sf2) is interpreted as
glaciotectonic deformation of the pre-existing deposits due to ice loading (Phillips et al., 2018). The patchy high-amplitude
reflectors found at the base of the subglacial meltwater channel-fills, corresponding to matrix-supported diamicton in the 220
boreholes, are interpreted as glacial tills. These deposits are restricted to the northern sector of HKN and are associated with
the subglacial meltwater channels and their margins.
The upper part of U2 is characterised by a weak acoustic signal and occasionally sub-parallel reflectors, mainly corresponding
to dense fine and medium sands. The freshwater algae content and the dominance of Pinus pollen indicate deposition under
cool or cold conditions in a terrestrial or freshwater setting, although the presence of thermophilous species, such as Quercus, 225
towards the top U2, suggests a progressive transition towards a warmer climate. Given the seismic architecture, these sediments
are likely pro- or subglacial meltwater channel-fills that formed during ice retreat.
Boreholes through U3 are characterised by an increase in marine indicators (shells, dynocysts, foraminifera) and tree
pollen is abundant at the base (e.g. Quercus, StrataData, 2019), indicating mild climatic conditions. Overall, U3 aggrades and
drapes older deposits and is interpreted as coastal and/or marine sediments deposited during marine transgression. 230
4.2 Middle sector of HKN
4.2.1 Description
The middle sector of HKN windfarm shows local intense deformation where the reflectors of U1 are distorted (Fig. 5). In this
area, the top of U1 occurs < 5 m beneath the seafloor. Although the acoustic signal of U1 is weak, some steeply dipping
reflectors (4-15°) are distinguished (sf6, Table 1) that show evidence of intense, southwards verging thrusts (Fig. 5). Mapping 235
this zone of contractional deformation reveals an E-W oriented ridge-like feature denoted by linear topographic highs in the
contour map of S1 (Fig. 3). Seismic profiles through this area (Fig. 2 and 5) revealed that the thrusted ridge is up to 4 km wide,
buried beneath the younger U2 and U3 deposits. Borehole HKN56 is sited on top of this ridge (Fig. 5). Sediments from U1
correspond to laminated sandy clays (from 34 to 39.5 m) with interbedded sand and peat overlain by a thick, massive deposit
of dense, silty-fine sand (from 4 to 34 m, HKN56, Fig. 5). Clay and peat beds appear laterally extensive as they are intersected 240
by several boreholes between 36 and 42 m below the seafloor in the middle of HKN. These beds are highlighted in CPT
https://doi.org/10.5194/esurf-2021-47Preprint. Discussion started: 23 June 2021c© Author(s) 2021. CC BY 4.0 License.

15
profiles by low cone resistance values and a high friction ratio. These clay and peat deposits are found at the base of the
thrusted blocks (Fig. 5), delimiting a ~35 m thick package of deformed strata (Fig. 5).
Figure 5. Stratigraphic sections (multi-channel sparker) through the glacio-tectonic ridge in the middle sector of HKN windfarm 245 area. In seismic section C-C’, the top of the ridge is incised by proglacial meltwater channel fills. Borehole HKN56 was recovered at
https://doi.org/10.5194/esurf-2021-47Preprint. Discussion started: 23 June 2021c© Author(s) 2021. CC BY 4.0 License.

16
the top of the ridge. Only the upper 50 m of the borehole are shown. Cone resistance from a CPT obtained in the same site is displayed
on the side of the borehole and in the seismic profiles. In section D-D’, outwash sediments (outwash fan) prograde inside a shallow
depression incised in the south flank of the ridge. For location of the seismic profiles and the borehole see the inset map (same map
from Fig. 3). Grain size: C – clay, St – silt, fS – fine sand, mS – medium sand, cS – coarse sand, G – gravel. 250
The thrusted ridge segment is truncated at the northern flank by an E-W trending incision at the base of U2 (Figs. 3 and 5).
Here, seismic facies of U2 are of variable amplitude and frequency, generally with onlapping subparallel reflectors (sf7, Table
1). Several phases of incision and infill can be identified (section C-C’, Fig. 5). To the south of the ridge, there is a large E-W-
trending depression (Figs. 3 and 5). However, the base of this depression is mainly sub-horizontal and its relationship with
underlying strata is not clear. This depression is filled by a set of clinoforms with a southwards progradational trend (Fig. 3) 255
that are characterised by medium to high amplitude, oblique-tangential reflectors (sf8, Table 1, Fig. 5). U1 and U2 are overlain
by U3, which in borehole HKN56 corresponds to laminated fine to coarse-grained sands containing abundant bivalve shells
and shell fragments (Fig. 5).
4.2.2 Interpretation
The prominent ridge of thrusted and folded strata (Fig. 3), with highly deformed sediments of U1 preserved a few meters 260
beneath the modern seafloor, is consistent with glaciotectonised sediments marking an ice-sheet advance into this part of HKN.
The glaciotectonised segment is up to 4.5 km wide and glaciotectonic disturbance affects deposits down to 30-40 m below the
seafloor, where the extensive peat and clay layers likely form a basal detachment surface (décollement).
The primary E-W direction of the depression that truncates the north flank of the glaciotectonised unit contrasts with the
dominant NE-SW direction of the subglacial channels identified in the northern sector of the windfarm (Fig. 3). The acoustic 265
character of U2 here is also different, displaying sub-parallel reflectors and a multiphase history of infill (line C-C’, Fig. 5).
Our preferred interpretation is that these incisions are proglacial meltwater channels formed during a phase of ice retreat (post-
glaciotectonic) that were probably filled by glacial outwash sediments as meltwater discharge eroded and reworked the top of
the glaciotectonised ridge and surrounding areas. The interpretation of the depression on the southern side of the glaciotectonic
ridge is less clear. It could correspond to an incision due to the erosive action of meltwater or to a syncline that was overthrusted 270
from the north and later infilled with outwash deposits. The location, morphology, and internal structure of the southward
progradational clinoforms accumulated within this depression supports an interpretation as an outwash fan or a fan-delta that
https://doi.org/10.5194/esurf-2021-47Preprint. Discussion started: 23 June 2021c© Author(s) 2021. CC BY 4.0 License.
17
prograded into a proglacial lake. Glaciotectonised and glaciofluvial deposits in this area are buried by a drape of coastal and
marine sands (U3, Fig. 5), which thickens to the south (Fig. 2), similar to U3 in the northern sector of HKN.
4.3 Southern sector of HKN and the full HKZ windfarm 275
4.3.1 Description
We group the southern sector of HKN windfarm and the whole of the HKZ windfarm area together because of their similarity
in seismo-stratigraphic architecture, which is characterised by the southward thickening of U3 that is directly overlying U1.
U2 is absent and S1 and S2 merge into a single unconformity (Fig. 2). U1 in this sector is generally characterised by more
acoustically stratified facies, although the acoustic return is still weak. Parallel horizontal reflectors of low amplitude and high 280
frequency (sf9, Table 1) are common in the upper part of the unit, while transparent or semi-transparent facies are dominant
at depth (sf1, Fig. 6). Locally in the HKZ windfarm, some discontinuous reflectors of very-high amplitude (sf4) are identified
in U1 (Fig. 7). In the boreholes, the lower part of U1 corresponds to laminated fine- to medium-grained sand containing some
interbedded peat (boreholes HKN72 and HKN70, Fig. 6, and borehole HKZ4-BH04, Fig. 7), while the upper part of U1
comprises laminated fine- to medium-grained sands with some thin laminae of clay, and interbedded sandy clays and silty 285
sands. This is reflected in the CPT response, displaying a highly variable (serrated) cone resistance for interbedded facies.
Pollen analyses of samples from the lower part of U1 in boreholes HKN70, HKN72 and HKZ4-BH04 (StrataData, 2019, 2017)
show a consistent presence of tree pollen, including Pinus, Alnus, Quercus, Ulmus and Tilia, with low to moderate numbers
of non-tree pollen, spores and freshwater algae. Marine content is minimal and may be reworked. In the upper part of U1,
Pinus dominates pollen assemblages, with low to moderate numbers of other tree pollen, non-tree pollen, herbaceous pollen 290
and fern spores. Marine taxa are abundant, including dynocysts (such as Spiniferites spp.) and foraminiferal test linings
(StrataData, 2019, 2017).
https://doi.org/10.5194/esurf-2021-47Preprint. Discussion started: 23 June 2021c© Author(s) 2021. CC BY 4.0 License.
18
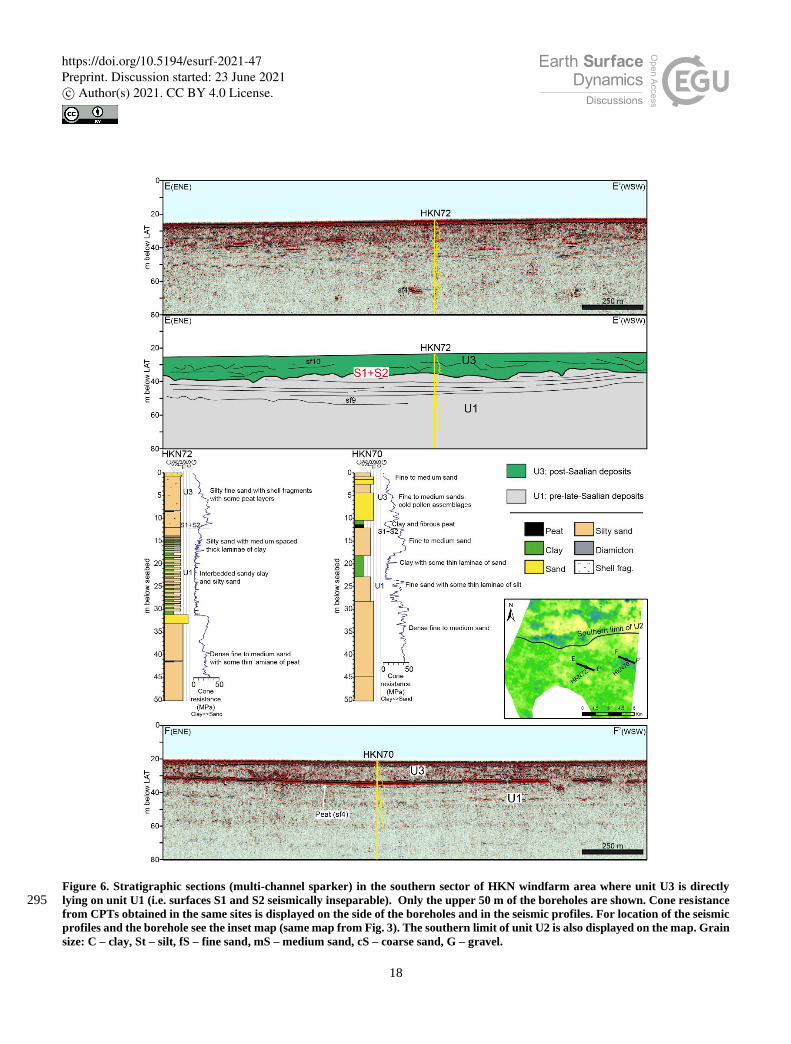
Figure 6. Stratigraphic sections (multi-channel sparker) in the southern sector of HKN windfarm area where unit U3 is directly
lying on unit U1 (i.e. surfaces S1 and S2 seismically inseparable). Only the upper 50 m of the boreholes are shown. Cone resistance 295 from CPTs obtained in the same sites is displayed on the side of the boreholes and in the seismic profiles. For location of the seismic
profiles and the borehole see the inset map (same map from Fig. 3). The southern limit of unit U2 is also displayed on the map. Grain
size: C – clay, St – silt, fS – fine sand, mS – medium sand, cS – coarse sand, G – gravel.
https://doi.org/10.5194/esurf-2021-47Preprint. Discussion started: 23 June 2021c© Author(s) 2021. CC BY 4.0 License.
19
U3 in this sector is characterised by sub-horizontal discontinuous reflectors, generally of low amplitude and variable frequency,
and a sheet-like geometry. A set of 3 to 4 very high amplitude reflectors (sf4) are sometimes observed at the base of U3 (e.g. 300
section F-F’ of Fig. 6, and Fig. 7) and occasionally at shallower depths (e.g. section B-B’, Fig. 7). Several slightly erosive
surfaces truncate reflectors, and channel-like incisions are observed within the unit (Fig. 7). Boreholes in HKN record up to
10 m of laminated fine- to medium-grained sand and silty sand containing some shell fragments (Fig. 6). In HKZ, U3 is thicker
(~25 m in borehole HKN4-BH04) and comprises laminated clays with some thin laminae of sand at the base of the unit, passing
upward to medium-grained sands containing abundant shell fragments (Fig. 7). The very high-amplitude reflectors recorded 305
in the seismic data (sf4) correlate to peat layers of variable (~0.2-2 m) thickness (e.g. in boreholes HKN70 and HKZ4-BH04,
Figs. 6 and 7). Pollen recovered in the clay and peat at the base of U3 (10-12 m in HKN70 and 20-25 m in HKZ4-BH04) are
characterised by an increased presence of tree pollen, with high numbers of Pinus, Quercus, Alnus and Ulmus (StrataData,
2019, 2017). Fern and moss spores are also frequent and marine taxa, such as dynocysts, are minimal but present. In borehole
HKN70, these deposits are overlain by sands dominated by Pinus (StrataData, 2019), which pass upwards to modern shelly 310
marine sands (Fig. 6). Cold and warm tree pollen assemblages alternate up borehole HKZ4-BH04 (10-20 m, StrataData, 2017)
with some intervals of increased reworking and marine influence (Fig. 7).
4.3.2 Interpretation
In this area, both U1 and U3 are characterised by a sheet-like geometry and bounded by a smooth and slightly erosive surface
(S1+S2) without prominent incisions. Deposits of U1 generally display parallel to sub-parallel reflectors. Deposits from the 315
lower part of U1 contain interbedded peat, abundant tree pollen (including Quercus) and minimal marine content, pointing to
deposition in a terrestrial setting under mild climatic conditions. In the upper part, the interbedded sands and clays and the
abundant marine taxa support the interpretation of these deposits as a near-coastal setting, probably deposited under cooler
climatic conditions as the pollen assemblages are dominated by Pinus.
https://doi.org/10.5194/esurf-2021-47Preprint. Discussion started: 23 June 2021c© Author(s) 2021. CC BY 4.0 License.

20
320
Figure 7. Representative seismic profiles showing the stratigraphy underlying the HKZ windfarm site. Section A-A’ corresponds to
a multi-channel sparker line, section B-B’ to a single-channel sparker line. Borehole HKZ4-BH04 illustrates the sedimentological
characteristics of units U1 and U3 in this windfarm. Only the upper 50 m of the borehole are shown. Cone resistance from a CPT
obtained in the same site is displayed on the side of the borehole and in the seismic profiles. For location of the seismic profiles and
the borehole see the inset map. Grain size: C – clay, St – silt, fS – fine sand, mS – medium sand, cS – coarse sand, G – gravel. Vertical 325 dashed line indicates the position where the lines cross each other.
https://doi.org/10.5194/esurf-2021-47Preprint. Discussion started: 23 June 2021c© Author(s) 2021. CC BY 4.0 License.

21
The internal structure of U3, characterised by sub-horizontal reflectors displaying a generally aggrading pattern, indicates that
these sediments were deposited during a phase of increasing accommodation. However, the existence of several internal
erosion surfaces (Fig. 7) suggests that these deposits are not the result of a single phase and point to a complex depositional
history. The cyclicity of the pollen successions and the complicated internal structure, with several intercalated levels of peat 330
and multiple lower-order disconformities (Fig. 7), suggest that this unit probably records multiple glacial-interglacial cycles
of which mainly coastal and shallow marine deposits were preserved.
4.4 Seismo-stratigraphic and lithostratigraphic interpretation
Integration of geophysical and geotechnical datasets offshore the Dutch coast allows identification of a major unconformable
surface (S1) formed by ice-driven erosion. The analysis also points a single glacial episode to have created this glaciogenic 335
unconformity. Connecting to lithostratigraphic and chronostratigraphic frameworks established for the adjacent onshore (Fig.
1), we equate the disconformity S1 to the Drenthe glaciation episode of the Saalian glacial stage (ca. 160 ka; mid MIS 6), in
line with earlier ice-limit studies covering the southern North Sea (Fig. 1, Gibbard et al., 2009; Graham et al., 2011; Joon et
al., 1990; Laban and van der Meer, 2011; Moreau et al., 2012).
U1, which is irregularly truncated by S1, spans deposition up to the Drenthe glaciation. The seismic facies of U1, which is 340
mostly transparent and semi-transparent in nature, but displays low-amplitude sub-parallel reflectors towards the top, suggests
several multiple lithostratigraphic formations. The upper part of U1 is interpreted to correspond to the late Middle Pleistocene
(MIS 7 or older) marine Egmond Ground Fm. (Cameron et al., 1992, 1984; Oele, 1971; Rijsdijk et al., 2005; TNO-GSN, 2021)
given the presence of marine taxa (Figs. 6 and 7). The lower part of U1 likely corresponds to the early Middle Pleistocene
Yarmouth Roads Fm., which is regionally extensive throughout the southern North Sea (Cameron et al., 1984). The Yarmouth 345
Roads Fm. (corresponding to Formation 4.1.1 in Rijsdijk et al., 2005), includes both marine and fluvial facies that mainly
consists of fine or medium-grained non-calcareous sands, with variable clay lamination and local intercalations of reworked
peat (Cameron et al., 1984; Rijsdijk et al., 2005; TNO-GSN, 2021). The weak acoustic character of U1 hinders the clear
identification of a bounding surface between both formations.
U2 is confined to subglacial meltwater channels and proglacial and deglacial outwash complexes, directly overlying the late 350
Saalian glaciogenic unconformity (S1, Fig. 4). Such glacial and glaciofluvial sediments are assigned to the Drenthe Fm., which
https://doi.org/10.5194/esurf-2021-47Preprint. Discussion started: 23 June 2021c© Author(s) 2021. CC BY 4.0 License.

22
includes all glaciogenic deposits of this glaciation episode (Rijsdijk et al., 2005; TNO-GSN, 2021). Till deposits at the base of
U2 correspond to the Gieten Member and the overlying glaciofluvial deposits to the Schaarsbergen Member in this formation
(Rijsdijk et al., 2005; TNO-GSN, 2021). Chronostratigraphically, these sediments accumulated in the middle to late Saalian
(second half of MIS 6); attributed a numeric age from ca. 155 ka onwards following OSL dating in Busschers et al. (2008). 355
This would be time-equivalent with Drenthe-II and Warthe Substages recognised some 250 km to the northeast of our study
area (Elbe estuary and German Bight; e.g. Ehlers and Gibbard, 2004).
U3 comprises a complex internal architecture with several minor-order disconformities. Laminated clays and sands, peat beds,
and modern shelly marine sands are included in this unit. Basal pollen assemblages point to a warm interglacial or interstadial,
dominated by tree pollen with high numbers of Quercus (oak), known to have first re-established in the southern North Sea in 360
the Eemian, which set on considerable time after the Drenthe Substage deglaciation (after 130 ka, within MIS 5e). Fluctuating
pollen assemblages suggest that U3 records more than one climatic cycle. We interpret that deposition of U3 started during
Termination II (MIS 6/5 transition), from the onset of the Eemian interglacial onwards. U3 appears to have recorded climatic
oscillations through the Eemian, the Weichselian and into the Holocene, explaining its complicated internal structure. It is
topped by the modern seafloor. Future detailed analysis of this unit, using higher-resolution seismic profiles, may allow the 365
differentiation of lithostratigraphic formations.
5. Discussion
5.1 Glaciotectonic structures and the maximum late Saalian ice-sheet extent
The sedimentological, seismic stratigraphic and geomorphic analyses performed in the study area revealed the preservation of
a glacial landscape offshore the Dutch coast. It is characterised by the presence of subglacial meltwater channels and a 370
glaciotectonic ridge in HKN, that can be classified as a composite ridge or thrust-block (push) moraine (<100 m or relief, Aber
et al., 1989; Aber and Ber, 2007; Van der Wateren, 2002, 1995, 1985), which are usually associated with proglacial or sub-
marginal glaciotectonics, forming parallel to the ice margins, marking glacier stillstands or readvances (Aber and Ber, 2007;
Benn and Evans, 2010).
https://doi.org/10.5194/esurf-2021-47Preprint. Discussion started: 23 June 2021c© Author(s) 2021. CC BY 4.0 License.

23
Some of the most studied late Saalian composite ridges are found in the onshore Netherlands, at the edges of tongue-shaped 375
glacial basins (Fig. 1), and by comparison are generally large, with a total relief exceeding 200 m. The Veluwe ridge in the
west side of the IJssel glacial basin (Fig. 1) comprises a ~200 m thick package of unconsolidated deformed strata, displaying
staked thrusts close to the ice-contact that transitions into folded strata in the distal areas (Bakker, 2004; Bakker and Van der
Meer, 2003; Van der Wateren, 1995). The structural style of deformation in the Veluwe ridge is different to that found in HKN.
The features mapped in HKN are similar in nature to the thinner (60-80 m) onshore Utrecht Ridge in the southwestern margin 380
of the Amersfoort basin (Fig. 1) (Aber et al., 1989; Aber and Ber, 2007). This ridge is composed of imbricated thrust blocks
of unconsolidated Pleistocene strata striking parallel to the ridge in a package of deformed sediments. The Utrecht ridge is
about 2.5 km wide, displays a plateau top, and is slightly asymmetric in cross profile as the southwestern flank grades into a
sandur outwash complex. According to van der Wateren (1995), the style of glaciotectonic deformation of the Utrecht ridge is
dominated by thrusting. Although the top plateau has been flattened, this is consequence of denudation and erosion, and not 385
due to the ridge being overridden by the ice sheet. If it had been overridden, an overprint of the structural style by subglacial
deformation (compressive and extensional) would be expected (Van der Wateren, 1985). Considering the deformation style
and geomorphology, the ridge in HKN likely represents an ice-marginal position denoting the ice-sheet maximum extent,
similar to the Utrecht ridge.
Similar features are seen in the wider southern North Sea. The dimensions, seismic structure and depth of the ridge in HKN 390
are also comparable to the Weichselian thrust-block moraines described in the Dogger Bank area (Cotterill et al., 2017; Emery
et al., 2019; Phillips et al., 2018) and the Elsterian composite ridges identified in the Dudgeon windfarm offshore north Norfolk,
UK (Mellett et al., 2020). Both cases are examples of well-preserved glaciotectonised packages up to 40-50 m thick (bounded
by a basal detachment surface visible in seismic profiles) composed by thrusted and folded unconsolidated sediments. In the
Dudgeon windfarm and the eastern sector of Dogger Bank, the glaciotectonised sequences form multiple parallel ridges 395
extending over several kilometres, which are interpreted to be the result of active ice-sheet retreat (Mellett et al., 2020; Phillips
et al., 2018). In the western sector of Dogger Bank, there is a single ridge bounding an area of subglacial meltwater channels
and streamlined bedforms (lying to the north of the ridge), interpreted as a terminal thrust-block moraine denoting the
maximum extent of the British-Irish ice sheet during the Weichselian (Emery et al., 2019).
https://doi.org/10.5194/esurf-2021-47Preprint. Discussion started: 23 June 2021c© Author(s) 2021. CC BY 4.0 License.
24
It is reasonable to conclude that the shallow occurrence of U1 in the HKN windfarm occurred in response to thrusting in front 400
of an advancing ice sheet. Given the absence of a clear palaeo ice-sheet signature in sediments preserved further to the south,
this glaciotectonised land system likely records the maximum southernmost position of the late Saalian ice sheet (Fig. 8). This
contrasts with the location of the MIS 6 ice-sheet limit which has previously been mapped ~50 km south, through the central
part of the HKZ (Fig. 8, Joon et al., 1990; Laban, 1995; Laban and van der Meer, 2011), based on indirect evidence observed
in legacy seismic profiles. These mainly comprised of south and west-dipping reflectors imaged a few meters beneath present-405
day seafloor (Joon et al., 1990; Laban, 1995), which were inferred to represent ice-pushed ridges, in continuation to those
present on land (Fig. 1). This interpretation is not supported by the newly acquired geophysical and geotechnical datasets,
which provide higher resolution imaging of the shallow subsurface and show no unequivocal evidence of glaciotectonic
deformation in the HKZ windfarm area (Figs. 2 and 7). Fugro (2017c) also reported a structure in the HKZ windfarm site that
could potentially represent glaciotectonic deformation, a thin package of wavy north dipping reflectors. Upon careful 410
examination of the data, this feature is only visible in a single SCS profile, lacks a minimum lateral continuity (as it is not
present in any of the parallel profiles to the west or the east) and is associated to channel incisions and infills. Therefore, we
cannot confidently attribute this structure to glaciotectonic deformation, as it is not different from any other channel and bars
fills which are locally extensive as part of U1 in HKZ. These channel and bar deposits are probably the same structures
suggested by Joon et al. (1990) and Laban (1995) to represent ice-pushed ridges. 415
Our new mapping (Fig. 8) shows the ice margin in the offshore sector to be more irregular than previously presumed, displaying
a lobate shape similar to the marginal features mapped onshore (Fig. 1). The lobate shape onshore is explained by the influence
of subsurface structural and hydrological conditions, which developed due to contrasting hydraulic conductivities close to the
surface (Van den Berg and Beets, 1987; Van der Wateren, 1995, 1985). The onshore ice-pushed ridges formed in areas covered
by coarse-grained fluvial material, where a fine-grained layer in the lower substratum could act as a basal detachment, while 420
ice flow was channelised through the glacial basins. The distribution of the glacial basins is controlled primarily by deeper
Cenozoic tectonic structures (De Gans et al., 1987; Van der Wateren, 2003). By comparison, no drastic changes in the
subglacial bed conditions are expected offshore, as the underlying Cenozoic stratigraphy in the area is dominated by the sandy
deposits of the Yarmouth Roads Fm. (Cameron et al., 1984; Laban, 1995). The offshore lobate margin shown in Figure 8B is
https://doi.org/10.5194/esurf-2021-47Preprint. Discussion started: 23 June 2021c© Author(s) 2021. CC BY 4.0 License.

25
in part determined by the proposed Saalian margin at the southwestern edge of the comparatively large P/Q-block glacial basin 425
(west of our study area), which was mapped using legacy seismic data (Joon et al., 1990; Laban, 1995).
Figure 8. (A) Conceptual model of the infill (following transgression from MIS 6 to MIS 5e) showing the main glacial
geomorphological features and sediments preserved in Hollandse Kust Noord. (B) Comparison between the previously inferred
maximum Saalian ice sheet extent (dashed line) and the new limit proposed in this study (solid line). Legend and sources as in Fig. 430 1. (C) Bathymetry profile through the Hollandse Kust Noord area highlighting the glacial geomorphological features identified and
the approximate position of the ice front during the maximum ice sheet extent.
We highlight an interesting difference between the ice-push ridges surrounding the glacial basins offshore versus onshore. The
ice-push ridges in HKN windfarm are oriented perpendicular to the P/Q-block basin, whereas onshore in the central
Netherlands, the ridges formed parallel to the basin rims. This suggests a glaciogenic difference in formation processes, 435
particularly of the P/Q-block basin offshore vs. the equally sized Amersfoort and IJssel basins to the east onshore. The current
https://doi.org/10.5194/esurf-2021-47Preprint. Discussion started: 23 June 2021c© Author(s) 2021. CC BY 4.0 License.
26
windfarm data coverage does not allow us to re-evaluate the Saalian margin position through the P/Q-block basin, but given
that new-high resolution geophysical data had led to re-evaluation of the margin position through HKN and HKZ, a similar
analysis may be considered to assess the presence of a lobate margin, and thereby enhance understanding of ice sheet processes.
5.2 The late Saalian glacial and deglacial phases in the southern North Sea 440
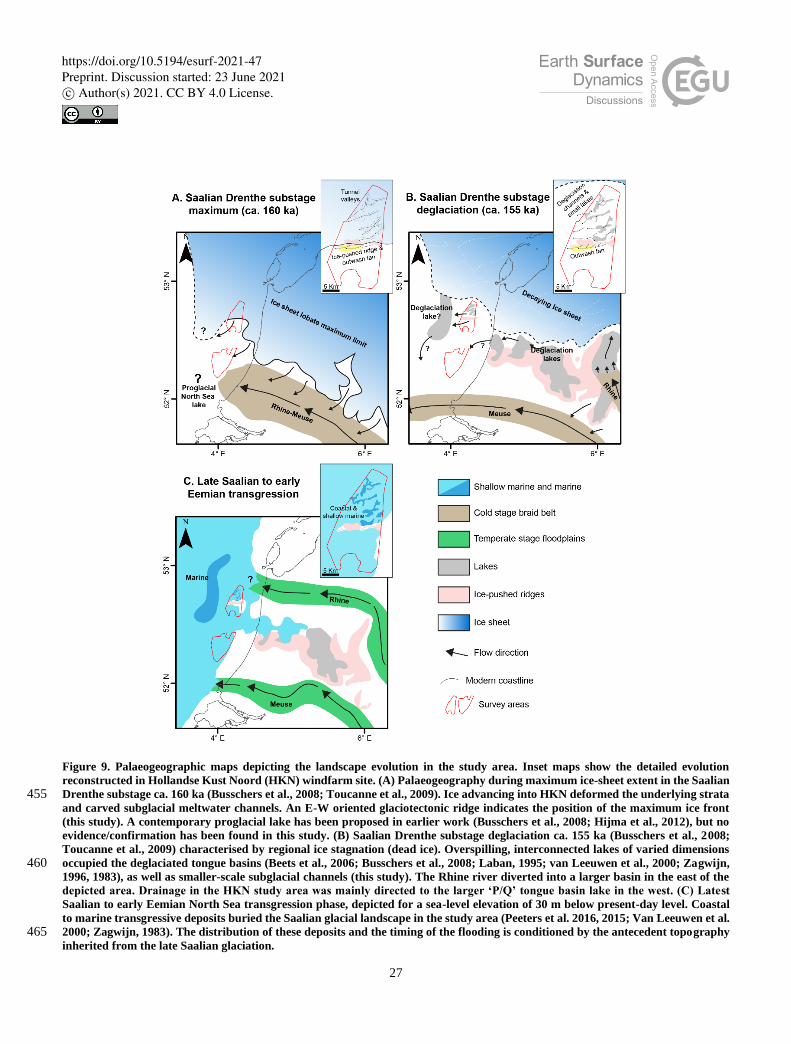
During the Drenthe Substage, Scandinavian ice advanced from Swedish and Baltic sea source areas into northern Germany
and the Netherlands from the ~NE (Ehlers and Gibbard, 2004; Van den Berg and Beets, 1987; Zagwijn, 1973). In the
Netherlands, the ice advance during MIS 6 forced the Rhine-Meuse fluvial system to a southerly (proglacial) position where
it connected with glacio-fluvial (sandur) systems in front of the ice sheet (Busschers et al., 2008). The ice sheet eventually
advanced into the area offshore the Holland coast where it triggered significant erosion, recorded in the HKN windfarm by 445
surface S1 (Figs. 8 and 9A). Over-pressurised subglacial meltwater carved deep V-shaped NE-SW orientated channels beneath
the ice sheet, which are well-preserved in the northern sector of HKN (Figs. 3 and 4), and indicate regional ice advance from
the northeast (Huuse and Lykke-Andersen, 2000; Moreau et al., 2012; van der Vegt et al., 2012). Large-scale glaciotectonic
deformation occurred as the ice sheet pushed into, and overrode, pre-existing sediments leading to the stacking of detached,
thrust-bound sediments (U1) in the middle sector of HKN (Figs. 5 and 8). The southern flank of the glaciotectonic ridge is 450
covered by a proglacial fan of outwash deposits that prograded into the nearby water-filled depression (Figs. 5 and 9A).
https://doi.org/10.5194/esurf-2021-47Preprint. Discussion started: 23 June 2021c© Author(s) 2021. CC BY 4.0 License.
27
Figure 9. Palaeogeographic maps depicting the landscape evolution in the study area. Inset maps show the detailed evolution
reconstructed in Hollandse Kust Noord (HKN) windfarm site. (A) Palaeogeography during maximum ice-sheet extent in the Saalian
Drenthe substage ca. 160 ka (Busschers et al., 2008; Toucanne et al., 2009). Ice advancing into HKN deformed the underlying strata 455 and carved subglacial meltwater channels. An E-W oriented glaciotectonic ridge indicates the position of the maximum ice front
(this study). A contemporary proglacial lake has been proposed in earlier work (Busschers et al., 2008; Hijma et al., 2012), but no
evidence/confirmation has been found in this study. (B) Saalian Drenthe substage deglaciation ca. 155 ka (Busschers et al., 2008;
Toucanne et al., 2009) characterised by regional ice stagnation (dead ice). Overspilling, interconnected lakes of varied dimensions
occupied the deglaciated tongue basins (Beets et al., 2006; Busschers et al., 2008; Laban, 1995; van Leeuwen et al., 2000; Zagwijn, 460 1996, 1983), as well as smaller-scale subglacial channels (this study). The Rhine river diverted into a larger basin in the east of the
depicted area. Drainage in the HKN study area was mainly directed to the larger ‘P/Q’ tongue basin lake in the west. (C) Latest
Saalian to early Eemian North Sea transgression phase, depicted for a sea-level elevation of 30 m below present-day level. Coastal
to marine transgressive deposits buried the Saalian glacial landscape in the study area (Peeters et al. 2016, 2015; Van Leeuwen et al.
2000; Zagwijn, 1983). The distribution of these deposits and the timing of the flooding is conditioned by the antecedent topography 465 inherited from the late Saalian glaciation.
https://doi.org/10.5194/esurf-2021-47Preprint. Discussion started: 23 June 2021c© Author(s) 2021. CC BY 4.0 License.
28
Three phases of Saalian Drenthe ice advance have been postulated in the Netherlands. An earliest ice advance from the NE
invaded the northern Netherlands and reached a stationary ice margin (Rappol et al., 1989), releasing englacial debris that
formed marginal and fluted moraines onshore (Passchier et al., 2010; Van den Berg and Beets, 1987). Advance then
recommenced, and the maximum extent limit across the central Netherlands was reached (i.e. the identified offshore HKN 470
ridge, the tongues carving the Haarlem and Amsterdam basins, the further tongues pushing up the Utrecht and Veluwe ridges,
Figs. 1 and 9A). Besides the geographical position, also the dominant NE-SW direction of the subglacial meltwater channels
preserved in HKN suggests that the ice sheet reached the study area in this main phase of ice advance during MIS 6. To the
east of the study area, a final phase of readvance has followed the main advance, based on large scale NNW-to-SSE fluted till
morphology observed the northeast of the Netherlands (“Hondsrug” ice flow system; Van den Berg and Beets, 1987) and this 475
appears to have exacerbated ice-marginal meltwater routing along the main advance ice margin (Meinsen et al., 2011). An
explanation for this reorganisation in ice flow direction is a proposed change in coalescence of Scandinavian and British ice
in the central North Sea (Ehlers, 1990; Kluiving et al., 1991; Rappol et al., 1989). In the HKN windfarm area, no direct evidence
for change in ice-flow direction appears registered. The glaciotectonic landform preserved in HKN points to a land-based ice
sheet that overrode an exposed North Sea basin floor in a terrestrial setting where outwash deposition dominated. We find no 480
indication in HKN or HKZ of clear water lain deposition, that could mark deposition in a hypothesised proglacial lake at the
time of maximum extent (Busschers et al., 2008; Hijma et al., 2012).
Following ice retreat from HKN, subglacial channels were exposed, trapping fine-grained outwash sediments in bodies of
standing water (U2; fig. 9B). Overspill channels likely connected the different pools and lakes, explaining the channel-like
incisions that are sometimes observed as concave-up reflectors in the upper part of U2 (Fig. 4). In the middle sector of HKN 485
(Fig. 3), outwash channels erode the northern flank of the ice-pushed ridge and, locally, its upper boundary (Fig. 5). The
presence of outwash deposits seems to be restricted to the north and middle sectors of HKN (Fig. 2). Only a diffuse drainage
network can be inferred from mapping surface S1 (Fig. 3), and a few channelised deposits are identified, mainly oriented E-
to-W, near the ice-pushed ridge. These outwash channels may have drained west into the large P/Q-block glacial basin (Joon
et al., 1990; Laban, 1995; Oele, 1971), which with its base at 66 m below sea level likely acted as an effective sink for meltwater 490
and outwash sediments (Fig. 9B). By comparison, in the southern part of HKN and all HKZ, disconformities S1 and S2 are
https://doi.org/10.5194/esurf-2021-47Preprint. Discussion started: 23 June 2021c© Author(s) 2021. CC BY 4.0 License.
29
coincident. It is possible that any outwash deposits here were removed/reworked in the late Saalian/early Eemian; Saalian
glaciofluvial sediments that incorporated into the Eem Fm. have been reported in the southern North Sea (Laban, 1995). Any
glaciofluvial outwash sediments preserved to the south may also be very thin, patchy, and difficult to identify in seismic data.
Ice retreat left an unusual landscape preserved in HKN, characterised by the progressive filling of ice-advance and glacio-495
fluvial drainage depressions (Fig. 3). Passchier et al. (2010) proposed a model of rapid ice retreat because of ice streaming in
developing phases of deglaciation (i.e. from ca. 155 ka onwards in the southern North Sea) based upon the presence of
meltwater channels incised into the floors of glacial troughs in the southern North Sea. The Hondsrug phase evidence
mentioned above could alternatively be explained in this way too. Geomorphological evidence for ice streaming (Stokes and
Clark, 1999; Winsborrow et al., 2010) is absent in the HKN area and there is only evidence of main phase ice margin stagnation. 500
Subglacial topography is also one of the strongest controlling factors that determine the location of ice streams, as topographic
focusing favour fast ice flow (Stokes and Clark, 1999; Winsborrow et al., 2010). The general topography in the study area is
relatively flat, varying between 30 and 40 m (bLAT), and does not display a preferential slope direction (Figs. 3 and 8C),
therefore restricting the ability for ice to flow quickly. The presence of dead ice also likely hindered development of a clear
drainage network and favoured the formation of pools and small deglacial lakes that were progressively filled by fine outwash 505
sediments as the ice melted. Beets and Beets (2003) analysed the deposits preserved in a deglaciation lake in the onshore
Amsterdam Basin, which include materials produced during the early phases of deglaciation. They proposed sustained
presence of extensive dead-ice fields during the late Saalian to explain the severe winters recorded in lake varves. Rappol et
al. (1989) also suggested that the (Saalian) ice sheet in the North Sea to have become stagnated once ice streaming in the
Norwegian Channel switched on (Sejrup et al., 2003) and disconnected the southwest sector of the ice sheet (i.e. the southern 510
North Sea) from its source. Although the detailed dynamics of ice-sheet retreat are unknown, ice stagnation in this area seems
to have been extensive, suggesting the ice progressively thinned and disintegrated at this location.
5.3 The post Saalian landscape
The Saalian glaciation episode in the southern North Sea creates an inherited topography that influenced subsequent landscape
evolution (Fig. 9C). Onshore, the Last Interglacial (Eemian) Rhine River invaded the IJssel glacial basin and advanced further 515
to the north as the ice sheet retreated, finally draining into the modern North Sea approximately northwest of HKN (Fig. 9C,
https://doi.org/10.5194/esurf-2021-47Preprint. Discussion started: 23 June 2021c© Author(s) 2021. CC BY 4.0 License.
30
Busschers et al., 2008, 2007; Peeters et al., 2016). Some of the tongue-shaped basins onshore form isolated depressions that
turned into large lakes, and subsequently brackish lagoons as the sea progressively inundated the terrestrial landscape (Beets
and Beets, 2003; Beets et al., 2006; van Leeuwen et al., 2000). The influence of the antecedent topography is observed in our
study area by the spatial distribution of U3, reflecting the depth and relief of S1 and the glacial-fluvial deposits (U2). U3 is 520
thicker to the south, where S1+S2 are deeper, displaying a complex internal structure and high variability of facies. However,
it thins northward where glaciofluvial deposits and glaciotectonic ridges are preserved at shallow depths beneath the seafloor
(Fig. 2). The influence of the antecedent topography is also reflected at a finer scale; for example, U3 in the northern sector of
HKN is thicker where it directly overlies the deeper sections of the subglacial meltwater channels (Fig. 4). Future studies of
the Eemian and younger sediments (which in this paper are grouped into U3 for simplicity) must consider the underlying 525
Saalian landscape.
5.4 Implications of using windfarm data for palaeogeographic reconstructions
The high-density grid of seismic reflection data available from these new offshore windfarms permits detailed 3D mapping
and investigation of preserved palaeo-landscapes. Careful evaluation of new datasets collected in HKN and HKZ reveals a
buried glacial landscape that allows us to identify the limit of the maximum Saalian ice advance in this region ~50 km north 530
of where it was previously inferred (Fig. 8B). Large ice-pushed ridges were systematically included in previous
palaeogeographic reconstructions, but the new data revealed the absence of evidence to support such interpretation,
highlighting the need to revise palaeogeographic reconstructions using legacy seismic reflection data. As new high-quality
data from windfarms in the North Sea is released and evaluated, large areas are being reinterpreted, which greatly improve our
understanding of their geological evolution (e.g. Cotterill et al., 2017; Eaton et al., 2020; Emery et al., 2019; Mellett et al., 535
2020). The complexity of the near-surface geology of the North Sea is becoming evident. Major changes in the sediment
properties occur at meter scale and caution should be taken when using legacy seismic reflection data to evaluate potential
offshore windfarm sites.
Our new reconstruction of the late Saalian (MIS 6) glaciation ice limit places it closer to the inferred Elsterian (MIS 12 and/or
10) ice-sheet limit in this sector of the southeastern North Sea Basin (Fig. 1). The new high-resolution data acquired to support 540
windfarm development also shows a new level of detail on the seismic and lithological characteristics of the near-surface
https://doi.org/10.5194/esurf-2021-47Preprint. Discussion started: 23 June 2021c© Author(s) 2021. CC BY 4.0 License.
31
geology, which permits better characterisation of late Quaternary glacial and interglacial sediments, allowing us to distinguish
between the Elsterian and Saalian glaciations. This detail will allow development of a more robust stratigraphic framework
enabling basin-wide correlation with areas that have a strong chronological control. High-resolution offshore windfarm data
has permitted us to better understand the distribution of the late Saalian glaciogenic and glaciofluvial deposits, which is critical 545
to understanding the transgression of the North Sea Basin during the late Saalian/early Eemian, the influence on the distribution
of depositional environments, and the preservation potential of palaeogeographical and palaeoclimatological archives.
6. Conclusions
Using a dense grid of high-resolution seismic reflection data acquired to support the development of offshore windfarms, we
present sedimentological, seismic stratigraphic and geomorphic analyses of a preserved glacial landscape buried in late 550
Quaternary sediments, offshore the Netherlands. The data record a major glaciogenic unconformity generated by ice-driven
erosion during the later Drenthe glaciation of the Saalian glacial stage (mid MIS 6). Ice-sheet advance and retreat eroded and
deformed the underlying strata, which resulted in a complex ice-marginal landform assemblage. A set of NE-SW oriented
subglacial channels indicate that the ice likely advanced into the study area from the NE during the main advance of Saalian
land ice in this region. Till deposits are widespread in and around the subglacial channels. We interpret the large E-W 555
composite ridge of glaciotectonised strata observed in the middle sector of the study area is as a terminal glacial moraine based
on its structural style and preservation and the lack of evidence for ice advance any further south, refining the ice limit ~50 km
north of its previously mapped position. Our mapping identifies a lobate shape to the ice margin, which is a consequence of
contrasting subglacial bed conditions.
Following ice retreat, subglacial channels were exposed and turned into pools and small lakes, trapping fine-grained outwash 560
sediments (Schaarsbergen Member of the Drenthe Fm.), with a diffuse drainage network of outwash channels identified from
seismic mapping. The net direction of outwash is to the west or the southwest, towards a glacial basin to the west. We suggest
that the preserved landscape assemblage is indicative of ice margin stagnation above a low relief landscape, probably regionally
extensive in the southern North Sea. Subglacial topography may have exerted a strong control during the deglaciation phase –
explaining the stagnant remnant ice in our offshore study area and the nearby onshore (tongue basins of the Netherlands), 565
https://doi.org/10.5194/esurf-2021-47Preprint. Discussion started: 23 June 2021c© Author(s) 2021. CC BY 4.0 License.
32
contemporary with perceived ice streaming further north (central North Sea) and northeast (Hondsrug flutes and Drenthe-II
readvance margins in German Bight). The relatively horizontal and flat subglacial topography in the study area may have
favoured the development of a stagnant ice margin where the ice progressively disintegrated and melted. This reconstructed
MIS 6 ice marginal extent is a valuable addition to the reconstruction of the European ice sheet during MIS 6.
Data availability 570
Geophysical surveys of the HKN and HKZ windfarm development areas were carried out by Fugro between 2016 and 2018
on behalf of The Netherlands Enterprise Agency (RVO). The datasets generated during these surveys are publicly available
and stored by RVO (www.offshorewind.rvo). These datasets are licensed under Creative Commons 4.0 CC-BY-SA.
Author contribution
VC undertook the research and wrote the article. NLMB, DMH, FSB, KMC, BLMM and WPK provided input on the article 575
and supported the original research.
Competing interests
The authors declare that they have no conflict of interest.
Funding
This project has received funding from the European Research Council (ERC) under the European Union’s Horizon 2020 580
research and innovation programme (grant agreement No 802281).
Acknowledgements
This paper forms a contribution to the ERC-funded RISeR project. We thank the Netherlands Enterprise Agency (RVO) for
providing the data used in this study free of charge, licensed under Creative Commons 4.0 CC-BY-SA. We also like to thank
Keith Richards (KrA Stratigraphic) for fruitful discussions regarding the pollen data. The authors acknowledge PALSEA, a 585
https://doi.org/10.5194/esurf-2021-47Preprint. Discussion started: 23 June 2021c© Author(s) 2021. CC BY 4.0 License.
33
working group of the International Union for Quaternary Sciences (INQUA) and Past Global Changes (PAGES), which in
turn received support from the Swiss Academy of Sciences and the Chinese Academy of Sciences.
References
Aber, J. S. and Ber, A.: Chapter 5 Composite ridges, in: Glaciotectonism, Developments in Quaternary Sciences, Volume 6,
edited by Aber, J.S. and Ber, A., Elsevier Ltd, 59–82, doi:10.1016/S1571-0866(07)80073-X, 2007. 590
Aber, J. S., Croot, D. G., and Fenton, M. M.: Glaciotectonic Landforms and Structures, Springer, Dordrecht, Netherlands,
doi:10.1007/978-94-015-6841-8, 1989.
Alley, R. B., Andrews, J. T., Brigham-Grette, J., Clarke, G. K. C., Cuffey, K. M., Fitzpatrick, J. J., Funder, S., Marshall, S. J.,
Miller, G. H., Mitrovica, J. X., Muhs, D. R., Otto-Bliesner, B. L., Polyak, L., and White, J. W. C.: History of the Greenland
Ice Sheet: paleoclimatic insights, Quat. Sci. Rev., 29, 1728–1756, doi:10.1016/j.quascirev.2010.02.007, 2010. 595
Anderson, J. B., Shipp, S. S., Lowe, A. L., Wellner, J. S., and Mosola, A. B.: The Antarctic Ice Sheet during the Last Glacial
Maximum and its subsequent retreat history: A review, Quat. Sci. Rev., 21, 49–70, doi:10.1016/S0277-3791(01)00083-X,
2002.
Arfai, J., Franke, D., Lutz, R., Reinhardt, L., Kley, J., and Gaedicke, C.: Rapid Quaternary subsidence in the northwestern
German North Sea, Sci. Rep., 8, 11524, doi:10.1038/s41598-018-29638-6, 2018. 600
Bakker, M. A. J.: The internal structure of Pleistocene push moraines. A multidisciplinary approach with emphasis on ground-
penetrating radar., Queen Mary, University of London, 180 pp., 2004.
Bakker, M. A. J. and Van der Meer, J. J. M.: Structure of a Pleistocene push moraine revealed by GPR: The eastern Veluwe
Ridge, the Netherlands, Geol. Soc. Spec. Publ., 211, 143–151, doi:10.1144/GSL.SP.2001.211.01.12, 2003.
Van Balen, R. T., Houtgast, R. F., and Cloetingh, S. A. P. L.: Neotectonics of the Netherlands: A review, Quat. Sci. Rev., 24, 605
439–454, doi:10.1016/j.quascirev.2004.01.011, 2005.
Barlow, N. L. M., McClymont, E. L., Whitehouse, P. L., Stokes, C. R., Jamieson, S. S. R., Woodroffe, S. A., Bentley, M. J.,
Callard, S. L., Cofaigh, C., Evans, D. J. A., Horrocks, J. R., Lloyd, J. M., Long, A. J., Margold, M., Roberts, D. H., and
Sanchez-Montes, M. L.: Lack of evidence for a substantial sea-level fluctuation within the Last Interglacial,
doi:10.1038/s41561-018-0195-4, 2018. 610
Batchelor, C. L., Margold, M., Krapp, M., Murton, D. K., Dalton, A. S., Gibbard, P. L., Stokes, C. R., Murton, J. B., and
Manica, A.: The configuration of Northern Hemisphere ice sheets through the Quaternary, Nat. Commun., 10, 3713–3713,
doi:10.1038/s41467-019-11601-2, 2019.
Beets, C. . and Beets, D. J.: A high resolution stable isotope record of the penultimate deglaciation in lake sediments below
the city of Amsterdam, The Netherlands, Quat. Sci. Rev., 22, 195–207, doi:10.1016/S0277-3791(02)00089-6, 2003. 615
https://doi.org/10.5194/esurf-2021-47Preprint. Discussion started: 23 June 2021c© Author(s) 2021. CC BY 4.0 License.

34
Beets, D. J., Beets, C. J., and Cleveringa, P.: Age and climate of the late Saalian and early Eemian in the type-area, Amsterdam
basin, The Netherlands, Quat. Sci. Rev., 25, 876–885, doi:10.1016/j.quascirev.2005.10.001, 2006.
Benn, D. and Evans, D. J. A.: Glaciers and Glaciation, 2nd edition, Routledge, London, doi:10.4324/9780203785010, 2010.
Van den Berg, M. W. and Beets, D.: Saalian glacial deposits and morphology in the Netherlands., in: Tills and Glaciotectonics,
edited by: Meer, J. J. M. van der, A.A. Balkema, Rotterdam., 235.251, 1987. 620
Busschers, F. S., Kasse, C., van Balen, R. T., Vandenberghe, J., Cohen, K. M., Weerts, H. J. T., Wallinga, J., Johns, C.,
Cleveringa, P., and Bunnik, F. P. M.: Late Pleistocene evolution of the Rhine-Meuse system in the southern North Sea basin:
imprints of climate change, sea-level oscillation and glacio-isostacy, Quat. Sci. Rev., 26, 3216–3248,
doi:10.1016/j.quascirev.2007.07.013, 2007.
Busschers, F. S., Van Balen, R. T., Cohen, K. M., Kasse, C., Weerts, H. J. T., Wallinga, J., and Bunnik, F. P. M.: Response of 625
the Rhine-Meuse fluvial system to Saalian ice-sheet dynamics, Boreas, 37, 377–398, doi:10.1111/j.1502-3885.2008.00025.x,
2008.
Cameron, T. D. J., Laban, C., and Schüttenhelm, R. T. E.: Flemish Bight. Sheet 52oN/02oE. Quaternary Geology, 1:250000
series., 1984.
Cameron, T. D. J., Crosby, A., Balson, P. S., Jeffery, D. H., Lott, G. K., Bulat, J., and Harrison, D. J.: United Kingdom Offshore 630
Regional Report: The Geology of the southern North Sea., London, 170 pp., 1992.
Carlson, A. E. and Clark, P. U.: Ice sheet sources of sea level rise and freshwater discharge during the last deglaciation, Rev.
Geophys., 50, doi:10.1029/2011RG000371, 2012.
Caston, V. N. D.: The Quaternary Sediments of the North Sea, Elsevier Oceanogr. Ser., 24, 195–196, doi:10.1016/S0422-
9894(08)71349-7, 1979. 635
Clark, P. U. and Huybers, P.: Global change: Interglacial and future sea level, Nature, 462, 856-857, doi:10.1038/462856a,
2009.
Cotterill, C. J., Phillips, E., James, L., Forsberg, C. F., Tjelta, T. I., Carter, G., and Dove, D.: The evolution of the Dogger
Bank, North Sea: A complex history of terrestrial, glacial and marine environmental change, Quat. Sci. Rev., 171, 136–153,
doi:10.1016/j.quascirev.2017.07.006, 2017. 640
Dendy, S., Austermann, J., Creveling, J. R., and Mitrovica, J. X.: Sensitivity of Last Interglacial sea-level high stands to ice
sheet configuration during Marine Isotope Stage 6, Quat. Sci. Rev., 171, 234–244, doi:10.1016/j.quascirev.2017.06.013, 2017.
Dutton, A., Carlson, A. E., Long, A. J., Milne, G. A., Clark, P. U., DeConto, R., Horton, B. P., Rahmstorf, S., and Raymo, M.
E.: Sea-level rise due to polar ice-sheet mass loss during past warm periods, Science, 349, aaa4019,
doi:10.1126/science.aaa4019, 2015. 645
Eaton, S. J., Hodgson, D. M., Barlow, N. L. M., Mortimer, E. J., and Mellett, C. L.: Palaeogeographic changes in response to
glacial-interglacial cycles, as recorded in Middle and Late Pleistocene seismic stratigraphy, southern North Sea - White Rose
Research Online, J. Quat. Sci., 35, 760-775, doi: 10.1002/jqs.3230, 2020.
https://doi.org/10.5194/esurf-2021-47Preprint. Discussion started: 23 June 2021c© Author(s) 2021. CC BY 4.0 License.

35
Ehlers, J.: Reconstructing the dynamics of the North-west European Pleistocene ice sheets, Quat. Sci. Rev., 9, 71–83,
doi:10.1016/0277-3791(90)90005-U, 1990. 650
Ehlers, J. and Gibbard, P. L. (Eds.): Quaternary Glaciations - Extent and Chronology. part I: Europe., Elsevier, Amsterdam,
488 pp., 2004.
Emery, A. R., Hodgson, D. M., Barlow, N. L. M., Carrivick, J. L., Cotterill, C. J., and Phillips, E.: Left High and Dry:
Deglaciation of Dogger Bank, North Sea, Recorded in Proglacial Lake Evolution, Front. Earth Sci., 7, 1–27,
doi:10.3389/feart.2019.00234, 2019. 655
Fugro: Geophysical Site Investigation Survey. Hollandse Kust (zuid) Wind Farm Development Zone Wind Farm Site I. Report
No. GH176-R1., 2016q.
Fugro: Geophysical Site Investigation Survey. Hollandse Kust (zuid) Wind Farm Development Zone Wind Farm Site II. Report
No. GH176-R2., 2016b.
Fugro: Geophysical Site Investigation Survey. Hollandse Kust (zuid) Wind Farm Development Zone Wind Farm Site III. 660
Report No. GH176-R3., 2016c.
Fugro: Geophysical Site Investigation Survey. Hollandse Kust (zuid) Wind Farm Development Zone Wind Farm Site IV.
Report No. GH176-R4., 2016d.
Fugro: Geotechnical Report. Investigation Data. Geotechnical Borehole Locations, Wind Farm Site I, Hollandse Kust (zuid)
Wind Farm Zone, Dutch Sector, North Sea. Report No. N6196/01. Issue 4., 2016e. 665
Fugro: Geotechnical Report. Investigation Data. Geotechnical Borehole Locations, Wind Farm Site II, Hollandse Kust (zuid)
Wind Farm Zone, Dutch Sector, North Sea. Report No. N6196/03. Issue 4., 2016f.
Fugro: Geophysical Site Investigation Survey. Hollandse Kust (noord) Wind Farm Zone Survey 2017. Report No. GH216-
R3., 2017a.
Fugro: Geotechnical Report. Investigation Data. Geotechnical Borehole Locations, Wind Farm Site III, Hollandse Kust (zuid) 670
Wind Farm Zone, Dutch Sector, North Sea. Report No. N6196/05. Issue 4., 2017b.
Fugro: Geotechnical Report. Investigation Data. Geotechnical Borehole Locations, Wind Farm Site IV, Hollandse Kust (zuid)
Wind Farm Zone, Dutch Sector, North Sea. Report No. N6196/07. Issue 3., 2017c.
Fugro: Geological Ground Model. Wind farm Site III. Hollandse Kust (zuid) Wind Farm Zone, Dutch Sector, North Sea.
Report No. N6196/11. Issue 2., 2017d. 675
Fugro: Geotechnical Report. Investigation Data. Geotechnical Borehole Locations Hollandse Kust (noord) Wind Farm Zone,
Dutch Sector, North Sea. Report No. P903749/02. Issue 6., 2019.
Gandy, N., Gregoire, L. J., Ely, J. C., Cornford, S. L., Clark, C. D., and Hodgson, D. M.: Collapse of the last Eurasian Ice
Sheet in the North Sea modulated by combined processes of ice flow, surface melt, and marine ice sheet instabilities, J.
Geophys. Res. Earth Surf., 126, e2020JF005755, doi:10.1029/2020JF005755, 2020. 680
De Gans, W., De Groot, T., and Zwaan, H.: The Amsterdam basin, a case study of a glacial basin in The Netherlands., in: Tills
and Glaciotectonics, edited by: van der Meer, J. J. M., Bakelma, Rotterdam, The Netherlands, 205–216, 1987.
https://doi.org/10.5194/esurf-2021-47Preprint. Discussion started: 23 June 2021c© Author(s) 2021. CC BY 4.0 License.
36
Gibbard, P. L. and Clark, C. D.: Pleistocene Glaciation Limits in Great Britain, Dev. Quat. Sci., 15, 75–93,doi:10.1016/B978-
0-444-53447-7.00007-6, 2011.
Gibbard, P. L., Pasanen, A. H., West, R. G., Lunkka, J. P., Boreham, S., Cohen, K. M., and Rolfe, C.: Late Middle Pleistocene 685
glaciation in East Anglia, England, Boreas, 38, 504–528, doi:10.1111/j.1502-3885.2009.00087.x, 2009.
Gilford, D. M., Ashe, E. L., DeConto, R. M., Kopp, R. E., Pollard, D., and Rovere, A.: Could the Last Interglacial Constrain
Projections of Future Antarctic Ice Mass Loss and Sea‐Level Rise?, J. Geophys. Res. Earth Surf., 125, e2019JF005418,
doi:10.1029/2019jf005418, 2020.
Glennie, K. W. and Underhill, J. R.: Origin, Development and Evolution of Structural Styles, in: Petroleum Geology of the 690
North Sea; Basic Concepts and Recent Advances: Fourth Edition, edited by: Glennie, K.W., Blackwell Science Ltd, Oxford,
UK, 42–84, doi:10.1002/9781444313413.ch2, 2009.
Graham, A. G. C., Stoker, M. S., Lonergan, L., Bradwell, T., and Stewart, M. A.: The Pleistocene Glaciations of the North Sea
Basin, Dev. Quat. Sci., 15, 261–278, doi:10.1016/B978-0-444-53447-7.00021-0, 2011.
Hanna, E., Pattyn, F., Navarro, F., Favier, V., Goelzer, H., van den Broeke, M. R., Vizcaino, M., Whitehouse, P. L., Ritz, C., 695
Bulthuis, K., and Smith, B.: Mass balance of the ice sheets and glaciers – Progress since AR5 and challenges, Boreas, 47, 202-
224 doi:10.1016/j.earscirev.2019.102976, 2020.
Harrison, S. P., Bartlein, P. J., Izumi, K., Li, G., Annan, J., Hargreaves, J., Braconnot, P., and Kageyama, M.: Evaluation of
CMIP5 palaeo-simulations to improve climate projections, Nature Climate Change, 5, 735-743, doi:10.1038/nclimate2649,
2015. 700
Hijma, M. P., Cohen, K. M., Roebroeks, W., Westerhoff, W. E., and Busschers, F. S.: Pleistocene Rhine-Thames landscapes:
geological background for hominin occupation of the southern North Sea region, J. Quat. Sci., 27, 17–39,
doi:10.1002/jqs.1549, 2012.
Huuse, M. and Lykke-Andersen, H.: Overdeepened Quaternary valleys in the eastern Danish North Sea: Morphology and
origin, Quat. Sci. Rev., 19, 1233–1253, doi:10.1016/S0277-3791(99)00103-1, 2000. 705
Joon, B., Laban, C., and Meer, J. J. M.: The Saalian glaciation in the North Sea, Geol. en Mijnb., 69, 151–158, 1990.
Kehew, A. E., Piotrowski, J. A., and Jørgensen, F.: Tunnel valleys: Concepts and controversies - A review, Earth-Science
Rev., 113, 33–58, doi:10.1016/j.earscirev.2012.02.002, 2012.
Kleman, J., Httestrand, C., Stroeven, A. P., Jansson, K. N., De Angelis, H., and Borgstrm, I.: Reconstruction of Palaeo-Ice
Sheets - Inversion of their Glacial Geomorphological Record, in: Glacier Science and Environmental Change, edited by: 710
Knight, P.G., Blackwell Publishing, Malden, MA, USA, 192–198, doi:10.1002/9780470750636.ch38, 2007.
Kluiving, S. J., Rappol, M., and Wateren, D. van der: Till stratigraphy and ice movements in eastern Overijssel, The
Netherlands, Boreas, 20, 193–205, doi:10.1111/j.1502-3885.1991.tb00150.x, 1991.
Knox, R. W. O. B., Bosch, J. H. A., Rasmussen, E. S., Heilmann-Clausen, C., Hiss, M., De Lugt, I. R., Kasińksi, J., King, C.,
Köthe, A., Słodkowska, B., Standke, G., and Vandenberghe, N.: Chapter 12 Cenozoic, in: Petroleum Geologial Atlas of the 715
https://doi.org/10.5194/esurf-2021-47Preprint. Discussion started: 23 June 2021c© Author(s) 2021. CC BY 4.0 License.
37
Southern Permian basin Area, edited by: Doornenbal, J. C. and Stevenson, A. G., EAGE Publications b.v., Houten, 211–223,
2010.
Kuhlmann, G.: High Resolution Stratigraphy and Paleoenvironmental Changes in the Southern North Sea during the Neogene
— an Integrated Study of Late Cenozoic Marine Deposits from the Northern Part of the Dutch Offshore Area, Utrecht
University, 205 pp., 2004. 720
Laban, C.: The Pleistocene glaciations in the Dutch sector of the North Sea. A synthesis of sedimentary and seismic data.,
University of Amsterdam, 194 pp., 1995.
Laban, C. and van der Meer, J. J. M.: Pleistocene glaciation in The Netherlands, Dev. Quat. Sci., 15, 247–260,
doi:10.1016/B978-0-444-53447-7.00020-9, 2011.
Lamb, R. M., Harding, R., Huuse, M., Stewart, M., and Brocklehurst, S. H.: The early quaternary north sea basin, J. Geol. Soc. 725
London., 175, 275–290, doi:10.1144/jgs2017-057, 2018.
Lauer, T. and Weiss, M.: Timing of the Saalian- A nd Elsterian glacial cycles and the implications for Middle-Pleistocene
hominin presence in central Europe, Sci. Rep., 8, 1–13, doi:10.1038/s41598-018-23541-w, 2018.
Lee, J. R., Busschers, F. S., and Sejrup, H. P.: Pre-Weichselian Quaternary glaciations of the British Isles, The Netherlands,
Norway and adjacent marine areas south of 68°N: Implications for long-term ice sheet development in northern Europe, Quat. 730
Sci. Rev., 44, 213–228, doi:10.1016/j.quascirev.2010.02.027, 2012.
van Leeuwen, R. J. W., Beets, D. J., Bosch, J. H. A., Burger, A. W., Cleveringa, P., van Harten, D., Herngreen, G. F. W., Kruk,
R. W., Langereis, C. G., Meijer, T., Pouwer, R., and de Wolf, H.: Stratigraphy and integrated facies analysis of the Saalian
and Eemian sediments in the Amsterdam-Terminal borehole, the Netherlands, Netherlands J. Geosci., 79, 161–196,
doi:10.1017/S0016774600023647, 2000. 735
Meinsen, J., Winsemann, J., Weitkamp, A., Landmeyer, N., Lenz, A., and Dölling, M.: Middle Pleistocene (Saalian) lake
outburst floods in the Münsterland Embayment (NW Germany): Impacts and magnitudes, Quat. Sci. Rev., 30, 2597–2625,
doi:10.1016/j.quascirev.2011.05.014, 2011.
Mellett, C. L., Hodgson, D. M., Plater, A. J., Mauz, B., Selby, I., and Lang, A.: Denudation of the continental shelf between
Britain and France at the glacial–interglacial timescale, Geomorphology, 203, 79–96, doi:10.1016/j.geomorph.2013.03.030, 740
2013.
Mellett, C. L., Phillips, E., Lee, J. R., Cotterill, C. J., Tjelta, T. I., James, L., and Duffy, C.: Elsterian ice-sheet retreat in the
southern North Sea: antecedent controls on large-scale glaciotectonics and subglacial bed conditions, Boreas, 49, 129–151,
doi:10.1111/bor.12410, 2020.
Mitchum, R. M. J.: Seismic Stratigraphy and Global Changes of Sea Level, Part 11: Glossary of Terms used in Seismic 745
Stratigraphy, in: Seismic Stratigraphy – Applications to Hydrocarbon Exploration, American Association of Petroleum
Geologists Memoir 26, edited by: Payton, C. E., American Association of Petroleum Geologists, 135–144, doi:
10.1306/M26490C13, 1977.
https://doi.org/10.5194/esurf-2021-47Preprint. Discussion started: 23 June 2021c© Author(s) 2021. CC BY 4.0 License.

38
Mitchum, R. M. J. and Vail, P. R.: Seismic Stratigraphy and Global Changes of Sea Level, Part 7: Seismic Stratigraphic
Interpretation Procedure, in: Seismic Stratigraphy – Applications to Hydrocarbon Exploration, American Association of 750
Petroleum Geologists Memoir 26, edited by: Payton, C. E., American Association of Petroleum Geologists , doi:
10.1306/M26490C9, 135–144, 1977.
Mitchum, R. M. J., Vail, P. R., and Samgree, J. B.: Seismic Stratigraphy and Global Changes of Sea Level, Part 6: Stratigraphic
interpretation of seismic reflections patterns in depositional sequences, in: Seismic Stratigraphy – Applications to Hydrocarbon
Exploration, American Association of Petroleum Geologists Memoir 26, edited by: Payton, C. E., American Association of 755
Petroleum Geologists, doi: 10.1306/M26490C8, 117–133, 1977.
Moreau, J., Huuse, M., Janszen, A., Vegt, V. Der, Gibbard, P. L., and Moscariello, A.: The glaciogenic unconformity of the
southern North Sea, Geol. Soc. Spec. Publ., 368, 99–110, doi:10.1144/SP368.5, 2012.
Oele, E.: The Quaternary geology of the southern area of the Dutch part of the North Sea., Geol. en Mijnbouw/Netherlands J.
Geosci., 50, 461–474, 1971. 760
Otto-Bliesner, B. L., Rosenbloom, N., Stone, E. J., Mckay, N. P., Lunt, D. J., Brady, E. C., and Overpeck, J. T.: How warm
was the last interglacial? new model-data comparisons, Philos. Trans. R. Soc. A Math. Phys. Eng. Sci., 371,
doi:10.1098/rsta.2013.0097, 2013.
Passchier, S., Laban, C., Mesdag, C. S., and Rijsdijk, K. F.: Subglacial bed conditions during Late Pleistocene glaciations and
their impact on ice dynamics in the southern North Sea, Boreas, 39, 633–647, doi:10.1111/j.1502-3885.2009.00138.x, 2010. 765
Peeters, J., Busschers, F. S., and Stouthamer, E.: Fluvial evolution of the Rhine during the last interglacial-glacial cycle in the
southern North Sea basin: A review and look forward, Quat. Int., 357, 176–188, doi:10.1016/j.quaint.2014.03.024, 2015.
Peeters, J., Busschers, F. S., Stouthamer, E., Bosch, J. H. A., Van den Berg, M. W., Wallinga, J., Versendaal, A. J., Bunnik,
F. P. M., and Middelkoop, H.: Sedimentary architecture and chronostratigraphy of a late Quaternary incised-valley fill: A case
study of the late Middle and Late Pleistocene Rhine system in the Netherlands, Quat. Sci. Rev., 131, 211–236, 770
doi:10.1016/j.quascirev.2015.10.015, 2016.
Phillips, E., Cotterill, C., Johnson, K., Crombie, K., James, L., Carr, S., and Ruiter, A.: Large-scale glacitectonic deformation
in response to active ice sheet retreat across Dogger Bank (southern central North Sea) during the Last Glacial Maximum,
Quat. Sci. Rev., 179, 24–47, doi:10.1016/j.quascirev.2017.11.001, 2018.
Prothro, L. O., Majewski, W., Yokoyama, Y., Simkins, L. M., Anderson, J. B., Yamane, M., Miyairi, Y., and Ohkouchi, N.: 775
Timing and pathways of East Antarctic Ice Sheet retreat, Quat. Sci. Rev., 230, 106166, doi:10.1016/j.quascirev.2020.106166,
2020.
Rappol, M., Haldorsen, S., Jørgensen, P. M., Meer, J. van der, and Stoltenberg, H.: Composition and origin of petrographically-
stratified thick till in the northern Netherlands and a Saalian glaciation model for the North Sea Basin, Meded. - Werkgr. voor
Tert. en Kwartaire Geol., 26, 31–64, 1989. 780
Rijsdijk, K. F., Passchier, S., Weerts, H. J. T. T., Laban, C., van Leeuwen, R. J. W. W., and Ebbing, J. H. J. J.: Revised Upper
Cenozoic stratigraphy of the Dutch sector of the North Sea Basin: towards an integrated lithostratigraphic, seismostratigraphic
https://doi.org/10.5194/esurf-2021-47Preprint. Discussion started: 23 June 2021c© Author(s) 2021. CC BY 4.0 License.

39
and allostratigraphic approach, Netherlands J. Geosci. - Geol. en Mijnb., 84, 129–146, doi:10.1017/S0016774600023015,
2005.
Rohling, E. J., Hibbert, F. D., Williams, F. H., Grant, K. M., Marino, G., Foster, G. L., Hennekam, R., de Lange, G. J., Roberts, 785
A. P., Yu, J., Webster, J. M., and Yokoyama, Y.: Differences between the last two glacial maxima and implications for ice-
sheet, δ18O, and sea-level reconstructions, Quet. Sci. Rev., 176, 1-28, doi:10.1016/j.quascirev.2017.09.009, 2017.
Sejrup, H. P., Larsen, E., Haflidason, H., Berstad, I. M., Hjelstuen, B. O., Jonsdottir, H. E., King, E. L., Landvik, J., Longva,
O., Nygard, A., Ottesen, D., Raunholm, S., Rise, L., and Stalsberg, K.: Configuration, history and impact of the Norwegian
Channel Ice Stream, Boreas, 32, 18–36, doi:10.1080/03009480310001029, 2003. 790
Shepherd, A., Gilbert, L., Muir, A. S., Konrad, H., McMillan, M., Slater, T., Briggs, K. H., Sundal, A. V., Hogg, A. E., and
Engdahl, M. E.: Trends in Antarctic Ice Sheet Elevation and Mass, Geophys. Res. Lett., 46, 8174–8183,
doi:10.1029/2019GL082182, 2019.
Shepherd, A., Ivins, E., Rignot, E., Smith, B., van den Broeke, M., Velicogna, I., Whitehouse, P., Briggs, K., Joughin, I.,
Krinner, G., Nowicki, S., Payne, T., Scambos, T., Schlegel, N., A, G., Agosta, C., Ahlstrøm, A., Babonis, G., Barletta, V. R., 795
Bjørk, A. A., Blazquez, A., Bonin, J., Colgan, W., Csatho, B., Cullather, R., Engdahl, M. E., Felikson, D., Fettweis, X.,
Forsberg, R., Hogg, A. E., Gallee, H., Gardner, A., Gilbert, L., Gourmelen, N., Groh, A., Gunter, B., Hanna, E., Harig, C.,
Helm, V., Horvath, A., Horwath, M., Khan, S., Kjeldsen, K. K., Konrad, H., Langen, P. L., Lecavalier, B., Loomis, B., Luthcke,
S., McMillan, M., Melini, D., Mernild, S., Mohajerani, Y., Moore, P., Mottram, R., Mouginot, J., Moyano, G., Muir, A.,
Nagler, T., Nield, G., Nilsson, J., Noël, B., Otosaka, I., Pattle, M. E., Peltier, W. R., Pie, N., Rietbroek, R., Rott, H., Sandberg 800
Sørensen, L., Sasgen, I., Save, H., Scheuchl, B., Schrama, E., Schröder, L., Seo, K. W., Simonsen, S. B., Slater, T., Spada, G.,
Sutterley, T., Talpe, M., Tarasov, L., van de Berg, W. J., van der Wal, W., van Wessem, M., Vishwakarma, B. D., Wiese, D.,
Wilton, D., Wagner, T., Wouters, B., and Wuite, J.: Mass balance of the Greenland Ice Sheet from 1992 to 2018, Nature, 579,
233–239, doi:10.1038/s41586-019-1855-2, 2020.
Stokes, C. R. and Clark, C. D.: Geomorphological criteria for identifying Pleistocene ice streams, Ann. Glaciol., 28, 67–74, 805
doi:10.3189/172756499781821625, 1999.
Stokes, C. R., Tarasov, L., Blomdin, R., Cronin, T. M., Fisher, T. G., Gyllencreutz, R., Hättestrand, C., Heyman, J., Hindmarsh,
R. C. A., Hughes, A. L. C., Jakobsson, M., Kirchner, N., Livingstone, S. J., Margold, M., Murton, J. B., Noormets, R., Peltier,
W. R., Peteet, D. M., Piper, D. J. W., Preusser, F., Renssen, H., Roberts, D. H., Roche, D. M., Saint-Ange, F., Stroeven, A. P.,
and Teller, J. T.: On the reconstruction of palaeo-ice sheets: Recent advances and future challenges, Quet. Sci. Rev., 125, 15-810
49, doi:10.1016/j.quascirev.2015.07.016, 2015.
StrataData: Geochronology of boreholes from Hollandse Kust (zuid) Wind Farm Zone, Dutch Sector, North Sea. Report No:
08/17 (final version), Ottershaw, 2017.
StrataData: Geochronology of boreholes from Hollandse Kust (noord) Wind Farm Zone, Dutch Sector, North Sea. Report No:
10/18 (final version), Ottershaw, 2019. 815
https://doi.org/10.5194/esurf-2021-47Preprint. Discussion started: 23 June 2021c© Author(s) 2021. CC BY 4.0 License.

40
TNO-GSN: Stratigraphic Nomenclature of the Netherlands, TNO-Geological Survey of the Netherlands:
http://www.dinoloket.nl/en/stratigraphic-nomenclature/, last access: 1 June 2021.
Toucanne, S., Zaragosi, S., Bourillet, J. F., Cremer, M., Eynaud, F., Van Vliet-Lanoë, B., Penaud, A., Fontanier, C., Turon, J.
L., Cortijo, E., and Gibbard, P. L.: Timing of massive “Fleuve Manche” discharges over the last 350 kyr: insights into the
European ice-sheet oscillations and the European drainage network from MIS 10 to 2, Quat. Sci. Rev., 28, 1238–1256, 820
doi:10.1016/j.quascirev.2009.01.006, 2009
van der Vegt, P., Janszen, A., and Moscariello, A.: Tunnel valleys: Current knowledge and future perspectives, Geol. Soc.
Spec. Publ., 368, 75–97, doi:10.1144/SP368.13, 2012.
Van der Wateren, D. F. M.: A model of glacial tectonics, applied to the ice-pushed ridges in the central Netherlands., Bull.
Geol. Soc. Denmark, 34, 55–74, 1985. 825
Van der Wateren, D. F. M.: Structural geology and sedimentology of push moraines., Meded. Rijks Geol. D., 54, 1995.
Van der Wateren, D. F. M.: Processes of glaciotectonism, in: Modern and Past Glacial Environments, edited by: Menzies, J.,
Butterworth-Heinemann, Oxford, UK, 417–443, doi:10.1016/b978-075064226-2/50017-9, 2002.
Van der Wateren, D. F. M.: Ice-marginal terrestrial landsystems: southern Scandinavian ice sheet margin., in: Glacial
Landsystems, edited by: Evans, D. J. A., Routledge, London, 166–203, 2003. 830
Winsborrow, M. C. M., Clark, C. D., and Stokes, C. R.: What controls the location of ice streams?, Earth-Science Rev., 203,
45-59, doi:10.1016/j.earscirev.2010.07.003, 2010.
Zagwijn, W. H.: Pollen-analytical studies of Holsteinian and Saalian beds in the Northern Netherlands., Meded. Rijks Geol.
D., 24, 139–156, 1973.
Zagwijn, W. H.: Sea-level changes in the Netherlands during the Eemian., Geol. en Mijnb., 62, 437–450, 1983. 835
Zagwijn, W. H.: An analysis of Eemian climate in western and central Europe, Quat. Sci. Rev., 15, 451–469, doi:10.1016/0277-
3791(96)00011-X, 1996.
Zanella, E. and Coward, M. P.: Structural framework., in: The Millenium Atlas: Petroleum Geology of the Central and
Northern North Sea, edited by: Evands, D., Graham, C., Atmour, A., and Bathurst, P., The Geological Society of London,
London, 45–59, 2003. 840
Ziegler, P. A.: Cenozoic rift system of Western and Central Europe: an overview, Geol. en Mijnb., 73, 99–127, 1994.
https://doi.org/10.5194/esurf-2021-47Preprint. Discussion started: 23 June 2021c© Author(s) 2021. CC BY 4.0 License.


![Landforms Mady By Wind [Desert Landforms]](https://static.fdocuments.us/doc/165x107/56813971550346895da1066c/landforms-mady-by-wind-desert-landforms.jpg)