SEDIMENT TRANSPORT AND CHANNEL MORPHOLOGY · PDF filesediment transport and channel morphology...
122
SEDIMENT TRANSPORT AND CHANNEL MORPHOLOGY STUDY UPDATE: PROPOSED PEACE RIVER AT DUNVEGAN HYDROELECTRIC PROJECT Prepared for: Glacier Power Ltd. Suite 500, 1324 - 17th Avenue, SW Calgary, AB T2T 5S8 Tel: 403-209-3398 email: [email protected] Prepared by: MAY, 2006 M. Miles and Associates Ltd. 645 Island Road Victoria, BC V8S 2T7 Tel: 250-595-0653 email: [email protected] 1992 1992 Peace River Peace River Ksituan River Ksituan River Hines Hines Creek Creek Proposed Headworks Proposed Headworks
Transcript of SEDIMENT TRANSPORT AND CHANNEL MORPHOLOGY · PDF filesediment transport and channel morphology...

SEDIMENT TRANSPORT AND CHANNEL MORPHOLOGY STUDY UPDATE:PROPOSED PEACE RIVER AT DUNVEGAN
HYDROELECTRIC PROJECT
Prepared for:
Glacier Power Ltd. Suite 500, 1324 - 17th Avenue, SW Calgary, AB T2T 5S8
Tel: 403-209-3398email: [email protected]
Prepared by:
MAY, 2006
M. Miles and Associates Ltd. 645 Island Road Victoria, BC V8S 2T7
Tel: 250-595-0653 email: [email protected]
19921992
Peace RiverPeace River
Ksituan RiverKsituan River
HinesHinesCreekCreek
Proposed HeadworksProposed Headworks

SEDIMENT TRANSPORT AND CHANNEL MORPHOLOGY STUDY UPDATE:PROPOSED PEACE RIVER AT DUNVEGAN HYDROELECTRIC PROJECT Page i of v
M. MILES AND ASSOCIATES LTD.
EXECUTIVE SUMMARY
M. Miles and Associates Ltd. has been requested to evaluate the effects of the proposed Dunvegan run-of-riverhydroeletric project on sediment transport and river processes. The project’s operating regime will stabilize theheadpond levels to minimize water level fluctuations due to flow regulation at Bennett Dam. This will increasewater levels in the headpond by up to 1.5 m in comparison to the original proposal of June 2000. This valuedecreases with increasing flow and headpond levels are essentially unchanged above a discharge of 2,500 m³/s.Maximum levels will not be affected. A variety of calculations were undertaken to assess how the revised headpondwater levels and, correspondingly reduced water velocities, will affect sediment deposition in the headpond.
The duration and magnitude of sedimentation effects associated with the proposed Dunvegan project will evolveover time. The total volume of sediment deposited in the headpond after fifty years is calculated to be 35 x 106 m³or 11.6 % of the incoming sediment load. This sediment volume is 54% of the proposed headpond capacity at the50% exceedance flow. The average annual sediment deposition volume is 700,000 m³. This value is reduced to670,000 m³ (or 35 x 106 m³ over fifty years) if it is assumed that water flow through the turbines eliminates sedi-ment deposition in the lower 300 m of the headpond. Actual project effects are expected to be somewherebetween these two values. Average annual rates of sediment deposition associated with the June 2000 projectdesign are estimated to be 620,000 m³/year (30.9 x 10⁶ m³ over fifty years). The revised operating regime in-creases the headpond trapping efficiency from 10.2% to 11.6% over fifty years (assuming all sediment in the lower300 m of the headpond is carried through the powerhouse). This corresponds to an additional 50,000 m³/year ofsediment deposition or 2.7 x 10⁶ m³ over fifty years. The average depth of sediment deposition over fifty yearswill vary from 3 to 5 m at the upstream and downstream ends of the headpond, respectively. These values areapproximately 0.3 m greater than that predicted on the basis of the June 2000 project configuration.
The post-project bed material size will decrease downstream through the headpond. Gravel deposition will belimited to the upstream end of the headpond during the initial 10-years of the project (i.e. upstream of Kms 18to 21). Very fine to medium gravel does, however, begin to be deposited upstream of Km 16 over a period of fiftyyears. Coarse to very coarse gravels are similarly limited to the area upstream of Km 21 over the first fifty yearsof project operation. All other areas will become sand bedded.
Post-empoundment changes in channel morphology will include gradual gravel accumulation at the upstream endof the headpond, sand or finer sediment deposition on the bed and banks and continued enlargement of the fanson Fourth Creek, Hamelin Creek and Ksituan River.
The post-project water levels in the headpond will exceed those associated with the pre-Bennett Dam 2-year flooddownstream of Km 17. Post development wave, or possibly ice, action could accelerate naturally occurring bankerosion or shoreline instabilities. This is more likely to occur within the lower section of the headpond in areaswhich have not been previously exposed to fluvial processes. Potentially susceptible sites occur where mass-wasting or weathering has produced erodible materials or in situations where the river bank or valley wall iscomposed of unconsolidated sediments. Shoreline erosion is not expected to significantly affect the headpondsediment balance. Background suspended sediment concentrations are also sufficiently high during the spring andsummer months that it could be difficult to detect project-related increases in sediment loadings.
The predicted average annual sediment accumulation in the revised project is very similar to the 650,000 m³ esti-mated in 2000 for the previous operating regime. As a consequence, the downstream channel impact predictionsremain unchanged. Sediment trapping in the proposed headpond will reduce the coarse textured sediment loadto the downstream channel. However, significant channel downcutting or degradation is not expected as post-Bennett flows are generally insufficient to mobilize the surface bed materials. The Hines Creek fan will continueto aggrade, constrict the river channel and possibly cause further channel downcutting in the vicinity of theHighway 2 Bridge. The proposed project is not expected to significantly alter this on-going process.
The processes of sediment deposition, bank stability and resulting changes in channel morphology are complicatedand difficult to quantify. Monitoring will therefore be required to document what actually occurs. Mitigation orcompensation plans will also need to be developed in a flexible manner.

SEDIMENT TRANSPORT AND CHANNEL MORPHOLOGY STUDY UPDATE:PROPOSED PEACE RIVER AT DUNVEGAN HYDROELECTRIC PROJECT Page ii of v
M. MILES AND ASSOCIATES LTD.
ACKNOWLEDGMENTS
The authors would like to thank the following people for advice or assistance during the course of thisstudy:
Kelly Matheson Glacier Power Ltd., Calgary
Richard Slopek Canadian Projects Ltd., Calgary
Bill Johnson Focus Environmental Consultants, Sidney
Dave McClean northwest hydraulics consultants ltd., North Vancouver
Rick Pattenden Mainstream Aquatics Ltd., Edmonton
Peter Barlow Agra Earth and Environmental Ltd., Edmonton
Brendan Miller BC Ministry of Agriculture and Lands, Fort St. John
Lynne Campo Water Survey of Canada, Vancouver
Ms. Elizabeth Goldsworthy, B.Sc., and Ms. Sandy Allegretto, B.Sc., assisted in the preparation of this report.

SEDIMENT TRANSPORT AND CHANNEL MORPHOLOGY STUDY UPDATE:PROPOSED PEACE RIVER AT DUNVEGAN HYDROELECTRIC PROJECT Page iii of v
M. MILES AND ASSOCIATES LTD.
TABLE OF CONTENTSPage
Executive Summary .. .. .. .. .. .. .. iAcknowledgments .. .. .. .. .. .. .. iiTable of Contents .. .. .. .. .. .. .. iiiList of Figures .. .. .. .. .. .. .. ivList of Tables .. .. .. .. .. .. .. ivList of Appendices .. .. .. .. .. .. .. vStatement of Limitations .. .. .. .. .. .. .. v
1: INTRODUCTION AND OBJECTIVES .. .. .. .. .. 1
2: PREVIOUS STUDIES .. .. .. .. .. .. .. 1
3: PROJECT EFFECTS ON SEDIMENT TRANSPORT IN THE HEADPOND3.1 Average Velocity and Gravel Sand Transition .. .. .. .. .. 23.2 Mobile Sediment Sizes .. .. .. .. .. .. .. 33.3 Headpond Trapping Efficiency .. .. .. .. .. .. 5
3.3.1 Brune Methodology .. .. .. .. .. .. .. 63.3.2 Churchill’s Method .. .. .. .. .. .. .. 63.3.3 Comparison with Previous Studies .. .. .. .. .. 7
3.4 Sediment Transport Modelling3.4.1 GSTARS Analyses .. .. .. .. .. .. .. 83.4.2 Predicted Pattern of Sediment Deposition .. .. .. .. 8
4: PROJECT EFFECTS ON CHANNEL CONDITIONS4.1 Channel Morphology Within the Headpond .. .. .. .. .. 104.2 Bed Material (Substrate) Size .. .. .. .. .. .. .. 114.3 Nearshore Sediment Stability .. .. .. .. .. .. .. 124.4 Shoreline Stability .. .. .. .. .. .. .. 12
4.4.1 Changes in Water Level .. .. .. .. .. .. 124.4.2 Shoreline Mapping Criteria .. .. .. .. .. .. 134.4.3 Shoreline Composition .. .. .. .. .. .. 134.4.4 Post-Dunvegan Shoreline Stability .. .. .. .. .. 144.4.5 Effects of Revised Operating Regime .. .. .. .. .. 154.4.6 Environmental Effects .. .. .. .. .. .. 164.4.7 Shoreline Stabilization .. .. .. .. .. .. 16
4.5 Downstream Channel Evolution .. .. .. .. .. .. 17
5: CONCLUSIONS AND DISCUSSION .. .. .. .. .. 17
6: CERTIFICATION .. .. .. .. .. .. .. 18
7: SOURCES OF INFORMATION .. .. .. .. .. .. 18

SEDIMENT TRANSPORT AND CHANNEL MORPHOLOGY STUDY UPDATE:PROPOSED PEACE RIVER AT DUNVEGAN HYDROELECTRIC PROJECT Page iv of v
M. MILES AND ASSOCIATES LTD.
LIST OF FIGURESPage
3.1.1 Downstream variation in average headpond water velocity for the 90% exceedanceflow in relationship to the predicted water velocity at the gravel sand transition .. F-1
3.1.2 Downstream variation in average headpond water velocity for the 50% exceedanceflow in relationship to the predicted water velocity at the gravel sand transition .. F-2
3.1.3 Downstream variation in average headpond water velocity for the 2-year return periodflood in relationship to the predicted water velocity at the gravel sand transition .. F-3
3.1.4 Downstream variation in average headpond water velocity for the 5-year return periodflood in relationship to the predicted water velocity at the gravel sand transition .. F-4
3.3.1 Brune curve for estimating sediment trapping or release efficiency in conventional impounding reservoirs .. .. .. .. .. .. .. F-5
3.3.2 Churchill curve for estimating sediment release efficiency .. .. .. .. F-63.4.1 Bed profiles through headpond predicted by GSTARS over a 50-year period .. .. F-73.4.2 Computed profiles in headpond with transmissive boundary at dam predicted by GSTARS F-83.4.3 Effect of increasing tailwater after 50 years: GSTARS results comparing the present
headpond configuration with that proposed in 2000 .. .. .. .. F-83.4.4 Sediment deposition in the headpond over a 10-year period .. .. .. F-93.4.5 Sediment deposition in headpond over a 50-year period .. .. .. .. F-10
4.4.1 Comparison of pre-Bennett, post-Bennett and post-Dunvegan water levels in theheadpond area for 95%, 50% and 5% exceedance flood flows .. .. .. F-11
4.4.2 Comparison of pre-Bennett, post-Bennett and post-Dunvegan water levels in theheadpond area for 2, 10 and 100-year exceedance flood flows .. .. .. F-12
4.4.3 Distribution of colluvial veneer over rock .. .. .. .. .. F-134.4.4 Distribution of colluvial fans or aprons .. .. .. .. .. .. F-144.4.5 Distribution of fluvial fans .. .. .. .. .. .. .. F-154.4.6 Distribution of fluvial terraces .. .. .. .. .. .. F-164.4.7 Distribution of fluvial islands or vegetated bars of recent origin .. .. .. F-174.4.8 Seasonal variation in suspended sediment concentrations observed on Peace River
at Dunvegan .. .. .. .. .. .. .. F-184.4.9 Seasonal variation in suspended sediment concentrations observed on Peace River
at Peace River .. .. .. .. .. .. .. F-19
LIST OF TABLES
3.2.1 Critical shear stress required to mobilize various sized sediments .. .. .. T-13.2.2 Predicted shear stress (N/m²) for Post-Dunvegan 95% exceedance flow (753 m³/s) T-23.2.3 Predicted shear stress (N/m²) for Post-Dunvegan 50% exceedance flow (1,540 m³/s) T-33.2.4 Predicted shear stress (N/m²) for Post-Dunvegan 2-Yr return period flood (3,680 m³/s) T-43.2.5 Predicted shear stress (N/m²) for Post-Dunvegan 5-Yr return period flood (4,920 m³/s) T-53.2.6 Predicted shear stress (N/m²) for Post-Dunvegan 10-Yr return period flood (5,750 m³/s) T-63.2.7 Predicted shear stress (N/m²) for Post-Dunvegan 50-Yr return period flood (7,570 m³/s) T-73.2.8 Predicted shear stress (N/m²) for Post-Dunvegan 100-Yr return period flood (8,330 m³/s) T-83.2.9 Predicted shear velocity (m/s) for Post-Dunvegan 95% exceedance Flow (753 m³/s) T-93.2.10 Predicted shear velocity (m/s) for Post-Dunvegan 50% exceedance Flow (1,540 m³/s) T-103.2.11 Predicted shear velocity (m/s) for Post-Dunvegan 2-Yr return period flood (3,680 m³/s) T-113.2.12 Predicted shear velocity (m/s) for Post-Dunvegan 5-Yr return period flood (4,920 m³/s) T-12

SEDIMENT TRANSPORT AND CHANNEL MORPHOLOGY STUDY UPDATE:PROPOSED PEACE RIVER AT DUNVEGAN HYDROELECTRIC PROJECT Page v of v
M. MILES AND ASSOCIATES LTD.
List of Tables - cont’d. Page
3.2.13 Predicted shear velocity (m/s) for Post-Dunvegan 10-Yr return period flood (5,750 m³/s) T-133.2.14 Predicted shear velocity (m/s) for Post-Dunvegan 50-Yr return period flood (7,570 m³/s) T-143.2.15 Predicted shear velocity (m/s) for Post-Dunvegan 100-Yr return period flood (8,330 m³/s) T-15
3.3.1 Silt deposition in the proposed headpond calculated for various trap efficiencies .. T-16
3.4.1 GSTARS predicted sediment deposition in the Dunvegan headpond over a 10-Yr period T-173.4.2 GSTARS predicted sediment deposition in the Dunvegan headpond over a 50-Yr period T-183.4.3 GSTARS predicted deposition after 50 years with transmissive boundary at dam .. T-193.4.4 GSTARS predicted sediment deposition pattern in headpond with tailwater set to
proposed headpond configuration in 2000 and transmissive lower boundary .. .. T-203.4.5 Reservoir trapping efficiency for various sized sediments .. .. .. .. T-21
4.4.1 Summary of air photographs used in this analysis .. .. .. .. T-224.4.2 Distribution of shoreline materials (excluding islands or bars) .. .. .. T-234.4.3 Length of islands or bars within the proposed Dunvegan headpond .. .. .. T-24
LIST OF APPENDICES
Appendix 1 GSTARS ANALYSESConducted by Dr. David McLean, P. Eng., northwest hydraulics consultants ltd.
Appendix 2 Examples of shoreline segments consisting of colluvial veneer over rock
Appendix 3 Examples of shoreline segments consisting of colluvial fans or colluvial aprons
Appendix 4 Examples of shoreline segments consisting of fluvial terraces
Appendix 5 Examples of shoreline segments consisting of fluvial islands or bars of recent origin
Appendix 6 Examples of shoreline segments consisting of fluvial fans
Appendix 7 Shoreline material mapping
STATEMENT OF LIMITATIONS OF REPORT
This document has been prepared by M. Miles and Associates Ltd. [MMA] for the exclusive use and benefitof Glacier Power Ltd. No other party is entitled to rely on any of the conclusions, data, opinions, or anyother information contained in this document.
This document represents MMA’s best professional judgement based on the information available at thetime of its completion and as appropriate for the project scope of work. Services performed in developingthe content of this document have been conducted in a manner consistent with that level and skill ordinarilyexercised by scientists and engineers currently practicing under similar conditions. No warranty, expressedor implied, is made.

1 A flow of 2,500 m³/s is exceeded 5% of the time on an annual basis under the post-Bennett operating regime(see Mack and Slack, 2004; Table 3.2).
M. MILES AND ASSOCIATES LTD.
SEDIMENT TRANSPORT AND CHANNEL MORPHOLOGY STUDY UPDATE:PROPOSED PEACE RIVER AT DUNVEGAN
HYDROELECTRIC PROJECT
1: INTRODUCTION AND OBJECTIVES
Glacier Power Ltd. [GP] proposed to construct a 40 MW (later increased to 80 MW) run of the river hydroproject on Peace River at Dunvegan in June 2000. M. Miles and Associates Ltd. [MMA] was retained todetermine how this structure would affect sediment transport and channel processes on Peace River. GPhas recently upgraded the project to produce 100 MW while minimizing the project’s effects on fish passageand the downstream ice regime. The revised project will have the same maximum operating headpondlevels proposed in June, 2000, but headpond water levels will be maintained at a more constant elevation. MMA has therefore been requested to update the previously completed studies. Specific topics of interestinclude:
i) predicting post-project bed material size within the headpond ;
ii) determining what percentage of the incoming sediment load will be retained in theheadpond;
iii) evaluating rates of sediment deposition in the headpond; and
iv) assessing the project’s effects on channel geometry and river processes both within theheadpond and in the area downstream of the proposed headworks.
Previous studies are briefly reviewed in SECTION 2. The project’s effects on sediment transport and channelprocesses are discussed in SECTIONS 3 and 4, respectively.
2: PREVIOUS STUDIES
The proposed Dunvegan hydro project is described in Canadian Projects Ltd. (2005). The operating regimewill result in a head differential at the powerhouse of 5.5 to 7.6 m under the majority of flow conditions(see Canadian Projects Ltd., 2005, SECTION 3.3.2). This is similar to what was proposed in 2000. However,the revised operating protocol will maximize the amount of time that the head differential is in the rangeof 6 to 7 m. This will increase headpond elevations for low to medium flows by up to 1.5 m in comparisonto that proposed in June 2000. This value decreases with increasing flow and headpond water levels areessentially unchanged above a discharge of 2,500 m³/s. *1 The new operating regime will reduce thewater velocities through the headpond in comparison to the conditions evaluated during the previoussediment transport analyses.

SEDIMENT TRANSPORT AND CHANNEL MORPHOLOGY STUDY UPDATE:PROPOSED PEACE RIVER AT DUNVEGAN HYDROELECTRIC PROJECT
Page 2 of 19
1 All discharge values are from Mack and Slack, 2004.
M. MILES AND ASSOCIATES LTD.
Mack and Slack Consultants [M&S] have prepared updated hydrologic analyses for Peace River (M&S, 2004)and have undertaken a revised HEC RAS analysis (U.S. Army Corps of Engineers, 2002) to predict thehydraulic characteristics of the headpond under various flow conditions (M&S, 2005).
The sediment transport analysis undertaken for the original project included the preparation of four reports.Representative bed material sizes were documented in MMA, 2000a. Historical air photographs werecompiled for the headpond area and approximately 16 km of channel downstream of the project inMMA, 2000b. The sediment transport characteristics of Peace River and the project’s effect on sedimenttransport and channel morphology was described in MMA 2000c. Sediment or channel morphology relatedeffect on fish habitat and adjacent infrastructure was discussed in MMA 2000d. The analysis of pre-projectconditions, presented in MMA 2000a, b & c, is still relevant and does not require updating. The interestedreader is therefore directed to these previous studies for this information.
The sediment transport capacity of Peace River, and the proposed headpond, is a function of both riverdischarge and hydraulic regime. These values have varied over time (due to river regulation by BennettDam) and the characteristics of the proposed headpond will vary with streamflow, the operating regimeof the Dunvegan project and post-empondment changes in channel geometry resulting from sedimentdeposition. As a consequence, it is a complicated undertaking to predict how the proposed project willaffect sediment transport over the long term. The previously completed reports therefore used a varietyof analytical procedures to both predict the effects of the project and to illustrate the range in values whichare calculated by the employed methodologies. A similar approach has been adopted for this report whichdiscusses the effects of the proposed revised operating regime.
3: PROJECT EFFECTS ON SEDIMENT TRANSPORT IN THE HEADPOND
3.1: AVERAGE VELOCITY AND GRAVEL SAND TRANSITION
It is possible to use the average water velocity as an initial criterion to determine how the proposedheadpond will affect typical bed materials size. Mack & Slack (2005) used HEC RAS to calculate theaverage cross-section velocity in the headpond under the revised operating regime. These results, illus-trated on Figures 3.1.1 to 3.1.4, compare pre-Bennett, post-Bennett–pre-Dunvegan, and post-Bennett–post-Dunvegan conditions. The graphs show considerable spatial variability in velocity. This reflects bothlocal channel conditions and uncertainties in the model studies due to the number or location of the surveytransects and the data available for model calibration.
Bennett Dam has increased the 90% exceedance flows from 250 m³/s under natural conditions to905 m³/s under the present discharge regime. *1 The associated average water velocity has increasedfrom pre-regulation values of 0.6 to 1.8 m/s to post-Bennett values of 1.1 to 1.8 m/s (Figure 3.1.1). TheDunvegan headpond will decrease water velocities associated with the 90% exceedance flow by 0.3 m/sat Km 26 near the upper end of the headpond and by 0.9 m/s near the proposed headworks(Figure 3.1.1). The resulting water velocities will be typically 0.4 m/s lower than those which occurred priorto river regulation by Bennett Dam.

SEDIMENT TRANSPORT AND CHANNEL MORPHOLOGY STUDY UPDATE:PROPOSED PEACE RIVER AT DUNVEGAN HYDROELECTRIC PROJECT
Page 3 of 19
M. MILES AND ASSOCIATES LTD.
Bennett Dam has also increased the 50% exceedance flow from 822 m³/s under natural conditions to1,540 m³/s in the present regulated regime. This results in an increase in average water velocity of 0.2 to0.3 m/s at most locations (Figure 3.1.2). The proposed Dunvegan project will reduce the associated watervelocities downstream of approximately Km 24 with minimum velocities (0.4 m/s) being 0.4 m/s smallerthan the pre-Bennett conditions and 0.7 m/s less than the post-Bennett conditions.
Bennett Dam has decreased the size of all flood flows. For example, the 2-year flood has been reducedfrom 7,490 to 3,680 m³/s and the 5-year flood flow has decreased from 9,120 to 4,920 m³/s. The pre-and post-Bennett water velocities associated with these two events are shown on Figures 3.1.3 & 3.1.4.These graphs indicate that the reduction in flow due to Bennett Dam results in an approximately 0.5 m/sdecrease in average water velocity. The Dunvegan project would further decrease average headpondvelocities by approximately 0.8 m/s.
The above discussion indicates that the proposed Dunvegan project will reduce average water velocitiesin the headpond in comparison to those which presently occur. As discussed in MMA (2000a), the presentbed material (or channel ‘substrate’) is generally composed of gravel. It is therefore useful to initiallyevaluate whether the reduction in average water velocities associated with the Dunvegan project issufficient to change the texture of the river bed materials from gravel to sand.
Peace River undergoes a natural transition between a gravel and sand bed in the vicinity of Carcajou (MMA,2000c). Data presented in Kellerhals, Neil and Bray (1972) indicate that pre-regulation water velocitiesassociated with this transition are as follows:
Mean annual flow 0.9 m/s2 year flood 1.6 m/s5 year flood 1.8 m/s
These values, which reflect the hydraulic capacity of the river to move material of varying size, provide aninitial basis for assessing the effects of the Dunvegan project. The above velocity criteria are shown onFigures 3.1.2 to 3.1.4, along with the predicted post-project velocities in the headpond. This analysissuggests that the reduced water velocities will cause much of the headpond to become sand bedded, withthe gravel to sand transition zone being located near the upper end of the headpond between Kms 20 and23. Additional, and likely more reliable, analyses are presented in subsequent sections of this report torefine the location of the gravel to sand transition.
3.2: MOBILE SEDIMENT SIZES
HEC RAS analyses (Mack and Slack, 2005) have been undertaken to determine the post-Dunveganhydraulic characteristics of the headpond. The results include predictions of water depth, water velocity,shear stress and shear velocity for a range in stream flow values and locations across the river channel.As indicated on Table 3.2.1, shear stress and shear velocity can be used to calculate when varying sizedbed material will be entrained.
Shear stress (in N/m²) is calculated as follows:τ c
.. .. (1)τ γc RS=where: = weight density of water (9,810 N/m³)γ
= hydraulic radius (area divided by wetted perimeter) (m)R= water surface slope (m/m)S

SEDIMENT TRANSPORT AND CHANNEL MORPHOLOGY STUDY UPDATE:PROPOSED PEACE RIVER AT DUNVEGAN HYDROELECTRIC PROJECT
Page 4 of 19
1 The shear stress and shear velocity criteria used in MMA, 2000c were calculated based on criteria in Dingman(1984). These values are slightly different than those shown on Table 3.2.1. For consistency, the originalcriteria used in MMA, 2000c have been employed in this analysis.
M. MILES AND ASSOCIATES LTD.
MMA (2000c, SECTION 5.1.6) previously determined that the shear stresses required to entrain represen-tative bed material are as follows: *1
MINIMUM SHEARSTRESS (N/m²)
GRAINSIZE(mm) REPRESENTATIVE BED MATERIAL
1.4 2 sand gravel transition
10 14 average sub-surface size in mid-channel
36 50 average size of surface sediments
Shear velocity also provides another useful index to predict the size of potentially mobile sediments.
Shear velocity Vc (in m/s) is calculated as follows:
( )Vc g R S= ⋅ ⋅0 5.
where = gravity 9.8 m/s²g= hydraulic radius (m)R= water surface slope (m/m)S
The minimum shear velocity necessary to entrain representative bed materials are shown below:
MINIMUM SHEARVELOCITY (m/s)
GRAINSIZE(mm) REPRESENTATIVE BED MATERIAL
0.04 2 sand gravel transition
0.11 14 average sub-surface size in mid-channel
0.22 50 average size of surface sediments
The predicted shear stress values in the headpond are summarized on Tables 3.2.2 to 3.2.8 for sevenflows ranging in size from the 95% exceedance value to the 100 year return period flood. Similartabulations for shear velocity are presented on Tables 3.2.9 to 3.2.15.
The data on Tables 3.2.2 to 3.2.15 have been colour coded to indicate shear stresses which are:
i) insufficient to entrain sand-sized material (yellow);
ii) sufficient to entrain sand-sized sediments, but insufficient to entrain the average sub-surface mid-channel sediments (pink)
iii) sufficient to entrain the average sub-surface mid-channel sediments, but insufficientto mobilize the average surface material (blue); and
iv) sufficient to entrain the average surface material (green).
SEDIMENT TRANSPORT AND CHANNEL MORPHOLOGY STUDY UPDATE:PROPOSED PEACE RIVER AT DUNVEGAN HYDROELECTRIC PROJECT
Page 5 of 19
1 The lack of cross-sections in this area limits our ability to better define the location of this transition.
M. MILES AND ASSOCIATES LTD.
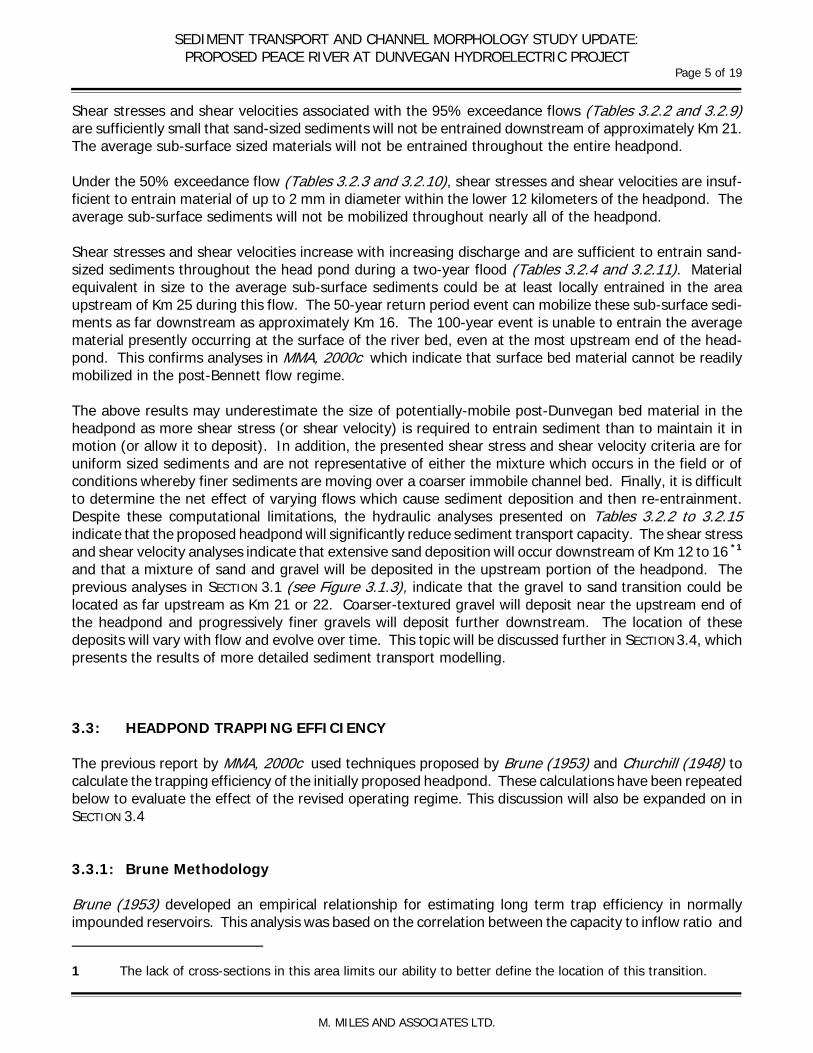
Shear stresses and shear velocities associated with the 95% exceedance flows (Tables 3.2.2 and 3.2.9)are sufficiently small that sand-sized sediments will not be entrained downstream of approximately Km 21.The average sub-surface sized materials will not be entrained throughout the entire headpond.
Under the 50% exceedance flow (Tables 3.2.3 and 3.2.10), shear stresses and shear velocities are insuf-ficient to entrain material of up to 2 mm in diameter within the lower 12 kilometers of the headpond. Theaverage sub-surface sediments will not be mobilized throughout nearly all of the headpond.
Shear stresses and shear velocities increase with increasing discharge and are sufficient to entrain sand-sized sediments throughout the head pond during a two-year flood (Tables 3.2.4 and 3.2.11). Materialequivalent in size to the average sub-surface sediments could be at least locally entrained in the areaupstream of Km 25 during this flow. The 50-year return period event can mobilize these sub-surface sedi-ments as far downstream as approximately Km 16. The 100-year event is unable to entrain the averagematerial presently occurring at the surface of the river bed, even at the most upstream end of the head-pond. This confirms analyses in MMA, 2000c which indicate that surface bed material cannot be readilymobilized in the post-Bennett flow regime.
The above results may underestimate the size of potentially-mobile post-Dunvegan bed material in theheadpond as more shear stress (or shear velocity) is required to entrain sediment than to maintain it inmotion (or allow it to deposit). In addition, the presented shear stress and shear velocity criteria are foruniform sized sediments and are not representative of either the mixture which occurs in the field or ofconditions whereby finer sediments are moving over a coarser immobile channel bed. Finally, it is difficultto determine the net effect of varying flows which cause sediment deposition and then re-entrainment.Despite these computational limitations, the hydraulic analyses presented on Tables 3.2.2 to 3.2.15indicate that the proposed headpond will significantly reduce sediment transport capacity. The shear stressand shear velocity analyses indicate that extensive sand deposition will occur downstream of Km 12 to 16 *1
and that a mixture of sand and gravel will be deposited in the upstream portion of the headpond. Theprevious analyses in SECTION 3.1 (see Figure 3.1.3), indicate that the gravel to sand transition could belocated as far upstream as Km 21 or 22. Coarser-textured gravel will deposit near the upstream end ofthe headpond and progressively finer gravels will deposit further downstream. The location of thesedeposits will vary with flow and evolve over time. This topic will be discussed further in SECTION 3.4, whichpresents the results of more detailed sediment transport modelling.
3.3: HEADPOND TRAPPING EFFICIENCY
The previous report by MMA, 2000c used techniques proposed by Brune (1953) and Churchill (1948) tocalculate the trapping efficiency of the initially proposed headpond. These calculations have been repeatedbelow to evaluate the effect of the revised operating regime. This discussion will also be expanded on inSECTION 3.4
3.3.1: Brune Methodology
Brune (1953) developed an empirical relationship for estimating long term trap efficiency in normallyimpounded reservoirs. This analysis was based on the correlation between the capacity to inflow ratio and

SEDIMENT TRANSPORT AND CHANNEL MORPHOLOGY STUDY UPDATE:PROPOSED PEACE RIVER AT DUNVEGAN HYDROELECTRIC PROJECT
Page 6 of 19
M. MILES AND ASSOCIATES LTD.
trap efficiency observed by the Tennessee Valley Authority in the south-eastern United States. Asdiscussed in Morris and Fan (1998), this is probably the most widely used method for estimating sedimentretention, and gives reasonable results on the basis of storage volume and the average annual inflow value(ibid. p. 10.26). However, it is not known how well this simple procedure will predict sediment depositionin the run of the river project proposed at Dunvegan.
The report by Mack and Slack, 2005 indicates that the headpond characteristics are as follows:
HEADPOND CHARACTERISTICS
FLOW CRITERIA FLOW(m³/s)
VOLUME(dam³)
RESIDENCETIME (hrs)
100 % exceedance 425 54,156 35.4
50 % exceedance 1,560 64,859 11.7
Overtopping 3,380 75,756 6.2
2 year flow 3,680 89,285 6.7
From Mack and Slack, 2005 Table 3.14 Hydraulics Report
The hydrology studies conducted by Mack and Slack (2004) indicate that the mean annual flow is1,560 m³/s or 49,196,160 dam³/yr.
The capacity to inflow ratio for the proposed headpond has been calculated based on both the 50%exceedance volume (64,859 dam³) and the 2 year flood volume (89,285 dam³). The average inflow valueis the mean annual flow of 49,196,160 dam³/yr. The capacity to inflow ratio ranges from 0.00132 for the50% exceedance flow to 0.00182 for the 2 year flood. As indicated on Figure 3.3.1, Brune’s procedureindicates that the predicted Dunvegan headpond trapping efficiency is as follows:
CAPACITY TOVOLUME CRITERIA
% SEDIMENT TRAPPED
COLLOIDAL, DISPERSED,FINE-GRAINED SEDIMENT
MEDIANCURVE
HIGHLY FLOCCULATEDAND COARSE SEDIMENT
50% exceedance flow 0 0 8±
2 year flood 0 3 15±
3.3.2: Churchill’s Method
Churchill (1948), developed a methodology to predict the sediment trapping efficiency of a reservoir or‘headpond’ based on a ‘sedimentation index’. This index, defined as the ratio of the retention period to themean flow velocity through the headpond, is calculated as follows:
P The headpond capacity is defined as the volume at the mean operating level. Thiscorresponds to 64,859,000 m³ at the 50% exceedance flow.
P The average daily inflow is 1,560 m³/s.

SEDIMENT TRANSPORT AND CHANNEL MORPHOLOGY STUDY UPDATE:PROPOSED PEACE RIVER AT DUNVEGAN HYDROELECTRIC PROJECT
Page 7 of 19
M. MILES AND ASSOCIATES LTD.
P The period of retention is the capacity divided by the average daily inflow which equals(64,859,000 m³ ÷ 1,560 m³/s) or 41,576 s.
P The headpond length at 50% exceedance flow is 26,000 m.
P The headpond cross-sectional area is defined as the capacity (64,859,000 m³) dividedby length (26,000 m) or 2,494 m².
P The average velocity is the average inflow (1,560 m³/s) divided by the cross-sectionalarea (2,494 m²) or 0.626 m/s.
P The sedimentation index is the period of retention (41,576 s) divided by the meanvelocity (0.626 m/s) which corresponds to 66,415.
As indicated on Figure 3.3.2, a reservoir or ‘headpond’ with a sedimentation index of 66,415 is predictedto pass approximately 80 per cent of the incoming silt load. Conversely, approximately 20 per cent of thissilt load would be retained in a conventional reservoir.
The average annual silt load at Dunvegan has been previously estimated to be 7.8 Mt/yr (MMA, 2000c).The potential effect of 20 per cent silt deposition on headpond lifespan is evaluated on Table 3.3.1. Thetrap efficiency in the Dunvegan project may not be as high as that calculated by Churchill’s method giventhe run of the river character of the project. For this reason, a range of trap efficiencies have beenevaluated.
The analyses summarized on Table 3.3.1 indicate that a volume of silt equivalent to the 50% exceedanceheadpond volume could be deposited if a trap efficiency of 20% were maintained for a period of 40 to50 years. This value would increase to 150 to 200 years at a 5% trapping efficiency. In reality, substantialsediment deposition in a run of the river project such as Dunvegan would reduce the cross-sectional area,increase average velocity and reduce the sedimentation index until a new equilibrium condition wasestablished. This effect is quantified in SECTION 3.4.
3.3.3: Comparison With Previous Studies
Calculations in MMA (2000c), which were based on the headpond operating regime proposed in 2000,indicate that Brune’s sedimentation index was zero except for coarse sediment and Churchill’s methodologypredicted that nearly 100% of the silt load would be transported downstream. The predicted increase infine textured sediment deposition associated with the revised operating regime reflects the increased waterlevels in the headpond and the associated decrease in average water velocity for flows of less than2,500 m³/s.
The analyses conducted in MMA (2000c) calculated that the average annual bedload and bed material loadat Dunvegan are 150,000 and 500,000 m³/yr, respectively. It was predicted that the majority of thismaterial would be deposited in the headpond. This results in an average annual volume of coarse sedimentdeposition of approximately 650,000 m³. The revised operating regime will not significantly affect thisprediction.

SEDIMENT TRANSPORT AND CHANNEL MORPHOLOGY STUDY UPDATE:PROPOSED PEACE RIVER AT DUNVEGAN HYDROELECTRIC PROJECT
Page 8 of 19
1 GSTARS is an acronym for Generalized Stream Tube model for Alluvial River Simulation.
M. MILES AND ASSOCIATES LTD.
3.4: SEDIMENT TRANSPORT MODELLING
3.4.1: GSTARS Analyses
The computer program GSTARS *1 (Yang and Simões, 2002) has been used to provide additional infor-mation on sediment transport through the proposed Dunvegan headpond and to better estimate potentialrates of long term sediment deposition. These analyses, which were undertaken by Dr. David McLean,P.Eng. of northwest hydraulic consultants ltd., are presented in APPENDIX 1. Analyses were undertaken tocalibrate the GSTARS model and to determine:
i) rates of sediment deposition in the headpond over a 10-year period (letter report datedMay 8, 2005);
ii) rates of sediment deposition over a 50-year period (letter report dated May 17, 2005);
iii) how the turbine intake and spillway would affect sediment deposition in the lower endof the headpond (letter report dated July 4, 2005); and
iv) how patterns of sediment deposition compare based on the previously proposed andpresent headpond operating regimes (letter report dated July 4, 2005).
The reader is referred to APPENDIX 1 for a discussion of the employed methodology.
3.4.2: Predicted Pattern of Sediment Deposition
Tables 3.4.1 and 3.4.2 summarize the predicted sediment accumulations in the headpond after 10 and 50years of operation. As discussed in Dr. McLean’s letter of May 8, 2005, the GSTARS modelling resultsindicate that:
P “all of the incoming gravel load is deposited in the upstream end of the headpond,mainly upstream of station 18+000;
P virtually all of the medium and coarse sand (0.2 mm to 2 mm) is deposited in theheadpond, with most deposition occurring between station 8+597 and 18+240;
P virtually all of the fine sand (0.0625 mm to 0.2 mm) is deposited in the headpond, withmost of the deposition occurring between station 18+240 to 4+095; and
P a small fraction of the silt (4.9%) is deposited in the headpond with most of thisdeposition occurring near the dam between station 6+000 and 0+597”
Successive profiles through the Dunvegan headpond are illustrated on Figure 3.4.1, based on the resultsfrom the 50-year simulation. As discussed by Dr. McLean:
P “The model predicts sand and fine pea-gravel is deposited in the head pond and theresulting sediment wedge advances towards the dam as a delta front. It can be seenthat the rate of deposition decreases after about 30 years, indicating a significant

SEDIMENT TRANSPORT AND CHANNEL MORPHOLOGY STUDY UPDATE:PROPOSED PEACE RIVER AT DUNVEGAN HYDROELECTRIC PROJECT
Page 9 of 19
M. MILES AND ASSOCIATES LTD.
fraction of the sediments starts to be flushed through the head pond after this time.Over the 50 year period, silt and clay size sediments make up a very small fraction ofthe deposited sediments (0.4 %) even though these sizes make up the majority of thetotal sediment inflow (>80 %). This indicates over a 50 year time span, the silt andclay size sediments will behave as “wash load” and will be flushed though the channelwithout remaining on the bed;
P Upstream of KM 18, the accumulated deposits consist mainly of gravel and sand.Comparison with results from Year 10 show the deposited sediments in the upper endof the head pond become coarser over time, indicating that gravel bed load eventuallystarts to prograde over the finer sandy deposits. Given sufficient time, the river willeventually return to a gravel bed channel, if there is a significant supply of gravelsediments to the system; and
P Most of the sediments deposited downstream of KM 18 consist of medium to fine sandas shown below:
silt-clay (<0.0625 mm) 2.9%fine sand (0.0625-0.2 mm) 22.8%medium sand (0.2-0.5 mm) 52.8%coarse sand (0.5-2.0 mm) 18.7%gravel (coarser than 2 mm) 2.8%”
The total volume of sediment deposited in the headpond after 50 years was calculated to be 35 x 106 m³which represents 11.6 % of the incoming sediment load. This volume is 54% of the proposed headpondcapacity at the 50% exceedance flow. The average annual sediment deposition volume is 700,000 m³/yr.
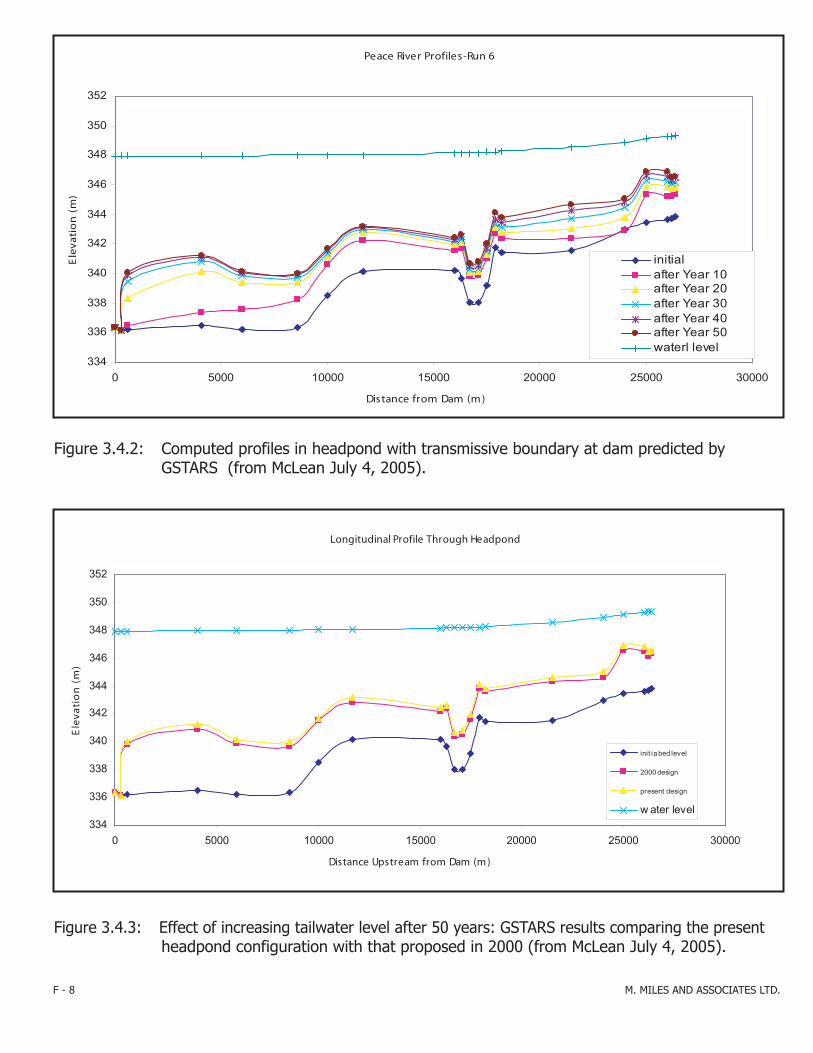
The initial GSTARS model was re-run with a transmissive or permeable boundary at the proposed head-pond. This analysis attempts to simulate the effect of flow through the turbines. These analyses, whichare illustrated on Figure 3.4.2 and summarized on Table 3.4.3, indicate that the transmissive boundarygreatly decreases sediment deposition immediately upstream of the headworks. The average annual sedi-ment deposition rate for the transmissive design is 670,000 m³/yr. However, the one dimensional modelcan not reliably simulate local scour and deposition and, as indicated by Dr. McLean, “actual conditions ..are expected to lie between the two results” (i.e. 670,000 to 700,000 m³/yr and Figures 3.4.1 & 3.4.2).
The GSTARS model was not available when the original Dunvegan project was evaluated in 2000. As aconsequence, the analysis by MMA, 2000c did not quantify the potential depths or volume of sedimentdeposition as a function of distance along the headpond. The GSTARS program was therefore used tocalculate sediment deposition in the headpond based on the operating regime proposed in 2000. Theresults are shown on Figure 3.4.3. This analysis indicates that the revised operating regime results in amodest increase in average sediment accumulation of 0.3 m over 50 years. The associated summary ofsediment deposition by grain size (shown on Table 3.4.4) indicates that 10.2% of all inflowing sedimentswould have been trapped with the original project. This compares to 11.1% with the present design ora 0.9% increase (all values assume a transmissive lower boundary). The average annual volume ofsediment deposition for the original operating regime is 620,000 m³/yr. [This is very similar to the valueof #650,000 m³/yr presented in MMA, 2000c). The revised operating regime therefore results in anadditional 80,000 m³/yr of sediment deposition (or 2.7 x 10⁶ m³ over 50 years), compared to that whichwould have occurred as a result of the original proposal.

SEDIMENT TRANSPORT AND CHANNEL MORPHOLOGY STUDY UPDATE:PROPOSED PEACE RIVER AT DUNVEGAN HYDROELECTRIC PROJECT
Page 10 of 19
1 Scenario 1: 10-year period, currently proposed operating regime;Scenario 2: 50-year period, currently proposed operating regime;Scenario 3: 50-year period, currently proposed operating regime, transmissive lower boundary; andScenario 4: 50-year period, 2000 operating regime, transmissive lower boundary.
M. MILES AND ASSOCIATES LTD.
Headpond trapping efficiencies for all four modelled scenarios *1 are compared on Table 3.4.5. Thiscompilation illustrates how nearly all of the material coarser than very fine gravel will be trapped in theheadpond under all of the investigated scenarios. However, the percentage of sand which is trappeddecreases from 99.9% at 10 years to values of 27 to 82% (depending on grain size) over 50 years. Thisdecreased trapping efficiency reflects the post-empondment evolution of the headpond. The percentageof silt capture similarly decreases from 7.6% over 10 years to 0.5% over fifty years.
The volume of sediment deposited along the headpond over 10 and 50 years is indicated on Figures 3.4.4& 3.4.5, respectively. These graphs show deposition in each of four size classes:
coarse clay and silt (0.002 to 0.0625 mm);sand (0.0625 to 2.0 mm);very find to medium gravel (2.0 to 16 mm); andcoarse to very coarse gravel (16 to 64 mm)
This analysis illustrates how the size of the deposited sediments decreases downstream through the head-pond and the limited distribution of greater than sand-sized materials. Some gravel deposition will occurin the upstream end of the headpond during the initial 10-years of the project (i.e. upstream of Km 18.2for fine to medium gravel). Very fine to medium gravel does also begin to be deposited upstream of Km 16over a period of 50 years. Coarse to very coarse gravels are limited to the area upstream of Km 21.5 overthe first 50 years of project operation. All other areas will develop a sand-sized or finer bed material.
4: PROJECT EFFECTS ON CHANNEL CONDITIONS
4.1 CHANNEL MORPHOLOGY WITHIN THE HEADPOND
The preceding analyses indicate that substantial sediment deposition will occur within the proposed head-pond. Coarser, gravel-sized sediments will be deposited at the upstream end and the texture of depositedmaterial will generally decrease in a downstream direction. Previous studies (MMA, 2000c) indicate thatBennett Dam has significantly reduced the frequency with which the coarser fraction of the river bedmaterials are transported. As a consequence, a lengthy period of time could be required for significantcoarse gravel accumulations to occur at the upstream end of the headpond. The most likely area for initialsediment deposition is upstream of Km 24. This will likely be associated with the enlargement of the pointbar at Km 27 and the development of a transverse bar, or possibly more distributed deltaic like sedimentaccumulation, between approximately Kms 28 and 24.
The historical air photo studies (MMA, 2000b) indicate that tributary fans have prograded followingconstruction of Bennett Dam. This trend will continue although headpond formation will further reducePeace River’s ability to redistribute the coarser fractions of the incoming tributary sediment load. Continuedenlargement is expected on the fans formed at Fourth Creek, Hamelin Creek and Ksituan River. However,

SEDIMENT TRANSPORT AND CHANNEL MORPHOLOGY STUDY UPDATE:PROPOSED PEACE RIVER AT DUNVEGAN HYDROELECTRIC PROJECT
Page 11 of 19
M. MILES AND ASSOCIATES LTD.
increased headpond levels for flows of <2,500 m³/s could further shift the preferred areas for coarse-textured sediment deposition toward the fan apex.
As discussed in SECTION 3.4, the incoming coarse silt or larger sized sediments will be deposited in theproposed headpond. The GSTARS 1D model indicates that the elevation of the channel bed will increaseby an average of 3 to 5 m (at the upstream and downstream ends of the headpond, respectively) over a50-year period. The analysis in SECTION 3.1 indicates that water velocities on the margins of the channelwill be less than those in the center of the channel. As a consequence, fine-textured sediment depositionin the nearshore areas could be somewhat greater than the average values of 3 to 5 m.
4.2 BED MATERIAL (SUBSTRATE) SIZE
The analyses in SECTIONS 3.2 and 3.4 indicate that water velocities within the proposed headpond aregenerally insufficient to maintain the present gravel bed. Sand or finer textured sediments will thereforebe deposited in all areas except near the upstream end of the headpond where gravel deposition isexpected. The GSTARS analyses [see SECTION 3.4] suggest that the gravel to sand transition will occur inthe vicinity of Km 18, however, other (possibly less reliable) analytical procedures indicate the transitioncould occur further upstream between Kms 20 and 23. As previously discussed, gravel deposition willgradually extend downstream over time. However, the small volumes and infrequent occurrence of graveltransport under the post-Bennett discharge conditions indicates that this will be a slow process.
The walleye spawning area associated with the transverse bar at Km 17 is expected to undergo a gravelto sand evolution. However, as indicated on Figures 3.4.1 to 3.4.3, the depth of sediment accumulationin this area may be reduced (in comparison to other parts of the headpond) as the height of the existingbar will locally increase water velocities. These elevated water velocities may periodically allow somelocalized sand mobilization during large floods (see SECTION 3.2). The GSTARS analyses indicate that thetotal depth of sediment deposition will be $2 m at 10 years and $3 m at 50 years. It is therefore unlikelythat sediment re-mobilization will expose or maintain the underlying gravelly materials.
Figures 3.4.4 and 3.4.5 illustrate how the deposited volume of coarser materials will increase over a 50-year period in the vicinity of Kms 17 and 18. The surface texture of the sediments forming the bed of thechannel will be initially composed of sand-sized or finer sediments soon after empondment. Thesematerials will gradually be replaced with very fine to medium gravel over the longer term. However, sandor silt-sized material will continue to be deposited during periods of low flow and any deposited gravels aretherefore expected to be intermixed or periodically covered with these finer sediments over the longerterm.

SEDIMENT TRANSPORT AND CHANNEL MORPHOLOGY STUDY UPDATE:PROPOSED PEACE RIVER AT DUNVEGAN HYDROELECTRIC PROJECT
Page 12 of 19
M. MILES AND ASSOCIATES LTD.
4.3 NEARSHORE SEDIMENT STABILITY
As discussed in SECTION 4.1, substantial quantities of fine-textured sediments will be deposited within thelower velocity areas located along the headpond margin. Portions of these deposits will be exposed duringperiods of reduced headpond water levels. Wave actions during periods of low water could locally re-entrain some of these materials. Exposed materials may also be periodically entrained by wind. However,the limited variation in headpond water levels under the proposed operating regime and nearshore ice orfrozen ground during the winter will restrict these processes in comparison to conditions in manyconventional reservoirs.
4.4 SHORELINE STABILITY
Agra Earth and Environmental Ltd. (Agra, 2000) has discussed the effects of increased water levels in theheadpond on valley wall stability. Additional mapping and analyses were undertaken in the context of thispresent report to assess the possible effects of raised water levels on shoreline stability.
4.4.1 Changes in Water Level
Predicted pre-Bennett, post-Bennett and post-Dunvegan water levels in the headpond are compared onFigures 4.4.1 & 4.4.2. The flows used in this analysis are summarized below:
CRITERIA
DISCHARGE (m³/s)
PRE-BENNETT POST-BENNETTPRE-DUNVEGAN
POST-BENNETTPOST-DUNVEGAN
95% exceedance 218 753 753
50% exceedance 822 1,540 1,540
5% exceedance 5,450 2,500 2,500
2-year return period flood 7,490 3,680 3,680
10-year return period flood 10,200 5,750 5,750
100-year return period flood 13,800 8,330 8,330
From Mack and Slack, 2005 Table 3.9 Hydraulics Report
The analyses on Figure 4.4.1 illustrate the project’s effects during commonly occurring discharges. Incontrast, Figure 4.4.2, compares water elevations over a range of flood flows. The pre-Bennett flood eleva-tions are particularly relevant as these flows have played a significant role in forming the pre-regulationchannel.
The data on Figure 4.4.1, indicate that post-Dunvegan water levels associated with 95% and 50% excee-dance flows will exceed pre-Bennett values throughout the headpond. In contrast pre-Bennett 5%exceedance flows will exceed post-Dunvegan elevations upstream of approximately Km 18.
Inspection of the 2-year return period flood elevations on Figure 4.4.2 indicate that the post-Dunveganwater levels are below the 2-year return period pre-Bennett levels throughout the upper 9 kilometers ofthe headpond. The post-Dunvegan water levels will exceed pre-Bennett flood levels downstream of Km

SEDIMENT TRANSPORT AND CHANNEL MORPHOLOGY STUDY UPDATE:PROPOSED PEACE RIVER AT DUNVEGAN HYDROELECTRIC PROJECT
Page 13 of 19
M. MILES AND ASSOCIATES LTD.
17 for the 2-year flood, downstream of Km 16 for the 10-year flood and downstream of Km 14 for the 100-year flood. The newly inundated areas range up to approximately 4 m in height at the downstream endof the headpond.
4.4.2 Shoreline Mapping Criteria
The distribution of commonly occurring surficial materials along the headpond shoreline was interpretedfrom 1:20,000 scale black and white air photos flown in 1992 (Table 4.4.1). Surficial materials wereclassified using the terminology described in Howes and Kenk (1988). Given the limited objectives of thepresent study, a simple shoreline classification system was developed which includes five units:
(1) colluvial veneer over rock;
(2) colluvial fan or colluvial apron;
(3) fluvial terrace;
(4) fluvial island or vegetated bar of recent origin; and
(5) fluvial fan.
Colluvial materials are those which have “reached their present position as a result of direct, gravity-induced movement involving no agent of transportation such as water or ice, although the moving materialmay have contained water and/or ice” (Howes & Kenk, 1988, p. 11). For the purposes of this study,veneers are defined to be less than a few metres in thickness. Fans or aprons (which typically consist ofcoalesced fans) are composed of thicker colluvial materials which have typically been deposited at the baseof one or more gullies. This category includes earthflow deposits. All colluvial shorelines may include thindeposits of fine textured fluvial sediments deposited by Peace River during periods of high water level.Photographs of colluvial veneers are shown in APPENDIX 2. Examples of colluvial fan or apron deposits arepresented in APPENDIX 3. These photos illustrate the types of shoreline instability which is presentlyoccurring along this section of Peace River.
Fluvial sediments have been deposited by streams and rivers. Three types of fluvial deposits have beenidentified. Fluvial terraces consist of post-glacial materials which were deposited when the river was at ahigher elevation. These surfaces are either not inundated, or rarely inundated, under the contemporaryriver regime. Fluvial islands or bars are composed of gravel deposits which were generally established priorto river regulation by Bennett Dam. Reductions in peak flows following construction of Bennett Dam haveallowed fine sediment deposits and a vegetation cover to become established on these sites. Fluvial fansconsist of low-gradient deposits formed at the outlets of sizeable tributaries (such as Fourth Creek, HamelinCreek or Ksituan River) and smaller streams. Representative photographs of fluvial terrace deposits areshown in APPENDIX 4; island or bar deposits are illustrated in APPENDIX 5 and fluvial fan deposits are shownin APPENDIX 6. Additional photographs of recent fluvial deposits are available in MMA (2000c).
4.4.3 Shoreline Composition
The shoreline mapping is presented in APPENDIX 7.

SEDIMENT TRANSPORT AND CHANNEL MORPHOLOGY STUDY UPDATE:PROPOSED PEACE RIVER AT DUNVEGAN HYDROELECTRIC PROJECT
Page 14 of 19
1 Defined when looking downstream.
2 This measurement includes the perimeter of islands and the length of bars located on the side of the river.
3 In areas with islands or bars, the shoreline type forming the upslope bank has been used for this analysis.
4 The analyses in this section specifically address shoreline erosion of unconsolidated material. The reader isreferred to studies by AGRA Earth and Environmental Ltd. (2000) which discusses the potential effect of theheadpond on slope stability.
M. MILES AND ASSOCIATES LTD.
The lengths of various shoreline materials have been measured on both the left and right channel banks *1
along 28 km of channel located upstream of the proposed Dunvegan headworks. These measurements(which exclude island and bar deposits as these are analyzed separately), are compiled in Table 4.4.2 andsummarized below.
SHORELINE TYPELENGTH (km) % OF TOTAL
Left Bank Right Bank Both Banks Left Bank Right Bank Both Banks
Colluvial veneer over rock 9.4 17.7 27.1 34 62 48
Colluvial fan or colluvial apron 10.7 6.0 16.7 38 21 29
Fluvial fan 1.6 5.0 6.6 6 17 12
Fluvial terrace 6.3 0.0 6.3 22 0 11
TOTAL 28.0 28.7 56.7 100 100 100
Nearly half the shoreline is composed of colluvial veneer over rock and colluvial fans or aprons comprisenearly 30%. The remaining shoreline areas are composed of approximately equal proportions of fluvialfan and terrace deposits. As indicated on Table 4.4.3, island or bar deposits have a length of 15.7 km.*2
The distribution of shoreline types (excluding bars and islands) as a function of distance upstream of theheadworks is shown on Figures 4.4.1 to 4.4.4. This information has been compiled for both the left andright channel banks and is expressed as a percentage of the total shoreline length. *3 As indicated onFigures 4.4.1 & 4.4.2, colluvial veneers occur more commonly on the right bank, while colluvial fans (whichare frequently earthflow deposits) are more common on the left bank. The larger fluvial fan deposits alloccur on the right bank and principally reflect sediment deposition at the mouths of Fourth Creek, HamelinCreek and Ksituan River. Fluvial terrace deposits are all located on the left bank between Kms 21 to 28and Kms 7 to 10. The distribution of islands or vegetated bars is illustrated on Figure 4.4.5. The majorislands occur in the vicinity of Kms 24, 18.5, 10 and 6.5. Sizeable bars typically occur downstream of themajor right bank tributaries, as point bars on the inside of river bends and in lee areas which create sitesof preferential sediment accumulation.
4.4.4 Post-Dunvegan Shoreline Stability *4
Post-Dunvegan water levels will be below the pre-Bennett Dam 2-year return period flood elevationsupstream of Km 17. Within this upper area, raised water levels will cause some inundation of low-lyingareas (see Figures 3.2.1 & 3.2.2 in Mack and Slack, 2005). However, the inundated channel banks or valleywalls were exposed to river flow prior to river regulation by Bennett Dam. As a consequence, areas whereprevious river reworking has formed lag deposits on the surface should be relatively resistant to erosion.
SEDIMENT TRANSPORT AND CHANNEL MORPHOLOGY STUDY UPDATE:PROPOSED PEACE RIVER AT DUNVEGAN HYDROELECTRIC PROJECT
Page 15 of 19
M. MILES AND ASSOCIATES LTD.
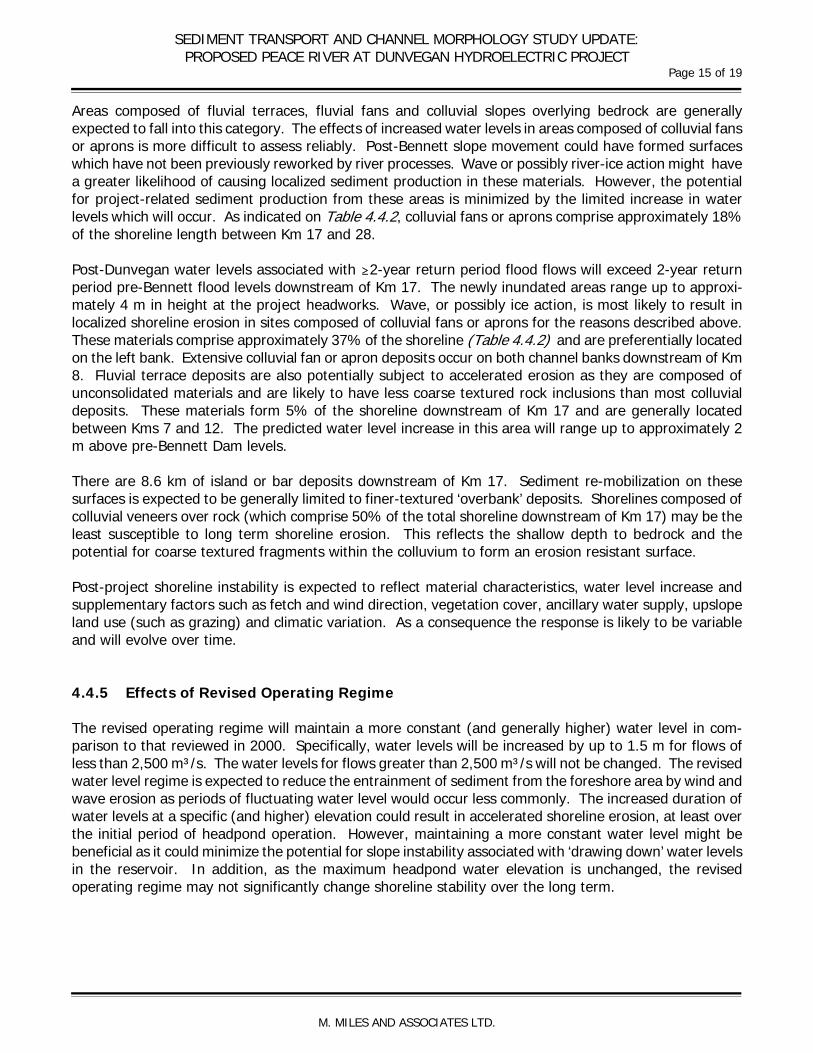
Areas composed of fluvial terraces, fluvial fans and colluvial slopes overlying bedrock are generallyexpected to fall into this category. The effects of increased water levels in areas composed of colluvial fansor aprons is more difficult to assess reliably. Post-Bennett slope movement could have formed surfaceswhich have not been previously reworked by river processes. Wave or possibly river-ice action might havea greater likelihood of causing localized sediment production in these materials. However, the potentialfor project-related sediment production from these areas is minimized by the limited increase in waterlevels which will occur. As indicated on Table 4.4.2, colluvial fans or aprons comprise approximately 18%of the shoreline length between Km 17 and 28.
Post-Dunvegan water levels associated with $2-year return period flood flows will exceed 2-year returnperiod pre-Bennett flood levels downstream of Km 17. The newly inundated areas range up to approxi-mately 4 m in height at the project headworks. Wave, or possibly ice action, is most likely to result inlocalized shoreline erosion in sites composed of colluvial fans or aprons for the reasons described above.These materials comprise approximately 37% of the shoreline (Table 4.4.2) and are preferentially locatedon the left bank. Extensive colluvial fan or apron deposits occur on both channel banks downstream of Km8. Fluvial terrace deposits are also potentially subject to accelerated erosion as they are composed ofunconsolidated materials and are likely to have less coarse textured rock inclusions than most colluvialdeposits. These materials form 5% of the shoreline downstream of Km 17 and are generally locatedbetween Kms 7 and 12. The predicted water level increase in this area will range up to approximately 2m above pre-Bennett Dam levels.
There are 8.6 km of island or bar deposits downstream of Km 17. Sediment re-mobilization on thesesurfaces is expected to be generally limited to finer-textured ‘overbank’ deposits. Shorelines composed ofcolluvial veneers over rock (which comprise 50% of the total shoreline downstream of Km 17) may be theleast susceptible to long term shoreline erosion. This reflects the shallow depth to bedrock and thepotential for coarse textured fragments within the colluvium to form an erosion resistant surface.
Post-project shoreline instability is expected to reflect material characteristics, water level increase andsupplementary factors such as fetch and wind direction, vegetation cover, ancillary water supply, upslopeland use (such as grazing) and climatic variation. As a consequence the response is likely to be variableand will evolve over time.
4.4.5 Effects of Revised Operating Regime
The revised operating regime will maintain a more constant (and generally higher) water level in com-parison to that reviewed in 2000. Specifically, water levels will be increased by up to 1.5 m for flows ofless than 2,500 m³/s. The water levels for flows greater than 2,500 m³/s will not be changed. The revisedwater level regime is expected to reduce the entrainment of sediment from the foreshore area by wind andwave erosion as periods of fluctuating water level would occur less commonly. The increased duration ofwater levels at a specific (and higher) elevation could result in accelerated shoreline erosion, at least overthe initial period of headpond operation. However, maintaining a more constant water level might bebeneficial as it could minimize the potential for slope instability associated with ‘drawing down’ water levelsin the reservoir. In addition, as the maximum headpond water elevation is unchanged, the revisedoperating regime may not significantly change shoreline stability over the long term.

SEDIMENT TRANSPORT AND CHANNEL MORPHOLOGY STUDY UPDATE:PROPOSED PEACE RIVER AT DUNVEGAN HYDROELECTRIC PROJECT
Page 16 of 19
1 This equivalent erosion rate assumes a headpond length of 28 km.
M. MILES AND ASSOCIATES LTD.
4.4.6 Environmental Effects
The analyses in SECTION 3.4 of this report indicate that the average rate of sediment deposition in theproposed headpond over 50 years will be approximately 700,000 m³/yr. This volume of material, whichwill be derived from the upstream watershed, is equivalent to an annual erosion rate of 12.5 cubic metresper metre of headpond shoreline. *1 The volume of sediment production due to shoreline erosion cannotbe reliably predicted, but it should be much less than this value. Shoreline erosion is therefore notexpected to significantly affect the net sediment balance in the headpond over the long term. Localizedsediment accumulations could, however, occur adjacent to erosion-susceptible materials and result insediment deposits similar to those illustrated in APPENDICES 2 and 3.
Suspended sediment data are available from the WSC stations Peace River at Dunvegan and Peace Riverat Peace River. Analyses in M.A. Carson and Associates (1992) and MMA (2000b), indicate that theaverage annual suspended sediment loads at these two sites are 15,600,000 t/yr and 33,700,000 t/yr,respectively. As indicated on Figures 4.4.6 & 4.4.7, maximum observed suspended sediment concen-trations at these sites are 4,730 and 13,000 mg/L, respectively. [The higher values at the “Peace River”gauge generally reflect sediment contributions from Smokey River.] Data from these sites illustrate thestrong seasonal variation in sediment production with maximum loadings typically occurring during thespring and summer. The annual loads and maximum suspended sediment concentrations are sufficientlyhigh that it would be difficult to detect incremental increases in sediment transport due to shoreline erosionin the Dunvegan headpond, except in circumstances of very large sediment inputs. Cold temperatures andice cover are expected to minimize the potential for shoreline erosion in the headpond during the winterperiod when naturally occurring suspended sediment concentrations reach their minimum values.
4.4.7 Shoreline Stabilization
A variety of techniques are available to stabilize eroding sections of shoreline. These range from traditionalengineering techniques employing rock rip-rap (e.g. Thorne et al., 1995; Transportation Association ofCanada, 2001; or Schiereck, 2001), which are suitable for protecting valuable infrastructure, to soil bio-engineering techniques which are more appropriate for undeveloped sites. Soil bioengineering manualsby Muhlberg and Moore (1998); USDA Natural Resources Conservation Service (1998); Hoag and Fripp(2002); Washington State Aquatic Habitat Guidelines Program (2002) and Polster (2001 & 2005) containdescriptions of techniques which might be successfully used to reduce shoreline erosion or promote shore-line stability along the Dunvegan headpond, should this be required.

SEDIMENT TRANSPORT AND CHANNEL MORPHOLOGY STUDY UPDATE:PROPOSED PEACE RIVER AT DUNVEGAN HYDROELECTRIC PROJECT
Page 17 of 19
M. MILES AND ASSOCIATES LTD.
4.5: DOWNSTREAM CHANNEL EVOLUTION
The GSTARS analyses in SECTION 3.4 indicate that predicted average annual sediment accumulation in theheadpond of 670,000 to 700,000 m³/yr is very similar to the 650,000 m³/yr estimated for the previousproject operating regime (MMA, 2000c). As a consequence, the downstream channel impact predictionspresented in MMA, 2000d remain unchanged. Relevant conclusions include:
i) Sediment trapping in the proposed headpond will reduce the coarse textured sedimentload to the downstream channel. However, the post-Bennett flow regime is generallyincapable of mobilizing the channel bed. As a consequence, a significant accelerationin channel downcutting or degradation below the proposed headworks is not expected;
ii) The GSTARS analysis indicates that nearly all the silt and clay sized sediment load willpass through the Dunvegan headpond. These sized materials make up the majorityof the sediment load. In contrast, 27 to 82% of the sand-sized materials (dependingon their grain size) will be deposited (see Table 3.4.2). The deposition of these sedi-ments in the headpond is not expected to significantly affect downstream channelstability, but sediment accumulation rates in overbank or slack water sites could bereduced. These effects are likely to be minimized or undetectable downstream of largesediment sources, such as Smokey River; and
iii) The Hines Creek fan will continue to aggrade, constrict the river channel and possiblycause further channel downcutting in the vicinity of the Highway 2 Bridge. Thisprocess has occurred under the present regulated flow regime and bedload depositionin the proposed headpond is not expected to result in a significant acceleration. Thereport by nhcl (2004) also indicates that the proposed headworks will not significantlyalter the velocity distribution in the vicinity of the Dunvegan Bridge.
5: CONCLUSIONS AND DISCUSSION
The revised Dunvegan project will not change the maximum headpond water levels in comparison to theoperating regime investigated in 2000. However the proposed operating regime will increase the elevationand duration of water levels in the headpond for flows of #2,500 m³/s. The associated reduction in watervelocities will result in an approximately 1% increase in the volume of sediment deposited in the headpondover 50 years and a slight increase in the average depth of sediment deposition (0.3 m over 50 years).The resulting effects on channel processes and downstream channel stability are generally not significantlydifferent to that predicted in 2000. However, the revised analyses do indicate that there is a greaterlikelihood that the walleye spawning area at Km 17 will become sand-bedded following headpondconstruction. Similarly, the higher, and more consistent, water level could increase the likelihood oflocalized bank erosion in areas which were not previously inundated during pre-Bennett Dam flood flows.The duration and magnitude of these effects will evolve over time. As a consequence, monitoring wouldbe required to quantify what actually occurs following construction of the Dunvegan project.

SEDIMENT TRANSPORT AND CHANNEL MORPHOLOGY STUDY UPDATE:PROPOSED PEACE RIVER AT DUNVEGAN HYDROELECTRIC PROJECT
Page 18 of 19
M. MILES AND ASSOCIATES LTD.
6: CERTIFICATION
This report was prepared by:
__________________________
Mike Miles, M.Sc., P.Geo.M. Miles and Associates Ltd.
7: SOURCES OF INFORMATION
AGRA Earth & Environmental Limited. 2000. Dunvegan Low-Head Hydro Project Headpond Slope StabilityAssessment Peace River Near Dunvegan, Alberta. Report prepared for Glacier Power Ltd. 21 p.
Brune, G.M. 1953. Trap Efficiency of Reservoirs. Trans. American Geophysical Union. Volume 34 (3). pp. 407-418.
Canadian Projects Ltd. 2005. Dunvegan Hydro Project: Project Definition. Unpublished report prepared for GlacierPower, Calgary, AB. 42 p.
Churchill, M.A. 1948. Discussion of “Analysis and Use of Reservoir Sedimentation Data” by L. C. Gottschalk, pp. 139-140. Proceedings Federal Inter-Agency Sedimentation Conference, Denver.
Dingman, S. Lawrence. 1984. FLUVIAL HYDROLOGY. W.H. Freeman and Company., New York.
Hoag, Chris and Jon Fripp. 2002. Streambank Soil Bioengineering Field Guide for Low Precipitation Areas. USNational Design, Construction and Soil Mechanics Center. 66 p.
Howes, D.E. and E. Kenk. 1988. Terrain Classification System for British Columbia (Revised Edition): A system forthe classification of surficial materials, landforms and geological processes of British Columbia. RecreationalFisheries Branch, Ministry of Environment and Surveys and Resource Mapping Branch, Ministry of CrownLands. MOE Manual 10. 90 p.
Julien, Pierre Y. 2002. RIVER MECHANICS. Cambridge University Press. 434 p.
Kellerhals, R., C.R. Neil and D.I. Bray. 1972. Hydraulic and Geomorphic Characteristics of Rivers in Alberta. RiverEngineering and Surface Hydrology Report 72-1, Research Council of Alberta. 383 p.
M.A. Carson and Associates. 1992. Assessment of Sediment Transport Data and Sediment Budget Analysis for thePeace-Slave River System, Alberta. Phase II: Sediment Loads and Regional Budget. Unpublished reportprepared for Inland Water Directorate. 79 p.
Mack and Slack. 2004. Dunvegan Hydroelectric Project Hydrology. Unpub. draft prepared for Glacier Power, Cal, AB.
________. 2005. Dunvegan Hydroelectric Project Hydraulics Report. Unpub. draft prep. for Glacier Power,Calgary, AB.

SEDIMENT TRANSPORT AND CHANNEL MORPHOLOGY STUDY UPDATE:PROPOSED PEACE RIVER AT DUNVEGAN HYDROELECTRIC PROJECT
Page 19 of 19
M. MILES AND ASSOCIATES LTD.
M. Miles and Associates Ltd. 2000a. Dunvegan Hydroelectric Project: Results of Bed Material Sampling Program.Unpublished report prepared for Glacier Power Ltd., Calgary, AB.
________. 2000b. Dunvegan Hydroelectric Project: Compilation of Historical Air Photos. Unpublished reportprepared for Glacier Power Ltd., Calgary, AB.
________. 2000c. Dunvegan Hydroelectric Project: Sediment Transport and Channel Morphology Assessment.Unpublished report prepared for Glacier Power Ltd., Calgary, AB.
________. 2000d. Dunvegan Hydroelectric Project Impact Evaluation: Channel Morphology and Sediment Transport.Unpublished report prepared for Glacier Power Ltd., Calgary, AB.
Morris, G.L. and J. Fan. 1998. RESERVOIR SEDIMENTATION. McGraw Hill. Toronto.
Muhlberg, Gay A. And Nancy J. Moore. 1998. Streambank Revegetation and Protection: A guide for Alaska.Technical Report No: 98-3. 57 p.
nhcl. 2004. Dunvegan Hydroelectric Project: 2D Numerical Hydraulic Modelling – 100-Year Flood Event.Memorandum, dated June 14, to Canadian Projects Ltd. and Focus Environmental. 6 p.
Polster, D.F. 2001. Streambank Restoration Manual for British Columbia. Prepared for Watershed RestorationProgram, BC Ministry of Environment, Lands and Parks. 71 p.
Polster, David R. 2005. Soil Bioengineering for Land Restoration and Slope Stabilization. 95 p.
Schiereck, Gerrit J. 2001. Introduction to Bed, Bank and Shore Protection: Engineering the interface of soil andwater. Delft University Press. 397 p.
Thorne, Colin, R., Steven R. Abt, Frans B.J. Barends, Stephen T. Maynord and Krsytian W. Pilarczyk, [eds.] 1995.River Coastal and Shoreline Protection: Erosion control using riprap and armourstone. John Wiley & Sons.785 p.
Transportation Association of Canada. 2001. Guide to Bridge Hydraulics: Second Edition. 181 p.
Yang, C.T. and F.J.M. Simões. 2002. User’s manual for GSTAR3 (Generalized Stream Tube model for Alluvial RiverSimulation version 3.0). U.s. Bureau of Reclamation, Technical Service Center, Denver, Colorado.
US Army Corps of Engineers. 2002. HEC-RAS River Analysis System. User’s Manual Version 3.1.
USDA Natural Resources Conservation Service. 1998. The Practical Streambank Bioengineering Guide. User’s Guidefor Natural Streambank Stabilization Techniques in the Arid and Semi-arid Great Basin and IntermountainWest. 67 p.
Washington State Aquatic Habitat Guidelines Program. 2002. Integrated Streambank Protection Guidelines.

SEDIMENT TRANSPORT AND CHANNEL MORPHOLOGY STUDY UPDATE:PROPOSED PEACE RIVER AT DUNVEGAN HYDROELECTRIC PROJECT
M. MILES AND ASSOCIATES LTD.
FIGURES

SEDIMENT TRANSPORT AND CHANNEL MORPHOLOGY STUDY UPDATE:PROPOSED PEACE RIVER AT DUNVEGAN HYDROELECTRIC PROJECT
M. MILES AND ASSOCIATES LTD.
FIGURES

28 26 24 22 20 18 16 14 12 10 8 6 4 2 0KILOMETERS
0
0.2
0.4
0.6
0.8
1
1.2
1.4
1.6
1.8
2
2.2
2.4
2.6
2.8
3
3.2
3.4
3.6
3.8
4
4.2
4.4
4.6
4.8
5
5.2
5.4
5.6
VEL
OC
ITY
(m
/s)
Pre-Bennett
Post-Bennett Pre-Dunvegan
Post-Bennett Post-Dunvagan
90% EXCEEDANCE WATER VELOCITY
Figure 3.1.1: Downstream variation in average headpond water velocity for the 90% exceedance flow in relationship to the predicted water velocity at the gravel sand transition.
F - 1 M. MILES AND ASSOCIATES LTD.

28 26 24 22 20 18 16 14 12 10 8 6 4 2 0KILOMETERS
0
0.2
0.4
0.6
0.8
1
1.2
1.4
1.6
1.8
2
2.2
2.4
2.6
2.8
3
3.2
3.4
3.6
3.8
4
4.2
4.4
4.6
4.8
5
5.2
5.4
5.6
VEL
OC
ITY
(m
/s)
0.9 m/s - Proposed Criterion for Gravel to Sand Bed Transition
Pre-Bennett
Post-Bennett Pre-Dunvegan
Post-Bennett Post-Dunvagan
50% EXCEEDANCE WATER VELOCITY
Figure 3.1.2: Downstream variation in average headpond water velocity for the 50% exceedance flow in relationship to the predicted water velocity at the gravel sand transition.
F - 2 M. MILES AND ASSOCIATES LTD.

28 26 24 22 20 18 16 14 12 10 8 6 4 2 0KILOMETERS
0
0.2
0.4
0.6
0.8
1
1.2
1.4
1.6
1.8
2
2.2
2.4
2.6
2.8
3
3.2
3.4
3.6
3.8
4
4.2
4.4
4.6
4.8
5
5.2
5.4
5.6
VEL
OC
ITY
(m
/s)
1.6 m/s - Proposed Criterion for Gravel to Sand Bed Transition
Pre-Bennett
Post-Bennett Pre-Dunvegan
Post-Bennett Post-Dunvagan
2-YEAR FLOOD WATER VELOCITY
Figure 3.1.3: Downstream variation in average headpond water velocity for the 2-yr return period flood in relationship to the predicted water velocity at the gravel sand transition.
F - 3 M. MILES AND ASSOCIATES LTD.

28 26 24 22 20 18 16 14 12 10 8 6 4 2 0KILOMETERS
0
0.2
0.4
0.6
0.8
1
1.2
1.4
1.6
1.8
2
2.2
2.4
2.6
2.8
3
3.2
3.4
3.6
3.8
4
4.2
4.4
4.6
4.8
5
5.2
5.4
5.6
VEL
OC
ITY
(m
/s)
1.8 m/s - Proposed Criterion for Gravel to Sand Bed Transition
Pre-Bennett
Post-Bennett Pre-Dunvegan
Post-Bennett Post-Dunvagan
5-YEAR FLOOD WATER VELOCITY
Figure 3.1.4: Downstream variation in average headpond water velocity for the 5-yr return period flood in relationship to the predicted water velocity at the gravel sand transition.
F - 4 M. MILES AND ASSOCIATES LTD.
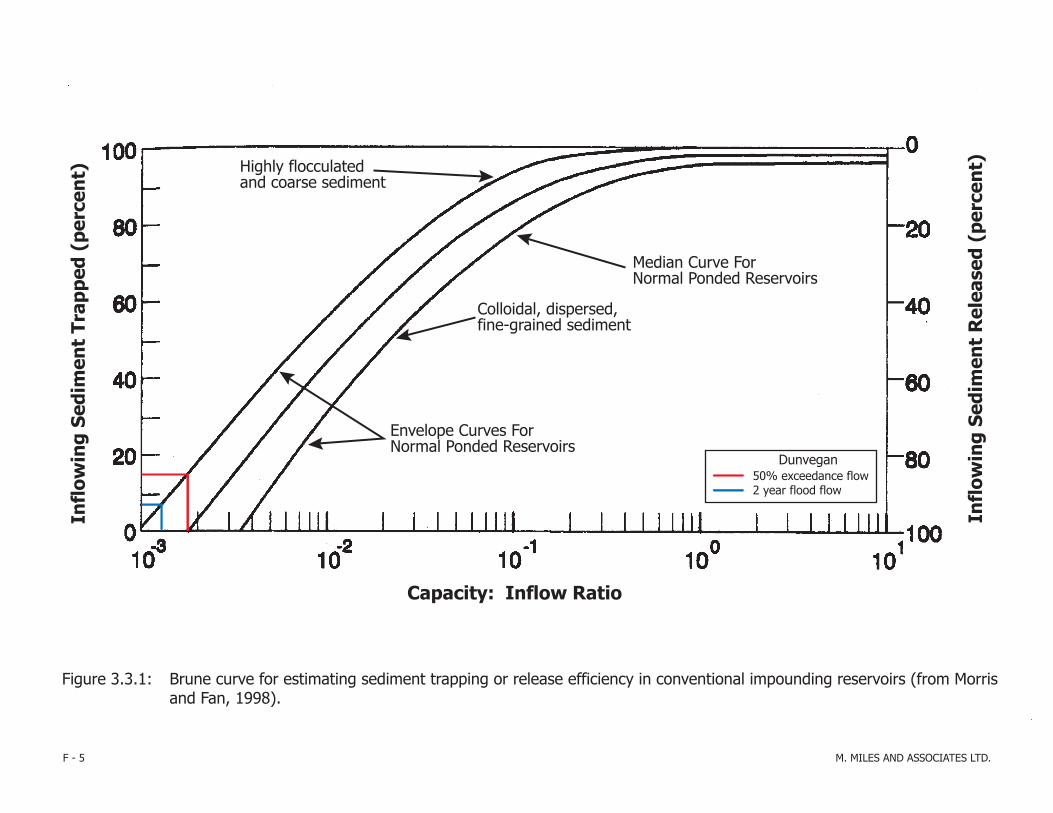
Figure 3.3.1: Brune curve for estimating sediment trapping or release efficiency in conventional impounding reservoirs (from Morris and Fan, 1998).
F - 5 M. MILES AND ASSOCIATES LTD.
Capacity: Inflow Ratio
Infl
owin
g Se
dim
ent
Rel
ease
d (p
erce
nt)
Infl
owin
g Se
dim
ent
Trap
ped
(per
cen
t)
Dunvegan50% exceedance flow2 year flood flow
Envelope Curves ForNormal Ponded Reservoirs
Colloidal, dispersed,fine-grained sediment
Median Curve ForNormal Ponded Reservoirs
Highly flocculatedand coarse sediment
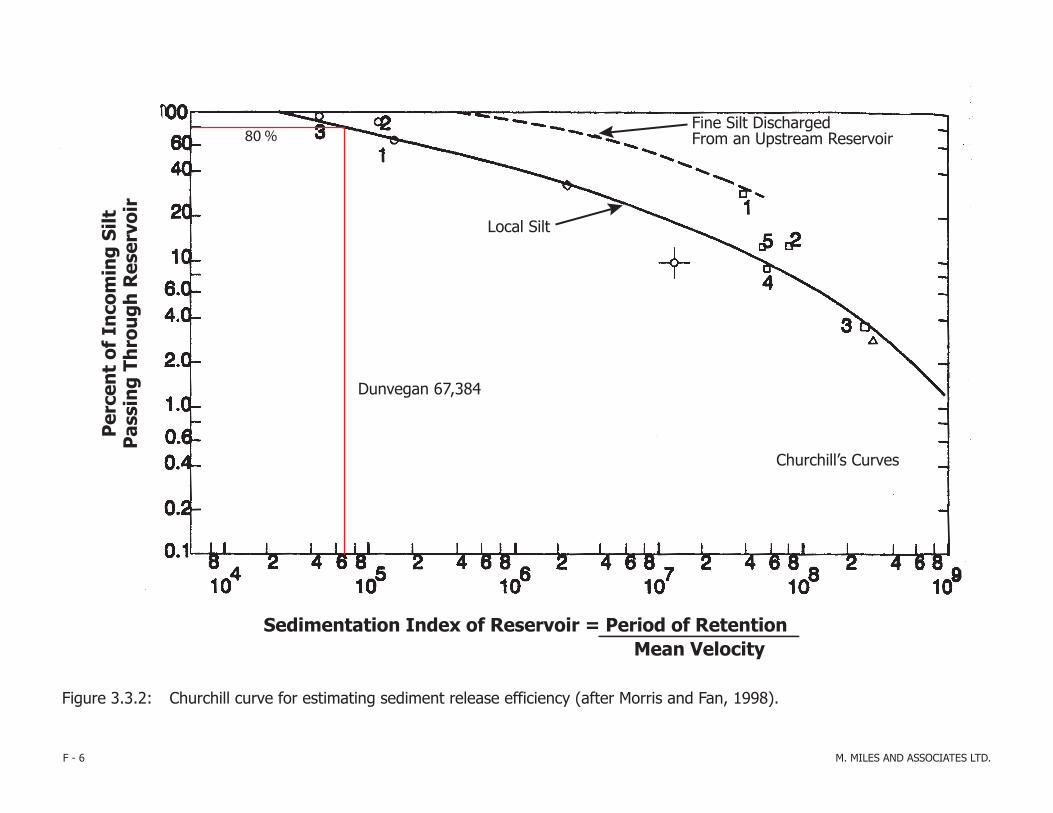
Figure 3.3.2: Churchill curve for estimating sediment release efficiency (after Morris and Fan, 1998).
F - 6 M. MILES AND ASSOCIATES LTD.
Sedimentation Index of Reservoir = Period of Retention
Per
cen
t of
In
com
ing
Silt
Pas
sin
g Th
rou
gh R
eser
voir
Mean Velocity
Local Silt
Churchill’s Curves
Dunvegan 67,384
Fine Silt DischargedFrom an Upstream Reservoir80 %

C5 nuR seliforP deB reviR ecaeP
433
633
833
043
243
443
643
843
053
253
000030005200002000510000100050
)m( ecnatsiD
Elev
atio
n (m
)
laitinI1 raeY retfA4 raeY retfA5 raeY retfA7 raeY retfA01 raeY retfA02 raeY retfA03 raeY retfA04 raeY retfA05 raeY retfAleveL retaW
Figure 3.4.1: Bed profiles through headpond predicted by GSTARS over a 50 year period (from McLean May 17, 2005).
F - 7 M. MILES AND ASSOCIATES LTD.
Peace River Profiles-Run 6
334
336
338
340
342
344
346
348
350
352
0 5000 10000 15000 20000 25000 30000
Distance from Dam (m )
ta
vel
E)
m( n
oi
initialafter Year 10after Year 20after Year 30after Year 40after Year 50waterl level
Longitudinal Profile Through Headpond
334
336
338
340
342
344
346
348
350
352
0 5000 10000 15000 20000 25000 30000
Distance Upstream from Dam (m )
)m(
noit
av
elE
init ia bed level
2000 design
present design
w ater level
Figure 3.4.3: Effect of increasing tailwater level after 50 years: GSTARS results comparing the present headpond configuration with that proposed in 2000 (from McLean July 4, 2005).
Figure 3.4.2: Computed profiles in headpond with transmissive boundary at dam predicted by GSTARS (from McLean July 4, 2005).
F - 8 M. MILES AND ASSOCIATES LTD.

020
0040
0060
0080
00
1000
0
1200
014
000
1600
0
1800
020
000
2200
0
2400
0
2600
0
DISTANCE UPSTREAM OF WEIR (m)
100
1,000
10,000
100,000
1,000,000
10,000,000
VO
LUM
E O
F SE
DIM
ENT
DEP
OSI
TIO
N (
m3 )
Coarse to V. Coarse GravelV. Fine to Medium GravelFine Sand to Coarse SandCoarse Clay to Coarse Silt
Figure 3.4.4: Sediment deposition in headpond over a 10-year period.
F - 9 M. MILES AND ASSOCIATES LTD.

020
0040
0060
0080
00
1000
0
1200
014
000
1600
0
1800
020
000
2200
0
2400
0
2600
0
DISTANCE UPSTREAM OF WEIR (m)
100
1,000
10,000
100,000
1,000,000
10,000,000
VO
LUM
E O
F SE
DIM
ENT
DEP
OSI
TIO
N (
m3 )
Coarse to V. Coarse GravelV. Fine to Medium GravelFine Sand to Coarse SandCoarse Clay to Coarse Silt
Figure 3.4.5: Sediment deposition in headpond over a 50-year period.
F - 10 M. MILES AND ASSOCIATES LTD.

30,000 25,000 20,000 15,000 10,000 5,000 0
River Station (m)
334
336
338
340
342
344
346
348
350
352
354
356
358E
leva
tion
(m)
Post-DunveganPost-BennettPre-BennettRiver Bed
95% EXCEEDANCE
Figure 4.4.1: Comparison of pre-Bennett, post-Bennett and post-Dunvegan water levels in the headpond area for 95%, 50% and 5% exceedance flood flows (data from Mack and Slack, 2005).
F - 11 M. MILES AND ASSOCIATES LTD.
30,000 25,000 20,000 15,000 10,000 5,000 0
River Station (m)
334
336
338
340
342
344
346
348
350
352
354
356
358
Ele
vatio
n (m
)
50% EXCEEDANCE
30,000 25,000 20,000 15,000 10,000 5,000 0
River Station (m)
334
336
338
340
342
344
346
348
350
352
354
356
358
Ele
vatio
n (m
)
5% EXCEEDANCE

30,000 25,000 20,000 15,000 10,000 5,000 0
River Station (m)
334
336
338
340
342
344
346
348
350
352
354
356
358E
leva
tion
(m)
Post-DunveganPost-BennettPre-BennettRiver Bed
2-YEAR FLOOD
Figure 4.4.2: Comparison of pre-Bennett, post-Bennett and post-Dunvegan water levels in the headpond area for 2, 10 and 100-year exceedance flood flows (data from Mack and Slack, 2005).
F - 12 M. MILES AND ASSOCIATES LTD.
30,000 25,000 20,000 15,000 10,000 5,000 0
River Station (m)
334
336
338
340
342
344
346
348
350
352
354
356
358
Ele
vatio
n (m
)
10-YEAR FLOOD
30,000 25,000 20,000 15,000 10,000 5,000 0
River Station (m)
334
336
338
340
342
344
346
348
350
352
354
356
358
Ele
vatio
n (m
)
100-YEAR FLOOD

28 27 26 25 24 23 22 21 20 19 18 17 16 15 14 13 12 11 10 9 8 7 6 5 4 3 2 1 0
DISTANCE (km) UPSTREAM OF HEADWORKS
0
10
20
30
40
50
60
70
80
90
100
SHO
RE
LIN
E C
OM
PO
SITI
ON
(%)
LEFT BANK
Figure 4.4.3: Distribution of colluvial veneer over rock.F - 13 M. MILES AND ASSOCIATES LTD.
28 27 26 25 24 23 22 21 20 19 18 17 16 15 14 13 12 11 10 9 8 7 6 5 4 3 2 1 0
DISTANCE (km) UPSTREAM OF HEADWORKS
0
10
20
30
40
50
60
70
80
90
100
SHO
RE
LIN
E C
OM
PO
SITI
ON
(%)
RIGHT BANK

28 27 26 25 24 23 22 21 20 19 18 17 16 15 14 13 12 11 10 9 8 7 6 5 4 3 2 1 0
DISTANCE (km) UPSTREAM OF HEADWORKS
0
10
20
30
40
50
60
70
80
90
100SH
OR
ELI
NE
CO
MP
OS
ITIO
N (%
)
LEFT BANK
Figure 4.4.4: Distribution of colluvial fans or aprons.
F - 14 M. MILES AND ASSOCIATES LTD.
28 27 26 25 24 23 22 21 20 19 18 17 16 15 14 13 12 11 10 9 8 7 6 5 4 3 2 1 0
DISTANCE (km) UPSTREAM OF HEADWORKS
0
10
20
30
40
50
60
70
80
90
100
SHO
RE
LIN
E C
OM
PO
SITI
ON
(%)
RIGHT BANK

28 27 26 25 24 23 22 21 20 19 18 17 16 15 14 13 12 11 10 9 8 7 6 5 4 3 2 1 0
DISTANCE (km) UPSTREAM OF HEADWORKS
0
10
20
30
40
50
60
70
80
90
100SH
OR
ELI
NE
CO
MP
OS
ITIO
N (%
)
LEFT BANK
Figure 4.4.5: Distribution of fluvial fans.
F - 15 M. MILES AND ASSOCIATES LTD.
28 27 26 25 24 23 22 21 20 19 18 17 16 15 14 13 12 11 10 9 8 7 6 5 4 3 2 1 0
DISTANCE (km) UPSTREAM OF HEADWORKS
0
10
20
30
40
50
60
70
80
90
100
SHO
RE
LIN
E C
OM
PO
SITI
ON
(%)
RIGHT BANK

28 27 26 25 24 23 22 21 20 19 18 17 16 15 14 13 12 11 10 9 8 7 6 5 4 3 2 1 0
DISTANCE (km) UPSTREAM OF HEADWORKS
0
10
20
30
40
50
60
70
80
90
100SH
OR
ELI
NE
CO
MP
OSI
TIO
N (%
)
LEFT BANK
Figure 4.4.6: Distribution of fluvial terraces.
F - 16 M. MILES AND ASSOCIATES LTD.
28 27 26 25 24 23 22 21 20 19 18 17 16 15 14 13 12 11 10 9 8 7 6 5 4 3 2 1 0
DISTANCE (km) UPSTREAM OF HEADWORKS
0
10
20
30
40
50
60
70
80
90
100
SHO
RE
LIN
E C
OM
PO
SITI
ON
(%)
RIGHT BANK

27 26 25 24 23 22 21 20 19 18 17 16 15 14 13 12 11 10 9 8 7 6 5 4 3 2 1 0
DISTANCE UPSTREAM OF HEADWORKS (km)
0.0
0.1
0.2
0.3
0.4
0.5
0.6
0.7
0.8
0.9
1.0
1.1
1.2
1.3
1.4
1.5
1.6
1.7
1.8
1.9
2.0
2.1
2.2
LEN
GTH
OF
ISLA
ND
S O
R B
AR
S (k
m)
Figure 4.4.7: Distribution of fluvial islands or vegetated bars of recent origin.
F - 17 M. MILES AND ASSOCIATES LTD.

1-Jan 1-Feb 1-Mar 1-Apr 1-May 1-Jun 1-Jul 1-Aug 1-Sep 1-Oct 1-Nov 1-Dec 1-Jan1
10
100
1,000
10,000
Susp
ende
d Se
dim
ent C
once
ntra
tion
(mg/
L)
PEACE RIVER AT DUNVEGAN BRIDGE - 1975 to 1996
Figure 4.4.8: Seasonal variation in suspended sediment concentrations observed on Peace River at Dunvegan
F - 18 M. MILES AND ASSOCIATES LTD.

1-Jan 1-Feb 1-Mar 1-Apr 1-May 1-Jun 1-Jul 1-Aug 1-Sep 1-Oct 1-Nov 1-Dec1
10
100
1,000
10,000
100,000
Susp
ende
d Se
dim
ent C
once
ntra
tion
(mg/
L)
MAXIMUM
AVERAGE
MINIMUM
PEACE RIVER AT PEACE RIVER - 1973 to 1990
Figure 4.4.9: Seasonal variation in suspended sediment concentrations observed on Peace River at Peace River.
F - 19 M. MILES AND ASSOCIATES LTD.

SEDIMENT TRANSPORT AND CHANNEL MORPHOLOGY STUDY UPDATE:PROPOSED PEACE RIVER AT DUNVEGAN HYDROELECTRIC PROJECT
M. MILES AND ASSOCIATES LTD.
TABLES
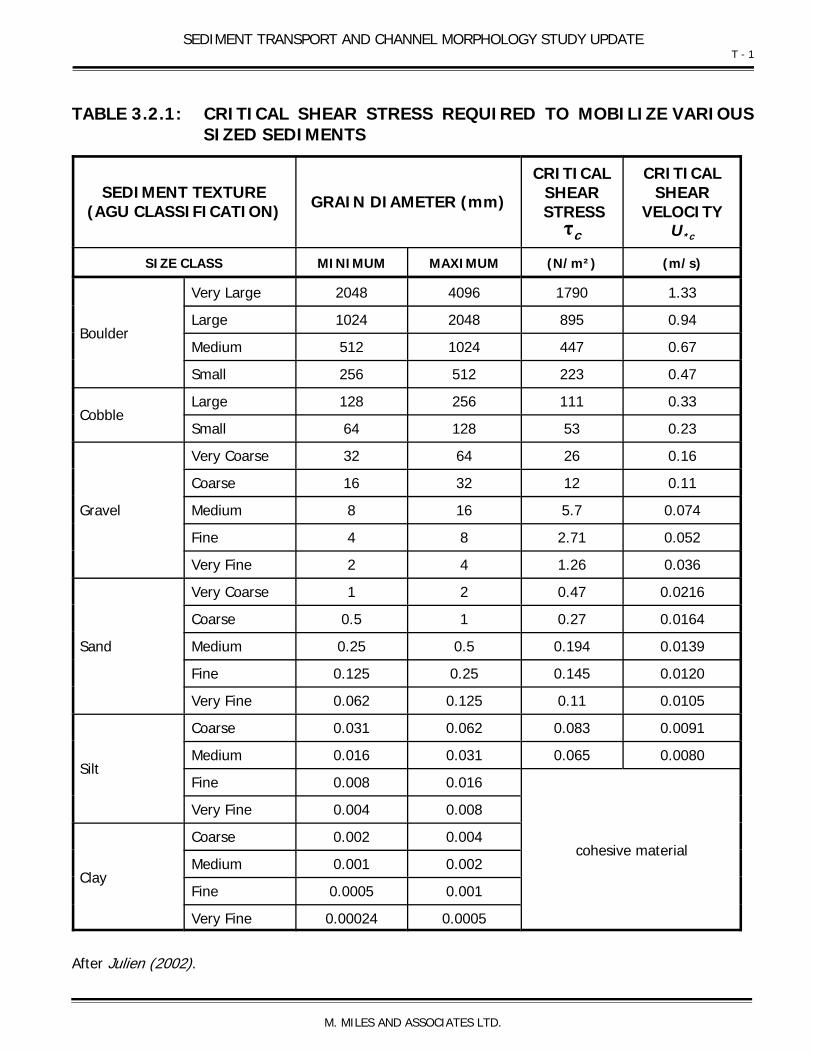
SEDIMENT TRANSPORT AND CHANNEL MORPHOLOGY STUDY UPDATET - 1
M. MILES AND ASSOCIATES LTD.
TABLE 3.2.1: CRITICAL SHEAR STRESS REQUIRED TO MOBILIZE VARIOUSSIZED SEDIMENTS
SEDIMENT TEXTURE(AGU CLASSIFICATION) GRAIN DIAMETER (mm)
CRITICALSHEAR
STRESSτc
CRITICALSHEAR
VELOCITYU*c
SIZE CLASS MINIMUM MAXIMUM (N/m²) (m/s)
Boulder
Very Large 2048 4096 1790 1.33
Large 1024 2048 895 0.94
Medium 512 1024 447 0.67
Small 256 512 223 0.47
CobbleLarge 128 256 111 0.33
Small 64 128 53 0.23
Gravel
Very Coarse 32 64 26 0.16
Coarse 16 32 12 0.11
Medium 8 16 5.7 0.074
Fine 4 8 2.71 0.052
Very Fine 2 4 1.26 0.036
Sand
Very Coarse 1 2 0.47 0.0216
Coarse 0.5 1 0.27 0.0164
Medium 0.25 0.5 0.194 0.0139
Fine 0.125 0.25 0.145 0.0120
Very Fine 0.062 0.125 0.11 0.0105
Silt
Coarse 0.031 0.062 0.083 0.0091
Medium 0.016 0.031 0.065 0.0080
Fine 0.008 0.016
cohesive material
Very Fine 0.004 0.008
Clay
Coarse 0.002 0.004
Medium 0.001 0.002
Fine 0.0005 0.001
Very Fine 0.00024 0.0005
After Julien (2002).

ELBA .T 2. m3 /N(SSERTSRAEHSDETCIDERP:2 2 m357(WOLFECNADEECXE%59NAGEVNUD-TSOPROF) 3 )s/
LENNAHCSSORCANOITACOL
lennahC-diM
.ATS
knaBthgiR
knaBtfeL)m(
80.031.021.060.030.031.012.012.022.091.090.0063,62
83.018.167.144.220.340.432.425.336.202.254.1042,62
93.037.186.113.248.297.369.313.394.290.293.1000,62
81.047.073.117.199.188.186.160.1000,52
56.160.498.440.592.381.1000,42
73.001.122.103.142.177.020.0005,12
16.019.050.161.160.138.015.071.0-03.035.063.0932,81
14.017.017.027.057.077.008.068.039.000.110.156.032.0009,71
14.074.014.083.063.083.004.064.065.046.039.065.031.0005,71
63.054.044.014.004.093.093.024.038.051.118.024.0001,71
13.083.083.083.093.014.035.059.021.138.065.042.0007,61
71.003.043.053.004.055.047.097.067.007.046.053.0003,61
20.050.031.012.092.093.065.017.017.007.096.076.006.053.0589,51
22.063.053.043.043.033.023.013.003.092.082.091.0196,11
81.033.043.053.043.092.091.050.0--01.090.0000,01
00.021.062.023.013.082.062.042.032.012.091.061.090.010.0795,8
80.031.021.060.030.031.012.012.022.091.090.0000,6
00.001.091.012.022.012.002.091.081.071.061.051.011.0590,4
40.001.041.071.002.022.022.022.022.022.081.090.0995
10.050.080.001.011.011.011.011.011.011.001.090.060.010.0082
10.070.090.001.001.001.011.011.011.011.001.001.070.010.00
lairetam dezis-dnas niartne ot tneiciffusni sesserts raehS ²m/N 4.1
reva eht niartne ot tneiciffusni tub ,stnemides dezis-dnas niartne ot tneiciffus sesserts raehS ²m/N 01< ot 4.1 stnemides lennahc-dim ecafrus-bus ega
ciffusni tub ,stnemides lennahc-dim ecafrus-bus egareva eht niartne ot tneiciffus sesserts raehS ²m/N 63 < ot 01 lairetam ecafrus egareva eht ezilibom ot tnei
lairetam ecafrus egareva eht niartne ot tneiciffus sesserts raehS ²m/N 63

)m( KNAB TFEL MORF ECNATSID
lennahC-diM
ELBAT .2.3 m/N( SSERTS RAEHS DETCIDERP :3 2 m 045,1( WOLF ECNADEECXE %05 NAGEVNUD-TSOP ROF ) 3 )s/
.ATS
knaBthgiR
knaBtfeL)m(
83.183.403.493.523.689.772.841.717.520.586.344.0063,62
53.171.401.411.579.594.777.727.604.567.425.364.0042,62
43.130.469.329.437.581.744.754.691.595.424.384.0000,62
08.061.233.369.384.472.409.335.2000,52
83.131.1---45.541.3163.5157.5101.1116.4000,42
30.052.020.199.415.528.575.576.343.0005,12
70.230.344.387.374.377.218.105.0-11.168.103.1932,81
50.094.145.245.265.246.227.208.299.232.354.384.333.248.0009,71
83.106.134.123.162.113.193.155.498.121.210.388.184.0005,71
42.145.105.134.173.143.173.154.107.207.336.214.1001,71
21.134.134.134.144.115.119.123.378.339.220.288.0007,61
16.080.122.152.114.178.105.266.245.273.271.202.100.0003,61
41.003.075.038.001.164.110.245.255.294.284.214.261.262.1589,51
22.063.053.043.043.033.023.013.003.092.082.091.0196,11
81.033.043.053.043.092.091.050.0--01.090.0000,01
20.015.060.113.152.141.150.100.149.088.077.066.014.050.0795,8
53.025.015.072.061.045.058.088.009.008.083.0000,6
10.053.076.047.077.067.017.076.046.016.065.035.093.0590,4
12.074.046.087.039.000.120.120.130.120.128.044.0995
30.062.024.094.045.065.085.085.085.065.015.074.013.040.0082
50.092.083.004.004.034.054.044.034.034.034.014.092.050.00
�1.4 N/m² Shear stresses insufficient to entrain sand-sized material
1.4 to <10 N/m² Shear stresses sufficient to entrain sand-sized sediments, but insufficient to entrain the average sub-surface mid-channel sediments
10 to < 36 N/m² Shear stresses sufficient to entrain the average sub-surface mid-channel sediments, but insufficient to mobilize the average surface material
� 36 N/m² Shear stresses sufficient to entrain the average surface material
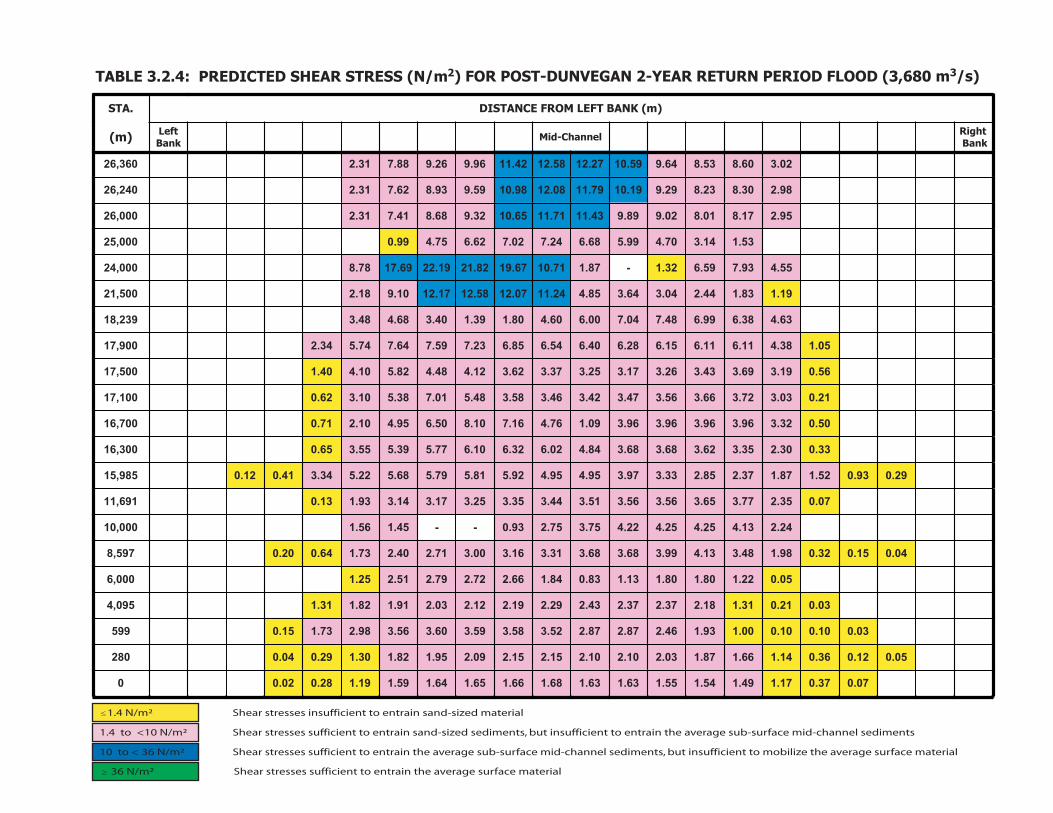
)m( KNAB TFEL MORF ECNATSID
lennahC-diM
3 ELBAT 4.2. m/N( SSERTS RAEHS DETCIDERP : 2 m 086,3( DOOLF DOIREP NRUTER RAEY-2 NAGEVNUD-TSOP ROF ) 3 )s/
.ATS
knaBthgiR
knaBtfeL)m(
20.306.835.846.995.0172.2185.2124.1169.962.988.713.2063,62
89.203.832.892.991.0197.1180.2189.0195.939.826.713.2042,62
59.271.810.820.998.934.1117.1156.0123.986.814.713.2000,62
35.141.307.499.586.642.720.726.657.499.0000,52
55.439.795.623.1-78.117.0176.9128.1291.2296.7187.8000,42
91.138.144.240.346.358.442.1170.2185.2171.2101.981.2005,12
36.483.699.684.740.700.606.408.193.104.386.484.3932,81
50.183.411.611.651.682.604.645.658.632.795.746.747.543.2009,71
65.091.396.334.362.371.352.373.326.321.484.428.501.404.1005,71
12.030.327.366.365.374.324.364.385.384.510.783.501.326.0001,71
05.023.369.369.369.369.390.167.461.701.805.659.401.217.0007,61
33.003.253.326.386.386.348.420.623.601.677.593.555.356.0003,61
92.039.025.178.173.258.233.379.359.459.429.518.597.586.522.543.314.021.0589,51
70.053.277.356.365.365.315.344.353.352.371.341.339.131.0196,11
42.231.452.452.422.457.357.239.0--54.165.1000,01
40.051.023.089.184.331.499.386.386.313.361.300.317.204.237.146.002.0795,8
50.022.108.108.131.138.048.166.227.297.215.252.1000,6
30.012.013.181.273.273.234.292.291.221.230.219.128.113.1590,4
30.001.001.000.139.164.278.278.225.385.395.306.365.389.237.151.0995
50.021.063.041.166.178.130.201.201.251.251.290.259.128.103.192.040.0082
70.073.071.194.145.155.136.136.186.166.156.146.195.191.182.020.00
�1.4 N/m² Shear stresses insufficient to entrain sand-sized material
1.4 to <10 N/m² Shear stresses sufficient to entrain sand-sized sediments, but insufficient to entrain the average sub-surface mid-channel sediments
10 to < 36 N/m² Shear stresses sufficient to entrain the average sub-surface mid-channel sediments, but insufficient to mobilize the average surface material
� 36 N/m² Shear stresses sufficient to entrain the average surface material

)m( KNAB TFEL MORF ECNATSID
lennahC-diM
ELBAT .2.3 m/N( SSERTS RAEHS DETCIDERP :5 2 m 029,4( DOOLF DOIREP NRUTER RAEY-5 NAGEVNUD-TSOP ROF ) 3 )s/
.ATS
knaBthgiR
knaBtfeL)m(
35.485.0115.0176.1156.2104.4117.4115.3100.2172.1138.988.3063,62
74.433.0172.0183.1133.2110.4123.4161.3107.1100.1116.968.3042,62
14.411.0150.0131.1150.2186.3189.3158.2144.1167.0124.928.3000,62
43.244.461.695.733.859.807.862.802.655.1000,52
12.73.1178.971.2-37.162.4168.3251.6255.6237.1207.11000,42
33.261.367.373.479.491.636.2174.3189.3175.3174.0158.2005,12
00.057.538.705.840.955.824.788.528.283.275.479.505.4932,81
57.162.683.883.834.895.837.809.882.947.981.0132.0119.703.3009,71
69.072.478.475.473.472.453.494.497.473.587.533.743.529.1005,71
65.012.440.579.458.447.486.437.478.401.729.800.782.430.1001,71
59.027.405.505.505.505.566.564.653.994.0165.896.642.302.1007,61
17.074.387.421.591.545.526.670.854.881.877.703.720.511.1003,61
85.077.125.289.216.312.418.406.538.620.540.809.788.747.771.708.110.106.002.0589,51
62.004.342.590.579.479.419.428.417.485.474.434.478.294.061.0196,11
64.383.655.627.605.648.593.465.190.070.079.165.2000,01
21.063.055.066.021.332.551.669.535.512.500.508.475.461.427.387.212.145.001.0795,8
71.009.107.256.287.173.157.209.389.370.496.348.1000,6
00.021.074.060.203.375.317.356.354.323.312.380.319.287.220.250.0590,4
91.034.034.057.141.309.335.481.594.595.595.516.565.586.438.253.000.0995
70.091.033.086.008.145.248.280.391.352.352.352.371.369.277.220.265.021.0082
20.050.041.066.048.113.283.204.225.236.285.265.245.225.264.268.135.090.00
�1.4 N/m² Shear stresses insufficient to entrain sand-sized material
1.4 to <10 N/m² Shear stresses sufficient to entrain sand-sized sediments, but insufficient to entrain the average sub-surface mid-channel sediments
10 to < 36 N/m² Shear stresses sufficient to entrain the average sub-surface mid-channel sediments, but insufficient to mobilize the average surface material
� 36 N/m² Shear stresses sufficient to entrain the average surface material
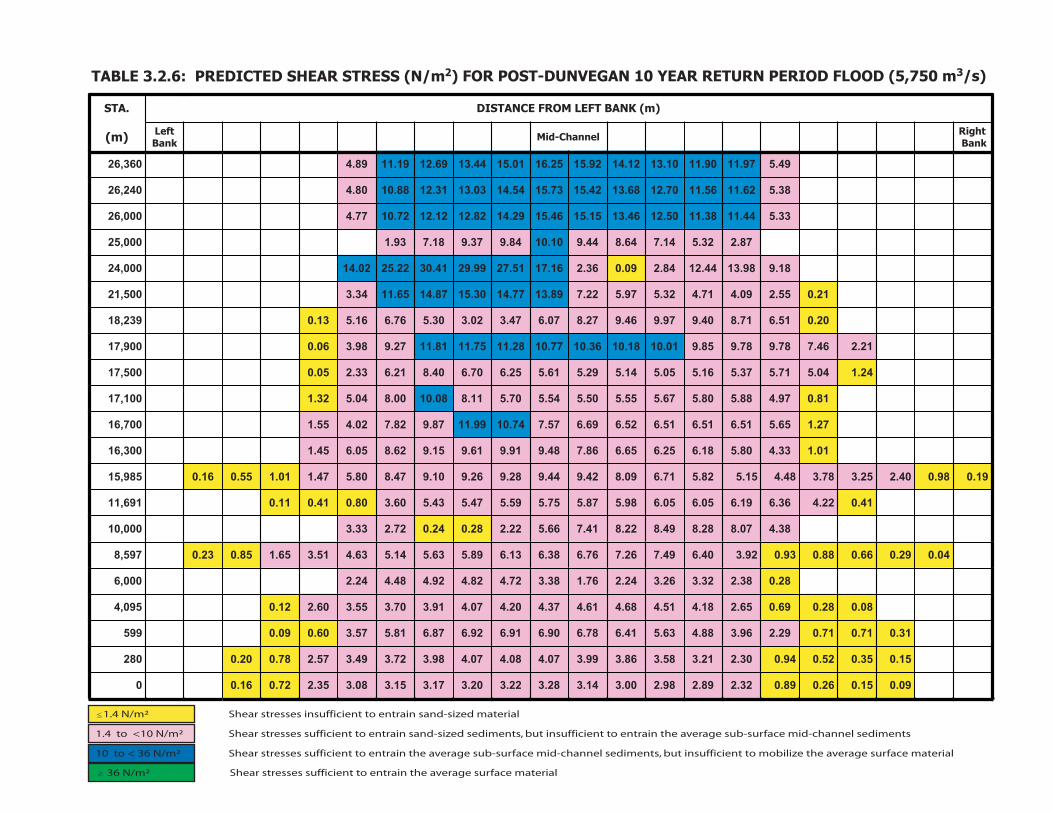
)m( KNAB TFEL MORF ECNATSID
lennahC-diM
ELBAT .2.3 m/N( SSERTS RAEHS DETCIDERP :6 2 m 057,5( DOOLF DOIREP NRUTER RAEY 01 NAGEVNUD-TSOP ROF ) 3 )s/
.ATS
knaBthgiR
knaBtfeL)m(
94.579.1109.1101.3121.4129.5152.6110.5144.3196.2191.1198.4063,62
83.526.1165.1107.2186.3124.5137.5145.4130.3113.2188.0108.4042,62
33.544.1183.1105.2164.3151.5164.5192.4128.2121.2127.0177.4000,62
78.223.541.746.844.901.0148.973.981.739.1000,52
81.989.3144.2148.290.063.261.7115.7299.9214.0322.5220.41000,42
12.055.290.417.423.579.522.798.3177.4103.5178.4156.1143.3005,12
02.015.617.804.979.964.972.870.674.320.303.567.661.531.0932,81
12.264.787.987.958.910.0181.0163.0177.0182.1157.1118.1172.989.360.0009,71
42.140.517.573.561.550.541.592.516.552.607.604.812.633.250.0005,71
18.079.488.508.576.555.505.545.507.511.880.0100.840.523.1001,71
72.156.515.615.615.625.696.675.747.0199.1178.928.720.455.1007,61
10.133.408.581.652.656.668.784.919.916.951.926.850.654.1003,61
91.089.004.252.387.384.451.528.517.690.824.944.982.962.901.974.808.574.110.155.061.0589,51
14.022.463.691.650.650.689.578.557.595.574.534.506.308.014.011.0196,11
83.470.882.894.822.814.766.522.282.042.027.233.3000,01
40.092.066.088.039.029.304.694.762.767.683.631.698.536.541.536.415.356.158.032.0795,8
82.083.223.362.342.267.183.327.428.429.484.442.2000,6
80.082.096.056.281.415.486.416.473.402.470.419.307.355.306.221.0590,4
13.017.017.092.269.388.436.514.687.609.619.629.678.618.575.306.090.0995
51.053.025.049.003.212.385.368.399.370.480.470.489.327.394.375.287.002.0082
90.051.062.098.023.298.289.200.341.382.322.302.371.351.380.353.227.061.00
�1.4 N/m² Shear stresses insufficient to entrain sand-sized material
1.4 to <10 N/m² Shear stresses sufficient to entrain sand-sized sediments, but insufficient to entrain the average sub-surface mid-channel sediments
10 to < 36 N/m² Shear stresses sufficient to entrain the average sub-surface mid-channel sediments, but insufficient to mobilize the average surface material
� 36 N/m² Shear stresses sufficient to entrain the average surface material
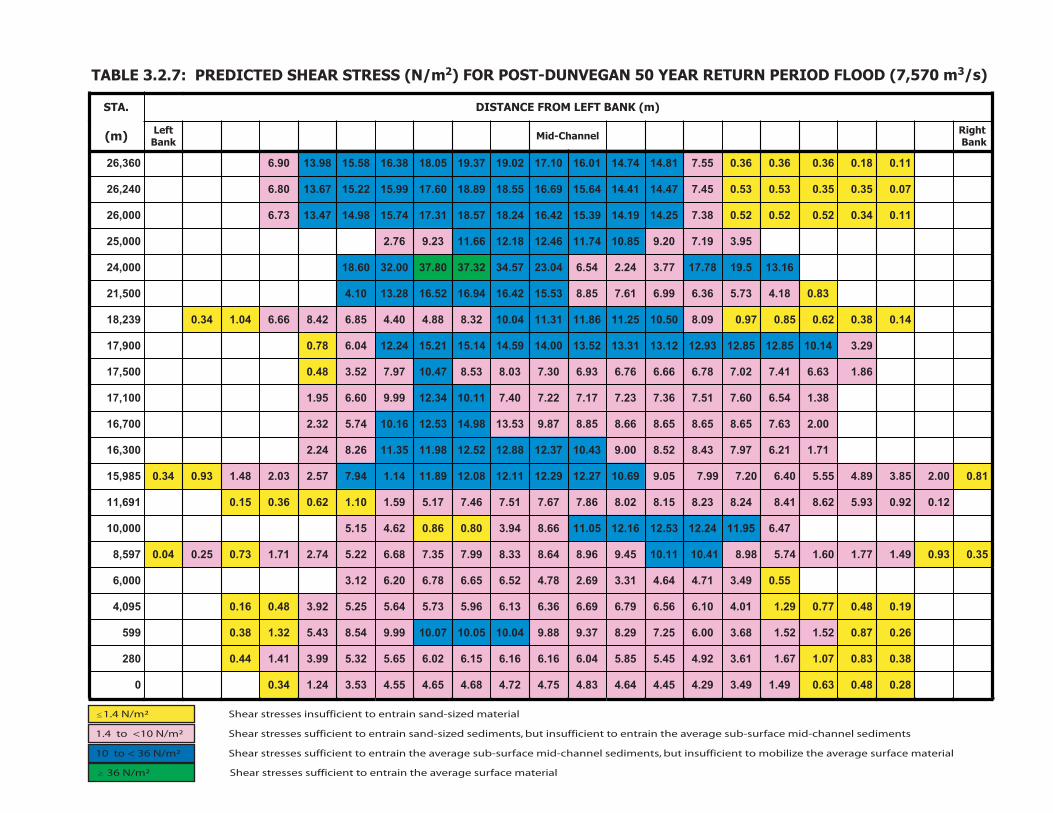
)m( KNAB TFEL MORF ECNATSID
lennahC-diM
ELBAT .2.3 m/N( SSERTS RAEHS DETCIDERP :7 2 m 075,7( DOOLF DOIREP NRUTER RAEY 05 NAGEVNUD-TSOP ROF ) 3 )s/
.ATS
knaBthgiR
knaBtfeL)m(
11.081.063.063.063.055.718.4147.4110.6101.7120.9173.9150.8183.6185.5189.3109.6063,62
70.053.053.035.035.054.774.4114.4146.5196.6155.8198.8106.7199.5122.5176.3108.6042,62
11.043.025.025.025.083.752.4191.4193.5124.6142.8175.8113.7147.5189.4174.3137.6000,62
59.391.702.958.0147.1164.2181.2166.1132.967.2000,52
61.315.9187.7177.342.245.640.3275.4323.7308.7300.2306.81000,42
38.081.437.563.699.616.758.835.5124.6149.6125.6182.3101.4005,12
41.083.026.058.079.090.805.0152.1168.1113.1140.0123.888.404.458.624.866.640.143.0932,81
92.341.0158.2158.2139.2121.3113.3125.3100.4195.4141.5112.5142.2140.687.0009,71
68.136.614.720.787.666.667.639.603.730.835.874.0179.725.384.0005,71
83.145.606.715.763.732.771.722.704.711.0143.2199.906.659.1001,71
00.236.756.856.856.866.858.878.935.3189.4135.2161.0147.523.2007,61
17.112.679.734.825.800.934.0173.2188.2125.2189.1153.1162.842.2003,61
18.000.258.398.455.504.602.799.750.996.0172.2192.2111.2180.2198.1141.149.775.230.284.139.043.0589,51
21.029.039.526.814.842.832.851.820.868.776.715.764.771.595.101.126.063.051.0196,11
74.659.1142.2135.2161.2150.1166.849.308.068.026.451.5000,01
53.039.094.177.106.147.589.814.0111.0154.969.846.833.899.753.786.622.547.217.137.052.040.0795,8
55.094.317.446.413.396.287.425.656.687.602.621.3000,6
91.084.077.092.110.401.665.697.696.663.631.669.537.546.552.529.384.061.0590,4
62.078.025.125.186.300.652.792.873.988.940.0150.0170.0199.945.834.523.183.0995
83.038.070.176.116.329.454.558.540.661.661.651.620.656.523.599.314.144.0082
82.084.036.094.194.392.454.446.438.457.427.486.456.455.435.342.143.00
�1.4 N/m² Shear stresses insufficient to entrain sand-sized material
1.4 to <10 N/m² Shear stresses sufficient to entrain sand-sized sediments, but insufficient to entrain the average sub-surface mid-channel sediments
10 to < 36 N/m² Shear stresses sufficient to entrain the average sub-surface mid-channel sediments, but insufficient to mobilize the average surface material
� 36 N/m² Shear stresses sufficient to entrain the average surface material

)m( KNAB TFEL MORF ECNATSID
lennahC-diM
ELBAT .2.3 m/N( SSERTS RAEHS DETCIDERP :8 2 m 033,8( DOOLF DOIREP NRUTER RAEY 001 NAGEVNUD-TSOP ROF ) 3 )s/
.ATS
knaBthgiR
knaBtfeL)m(
31.039.039.011.111.15.839.5178.5171.7182.8142.0206.0242.9145.7127.6190.5127.7063,62
31.009.080.180.162.173.875.5115.5177.6148.7147.9190.0287.8131.7143.6157.4106.7042,62
41.050.150.132.132.192.833.5182.5115.6155.7114.9157.9174.8168.6180.6135.4125.7000,62
83.459.730.0147.1166.2104.3111.3175.2160.0111.3000,52
86.3181.0225.8160.506.327.745.3256.4392.7357.7391.2350.9100.0000,42
60.118.463.699.626.752.884.961.6150.7175.7151.7119.3193.4005,12
24.048.080.123.143.196.861.1129.1145.2199.1196.0149.834.559.444.740.942.794.187.032.0932,81
91.059.352.1111.4111.4191.4193.4195.4118.4123.5149.5115.6195.6164.3139.611.1009,71
70.081.222.740.846.793.762.773.755.739.786.812.922.1126.800.466.0005,71
36.122.733.842.890.859.788.749.721.859.0192.3138.0182.722.2001,71
23.244.825.925.925.935.937.908.0146.4151.6195.3101.1164.656.2007,61
20.210.798.873.974.979.905.1155.3101.4117.3131.3174.2181.985.2003,61
60.144.244.455.552.661.799.728.849.956.1113.3133.3141.3111.3129.2121.2167.840.364.288.113.194.0589,51
52.022.126.625.992.911.901.910.978.807.805.833.882.828.549.124.109.076.033.0196,11
44.3150.3109.1104.984.412.172.191.516.5000,01
05.062.119.122.249.195.671.0157.1114.1196.0151.0197.964.980.973.846.730.672.331.270.155.081.0795,8
96.079.313.532.587.301.383.592.734.775.749.694.3000,6
71.073.007.020.185.126.459.664.727.716.742.799.697.645.642.600.625.476.013.060.0590,4
30.074.081.149.159.163.469.673.835.917.0113.1194.1115.1135.1144.1118.903.696.135.0995
94.050.123.179.111.455.531.685.697.619.629.619.667.663.699.535.486.155.0082
83.066.028.097.110.449.480.521.543.555.564.524.593.553.532.580.494.134.00
�1.4 N/m² Shear stresses insufficient to entrain sand-sized material
1.4 to <10 N/m² Shear stresses sufficient to entrain sand-sized sediments, but insufficient to entrain the average sub-surface mid-channel sediments
10 to < 36 N/m² Shear stresses sufficient to entrain the average sub-surface mid-channel sediments, but insufficient to mobilize the average surface material
� 36 N/m² Shear stresses sufficient to entrain the average surface material

LENNAHC SSORCA NOITACOL
lennahC-diM
ELBAT .2.3 m 357( WOLF ECNADEECXE %59 NAGEVNUD-TSOP ROF )s/m( YTICOLEV RAEHS DETCIDERP :9 3 )s/
.ATS
knaBthgiR
knaBtfeL)m(
20.040.040.050.060.070.070.060.050.050.040.0063,62
20.040.040.050.050.060.070.060.050.050.040.0042,62
20.040.040.050.050.060.060.060.050.050.040.0000,62
10.030.040.040.040.040.040.030.0000,52
40.060.070.070.060.030.0000,42
20.030.030.040.040.030.000.0005,12
20.030.030.030.030.030.020.010.020.020.020.0932,81
20.030.030.030.030.030.030.030.030.030.030.030.020.0009,71
20.020.020.020.020.020.020.020.020.030.030.020.010.0005,71
20.020.020.020.020.020.020.020.030.030.030.020.0001,71
20.020.020.020.020.020.020.030.030.030.020.020.0007,61
10.020.020.020.020.020.030.030.030.030.030.020.0003,61
00.010.010.010.020.020.020.030.030.030.030.030.020.020.0589,51
10.020.020.020.020.020.020.020.020.020.020.010.0196,11
10.020.020.020.020.020.010.010.010.010.0000,01
00.010.020.020.020.020.020.020.020.010.010.010.010.000.0795,8
10.010.010.010.010.010.010.010.010.010.010.0000,6
10.010.010.010.010.010.010.010.010.010.010.010.0590,4
10.010.010.010.010.010.010.010.010.010.010.010.0995
00.010.010.010.010.010.010.010.010.010.010.010.010.000.0082
00.010.010.010.010.010.010.010.010.010.010.010.010.000.00
<0.04 m/s Shear velocities insufficient to entrain sand-sized material
0.04 to <0.11m/s Shear velocities sufficient to entrain sand-sized sediments, but insufficient to entrain the average sub-surface mid-channel sediments
0.11 to < 0.22 m/s Shear velocities sufficient to entrain the average sub-surface mid-channel sediments, but insufficient to mobilize the average surface material
� 0.22 m/s Shear velocities sufficient to entrain the average surface material

LENNAHC SSORCA NOITACOL
lennahC-diM
ELBAT .2.3 m 045,1( WOLF ECNADEECXE %05 NAGEVNUD-TSOP ROF )s/m( YTICOLEV RAEHS DETCIDERP 10: 3 )s/
.ATS
knaBthgiR
knaBtfeL)m(
40.070.070.070.080.090.090.080.080.070.060.020.0063,62
40.060.060.070.080.090.090.080.070.070.060.020.0042,62
40.060.060.070.080.080.090.080.070.070.060.020.0000,62
30.050.060.060.070.070.060.050.0000,52
40.030.070.011.021.031.011.070.0000,42
10.020.030.070.070.080.070.060.020.0005,12
50.060.060.060.060.050.040.020.030.040.040.0932,81
10.040.050.050.050.050.050.050.050.060.060.060.050.030.0009,71
40.040.040.040.040.040.040.040.040.050.050.040.020.0005,71
40.040.040.040.040.040.040.040.050.060.050.040.0001,71
30.040.040.040.040.040.040.060.060.050.040.030.0007,61
20.030.030.040.040.040.050.050.050.050.050.030.0003,61
10.020.020.030.030.040.040.050.050.050.050.050.050.040.0589,51
30.040.040.030.030.030.030.030.030.030.030.030.0196,11
30.040.040.004.040.030.030.010.020.020.0000,01
00.020.030.040.040.030.030.030.030.030.030.030.020.010.0795,8
20.020.020.020.010.020.030.030.030.030.020.0000,6
00.020.030.030.030.030.030.030.030.020.020.020.020.0590,4
10.020.030.030.030.030.030.030.030.030.030.020.0995
10.020.020.020.020.020.020.020.020.020.020.020.020.010.0082
10.020.020.020.020.020.020.020.020.020.020.020.020.010.00
<0.04 m/s Shear velocities insufficient to entrain sand-sized material
0.04 to <0.11m/s Shear velocities sufficient to entrain sand-sized sediments, but insufficient to entrain the average sub-surface mid-channel sediments
0.11 to < 0.22 m/s Shear velocities sufficient to entrain the average sub-surface mid-channel sediments, but insufficient to mobilize the average surface material
� 0.22 m/s Shear velocities sufficient to entrain the average surface material
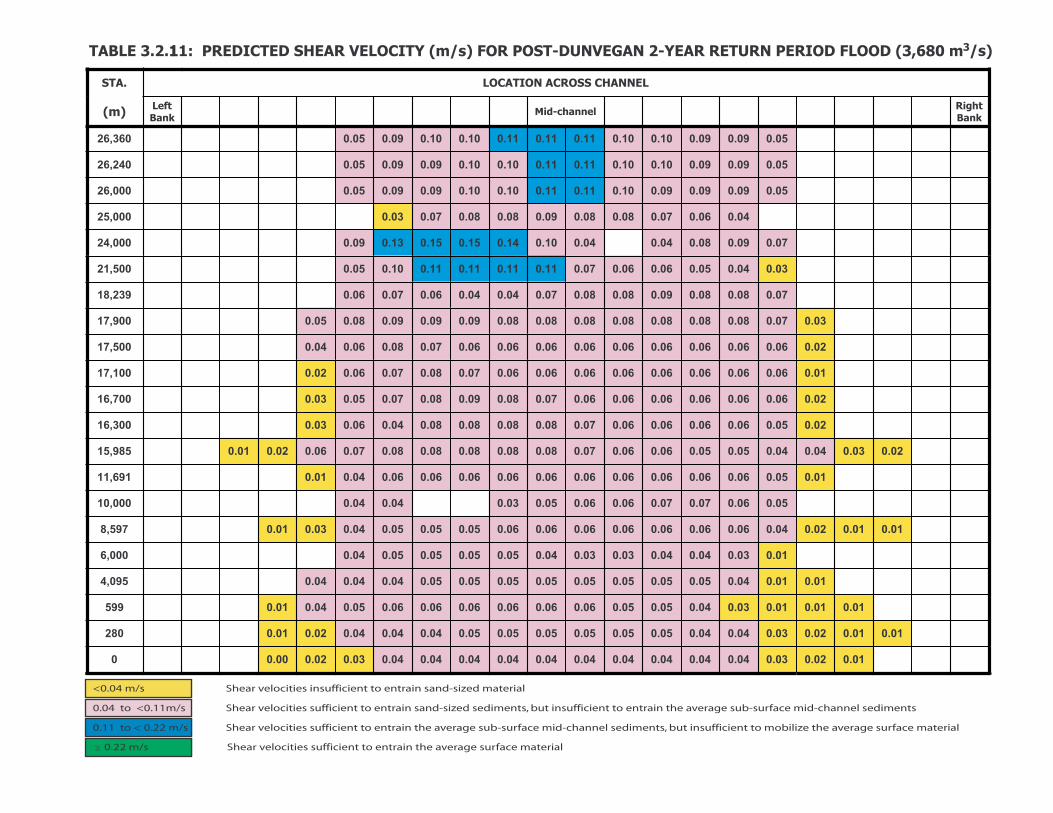
LENNAHCSSORCANOITACOL
lennahc-diM
ELBA .11T 2.3 m086,3(DOOLFDOIREPNRUTERRAEY-2NAGEVNUD-TSOPROF)s/m(YTICOLEVRAEHSDETCIDERP:1 3 )s/
.ATS
knaBthgiR
knaBtfeL)m(
50.090.090.001.001.011.011.011.001.001.090.050.0063,62
50.090.090.001.001.011.011.001.001.090.090.050.0042,62
50.090.090.090.001.011.011.001.001.090.090.050.0000,62
40.060.070.080.080.090.080.080.070.030.0000,52
70.090.080.040.040.001.041.051.051.031.090.0000,42
30.040.050.060.060.070.011.011.011.011.001.050.0005,12
70.080.080.090.080.080.070.040.040.060.070.060.0932,81
30.070.080.080.080.080.080.080.080.090.090.090.080.050.0009,71
20.060.060.060.060.060.060.060.060.060.070.080.060.040.0005,71
10.060.060.060.060.060.060.060.060.070.080.070.060.020.0001,71
20.060.060.060.060.060.060.070.080.090.080.070.050.030.0007,61
20.050.060.060.060.060.070.080.080.080.080.040.060.030.0003,61
20.030.040.040.050.050.060.060.070.080.080.080.080.080.070.060.020.010.0589,51
10.050.060.060.060.060.060.060.060.060.060.060.040.010.0196,11
50.060.070.070.060.060.050.030.040.040.0000,01
10.010.020.040.060.060.060.060.060.060.060.050.050.050.040.030.010.0795,8
10.030.040.040.030.030.040.050.050.050.050.040.0000,6
10.010.040.050.050.050.050.050.050.050.050.040.040.040.0590,4
10.010.010.030.040.050.050.060.060.060.060.060.060.050.040.010.0995
10.010.020.030.040.040.050.050.050.050.050.050.040.040.040.020.010.0082
10.020.030.040.040.040.040.040.040.040.040.040.040.030.020.000.00
lairetam dezis-dnas niartne ot tneiciffusni seiticolev raehS s/m 40.0<
a eht niartne ot tneiciffusni tub ,stnemides dezis-dnas niartne ot tneiciffus seiticolev raehS s/m11.0< ot 40.0 stnemides lennahc-dim ecafrus-bus egarev
sni tub ,stnemides lennahc-dim ecafrus-bus egareva eht niartne ot tneiciffus seiticolev raehS s/m 22.0 < ot 11.0 lairetam ecafrus egareva eht ezilibom ot tneiciffu
lairetam ecafrus egareva eht niartne ot tneiciffus seiticolev raehS s/m 22.0

LENNAHC SSORCA NOITACOL
lennahc-diM
ELBAT .2.3 m 029,4( DOOLF DOIREP NRUTER RAEY-5 NAGEVNUD-TSOP ROF )s/m( YTICOLEV RAEHS DETCIDERP :21 3 )s/
.ATS
knaBthgiR
knaBtfeL)m(
70.001.001.011.011.021.021.021.011.011.001.060.0063,62
70.001.001.011.011.021.021.011.011.001.001.060.0042,62
70.001.001.011.011.021.021.011.011.001.001.060.0000,62
50.070.080.090.090.090.090.090.080.040.0000,52
80.011.001.050.040.021.051.061.061.051.011.0000,42
50.060.060.070.070.080.011.021.021.021.001.050.0005,12
80.090.090.001.090.090.080.050.050.070.080.070.0932,81
40.080.090.090.090.090.090.090.001.001.001.001.090.060.0009,71
30.070.070.070.070.070.070.070.070.070.080.090.070.040.0005,71
20.060.070.070.070.070.070.070.070.080.090.080.070.030.0001,71
30.070.070.070.070.070.080.080.001.001.090.080.060.030.0007,61
30.060.070.070.070.070.080.090.090.090.090.090.070.030.0003,61
20.040.050.050.060.060.070.070.080.090.090.090.090.090.080.070.030.020.010.0589,51
20.060.070.070.070.070.070.070.070.070.070.070.050.020.010.0196,11
60.080.080.080.080.080.070.040.010.010.040.050.0000,01
10.020.020.030.060.070.080.080.070.070.070.070.070.060.060.050.030.020.010.0795,8
10.040.050.050.040.040.050.060.060.060.060.040.0000,6
10.020.050.060.060.060.060.060.060.060.060.050.050.040.010.0590,4
10.020.020.040.060.060.070.070.070.070.070.070.070.070.050.020.0995
10.010.020.030.040.050.050.060.060.060.060.060.060.050.050.040.020.010.0082
00.010.010.030.040.050.050.050.050.050.050.050.050.050.050.040.020.010.00
<0.04 m/s Shear velocities insufficient to entrain sand-sized material
0.04 to <0.11m/s Shear velocities sufficient to entrain sand-sized sediments, but insufficient to entrain the average sub-surface mid-channel sediments
0.11 to < 0.22 m/s Shear velocities sufficient to entrain the average sub-surface mid-channel sediments, but insufficient to mobilize the average surface material
� 0.22 m/s Shear velocities sufficient to entrain the average surface material

LENNAHC SSORCA NOITACOL
lennahc-diM
ELBAT .2.3 m 057,5( DOOLF DOIREP NRUTER RAEY 01 NAGEVNUD-TSOP ROF )s/m( YTICOLEV RAEHS DETCIDERP :31 3 )s/
.ATS
knaBthgiR
knaBtfeL)m(
70.011.011.011.021.031.031.021.021.011.011.070.0063,62
70.011.011.011.021.021.031.021.011.011.001.070.0042,62
70.011.011.011.021.021.021.021.011.011.001.070.0000,62
50.070.080.090.001.001.001.001.080.040.0000,52
01.021.011.050.010.050.031.071.071.071.061.021.0000,42
10.050.060.070.070.080.080.021.021.021.021.011.060.0005,12
10.080.090.001.001.001.090.080.060.050.070.080.070.010.0932,81
50.090.001.001.001.001.001.001.001.011.011.011.001.060.010.0009,71
40.070.080.070.070.070.070.070.070.080.080.090.080.050.010.0005,71
30.070.080.080.080.070.070.070.080.090.001.090.070.040.0001,71
40.080.080.080.080.080.080.090.001.011.001.090.060.040.0007,61
30.070.080.080.080.080.090.001.001.001.001.090.080.040.0003,61
10.030.050.060.060.070.070.080.050.090.001.001.001.001.001.090.080.040.030.020.010.0589,51
20.060.080.080.080.080.080.080.080.070.070.070.060.030.020.010.0196,11
70.090.090.090.090.090.080.050.020.020.050.060.0000,01
10.020.030.030.030.060.080.090.090.080.080.080.080.080.070.070.060.040.030.020.0795,8
20.050.060.060.050.040.060.070.070.070.070.050.0000,6
10.020.030.050.060.070.070.070.070.060.060.060.060.060.050.010.0590,4
20.030.030.050.060.070.080.080.080.080.080.080.080.080.060.020.010.0995
10.020.020.030.050.060.060.060.060.060.060.060.060.060.060.050.030.010.0082
10.010.020.030.050.050.050.050.060.060.060.060.060.060.060.050.030.010.00
<0.04 m/s Shear velocities insufficient to entrain sand-sized material
0.04 to <0.11m/s Shear velocities sufficient to entrain sand-sized sediments, but insufficient to entrain the average sub-surface mid-channel sediments
0.11 to < 0.22 m/s Shear velocities sufficient to entrain the average sub-surface mid-channel sediments, but insufficient to mobilize the average surface material
� 0.22 m/s Shear velocities sufficient to entrain the average surface material

LENNAHC SSORCA NOITACOL
lennahc-diM
ELBAT .2.3 m 075,7( DOOLF DOIREP NRUTER RAEY 05 NAGEVNUD-TSOP ROF )s/m( YTICOLEV RAEHS DETCIDERP :41 3 )s/
.ATS
knaBthgiR
knaBtfeL)m(
10.010.020.020.020.090.021.021.031.031.041.041.031.031.021.021.080.0063,62
10.020.020.020.020.090.021.021.031.031.041.041.031.031.021.021.080.0042,62
10.020.020.020.020.090.021.021.021.031.041.041.031.031.021.021.080.0000,62
60.080.001.001.011.011.011.011.001.050.0000,52
11.041.031.060.050.080.051.091.091.091.081.041.0000,42
30.060.080.080.080.090.090.021.031.031.031.021.060.0005,12
10.020.020.030.030.090.001.011.011.011.001.090.070.070.080.090.080.030.020.0932,81
60.001.011.011.011.011.021.021.021.021.021.021.011.080.030.0009,71
40.080.090.080.080.080.080.080.090.090.090.001.090.060.020.0005,71
40.080.090.090.090.090.080.080.090.001.011.001.080.040.0001,71
40.090.090.090.090.090.090.001.021.021.011.001.080.050.0007,61
40.080.090.090.090.090.001.011.011.011.011.011.090.050.0003,61
30.040.060.070.070.080.080.090.001.01.011.011.011.011.011.011.090.050.050.040.030.020.0589,51
10.030.080.090.090.090.090.090.090.090.090.090.090.070.040.030.020.020.010.0196,11
80.011.011.011.011.011.090.060.030.030.070.070.0000,01
20.030.040.040.040.080.090.001.001.001.090.090.090.090.090.080.070.050.040.030.020.010.0795,8
20.060.070.070.060.050.070.080.080.080.080.060.0000,6
10.020.030.040.060.080.080.080.080.080.080.080.080.070.070.060.020.010.0590,4
20.030.040.040.060.080.090.090.001.001.001.001.001.001.090.070.040.020.0995
20.030.030.040.060.070.070.080.080.080.080.080.080.080.070.060.040.020.0082
20.020.030.040.060.070.070.070.070.070.070.070.070.070.070.060.040.020.00
<0.04 m/s Shear velocities insufficient to entrain sand-sized material
0.04 to <0.11m/s Shear velocities sufficient to entrain sand-sized sediments, but insufficient to entrain the average sub-surface mid-channel sediments
0.11 to < 0.22 m/s Shear velocities sufficient to entrain the average sub-surface mid-channel sediments, but insufficient to mobilize the average surface material
� 0.22 m/s Shear velocities sufficient to entrain the average surface material

LENNAHC SSORCA NOITACOL
lennahc-diM
ELBAT .2.3 m 033,8( DOOLF DOIREP NRUTER RAEY 001 NAGEVNUD-TSOP ROF )s/m( YTICOLEV RAEHS DETCIDERP :51 3 )s/
.ATS
knaBthgiR
knaBtfeL)m(
10.030.030.030.030.090.031.031.031.041.041.041.041.031.031.021.090.0063,62
10.030.030.030.040.090.021.021.031.031.041.041.041.031.031.021.090.0042,62
10.030.030.040.040.090.021.021.031.031.041.041.041.031.031.021.090.0000,62
70.090.001.011.011.021.011.011.001.060.0000,52
21.041.041.070.060.090.051.091.091.091.081.041.0000,42
30.070.080.080.090.090.001.031.031.031.031.021.070.0005,12
20.030.030.040.040.090.011.011.011.011.001.090.070.070.090.001.090.040.030.020.0932,81
10.060.011.021.021.021.021.021.021.021.031.031.031.021.080.030.0009,71
10.050.080.090.090.090.090.090.090.090.090.001.011.090.060.030.0005,71
40.080.090.090.090.090.090.090.001.021.001.090.050.0001,71
50.090.001.001.001.001.001.001.021.031.021.011.080.050.0007,61
40.080.090.001.001.001.011.021.021.021.011.011.001.050.0003,61
30.050.070.070.080.080.090.090.001.011.021.021.011.011.011.011.090.060.050.040.040.020.0589,51
20.030.080.001.001.001.001.090.090.090.090.090.090.080.040.040.030.030.020.0196,11
80.011.011.021.011.011.001.070.030.040.070.070.0000,01
20.040.040.050.040.080.001.011.011.001.001.001.001.001.090.090.080.060.050.030.020.010.0795,8
30.060.070.070.060.060.070.090.090.090.080.060.0000,6
10.020.030.030.040.070.080.090.090.090.090.080.080.080.080.080.070.030.020.010.0590,4
10.020.030.040.040.070.080.090.001.001.011.011.011.011.011.001.080.040.020.0995
20.030.040.040.060.070.080.080.080.080.080.080.080.080.080.070.040.020.0082
20.030.030.040.060.070.070.070.070.070.070.070.070.070.070.060.040.020.00
<0.04 m/s Shear velocities insufficient to entrain sand-sized material
0.04 to <0.11m/s Shear velocities sufficient to entrain sand-sized sediments, but insufficient to entrain the average sub-surface mid-channel sediments
0.11 to < 0.22 m/s Shear velocities sufficient to entrain the average sub-surface mid-channel sediments, but insufficient to mobilize the average surface material
� 0.22 m/s Shear velocities sufficient to entrain the average surface material

SEDIMENT TRANSPORT AND CHANNEL MORPHOLOGY STUDY UPDATE: PROPOSED PEACE RIVER AT DUNVEGAN HYDROELECTRIC PROJECTT - 16
M. MILES AND ASSOCIATES LTD.
TABLE 3.3.1: SILT DEPOSITION IN THE PROPOSED HEADPOND CALCULATED FOR VARIOUS TRAP EFFICIENCIES
TRA
PEF
FIC
IEN
CY AVERAGE
ANNUALSILT LOAD
(mt/yr)
AVERAGEANNUAL SILT DEPOSITION
(mt/yr)
DENSITY (t/m²) OF DEPOSITED MATERIAL
ANNUAL VOLUME (m³) OFDEPOSITED MATERIAL
HEADPONDVOLUME (m³)
AT 50%EXCEEDANCE
FLOW
TIME (yrs) REQUIRED TO DEPOSIT AA SEDIMENT VOLUME EQUIVALENT
TO THE HEADPOND VOLUMEAT A SEDIMENT DENSITY OF:
@ 1,2 t/m³ @ 0.9 t/m³ 1.2 t/m³ 0.9 t/m³
5 7.8 0.4 1.2 0.9 330,000 440,000 64,859,000 197 147
10 7.8 0.8 1.2 0.9 670,000 890,000 64,859,000 97 73
15 7.8 1.2 1.2 0.9 1,000,000 1,300,000 64,859,000 65 50
20 7.8 1.6 1.2 0.9 1,300,000 1,800,000 64,859,000 50 36
25 7.8 2.0 1.2 0.9 1,700,000 2,200,000 64,859,000 38 29

Cross Station Deposition By Grain Size FractionSection (m from Total Total .002-0.008 .008-.0625 .0625-.2 .2-.5 .5-2.0 2-8 8-16 16-32 32-64
dam) tonnes m3 m3 m3 m3 m3 m3 m3 m3 m3 m31 26360 57992 36477 1363 5726 -147 -245 200 3176 4842 8560 130032 26240 179440 112870 267 8318 -818 -1316 445 9572 14666 9752 719803 26000 664170 417760 3257 8126 -2054 -901 4203 30163 54763 104810 2154004 25000 1337500 841260 -975 13261 8660 37582 22875 95551 251520 411680 10985 24000 82873 52127 1809 3390 -15957 -34421 -2225 -9220 108930 -177 06 21500 1107600 696650 -442 2589 65520 147780 75406 106000 233800 65993 07 18240 1022100 642910 257 21567 101780 287910 122690 39132 67236 2345 08 17900 232450 146210 6136 11623 25783 71672 28600 6248 -589 -3258 09 17501 490860 308750 148 6682 80307 152030 54867 5011 6759 2950 010 17101 498560 313590 14612 27941 59923 156660 59033 1121 -3342 -2353 011 16701 453190 285060 903 37922 54809 140120 52718 272 -1425 -256 012 16301 452430 284580 12033 28032 54444 137110 51085 1629 883 -637 013 15986 1998500 1257000 576 25473 318030 666970 226410 5072 10998 3495 014 11692 4011900 2523500 11728 35344 1064200 1089600 311670 5878 5060 58 015 10001 2019600 1270300 2251 50093 691920 416250 108590 702 499 0 016 8597 2336600 1469700 4315 165850 987590 250080 60787 644 465 0 017 6000 2119600 1333200 15925 624690 591890 78779 21460 409 91 0 018 4095 1500100 943550 21106 787130 119110 12477 3679 51 0 0 019 599 314770 197990 7003 213790 -2004 -15049 -5476 -269 -4 0 020 280 212550 133690 2910 104050 7316 14147 4961 303 4 0 021 0 138990 87425 1958 72871 4506 5867 2201 22 0 0 0
SUM (total deposition) 21232000 13355000 107140 2254500 4214800 3613100 1204200 301470 755150 602960 301480% of total deposition 100.0 0.80 16.88 31.56 27.05 9.02 2.26 5.65 4.51 2.26% of inflow trapped 22.09 0.5 7.6 99.9 99.9 99.9 100.0 100.0 100.0 100.0Outflow (tonnes) 74870000 31463000 43387000 9450 7379 2766 12 0 0 0
TABLE 3.4.1: GSTARS PREDICTED SEDIMENT DEPOSITION IN THE DUNVEGAN HEADPOND OVER A 10-YEAR PERIOD (From McLean, May 8, 2004)
T - 17 M. MILES AND ASSOCIATES LTD.

Cross Station Total Deposition Deposition By Grain Size Fraction (m3)Section (m from .002-0.008 .008-.0625 .0625-.2 .2-.5 .5-2.0 2-8 8-16 16-32 32-64
dam) tonnes m3 mm mm mm mm mm mm mm mm mm1 26360 134350 84508 3576 19717 495 3816 1442 7336 17154 23956 70172 26240 396080 249130 3802 13080 1837 12875 6502 25189 37656 40756 1074403 26000 1657500 1042600 5550 40942 6898 23335 17128 57047 94292 87285 7101004 25000 2901700 1825200 9118 21945 35073 113080 55144 131580 221130 555250 6828405 24000 3411300 2145700 -2170 33597 40359 124240 64405 126620 308220 1450500 06 21500 4820800 3032300 167 283 -30585 54430 62094 478610 1625800 841490 07 18240 2869200 1804700 1462 14822 77073 177300 88745 327480 1102300 15570 08 17900 571290 359340 2300 12180 24379 49846 21988 97444 157780 -6581 09 17501 806840 507500 151 6797 76536 202330 81328 56260 77936 6165 010 17101 751170 472490 14310 52205 72650 188250 75782 40494 33167 -4366 011 16701 665640 418680 14626 29050 74728 187380 74332 25031 13959 -419 012 16301 657160 413350 27479 51914 55186 174770 71099 29139 8124 -4356 013 15986 3213000 2021000 10654 17975 369920 1083900 423120 58490 47428 9508 014 11692 5868900 3691500 990 37298 727200 2086200 799010 23731 17024 73 015 10001 2890600 1818200 10958 36384 387820 989890 388570 531 4008 0 016 8597 4584200 2883500 1674 31533 572980 1666200 606750 7783 -2901 -543 017 6000 5955900 3746300 10706 51215 895530 2055000 723080 3596 6604 543 018 4095 7979100 5018900 2324 49283 1455800 2668700 837480 4704 730 -137 019 599 3995600 2513300 10602 35771 733690 1337100 401030 -751 -2874 -1333 020 280 951220 598310 3684 86666 143910 276900 84845 872 1042 395 021 0 531410 334260 13494 92770 62387 126200 39945 -94 -109 -336 0
SUM (total deposition) 55612960 34980768 145457 735427 5783866 13601742 4923819 1501091 3768469 3013420 1507397% of total deposition 100.0 0.42 2.10 16.53 38.88 14.08 4.29 10.77 8.61 4.31% of inflow trapped 11.57 0.15 0.50 27.41 75.20 81.66 99.58 99.81 99.95 100.00Outflow (tonnes) 424900000 157940000 233690000 24356000 7133700 1758000 10025 11690 2243 0
T - 18 M. MILES AND ASSOCIATES LTD.
TABLE 3.4.2: GSTARS PREDICTED SEDIMENT DEPOSITION IN THE DUNVEGAN HEADPOND OVER A 50-YEAR PERIOD (From McLean, May 17, 2004)

Cross Station Total Deposition Deposition By Grain Size Fraction (m3)Section (m from .002-0.008 .008-.0625 .0625-.2 .2-.5 .5-2.0 2-8 8-16 16-32 32-64
dam) tonnes m3 mm mm mm mm mm mm mm mm mm1 26360 148860 93635 2674 26289 1976 7016 2881 11035 24537 20697 -34722 26240 377990 237760 -1015 12881 1902 12458 6155 21965 32123 35958 1153303 26000 1686600 1060900 12070 37497 7856 27504 18578 58251 94755 91017 7133704 25000 2872400 1806800 -247 27577 33892 109570 53661 131410 222560 546160 6821605 24000 3345400 2104300 3015 28645 39832 121610 63018 122300 298840 1427000 06 21500 4748300 2986700 -152 -2377 -36401 44155 58077 468960 1579700 874700 07 18240 2819900 1773700 2299 12963 69973 161180 82148 322280 1103700 19183 08 17900 572150 359880 2800 13185 21226 44649 20089 97082 168290 -7441 09 17501 814320 512210 29018 58625 52276 153270 64876 58105 90011 6024 010 17101 738930 464790 25879 48260 60818 169030 69437 48350 46897 -3887 011 16701 660220 415280 7475 54823 62087 171600 69757 29695 20315 -472 012 16301 638070 401350 27164 41641 55766 173460 70309 27667 9303 -3960 013 15986 3160000 1987600 2660 29966 356610 1059600 414820 62016 52238 9735 014 11692 5749800 3616600 6710 23180 703640 2051500 788980 24723 17869 76 015 10001 2817600 1772200 1359 40138 371100 970620 383920 839 4264 0 016 8597 4510300 2837000 9675 19961 558360 1642600 602530 7683 -3129 -727 017 6000 5838800 3672600 1944 49447 864040 2027400 718770 3559 6699 727 018 4095 7868000 4949000 2405 48110 1394100 2657700 841390 4784 792 -237 019 599 4037600 2539700 3088 55861 719830 1356300 410150 -639 -3087 -1851 020 280 0 0 0 0 0 0 0 0 0 0 021 0 0 0 0 0 0 0 0 0 0 0 0
SUM (total deposition) 53405240 33592005 138820 626672 5338884 12961222 4739546 1500066 3766677 3012703 1507388% of total deposition 100.0 0.41 1.87 15.89 38.58 14.11 4.47 11.21 8.97 4.49% of inflow trapped 11.11 0.14 0.42 25.30 71.66 78.61 99.51 99.76 99.93 100.0Outflow (tonnes) 427100000 157950000 233860000 25063000 8152000 2050900 11655 14489 3319 0
TABLE 3.4.3: GSTARS PREDICTED DEPOSITION AFTER 50 YEARS WITH TRANSMISSIVE BOUNDARY AT DAM (from McLean, July 4, 2005)
T - 19 M. MILES AND ASSOCIATES LTD.

TABLE 3.4.4: GSTARS PREDICTED SEDIMENT DEPOSITION PATTERN IN HEADPOND WITH TAILWATER SET TO PROPOSED HEADPOND CONFIGURATION IN 2000 AND TRANSMISSIVE LOWER BOUNDARY (From McLean, July 8, 2005)
T - 20 M. MILES AND ASSOCIATES LTD.
Cross Station Total Deposition Deposition By Grain Size Fraction (m3)Section (m from .002-0.008 .008-.0625 .0625-.2 .2-.5 .5-2.0 2-8 8-16 16-32 32-64
dam) tonnes m3 mm mm mm mm mm mm mm mm mm1 26360 124380 78234 2903 24784 615 3700 1489 5709 15189 21890 19562 26240 377590 237500 -5314 15154 -509 12978 6034 26614 36039 36471 1100403 26000 1564900 984350 7853 51550 4990 26433 18344 45179 81366 72434 6762004 25000 2763500 1738200 -4973 37696 43499 146210 70493 108610 189360 428110 7192005 24000 3150700 1981800 9689 19080 49456 105830 55839 110540 263510 1367800 06 21500 4650000 2924800 -7006 -7259 58005 110420 55658 413320 1249100 1052600 07 18240 3375900 2123400 4055 22793 161240 240660 104730 288280 1266200 35500 08 17900 508720 319990 2462 13589 24624 33257 13592 72427 167780 -7749 09 17501 754090 474320 17 637 54448 130050 53897 66503 161240 7536 010 17101 677100 425900 4117 50009 44931 109330 45272 66153 107300 -1216 011 16701 596920 375460 12656 6500 61766 125100 50007 51801 67142 490 012 16301 563530 354460 134 21924 64506 124780 49786 47208 47028 -902 013 15986 2657300 1671400 11185 15874 301400 790820 317110 134920 98265 1843 014 11692 4855800 3054300 232 35523 550450 1740900 669550 41165 16523 0 015 10001 2456900 1545400 20371 36581 336750 823530 323780 2129 2222 0 016 8597 3777200 2375900 11389 19806 442020 1383500 513510 8977 -3278 -81 017 6000 5360000 3371400 7798 63831 787860 1837700 663170 4643 6357 81 018 4095 7166100 4507500 9644 24566 1198800 2454300 815050 5247 -189 -5 019 599 3704500 2330100 911 44761 608300 1272700 409140 -1183 -3610 -922 020 280 0 0 0 0 0 0 0 0 0 0 021 0 0 0 0 0 0 0 0 0 0 0 0
SUM (total deposition) 49085130 30874414 88125 497400 4793151 11472198 4236451 1498242 3767545 3013880 1507396% of total deposition 100.0 0.29 1.61 15.52 37.16 13.72 4.85 12.20 9.76 4.88% of inflow trapped 10.2 0.09 0.34 22.71 63.42 70.26 99.39 99.78 99.97 100.00Outflow (tonnes) 431420000 158030000 234070000 25931000 10519000 2850800 14556 13077 1474 0
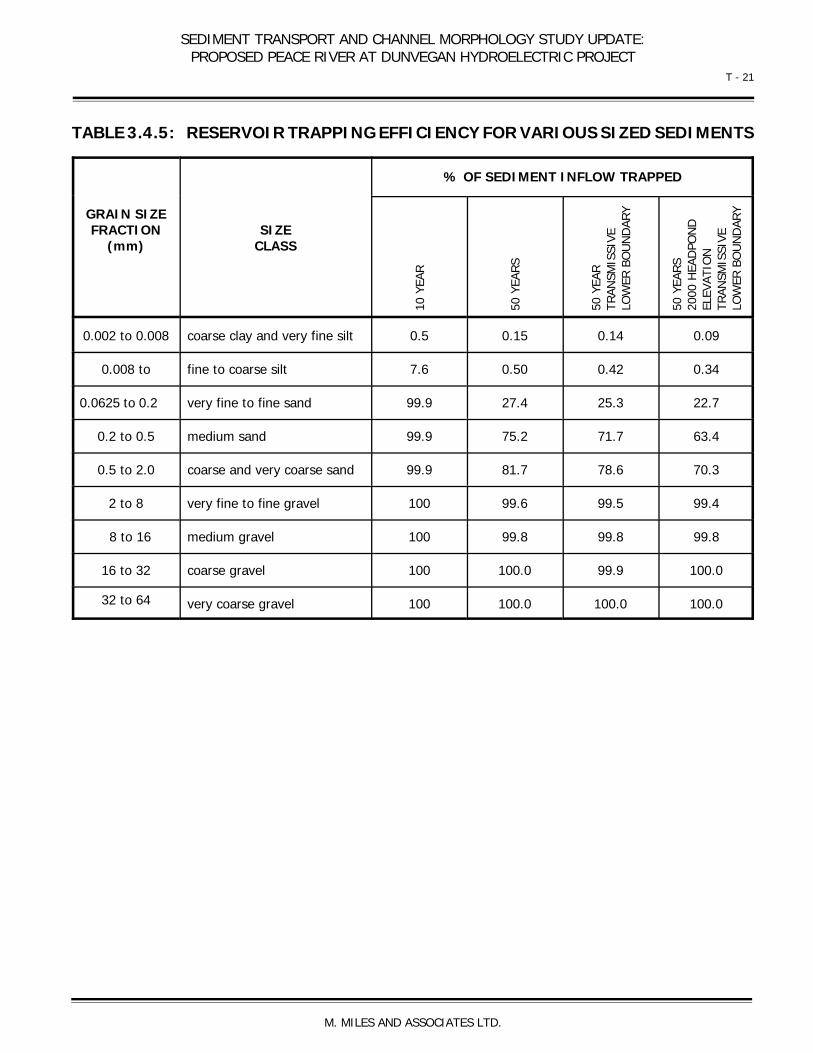
SEDIMENT TRANSPORT AND CHANNEL MORPHOLOGY STUDY UPDATE:PROPOSED PEACE RIVER AT DUNVEGAN HYDROELECTRIC PROJECT
T - 21
M. MILES AND ASSOCIATES LTD.
TABLE 3.4.5: RESERVOIR TRAPPING EFFICIENCY FOR VARIOUS SIZED SEDIMENTS
GRAIN SIZEFRACTION
(mm)SIZE
CLASS
% OF SEDIMENT INFLOW TRAPPED
10 Y
EAR
50 Y
EARS
50 Y
EAR
TRAN
SMIS
SIVE
LO
WER
BO
UN
DAR
Y
50 Y
EARS
2000
HEA
DPO
ND
ELEV
ATIO
NTR
ANSM
ISSI
VE
LOW
ER B
OU
ND
ARY
0.002 to 0.008 coarse clay and very fine silt 0.5 0.15 0.14 0.09
0.008 to fine to coarse silt 7.6 0.50 0.42 0.34
0.0625 to 0.2 very fine to fine sand 99.9 27.4 25.3 22.7
0.2 to 0.5 medium sand 99.9 75.2 71.7 63.4
0.5 to 2.0 coarse and very coarse sand 99.9 81.7 78.6 70.3
2 to 8 very fine to fine gravel 100 99.6 99.5 99.4
8 to 16 medium gravel 100 99.8 99.8 99.8
16 to 32 coarse gravel 100 100.0 99.9 100.0
32 to 64 very coarse gravel 100 100.0 100.0 100.0
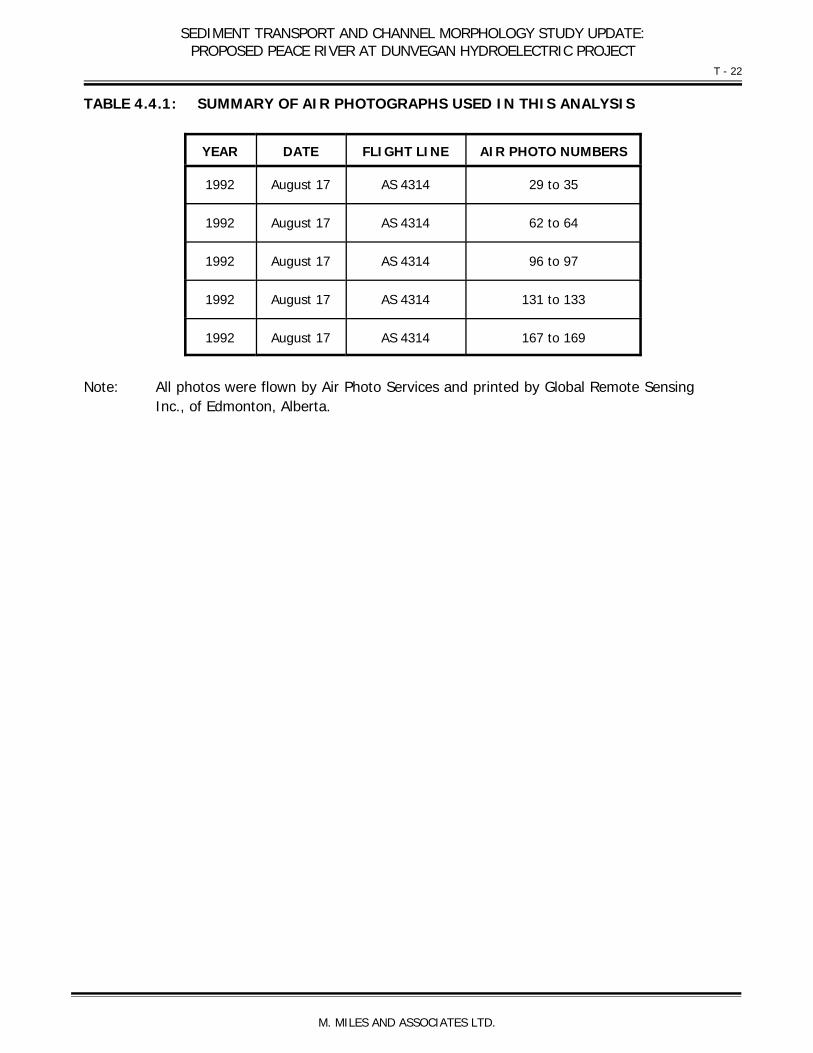
SEDIMENT TRANSPORT AND CHANNEL MORPHOLOGY STUDY UPDATE:PROPOSED PEACE RIVER AT DUNVEGAN HYDROELECTRIC PROJECT
T - 22
M. MILES AND ASSOCIATES LTD.
TABLE 4.4.1: SUMMARY OF AIR PHOTOGRAPHS USED IN THIS ANALYSIS
YEAR DATE FLIGHT LINE AIR PHOTO NUMBERS
1992 August 17 AS 4314 29 to 35
1992 August 17 AS 4314 62 to 64
1992 August 17 AS 4314 96 to 97
1992 August 17 AS 4314 131 to 133
1992 August 17 AS 4314 167 to 169
Note: All photos were flown by Air Photo Services and printed by Global Remote SensingInc., of Edmonton, Alberta.

TABLE 4.4.2: DISTRIBUTION OF SHORELINE MATERIALS (EXCLUDING ISLANDS OR BARS) T - 23
DISTANCEABOVE
HEADWORKS(km)
LEFT BANK RIGHT BANK
TOTALLENGTH
(km)
% of Shoreline Composed of:TOTAL
LENGTH(km)
% of Shoreline Composed of:
ColluvialVeneer
Over Rock
ColluvialFan
or Apron
FluvialFan
FluvialTerrace
ColluvialVeneer
Over Rock
ColluvialFan
or Apron
FluvialFan
FluvialTerrace
28 to 27 0.911 0.0 0.0 0.0 100.0 1.090 75.8 15.0 9.2 0.0
27 to 26 0.879 0.0 0.0 0.0 100.0 0.879 49.5 6.4 44.1 0.0
26 to 25 0.982 0.0 0.0 18.3 81.7 1.015 90.8 9.2 0.0 0.0
25 to 24 1.050 36.2 0.0 0.0 63.8 1.124 75.2 24.8 0.0 0.0
24 to 23 0.977 29.0 10.2 0.0 60.8 1.107 60.8 39.2 0.0 0.0
23 to 22 0.884 0.0 0.0 45.9 54.1 1.158 56.3 14.8 28.9 0.0
22 to 21 1.050 50.1 7.8 13.1 29.0 0.894 0.0 0.0 100.0 0.0
21 to 20 1.027 36.3 63.7 0.0 0.0 1.001 17.8 0.0 82.2 0.0
20 to 19 1.116 44.3 55.7 0.0 0.0 1.035 51.6 0.0 48.4 0.0
19 to 18 1.156 45.3 54.7 0.0 0.0 1.016 100.0 0.0 0.0 0.0
18 to 17 1.049 36.3 63.7 0.0 0.0 0.992 85.5 0.0 14.5 0.0
17 to 16 1.017 55.5 44.5 0.0 0.0 1.037 100.0 0.0 0.0 0.0
16 to 15 1.011 12.7 87.3 0.0 0.0 0.988 100.0 0.0 0.0 0.0
15 to 14 1.023 0.0 100.0 0.0 0.0 1.036 89.7 10.3 0.0 0.0
14 to 13 1.014 0.0 100.0 0.0 0.0 1.012 95.7 0.0 4.3 0.0
13 to 12 0.998 0.0 100.0 0.0 0.0 1.040 80.3 19.7 0.0 0.0
12 to 11 1.069 77.5 22.5 0.0 0.0 1.141 81.4 0.0 18.6 0.0
11 to 10 0.864 50.0 50.0 0.0 0.0 1.025 77.0 23.0 0.0 0.0
10 to 9 0.934 63.7 0.0 13.9 22.4 1.099 87.4 0.0 12.6 0.0
9 to 8 0.985 0.0 0.0 20.2 79.8 1.007 100.0 0.0 0.0 0.0
8 to 7 1.106 0.0 41.9 0.0 58.1 1.041 75.6 24.4 0.0 0.0
7 to 6 1.034 67.1 22.1 10.7 0.0 0.958 21.2 78.8 0.0 0.0
6 to 5 1.039 72.4 27.6 0.0 0.0 0.968 0.0 100.0 0.0 0.0
5 to 4 0.982 56.2 43.8 0.0 0.0 1.023 0.0 100.0 0.0 0.0
4 to 3 0.950 0.0 74.2 25.8 0.0 1.042 80.7 19.3 0.0 0.0
3 to 2 1.020 37.3 38.9 23.8 0.0 1.069 41.5 0.0 58.5 0.0
2 to 1 1.035 82.8 17.2 0.0 0.0 0.956 0.0 15.2 84.8 0.0
1 to 0 0.923 71.3 28.7 0.0 0.0 0.915 2.4 97.6 0.0 0.0

SEDIMENT TRANSPORT AND CHANNEL MORPHOLOGY STUDY UPDATE:PROPOSED PEACE RIVER AT DUNVEGAN HYDROELECTRIC PROJECT
T - 24
M. MILES AND ASSOCIATES LTD.
TABLE 4.4.3: LENGTH OF ISLANDS OR BARS WITHIN THE PROPOSEDDUNVEGAN HEADPOND
DISTANCE ABOVE HEADWORKS(km)
LENGTH OF ISLANDS OR BARS(km)
28 to 27 0.000
27 to 26 0.587
26 to 25 0.096
25 to 24 1.268
24 to 23 1.122
23 to 22 0.000
22 to 21 0.748
21 to 20 0.929
20 to 19 0.000
19 to 18 2.070
18 to 17 0.249
17 to 16 0.558
16 to 15 0.678
15 to 14 0.000
14 to 13 0.000
13 to 12 0.000
12 to 11 0.000
11 to 10 0.673
10 to 9 0.945
9 to 8 0.165
8 to 7 0.681
7 to 6 1.783
6 to 5 0.787
5 to 4 0.000
4 to 3 0.000
3 to 2 0.550
2 to 1 0.954
1 to 0 0.863
SEDIMENT TRANSPORT AND CHANNEL MORPHOLOGY STUDY UPDATE:PROPOSED PEACE RIVER AT DUNVEGAN HYDROELECTRIC PROJECT
M. MILES AND ASSOCIATES LTD.
APPENDIX 1:
GSTARS ANALYSESConducted by Dr. David McLean, P.Eng.northwest hydraulics consultants ltd.

Ref. No. 3-4266
1 PURPOSE This memo summarizes progress in developing a simple one-dimensional model of sedimentation in the headpond of the proposed reservoir on the Peace River at Dunvegan. The sediment modelling was carried out using the program “GSTARS 3.0”, developed by the US Department of the Interior, Bureau of Reclamation (Yang and Simones, 2002). A series of manual computations using our in-house sediment transport programs was used to provide an independent check. All results are preliminary at this time and some of the basic assumptions on sediment inflows, bed material characteristics and inflow hydrographs are still under review. 2 INFORMATION AVAILABLE 2.1 River Cross Sections The topography in the headpond was based on the geometry file in the HEC-RAS model (Headave.prj) provided by Mack & Slack Consultants. It was assumed that this hydraulic model was an accurate representation of the Peace River and only minor modifications were made to incorporate this information into the GSTARS sediment program. For example, some cross sections were filtered to reduce the number of points to meet the limitations in GSTARS (maximum of 50 points per cross section). 2.2 Hydrology The flow files in the Mack & Slack HEC-RAS model listed discharges and flow exceedance values for post-project conditions on the Peace River at Dunvegan. These values were used to develop a representation annual hydrograph to estimate annual sediment transport rates and deposition volumes. 2.3 Bed Material Grain size characteristics were derived from the sub-surface bed material samples collected at the island margins and the single mid-channel bar. These samples showed the sediments consist of mainly of gravel and coarse sand. Representative grain size statistics are as follows: D90 = 40 mm D50 = 13 mm D35 = 6 mm D10 = 0.15 mm 2.4 Sediment Transport Information on suspended sediment loads was obtained from periodic measurements by Water Survey of
nhc
memorandum
northwest hydraulic consultants
30 gostick placenorth vancouver, bc
V7M 3G2, canadatel: (604) 980-6011fax: (604) 980-9264
www.nhcweb.com
To:
Mike Miles & Associates Date: Nov. 15, 2005
From: Dave McLean, Ph.D., P.Eng. Page: 1 of 7 Cc:
Re:
Prediction of Sedimentation in Dunvegan Headpond-Preliminary Results Final Submission of May 8, 2005 Memo
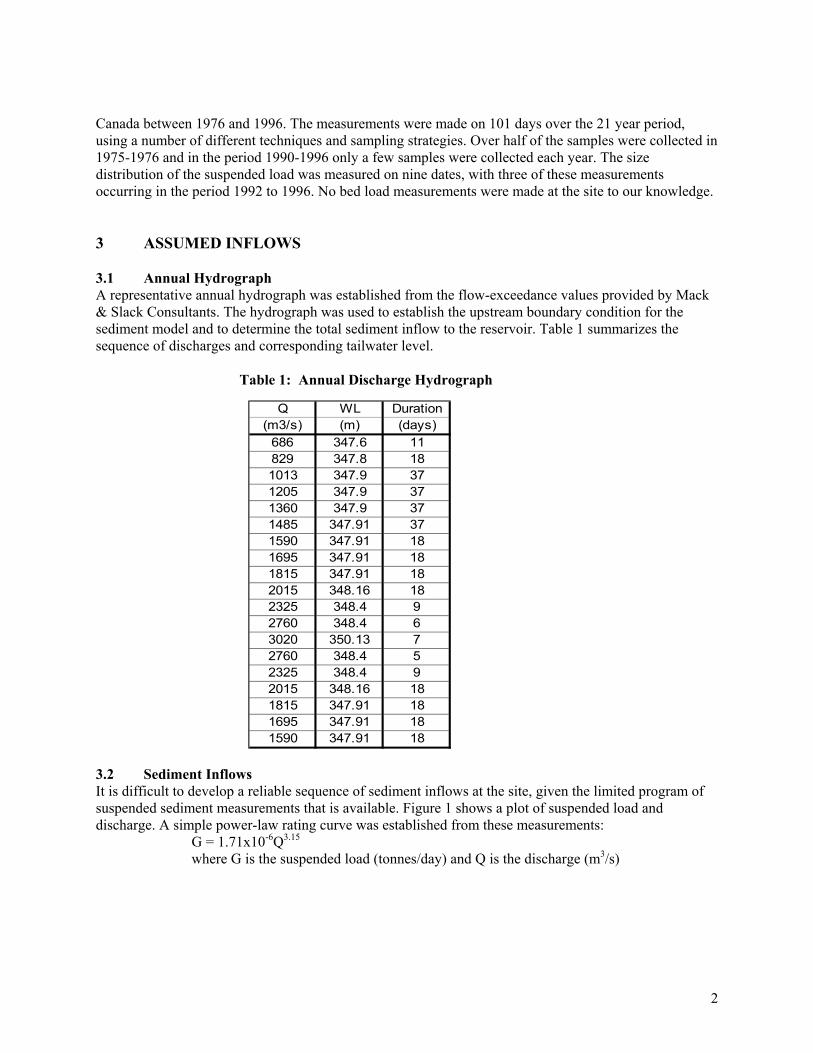
2
Canada between 1976 and 1996. The measurements were made on 101 days over the 21 year period, using a number of different techniques and sampling strategies. Over half of the samples were collected in 1975-1976 and in the period 1990-1996 only a few samples were collected each year. The size distribution of the suspended load was measured on nine dates, with three of these measurements occurring in the period 1992 to 1996. No bed load measurements were made at the site to our knowledge. 3 ASSUMED INFLOWS 3.1 Annual Hydrograph A representative annual hydrograph was established from the flow-exceedance values provided by Mack & Slack Consultants. The hydrograph was used to establish the upstream boundary condition for the sediment model and to determine the total sediment inflow to the reservoir. Table 1 summarizes the sequence of discharges and corresponding tailwater level. Table 1: Annual Discharge Hydrograph 3.2 Sediment Inflows It is difficult to develop a reliable sequence of sediment inflows at the site, given the limited program of suspended sediment measurements that is available. Figure 1 shows a plot of suspended load and discharge. A simple power-law rating curve was established from these measurements: G = 1.71x10⁻⁶Q3.15
where G is the suspended load (tonnes/day) and Q is the discharge (m3/s)
Q WL Duration(m3/s) (m) (days)
686 347.6 11829 347.8 181013 347.9 371205 347.9 371360 347.9 371485 347.91 371590 347.91 181695 347.91 181815 347.91 182015 348.16 182325 348.4 92760 348.4 63020 350.13 72760 348.4 52325 348.4 92015 348.16 181815 347.91 181695 347.91 181590 347.91 18

3
Sediment Rating Curves
y = 2E-06x3.148
100
1000
10000
100000
1000000
10 100 1000 10000
Q (m3/s)
G(to
nnes
/day
)
Suspended Load
Bed Load
Power (SuspendedLoad)
Figure 1: Adopted Sediment Rating Curves The adopted rating curve gives reasonably similar results to a correlation developed by Water Survey of Canada from data collected in 1975. Carsons (1991) highlights some of the complexity of suspended sediment transport on the Peace River and suggests using more complicated procedures for estimating loads. However, given the limited data available, such methods do not appear to be warranted. A preliminary estimate of gravel bed load was made at cross section 26+360 using the hydraulic data from the Mack & Slack HEC-RAS model (pre-project conditions). The Ackers-White bed load equation was used for this analysis. The representative grain size was based on the average sub-surface bed material samples (D50 size of 13 mm and a D35 size of 8 mm). This prediction is expected to overestimate the gravel transport, particularly at lower flows, since the armouring effect of the coarser surface layer is not accounted for in the computations. These computations indicate the gravel bed load is typically between 4-5% of the total suspended load at discharges between 1,600 to 3,200 m3/s. The final adopted size distribution of the sediment inflows is shown in Table 2.

4
Table 2: Size Distribution of Sediment Load Size Range D(mm) D(mm) Fraction (%)
clay 0.002 0.008 33.0silt 0.008 0.0625 49.0very fine sand 0.0625 0.2 7.0md sand 0.2 0.5 6.0cs sand 0.5 2.0 2.0very fn gravel 2.0 8.0 0.5fine gravel 8.0 16.0 1.0med gravel 16.0 32.0 1.0cs gravel 32.0 64.0 0.5Total 100.0 This table shows that the fine sediments (clay and silt) account for most of the sediment load (82%) at the site. The coarse sand (>0.125 mm) and gravel load accounts for only about 11% of the sediment load. 4 HYDRAULIC ANALYSIS 4.1 Hec-Ras Results Figure 2 shows the computed mean channel velocities through the headpond for the “with project” and “without project” tailwater conditions at a discharge of 2,500 m3/s (2% flow exceedance). This discharge corresponds to a moderately high flow (equalled or exceeded on average 7.3 days per year). Under present (without project) conditions, the mean channel velocity averages between 1.5 to 2.0 m/s along the reach. After project implementation the velocity will decrease noticeably downstream of station 17+000, typically averaging 0.5 to 1.0 m/s. There is a noticeable spike in the velocity at station 24+000. It is not clear whether this reflects actual hydraulic conditions or is induced by some limitations in the available cross section surveys. Figure 2: Variation in Mean Velocity Along Peace River Figure 3 shows the computed sediment transport capacity along the reach for “with project” flow conditions at a discharge of 2,500 m3/s. The sediment transport capacity was calculated using the Ackers-White transport equation, with a sediment size of 0.35 mm (medium sand). The computed sediment transport capacity represents the transport rate that would occur along the channel if the river bed consisted entirely of sand and if the rate of supply at the upstream end of the reach was unlimited. Also shown on this plot is a horizontal line representing the estimated incoming suspended sand load as determined from the actual sediment transport measurements on the Peace River. The suspended sand load (sediment coarser than 0.0625 mm) is approximately 13,000 t/day at a discharge of 2,500 m3/s. This graph shows the post-project transport capacity will exceed the incoming sand load upstream of station 18+000 and will be much less than the incoming sand load downstream of station 18+000. This implies
Q=2500 m3/s
00.5
11.5
22.5
0 5000 10000 15000 20000 25000 30000
Distance Above Dam (m)
V (m
/s)
Without Project
With Project

5
the sand load will continue to be flushed through the reach between 26+300 and 18+000 without experiencing significant deposition but will deposit in the backwater affected reach downstream of station 18+000. The sand transport capacity at the dam approaches zero, indicating virtually all of the incoming sand load will be deposited in the headpond at this particular flow condition. Figure 3: Estimated Sediment Transport Capacity Through Headpond Reach 4 PRELIMINARY GSTARS MODEL RESULTS 4.1 Model Development A preliminary one-dimensional sediment model was developed from the available data to illustrate the pattern of deposition over a sequence of annual hydrographs. Five series of model runs were carried out, as summarized in Table 3. Table 3: Model Runs Series Description Purpose 1 Fixed-bed hydraulic model Verify hydraulic computations 2 Sand bed morphologic model, 15
1-day discharges Test routing of coarse sand & gravel
3 Sand deposition model, 1-year simulation
Predict deposition pattern of gravel & coarse sand
4 Sand deposition model, 10-year simulation
Repeat Series 3 with 10 year time series. Include lateral variation in n values
5 Total load deposition model, 10 year simulation
Include clay, silt and fine sand fraction in model
Series 1 involved running GSTARS with a fixed bed to reproduce the earlier backwater computations carried out by Mack & Slack Consultants. Series 2 through Series 4 involved simulating deposition and erosion of the coarse sand and gravel fraction of the sediment load for time periods of up to 10-years. Series 5 involved adding the silt and clay fraction of the sediment load to assess whether any additional deposition could occur as a result of settling of the very fine suspended sediments which make up the greatest proportion of the river’s annual sediment load. Modifications were made to several model parameters during the course of the runs to test the sensitivity of critical values such as grain size distribution, bed material size and method of sediment transport calculation. In total 15 separate runs were made during these preliminary investigations.
Q=2500 m3/s
01000020000300004000050000
0 5000 10000 15000 20000 25000 30000
Dist (m)
Sedi
men
t Tr
ansp
ort(
T/da
y)
Sand Inflow
Transport Capacity

6
4.2 Preliminary Results-Series 5 Table 4 summarizes the predicted deposition volumes in Run 5 after 10 years of operations. The results are given by grain size fraction for each cross section in the headpond. Also provided are the per centage of total deposits for each grain size fraction (to indicate the size of the deposited sediments) and the per centage of sediment trapped in the headpond (equivalent to the headpond’s trapping efficiency). Some key results are as follows:
• all of the incoming gravel load is deposited in the upstream end of the headpond, mainly upstream of station 18+000;
• virtually all of the medium and coarse sand (0.2 mm to 2 mm) is deposited in the headpond, with most deposition occurring between station 8+597 and 18+240;
• virtually all of the fine sand (0.0625 mm to 0.2 mm) is deposited in the headpond, with most of the deposition occurring between station 18+240 to 4+095;
• a small fraction of the coarse silt (7.6%) is deposited in the headpond with most of this deposition occurring near the dam between station 6+000 and 0+597.
Figure 4 shows the computed bed profiles for successive years of operations. Some key features of this plot are as follows:
• bed levels are predicted to rise near the upstream end of the reach between station 25+000 and 26+360. The deposited material in this reach is predicted to be mainly gravel;
• the greatest bed level rise is predicted to occur in the reach between station 16+700 and 8+600. The deposits in this reach are predicted to consist predominantly of medium to coarse sand (0.2 mm to 2.0 mm);
• bed level changes decrease near the dam, indicating most deposition occurs upstream of station 4+095. However, over time the sand deposits will extend further downstream, similar to a prograding delta.
4.3 Interpretation of Results The hydraulic analysis and one-dimensional sediment GSTARS model both indicate that substantial amounts of medium to coarse sand will be deposited in the headpond upstream of the dam. The lower 20 km of the headpond will eventually transform to a predominantly sand-bed channel. The sand will be deposited in the lower velocity sections of the channel, particularly in areas of flow expansion and on point-bars associated with bends. It is expected that some very fine sand and coarse silt may be deposited in the lower reach of the reservoir where the velocities are lowest. Fine sand and coarse silt may also be deposited further upstream if new vegetation becomes established on the higher bars. 4.4 Limitations of Model Predictions The available cross section data makes it difficult to assess local deposition patterns, particularly in the region between station 18+240 and 26+000. Additional cross section surveys in this reach would improve the resolution and could also eliminate some of the unusual spikes in velocities and sediment transport rates. It should be noted that the model is one-dimensional and can not fully represent the flow and sediment transport on some of the complex bar or riffle features. A two dimensional model, such as River-2d could provide better representation of sedimentation patterns in these areas. However, a two dimensional hydraulic/sediment model would only be warranted if substantially more topographic information was available. 4.5 Finalization of Model Runs Some additional review is being carried out to assess the reasonableness of the sediment inflow assumptions and the model parameters controlling deposition pattern of the finer sediments. We will also extend the model runs to a longer time frame once the main model parameters have been finalized.

7
Table 4: Predicted Deposition Pattern After Year 10 Cross Station Deposition By Grain Size FractionSection (m from Total Total .002-0.008 .008-.0625 .0625-.2 .2-.5 .5-2.0 2-8 8-16 16-32 32-64
dam) tonnes m3 m3 m3 m3 m3 m3 m3 m3 m3 m31 26360 57992 36477 1363 5726 -147 -245 200 3176 4842 8560 130032 26240 179440 112870 267 8318 -818 -1316 445 9572 14666 9752 719803 26000 664170 417760 3257 8126 -2054 -901 4203 30163 54763 104810 2154004 25000 1337500 841260 -975 13261 8660 37582 22875 95551 251520 411680 10985 24000 82873 52127 1809 3390 -15957 -34421 -2225 -9220 108930 -177 06 21500 1107600 696650 -442 2589 65520 147780 75406 106000 233800 65993 07 18240 1022100 642910 257 21567 101780 287910 122690 39132 67236 2345 08 17900 232450 146210 6136 11623 25783 71672 28600 6248 -589 -3258 09 17501 490860 308750 148 6682 80307 152030 54867 5011 6759 2950 010 17101 498560 313590 14612 27941 59923 156660 59033 1121 -3342 -2353 011 16701 453190 285060 903 37922 54809 140120 52718 272 -1425 -256 012 16301 452430 284580 12033 28032 54444 137110 51085 1629 883 -637 013 15986 1998500 1257000 576 25473 318030 666970 226410 5072 10998 3495 014 11692 4011900 2523500 11728 35344 1064200 1089600 311670 5878 5060 58 015 10001 2019600 1270300 2251 50093 691920 416250 108590 702 499 0 016 8597 2336600 1469700 4315 165850 987590 250080 60787 644 465 0 017 6000 2119600 1333200 15925 624690 591890 78779 21460 409 91 0 018 4095 1500100 943550 21106 787130 119110 12477 3679 51 0 0 019 599 314770 197990 7003 213790 -2004 -15049 -5476 -269 -4 0 020 280 212550 133690 2910 104050 7316 14147 4961 303 4 0 021 0 138990 87425 1958 72871 4506 5867 2201 22 0 0 0
SUM (total deposition) 21232000 13355000 107140 2254500 4214800 3613100 1204200 301470 755150 602960 301480% of total deposition 100.0 0.80 16.88 31.56 27.05 9.02 2.26 5.65 4.51 2.26% of inflow trapped 22.09 0.5 7.6 99.9 99.9 99.9 100.0 100.0 100.0 100.0Outflow (tonnes) 74870000 31463000 43387000 9450 7379 2766 12 0 0 0
Peace River Bed Profiles Run 5C
334
336
338
340
342
344
346
348
350
352
0 5000 10000 15000 20000 25000 30000Distance (m)
Elev
atio
n (m
)
InitialAfter Year 1After Year 4After Year 5After Year 7After Year 10After Year 20After Year 30After Year 40After Year 50Water Level
Figure 4: Predicted Bed Level Changes in Headpond
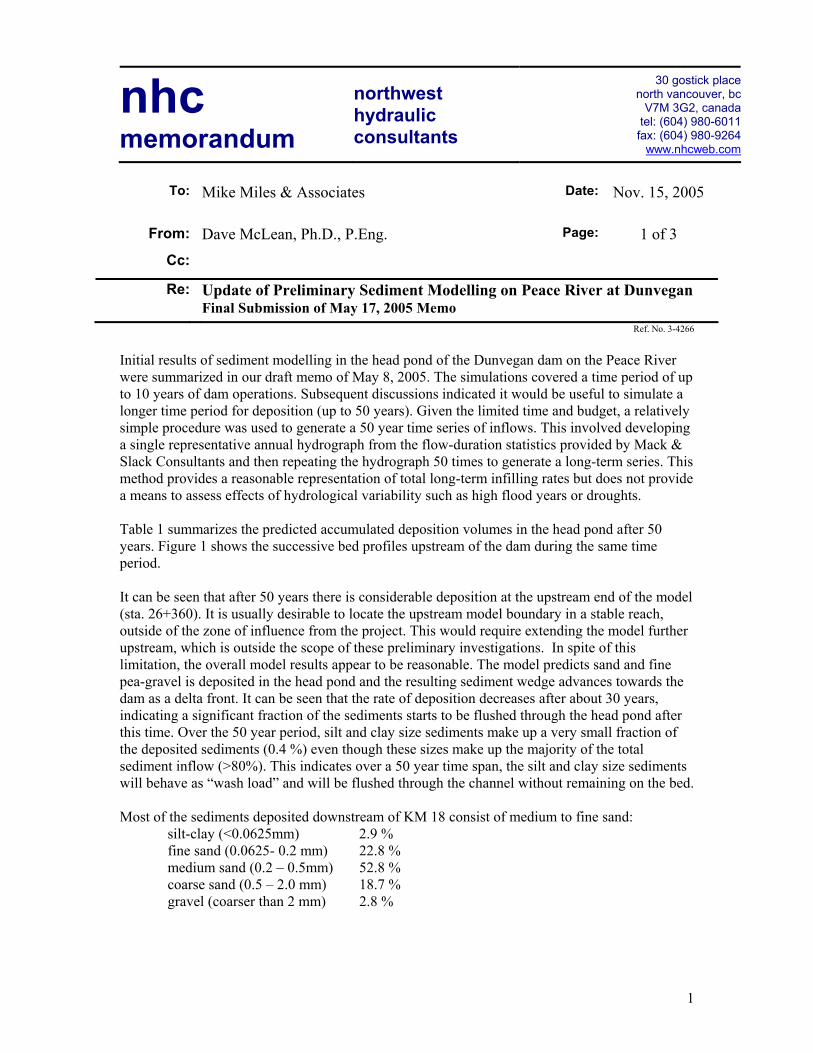
1
Ref. No. 3-4266
Initial results of sediment modelling in the head pond of the Dunvegan dam on the Peace River were summarized in our draft memo of May 8, 2005. The simulations covered a time period of up to 10 years of dam operations. Subsequent discussions indicated it would be useful to simulate a longer time period for deposition (up to 50 years). Given the limited time and budget, a relatively simple procedure was used to generate a 50 year time series of inflows. This involved developing a single representative annual hydrograph from the flow-duration statistics provided by Mack & Slack Consultants and then repeating the hydrograph 50 times to generate a long-term series. This method provides a reasonable representation of total long-term infilling rates but does not provide a means to assess effects of hydrological variability such as high flood years or droughts. Table 1 summarizes the predicted accumulated deposition volumes in the head pond after 50 years. Figure 1 shows the successive bed profiles upstream of the dam during the same time period. It can be seen that after 50 years there is considerable deposition at the upstream end of the model (sta. 26+360). It is usually desirable to locate the upstream model boundary in a stable reach, outside of the zone of influence from the project. This would require extending the model further upstream, which is outside the scope of these preliminary investigations. In spite of this limitation, the overall model results appear to be reasonable. The model predicts sand and fine pea-gravel is deposited in the head pond and the resulting sediment wedge advances towards the dam as a delta front. It can be seen that the rate of deposition decreases after about 30 years, indicating a significant fraction of the sediments starts to be flushed through the head pond after this time. Over the 50 year period, silt and clay size sediments make up a very small fraction of the deposited sediments (0.4 %) even though these sizes make up the majority of the total sediment inflow (>80%). This indicates over a 50 year time span, the silt and clay size sediments will behave as “wash load” and will be flushed through the channel without remaining on the bed. Most of the sediments deposited downstream of KM 18 consist of medium to fine sand: silt-clay (<0.0625mm) 2.9 % fine sand (0.0625- 0.2 mm) 22.8 % medium sand (0.2 – 0.5mm) 52.8 % coarse sand (0.5 – 2.0 mm) 18.7 % gravel (coarser than 2 mm) 2.8 %
nhc
memorandum
northwest hydraulic consultants
30 gostick placenorth vancouver, bc
V7M 3G2, canadatel: (604) 980-6011fax: (604) 980-9264
www.nhcweb.com
To:
Mike Miles & Associates Date: Nov. 15, 2005
From: Dave McLean, Ph.D., P.Eng. Page: 1 of 3 Cc:
Re:
Update of Preliminary Sediment Modelling on Peace River at Dunvegan Final Submission of May 17, 2005 Memo

2
Table 1: Accumulated Sediment Deposition After 50 Years Cross Station Total Deposition Deposition By Grain Size Fraction (m3)Section (m from .002-0.008 .008-.0625 .0625-.2 .2-.5 .5-2.0 2-8 8-16 16-32 32-64
dam) tonnes m3 mm mm mm mm mm mm mm mm mm1 26360 134350 84508 3576 19717 495 3816 1442 7336 17154 23956 70172 26240 396080 249130 3802 13080 1837 12875 6502 25189 37656 40756 1074403 26000 1657500 1042600 5550 40942 6898 23335 17128 57047 94292 87285 7101004 25000 2901700 1825200 9118 21945 35073 113080 55144 131580 221130 555250 6828405 24000 3411300 2145700 -2170 33597 40359 124240 64405 126620 308220 1450500 06 21500 4820800 3032300 167 283 -30585 54430 62094 478610 1625800 841490 07 18240 2869200 1804700 1462 14822 77073 177300 88745 327480 1102300 15570 08 17900 571290 359340 2300 12180 24379 49846 21988 97444 157780 -6581 09 17501 806840 507500 151 6797 76536 202330 81328 56260 77936 6165 010 17101 751170 472490 14310 52205 72650 188250 75782 40494 33167 -4366 011 16701 665640 418680 14626 29050 74728 187380 74332 25031 13959 -419 012 16301 657160 413350 27479 51914 55186 174770 71099 29139 8124 -4356 013 15986 3213000 2021000 10654 17975 369920 1083900 423120 58490 47428 9508 014 11692 5868900 3691500 990 37298 727200 2086200 799010 23731 17024 73 015 10001 2890600 1818200 10958 36384 387820 989890 388570 531 4008 0 016 8597 4584200 2883500 1674 31533 572980 1666200 606750 7783 -2901 -543 017 6000 5955900 3746300 10706 51215 895530 2055000 723080 3596 6604 543 018 4095 7979100 5018900 2324 49283 1455800 2668700 837480 4704 730 -137 019 599 3995600 2513300 10602 35771 733690 1337100 401030 -751 -2874 -1333 020 280 951220 598310 3684 86666 143910 276900 84845 872 1042 395 021 0 531410 334260 13494 92770 62387 126200 39945 -94 -109 -336 0
SUM (total deposition) 55612960 34980768 145457 735427 5783866 13601742 4923819 1501091 3768469 3013420 1507397% of total deposition 100.0 0.42 2.10 16.53 38.88 14.08 4.29 10.77 8.61 4.31% of inflow trapped 11.57 0.15 0.50 27.41 75.20 81.66 99.58 99.81 99.95 100.00Outflow (tonnes) 424900000 157940000 233690000 24356000 7133700 1758000 10025 11690 2243 0 Upstream of KM 18, the accumulated deposits consist mainly of gravel and sand. Comparison with results from Year 10 show the deposited sediments in the upper end of the head pond become coarser over time, indicating that gravel bed load eventually starts to prograde over the finer sandy deposits. Given sufficient time, the river will eventually return to a gravel bed channel, if there is a significant supply of gravel sediments to the system. However, the time scale for this second transition from a predominantly sand channel back to a gravel bed depends mainly on the method of computing gravel transport rates and the gravel bed load rating curve at the upstream boundary. Further assessment of gravel bed load transport rates is warranted to improve this aspect of the model. Also, if this process is considered critical, then the upstream boundary should be extended further upstream since it is clearly not in a stable section of the river over this time period.
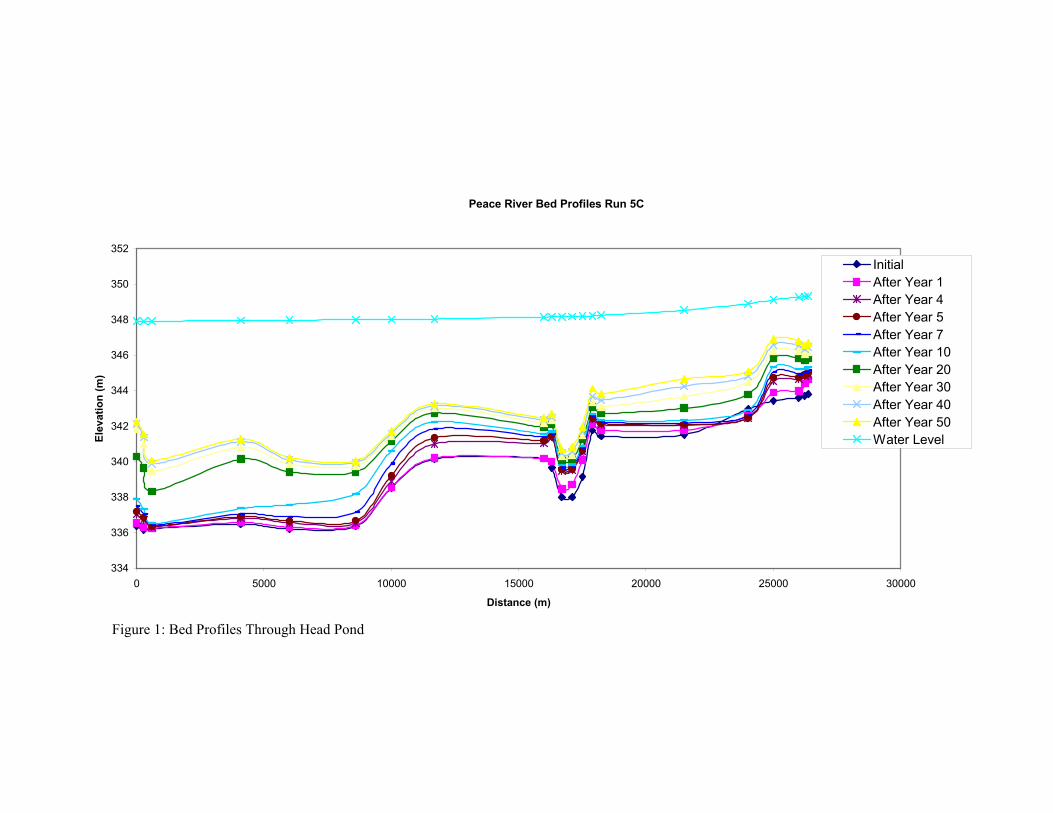
Peace River Bed Profiles Run 5C
334
336
338
340
342
344
346
348
350
352
0 5000 10000 15000 20000 25000 30000
Distance (m)
Elev
atio
n (m
)
InitialAfter Year 1After Year 4After Year 5After Year 7After Year 10After Year 20After Year 30After Year 40After Year 50Water Level
Figure 1: Bed Profiles Through Head Pond

Ref. No. 3-4266
SCOPE OF WORK This memo is the third in a series by nhc to summarize results of one dimensional sediment modelling in the headpond of Glacier Power Ltd.’s Dunvegan hydroelectric project. The first memo, dated May 8th, summarized predicted sediment patterns after ten years of operations. The second memo, dated May 17th, extended the simulation to cover a period of up to 50 years. Subsequent discussions identified two further investigations that would provide useful information on the project impacts.
1. The one dimensional model is intended to simulate sediment accumulation in the headpond upstream of the dam and can not simulate local deposition and scour patterns in the vicinity of the dam’s power intakes and spillway structures. The previous runs used the average depth and average velocity at the dam, and are expected to overestimate local deposition directly in front of the dam since sediment flushing through the intakes and powerhouse was ignored. It was decided that some provision for incorporating the effects of local sediment flushing and by-passing should be provided. The simplest approach in a one-dimensional model is to specify a “transmissive” boundary at the cross section nearest to the dam. This will set the sediment transport to be equal to the incoming load. The effect of this assumption on the overall sediment deposition pattern further upstream in the headpond was then assessed.
2. Earlier plans called for a somewhat lower tailwater level than the present operating configuration.
During discussions with Glacier Power and M. Miles it was decided that it would be useful to run the model with this earlier tailwater condition and compare the deposition patterns with the present configuration to assess the sensitivity of the model predictions to variations in tailwater levels.
TRANSMISSIVE BOUNDARY AT DAM Run 6 was made by setting a transmissive boundary at cross section 0. All other topographic, hydrological and dam operating conditions were the same as in previous runs (Run 5C). Figure 1 shows the longitudinal profile through the headpond after 50 years of dam operations. The channel bed level at the dam did not aggrade over the time of the simulations. However, the overall sediment deposition pattern upstream in headpond remained virtually identical to Run 5C (differences amounted to 0.1 m over 50 years).
nhc
memorandum
northwest hydraulic consultants
30 gostick placenorth vancouver, bc
V7M 3G2, canadatel: (604) 980-6011fax: (604) 980-9264
www.nhcweb.com
To:
Mike Miles & Associates
Date: Nov. 15, 2005
From: Dave McLean, Ph.D., P.Eng. Page: 1 of 6 Cc:
Re: Peace River at Dunvegan-Update of GSTARS Runs
Final Submission of July 4, 2005 Memo
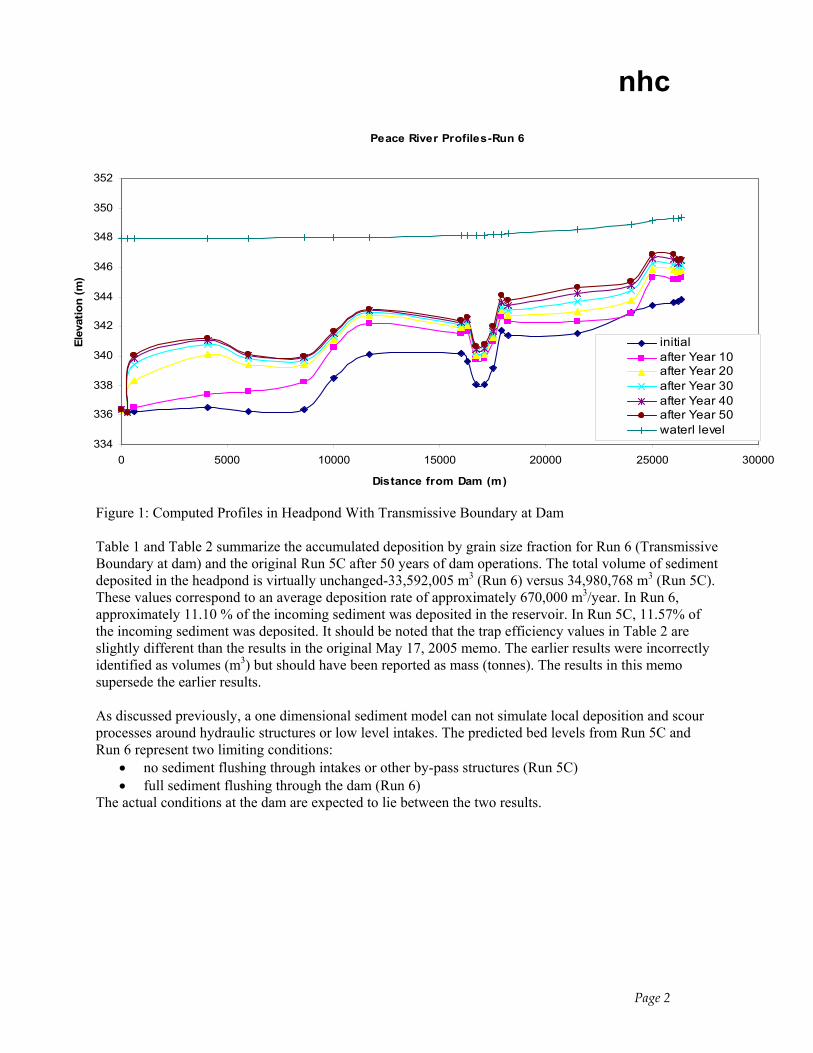
nhc
Page 2
Figure 1: Computed Profiles in Headpond With Transmissive Boundary at Dam Table 1 and Table 2 summarize the accumulated deposition by grain size fraction for Run 6 (Transmissive Boundary at dam) and the original Run 5C after 50 years of dam operations. The total volume of sediment deposited in the headpond is virtually unchanged-33,592,005 m3 (Run 6) versus 34,980,768 m3 (Run 5C). These values correspond to an average deposition rate of approximately 670,000 m3/year. In Run 6, approximately 11.10 % of the incoming sediment was deposited in the reservoir. In Run 5C, 11.57% of the incoming sediment was deposited. It should be noted that the trap efficiency values in Table 2 are slightly different than the results in the original May 17, 2005 memo. The earlier results were incorrectly identified as volumes (m3) but should have been reported as mass (tonnes). The results in this memo supersede the earlier results. As discussed previously, a one dimensional sediment model can not simulate local deposition and scour processes around hydraulic structures or low level intakes. The predicted bed levels from Run 5C and Run 6 represent two limiting conditions:
• no sediment flushing through intakes or other by-pass structures (Run 5C) • full sediment flushing through the dam (Run 6)
The actual conditions at the dam are expected to lie between the two results.
Peace River Profiles-Run 6
334
336
338
340
342
344
346
348
350
352
0 5000 10000 15000 20000 25000 30000
Distance from Dam (m)
Elev
atio
n (m
)
initialafter Year 10after Year 20after Year 30after Year 40after Year 50waterl level

nhc
Page 3
Table 1: Deposition After 50 Years-Run 6 With Transmissive Boundary at Dam Cross Station Total Deposition Deposition By Grain Size Fraction (m3)Section (m from .002-0.008 .008-.0625 .0625-.2 .2-.5 .5-2.0 2-8 8-16 16-32 32-64
dam) tonnes m3 mm mm mm mm mm mm mm mm mm1 26360 148860 93635 2674 26289 1976 7016 2881 11035 24537 20697 -34722 26240 377990 237760 -1015 12881 1902 12458 6155 21965 32123 35958 1153303 26000 1686600 1060900 12070 37497 7856 27504 18578 58251 94755 91017 7133704 25000 2872400 1806800 -247 27577 33892 109570 53661 131410 222560 546160 6821605 24000 3345400 2104300 3015 28645 39832 121610 63018 122300 298840 1427000 06 21500 4748300 2986700 -152 -2377 -36401 44155 58077 468960 1579700 874700 07 18240 2819900 1773700 2299 12963 69973 161180 82148 322280 1103700 19183 08 17900 572150 359880 2800 13185 21226 44649 20089 97082 168290 -7441 09 17501 814320 512210 29018 58625 52276 153270 64876 58105 90011 6024 010 17101 738930 464790 25879 48260 60818 169030 69437 48350 46897 -3887 011 16701 660220 415280 7475 54823 62087 171600 69757 29695 20315 -472 012 16301 638070 401350 27164 41641 55766 173460 70309 27667 9303 -3960 013 15986 3160000 1987600 2660 29966 356610 1059600 414820 62016 52238 9735 014 11692 5749800 3616600 6710 23180 703640 2051500 788980 24723 17869 76 015 10001 2817600 1772200 1359 40138 371100 970620 383920 839 4264 0 016 8597 4510300 2837000 9675 19961 558360 1642600 602530 7683 -3129 -727 017 6000 5838800 3672600 1944 49447 864040 2027400 718770 3559 6699 727 018 4095 7868000 4949000 2405 48110 1394100 2657700 841390 4784 792 -237 019 599 4037600 2539700 3088 55861 719830 1356300 410150 -639 -3087 -1851 020 280 0 0 0 0 0 0 0 0 0 0 021 0 0 0 0 0 0 0 0 0 0 0 0
SUM (total deposition) 53405240 33592005 138820 626672 5338884 12961222 4739546 1500066 3766677 3012703 1507388% of total deposition 100.0 0.41 1.87 15.89 38.58 14.11 4.47 11.21 8.97 4.49% of inflow trapped 11.11 0.14 0.42 25.30 71.66 78.61 99.51 99.76 99.93 100.0Outflow (tonnes) 427100000 157950000 233860000 25063000 8152000 2050900 11655 14489 3319 0 Table 2: Deposition After 50 Years-Run 5C Cross Station Total Deposition Deposition By Grain Size Fraction (m3)Section (m from .002-0.008 .008-.0625 .0625-.2 .2-.5 .5-2.0 2-8 8-16 16-32 32-64
dam) tonnes m3 mm mm mm mm mm mm mm mm mm1 26360 134350 84508 3576 19717 495 3816 1442 7336 17154 23956 70172 26240 396080 249130 3802 13080 1837 12875 6502 25189 37656 40756 1074403 26000 1657500 1042600 5550 40942 6898 23335 17128 57047 94292 87285 7101004 25000 2901700 1825200 9118 21945 35073 113080 55144 131580 221130 555250 6828405 24000 3411300 2145700 -2170 33597 40359 124240 64405 126620 308220 1450500 06 21500 4820800 3032300 167 283 -30585 54430 62094 478610 1625800 841490 07 18240 2869200 1804700 1462 14822 77073 177300 88745 327480 1102300 15570 08 17900 571290 359340 2300 12180 24379 49846 21988 97444 157780 -6581 09 17501 806840 507500 151 6797 76536 202330 81328 56260 77936 6165 010 17101 751170 472490 14310 52205 72650 188250 75782 40494 33167 -4366 011 16701 665640 418680 14626 29050 74728 187380 74332 25031 13959 -419 012 16301 657160 413350 27479 51914 55186 174770 71099 29139 8124 -4356 013 15986 3213000 2021000 10654 17975 369920 1083900 423120 58490 47428 9508 014 11692 5868900 3691500 990 37298 727200 2086200 799010 23731 17024 73 015 10001 2890600 1818200 10958 36384 387820 989890 388570 531 4008 0 016 8597 4584200 2883500 1674 31533 572980 1666200 606750 7783 -2901 -543 017 6000 5955900 3746300 10706 51215 895530 2055000 723080 3596 6604 543 018 4095 7979100 5018900 2324 49283 1455800 2668700 837480 4704 730 -137 019 599 3995600 2513300 10602 35771 733690 1337100 401030 -751 -2874 -1333 020 280 951220 598310 3684 86666 143910 276900 84845 872 1042 395 021 0 531410 334260 13494 92770 62387 126200 39945 -94 -109 -336 0
SUM (total deposition) 55612960 34980768 145457 735427 5783866 13601742 4923819 1501091 3768469 3013420 1507397% of total deposition 100.0 0.42 2.10 16.53 38.88 14.08 4.29 10.77 8.61 4.31% of inflow trapped 11.57 0.15 0.50 27.41 75.20 81.66 99.58 99.81 99.95 100.00Outflow (tonnes) 424900000 157940000 233690000 24356000 7133700 1758000 10025 11690 2243 0

nhc
Page 4
EFFECT OF LOWER TAILWATER The present tailwater condition was based on the 2004 HEC-RAS model of the headpond provided by Mack and Slack Consultants. It is understood that earlier designs of the facility called for a lower water level in the headpond. The earlier tailwater condition was based on water levels and discharges contained in the May 2000 report by M. Miles & Associates1. These results were from a backwater analysis carried out by UMA Consultants. Since only three flow conditions were available for the non-flood flow conditions, a smooth line was drawn through the results. Tailwater levels at higher flood discharges were similar to the present design values. Figure 2 compares the earlier tailwater curve with the present configuration. It can be seen that the water levels in the present plan are up to 1.5 m higher than the earlier design at discharges less than 1,500 m3/s. However, at discharges above 2,000 m3/s the two curves converge. It was assumed the two curves were identical at discharges greater than 2,500 m3/s. Figure 2: Comparison of Tailwater Levels Used in Headpond Sediment Modelling Table 3 summarizes the deposition pattern with the lower tailwater condition after 50 years of dam operations. Increasing the tailwater in the present design increased the total sediment deposition volume by 2.7 million m3 over 50 years (approximately 9 %). The total deposition volume amounted to 30,874414 over 50 years, corresponding to an average rate of deposition of 620,000 m3/year. The overall trap efficiency of the headpond increased from 10.2% to 11.1% after 50 years. Figure 3 compares the bed profiles after 50 years in Run 6 (present plan) and Run 8 (2000 plan). The higher tailwater with the present design will increase aggradation in the headpond by typically 0.3 m.
1 M. Miles & Associates Ltd. “Dunvegan Hydroelectric Project, Sediment Transport and Channel Morphology Assessment”, Prepared for: Glacier Power Ltd. May, 2000.
Assumed Water Level Upstream of Dam
345
346
347
348
349
350
0 1000 2000 3000 4000 5000 6000 7000 8000
Q(m3/s)
WL
(m)
present planoriginal plan
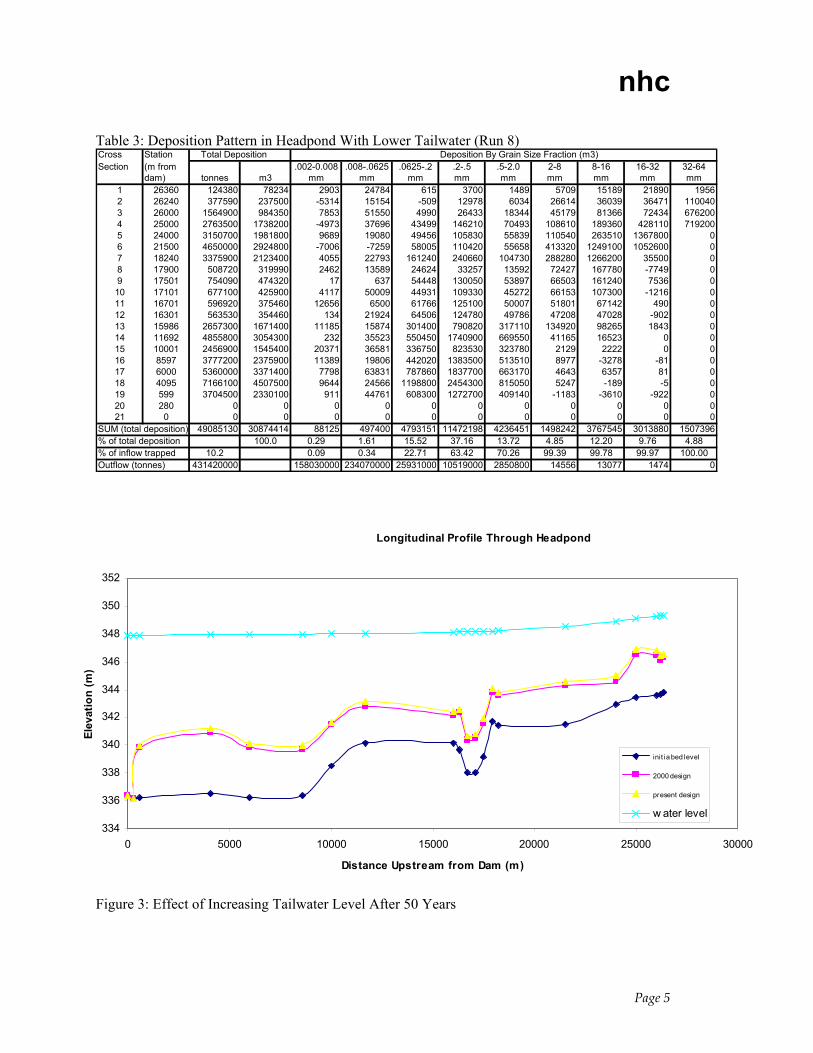
nhc
Page 5
Table 3: Deposition Pattern in Headpond With Lower Tailwater (Run 8) Cross Station Total Deposition Deposition By Grain Size Fraction (m3)Section (m from .002-0.008 .008-.0625 .0625-.2 .2-.5 .5-2.0 2-8 8-16 16-32 32-64
dam) tonnes m3 mm mm mm mm mm mm mm mm mm1 26360 124380 78234 2903 24784 615 3700 1489 5709 15189 21890 19562 26240 377590 237500 -5314 15154 -509 12978 6034 26614 36039 36471 1100403 26000 1564900 984350 7853 51550 4990 26433 18344 45179 81366 72434 6762004 25000 2763500 1738200 -4973 37696 43499 146210 70493 108610 189360 428110 7192005 24000 3150700 1981800 9689 19080 49456 105830 55839 110540 263510 1367800 06 21500 4650000 2924800 -7006 -7259 58005 110420 55658 413320 1249100 1052600 07 18240 3375900 2123400 4055 22793 161240 240660 104730 288280 1266200 35500 08 17900 508720 319990 2462 13589 24624 33257 13592 72427 167780 -7749 09 17501 754090 474320 17 637 54448 130050 53897 66503 161240 7536 010 17101 677100 425900 4117 50009 44931 109330 45272 66153 107300 -1216 011 16701 596920 375460 12656 6500 61766 125100 50007 51801 67142 490 012 16301 563530 354460 134 21924 64506 124780 49786 47208 47028 -902 013 15986 2657300 1671400 11185 15874 301400 790820 317110 134920 98265 1843 014 11692 4855800 3054300 232 35523 550450 1740900 669550 41165 16523 0 015 10001 2456900 1545400 20371 36581 336750 823530 323780 2129 2222 0 016 8597 3777200 2375900 11389 19806 442020 1383500 513510 8977 -3278 -81 017 6000 5360000 3371400 7798 63831 787860 1837700 663170 4643 6357 81 018 4095 7166100 4507500 9644 24566 1198800 2454300 815050 5247 -189 -5 019 599 3704500 2330100 911 44761 608300 1272700 409140 -1183 -3610 -922 020 280 0 0 0 0 0 0 0 0 0 0 021 0 0 0 0 0 0 0 0 0 0 0 0
SUM (total deposition) 49085130 30874414 88125 497400 4793151 11472198 4236451 1498242 3767545 3013880 1507396% of total deposition 100.0 0.29 1.61 15.52 37.16 13.72 4.85 12.20 9.76 4.88% of inflow trapped 10.2 0.09 0.34 22.71 63.42 70.26 99.39 99.78 99.97 100.00Outflow (tonnes) 431420000 158030000 234070000 25931000 10519000 2850800 14556 13077 1474 0 Figure 3: Effect of Increasing Tailwater Level After 50 Years
Longitudinal Profile Through Headpond
334
336
338
340
342
344
346
348
350
352
0 5000 10000 15000 20000 25000 30000
Distance Upstream from Dam (m)
Elev
atio
n (m
)
init ia bed level
2000 design
present design
w ater level

nhc
Page 6
These results indicate that project development planned in 2000 would have resulted in deposition of sand sized sediments in the lower 20 km of the headpond. As a result, the headpond reach would have eventually changed from a predominantly gravel bed channel to a sand bed channel. These findings are consistent with the conclusions contained in the 2000 report by M. Miles & Associates. The average rate of infilling was estimated from the GSTARS model to be 620,000 m3/year over the 50 year simulation period. The 2000 M. Miles & Associates study concluded: This results in an average annual bed load and bed material load transport rates at Dunvegan of 150,000 and 500,000 m3/year, respectively. If all of this sediment were deposited it would take over 100 years to completely fill the headpond. The estimated deposition rate of 620,000 m3/year from the GSTARS model is remarkably similar to the combined bed load and bed material load volume reported in the 2000 study.

SEDIMENT TRANSPORT AND CHANNEL MORPHOLOGY STUDY UPDATE:PROPOSED PEACE RIVER AT DUNVEGAN HYDROELECTRIC PROJECT
M. MILES AND ASSOCIATES LTD.
APPENDIX 2
EXAMPLES OF SHORELINE SEGMENTSCONSISTING OF
COLLUVIAL VENEER OVER ROCK

Date: October 21, 1999 MM 99 - 129 - 19A
a) Right bank: Km 24.5 +/-
Date: October 21, 1999 MM 99 - 130 - 25
b) Left bank: Km 16.5 +/-
A2 - 1 M. MILES AND ASSOCIATES LTD.
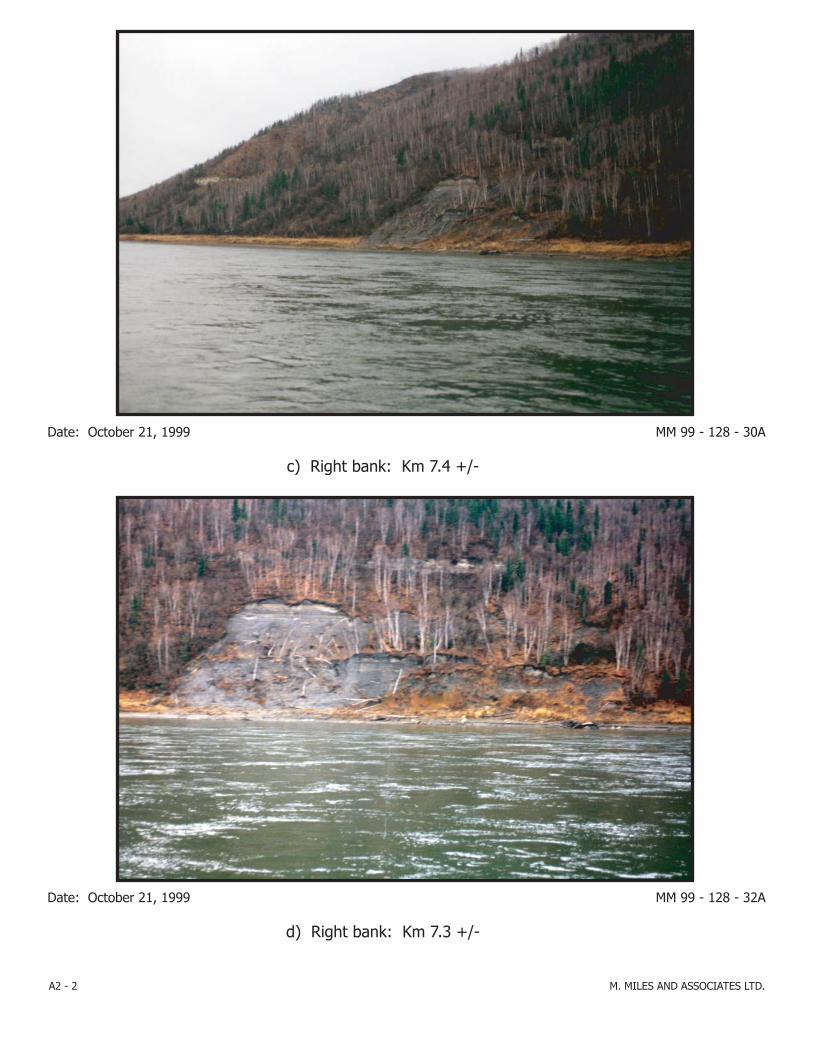
Date: October 21, 1999 MM 99 - 128 - 30A
c) Right bank: Km 7.4 +/-
Date: October 21, 1999 MM 99 - 128 - 32A
d) Right bank: Km 7.3 +/-
A2 - 2 M. MILES AND ASSOCIATES LTD.

SEDIMENT TRANSPORT AND CHANNEL MORPHOLOGY STUDY UPDATE:PROPOSED PEACE RIVER AT DUNVEGAN HYDROELECTRIC PROJECT
M. MILES AND ASSOCIATES LTD.
APPENDIX 3
EXAMPLES OF SHORELINE SEGMENTSCONSISTING OF
COLLUVIAL FANS OR COLLUVIAL APRONS

Date: October 21, 1999 MM 99 - 130 - 14
a) Left bank: Km 21.5
Date: October 21, 1999 MM 99 - 130 - 15
b) Left bank: Km 19.2
A3 - 1 M. MILES AND ASSOCIATES LTD.

Date: October 21, 1999 MM 99 - 128 - 15A
c) Left bank: Km 14.9
Date: October 21, 1999 MM 99 - 128 - 16A
d) Left bank: Km 14.9
A3 - 2 M. MILES AND ASSOCIATES LTD.

Date: October 21, 1999 MM 99 - 128 - 20A
e) Left bank: Km 13.4
Date: October 21, 1999 MM 99 - 130 - 31
f) Right bank: Km 10.8
A3 - 3 M. MILES AND ASSOCIATES LTD.
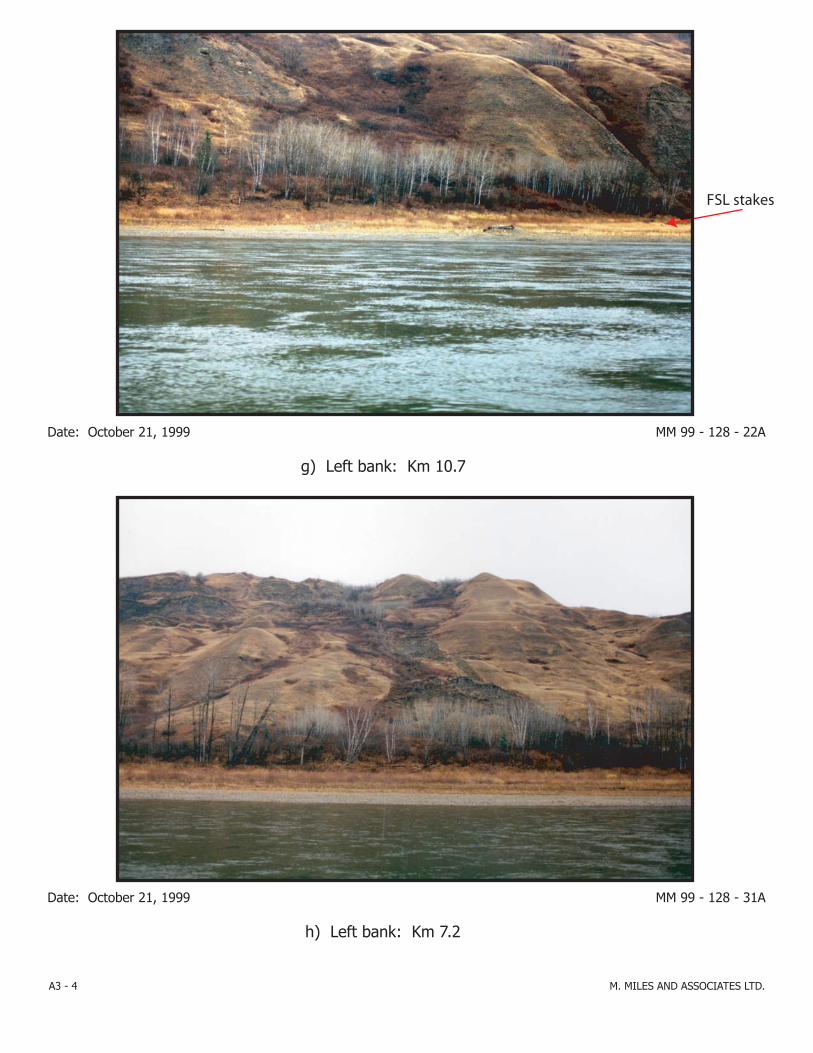
FSL stakes
Date: October 21, 1999 MM 99 - 128 - 22A
g) Left bank: Km 10.7
Date: October 21, 1999 MM 99 - 128 - 31A
h) Left bank: Km 7.2
A3 - 4 M. MILES AND ASSOCIATES LTD.

Date: October 21, 1999 MM 99 - 132 - 03
i) Left bank: Km 6.8
A3 - 5 M. MILES AND ASSOCIATES LTD.

SEDIMENT TRANSPORT AND CHANNEL MORPHOLOGY STUDY UPDATE:PROPOSED PEACE RIVER AT DUNVEGAN HYDROELECTRIC PROJECT
M. MILES AND ASSOCIATES LTD.
APPENDIX 4
EXAMPLES OF SHORELINE SEGMENTSCONSISTING OF FLUVIAL TERRACES

Date: October 21, 1999 MM 99 - 131 - 09
a) Left bank: Km 9.2
Date: October 21, 1999 MM 99 - 130 25A
b) Left bank: Km 8.5
A4 - 1 M. MILES AND ASSOCIATES LTD.
FSL stakes
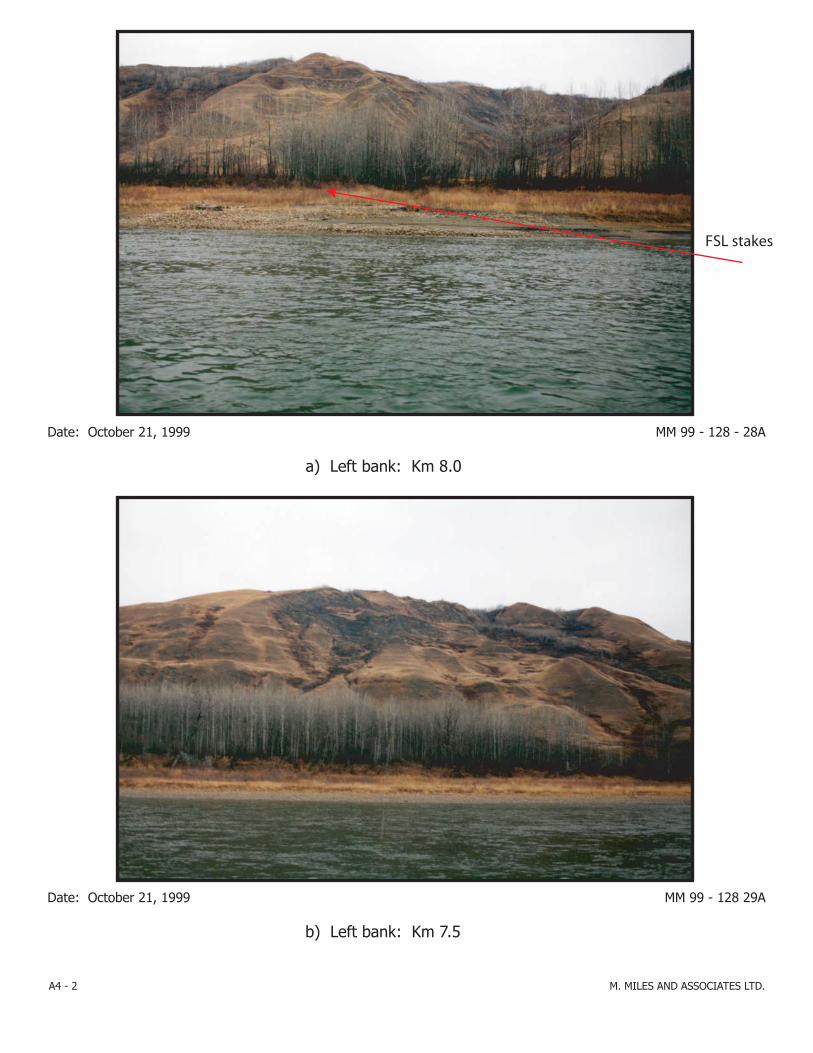
Date: October 21, 1999 MM 99 - 128 - 28A
a) Left bank: Km 8.0
Date: October 21, 1999 MM 99 - 128 29A
b) Left bank: Km 7.5
A4 - 2 M. MILES AND ASSOCIATES LTD.
FSL stakes

SEDIMENT TRANSPORT AND CHANNEL MORPHOLOGY STUDY UPDATE:PROPOSED PEACE RIVER AT DUNVEGAN HYDROELECTRIC PROJECT
M. MILES AND ASSOCIATES LTD.
APPENDIX 5
EXAMPLES OF SHORELINE SEGMENTSCONSISTING OF FLUVIAL ISLANDS
OR BARS OF RECENT ORIGIN

Date: October 21, 1999 MM 99 - 129 - 16A
a) Km 24.7
Date: October 21, 1999 MM 99 - 130 - 20
b) Baron Island: Km 18.5
A5 - 1 M. MILES AND ASSOCIATES LTD.
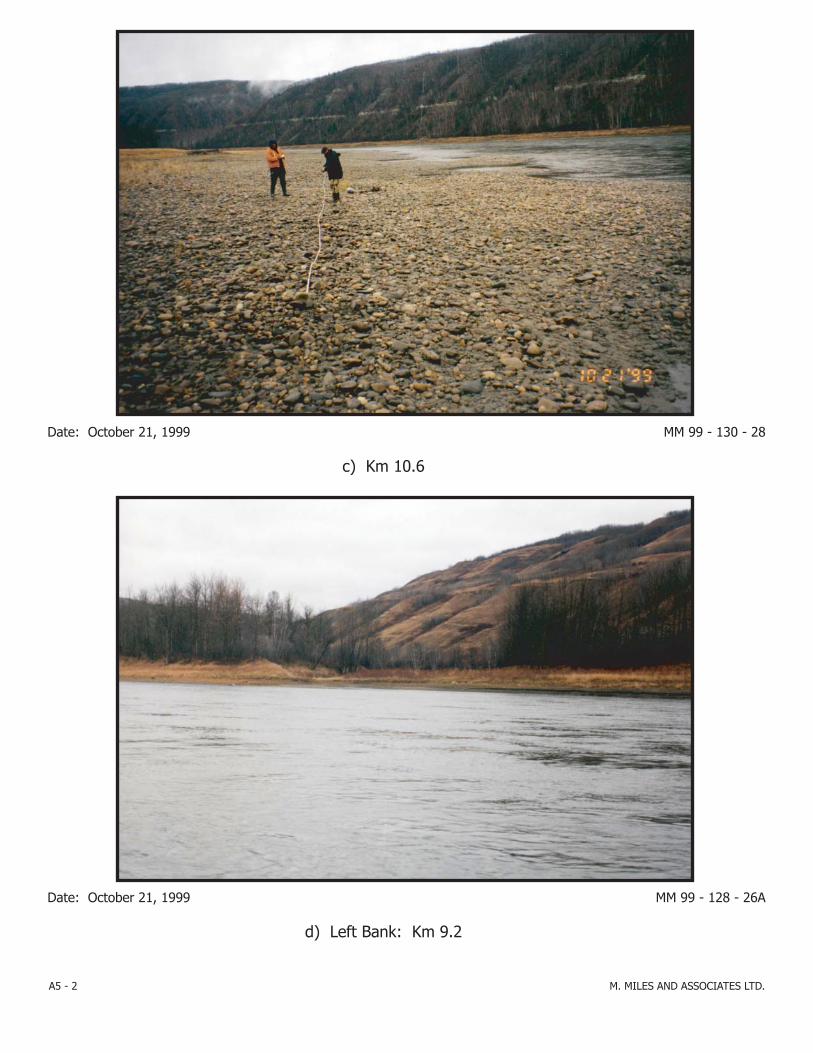
Date: October 21, 1999 MM 99 - 130 - 28
c) Km 10.6
Date: October 21, 1999 MM 99 - 128 - 26A
d) Left Bank: Km 9.2
A5 - 2 M. MILES AND ASSOCIATES LTD.

Date: October 21, 1999 MM 99 - 131 - 01
e) Km 9.1
A5 - 3 M. MILES AND ASSOCIATES LTD.

Date: October 21, 1999 MM 99 - 131 - 15/21
f) Left Bank: Km 9.1
A5 - 4 M. MILES AND ASSOCIATES LTD.
Note: FSL stakes

Date: October 21, 1999 MM 99 - 132 - 02
g) Km 6.5
A5 - 5 M. MILES AND ASSOCIATES LTD.

SEDIMENT TRANSPORT AND CHANNEL MORPHOLOGY STUDY UPDATE:PROPOSED PEACE RIVER AT DUNVEGAN HYDROELECTRIC PROJECT
M. MILES AND ASSOCIATES LTD.
APPENDIX 6
EXAMPLES OF SHORELINE SEGMENTSCONSISTING OF FLUVIAL FANS

Date: October 21, 1999 MM 99 - 129 - 12A
b) Fourth Creek: Km 24.9
Date: October 21, 1999 MM 99 - 129 - 8A
a) Fourth Creek: Km 26.5
A6 - 1 M. MILES AND ASSOCIATES LTD.

Date: October 21, 1999 MM 99 - 130 - 02
c) Hamelin Creek: Km 22.1
Date: October 21, 1999 MM 99 - 129 - 23A
d) Hamelin Creek: Km 22.0
A6 - 2 M. MILES AND ASSOCIATES LTD.

Date: October 21, 1999 MM 99 - 132 - 17
e) Ksituan River: Km 2.2
A6 - 3 M. MILES AND ASSOCIATES LTD.
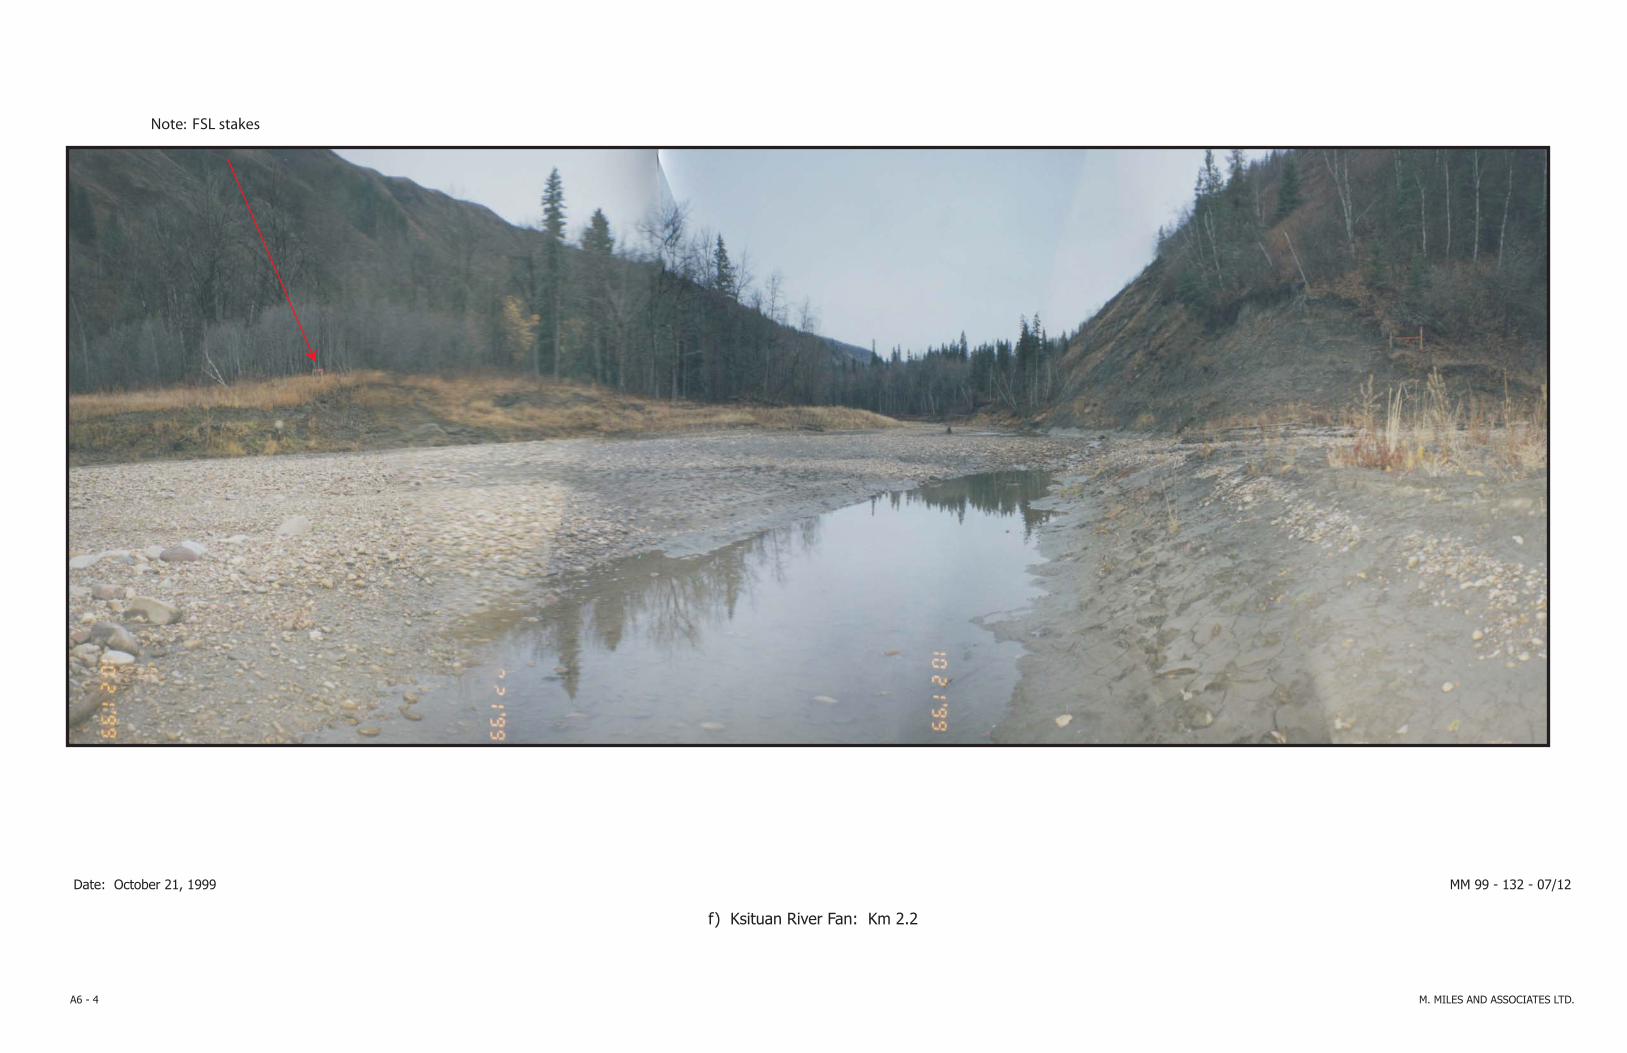
Date: October 21, 1999 MM 99 - 132 - 07/12
f) Ksituan River Fan: Km 2.2
A6 - 4 M. MILES AND ASSOCIATES LTD.
Note: FSL stakes

SEDIMENT TRANSPORT AND CHANNEL MORPHOLOGY STUDY UPDATE:PROPOSED PEACE RIVER AT DUNVEGAN HYDROELECTRIC PROJECT
M. MILES AND ASSOCIATES LTD.
APPENDIX 7
SHORELINE MATERIAL MAPPING
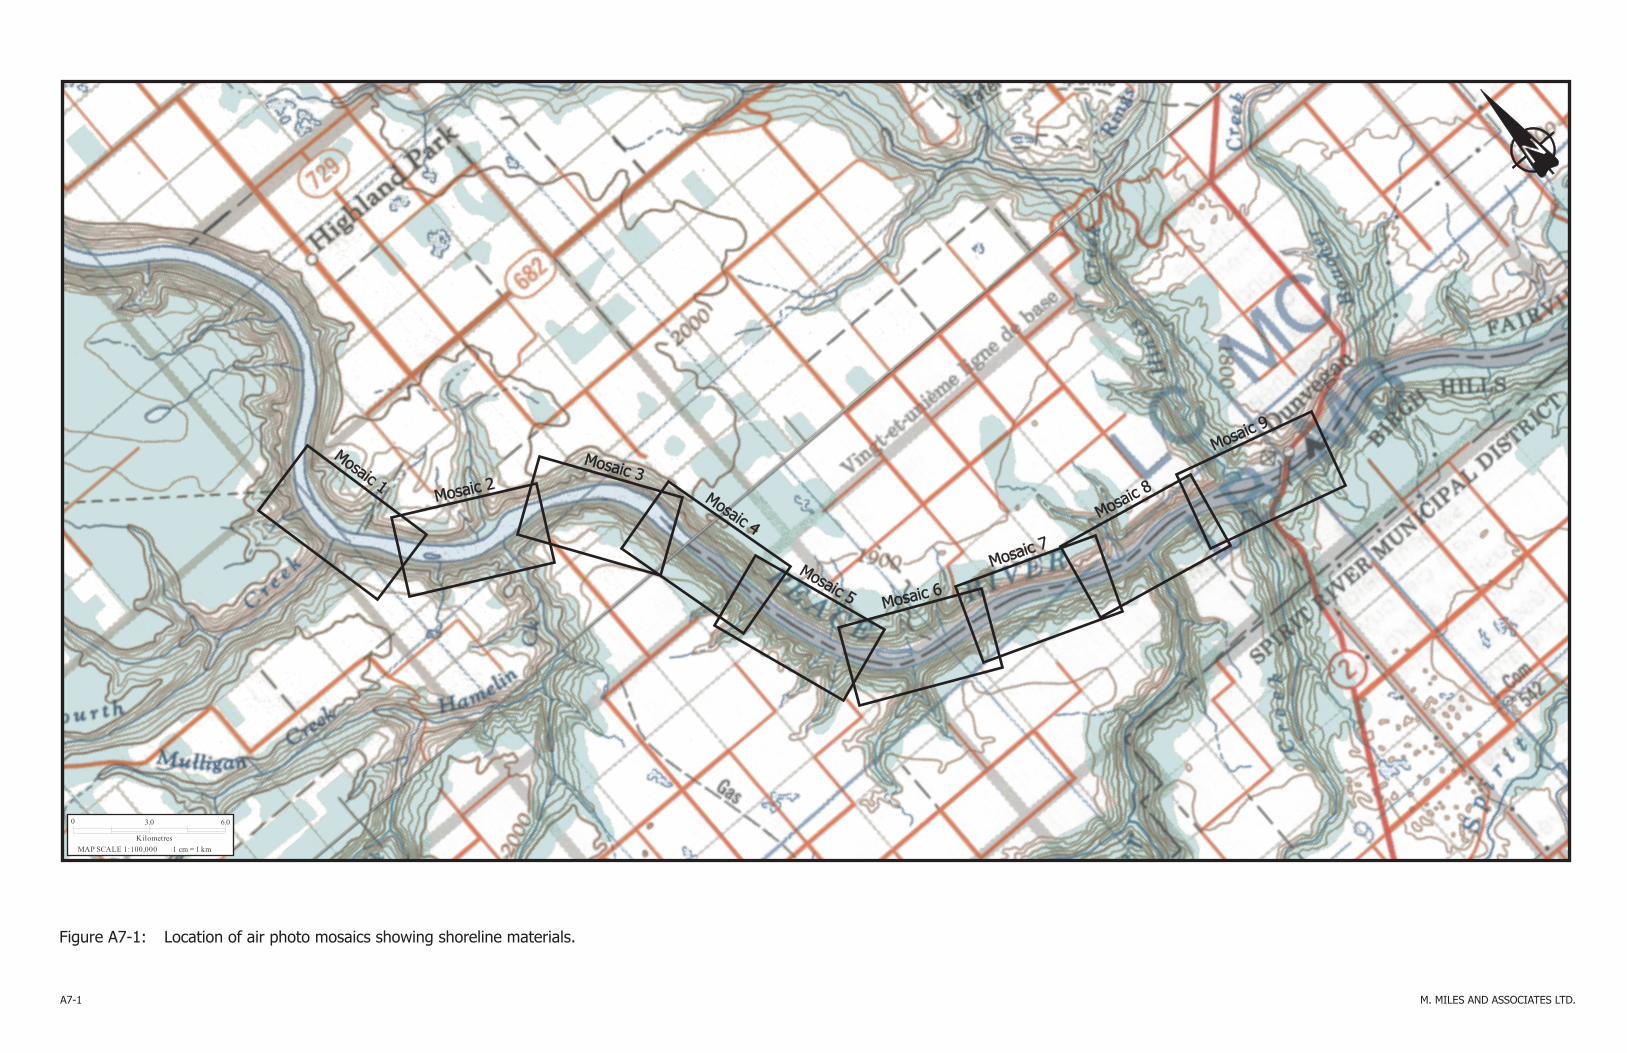
Figure A7-1: Location of air photo mosaics showing shoreline materials.
A7-1 M. MILES AND ASSOCIATES LTD.
0 3.0 6.0
KilometresMAP SCALE 1:100,000 1 cm = 1 km
Mosaic 1
Mosaic 1Mosaic 2Mosaic 2
Mosaic 3Mosaic 3
Mosaic 4
Mosaic 4
Mosaic 5
Mosaic 5 Mosaic 6Mosaic 6
Mosaic 7Mosaic 7
Mosaic 8
Mosaic 8
Mosaic 9Mosaic 9

DUNVEGAN HYDROELECTRIC PROJECT
SHORELINE MATERIAL MAPPING
FIGURE A7-2PROJECT NO 136
Km NO 28 to 25
REV:
A
M. MILES AND ASSOCIATES LTD.645 ISLAND ROAD, VICTORIA, BC, V8S 2T7
Phone: 250-595-0653 Fax: 250-595-7367 email: [email protected]
CLIENT:GLACIER POWER LTD.
500, 1324 - 17th AVENUE, SWCALGARY, AB T2T 5S8
APPROXIMATE SCALE: 1:10,000
DATE: January 4, 2006
DRAWN: S. Allegretto
DESIGNED: S. Allegretto
CHECKED: M. Miles
APPROVED:
REFERENCED DRAWING DESCRIPTIONREFERENCED DRAWING NO.
A4314 #168
Issued for discussionJan. 4, 2006A
A7-2
August 17, 1992 Air Photo
Kilometers upstream ofKilometers upstream ofproposed headworksproposed headworks
Fourth CreekFourth Creek
2828
2727
2626
2525
Fluvial terraceFluvial island or vegetated bar of recent origin
Colluvial veneer over rockColluvial fan or colluvial apronFluvial fan
100 50 0 100 200 300 400Metres
MAP SCALE 1:10,000 1 mm = 10 m
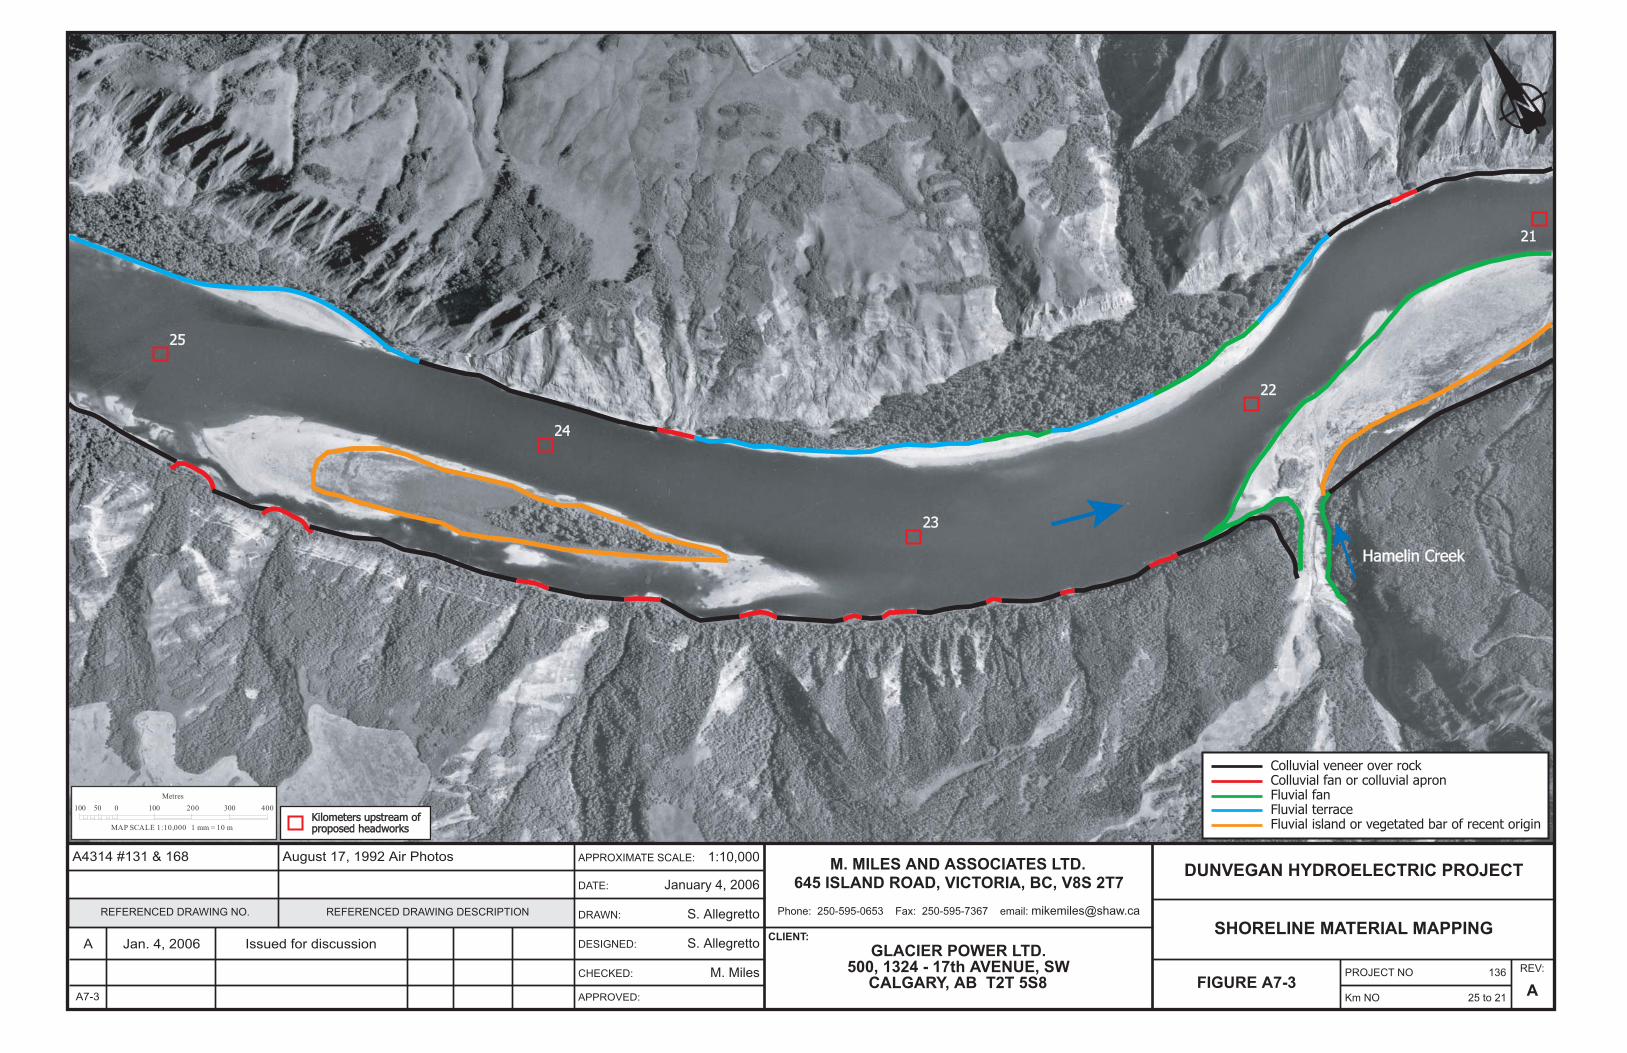
DUNVEGAN HYDROELECTRIC PROJECT
SHORELINE MATERIAL MAPPING
FIGURE A7-3PROJECT NO 136
Km NO 25 to 21
REV:
A
M. MILES AND ASSOCIATES LTD.645 ISLAND ROAD, VICTORIA, BC, V8S 2T7
Phone: 250-595-0653 Fax: 250-595-7367 email: [email protected]
CLIENT:GLACIER POWER LTD.
500, 1324 - 17th AVENUE, SWCALGARY, AB T2T 5S8
APPROXIMATE SCALE: 1:10,000
DATE: January 4, 2006
DRAWN: S. Allegretto
DESIGNED: S. Allegretto
CHECKED: M. Miles
APPROVED:
REFERENCED DRAWING DESCRIPTIONREFERENCED DRAWING NO.
A4314 #131 & 168
Issued for discussionJan. 4, 2006A
A7-3
August 17, 1992 Air Photos
Kilometers upstream ofKilometers upstream ofproposed headworksproposed headworks
Hamelin CreekHamelin Creek
2525
2424
2222
2323
2121
Fluvial terraceFluvial island or vegetated bar of recent origin
Colluvial veneer over rockColluvial fan or colluvial apronFluvial fan
100 50 0 100 200 300 400Metres
MAP SCALE 1:10,000 1 mm = 10 m
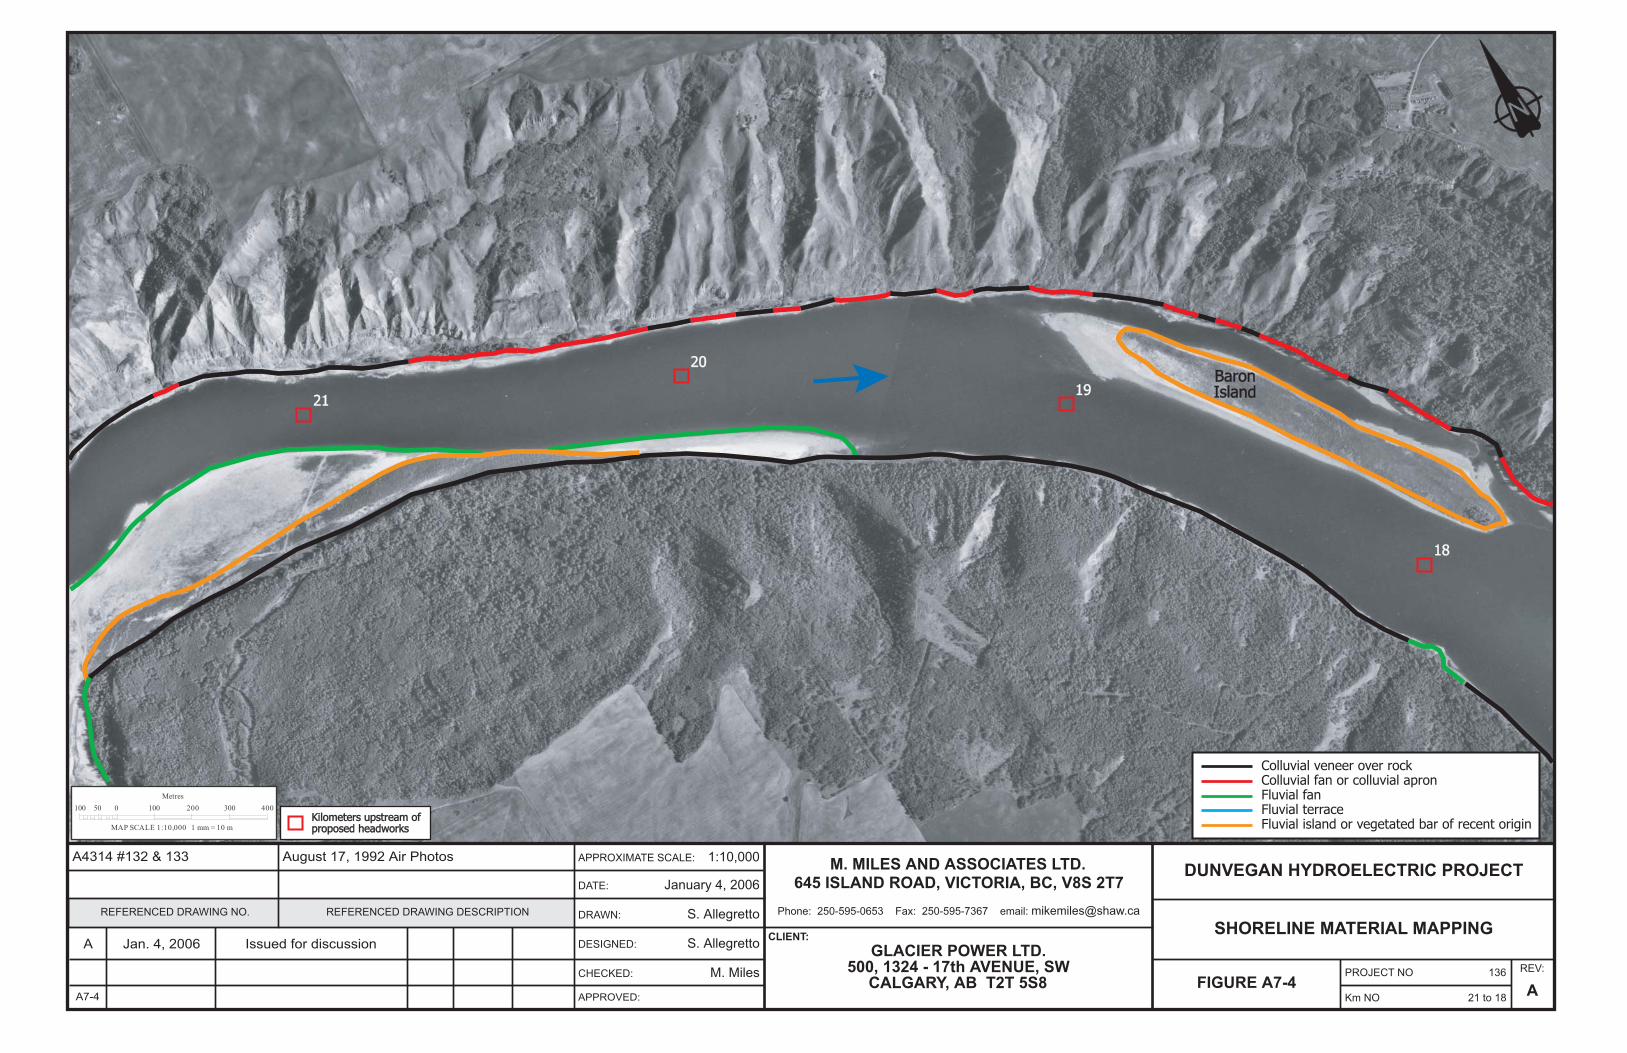
DUNVEGAN HYDROELECTRIC PROJECT
SHORELINE MATERIAL MAPPING
FIGURE A7-4PROJECT NO 136
Km NO 21 to 18
REV:
A
M. MILES AND ASSOCIATES LTD.645 ISLAND ROAD, VICTORIA, BC, V8S 2T7
Phone: 250-595-0653 Fax: 250-595-7367 email: [email protected]
CLIENT:GLACIER POWER LTD.
500, 1324 - 17th AVENUE, SWCALGARY, AB T2T 5S8
APPROXIMATE SCALE: 1:10,000
DATE: January 4, 2006
DRAWN: S. Allegretto
DESIGNED: S. Allegretto
CHECKED: M. Miles
APPROVED:
REFERENCED DRAWING DESCRIPTIONREFERENCED DRAWING NO.
A4314 #132 & 133
Issued for discussionJan. 4, 2006A
A7-4
August 17, 1992 Air Photos
Kilometers upstream ofKilometers upstream ofproposed headworksproposed headworks
2121
2020
1919
1818
BaronBaronIslandIsland
Fluvial terraceFluvial island or vegetated bar of recent origin
Colluvial veneer over rockColluvial fan or colluvial apronFluvial fan
100 50 0 100 200 300 400Metres
MAP SCALE 1:10,000 1 mm = 10 m

DUNVEGAN HYDROELECTRIC PROJECT
SHORELINE MATERIAL MAPPING
FIGURE A7-5PROJECT NO 136
Km NO 18 to 15
REV:
A
M. MILES AND ASSOCIATES LTD.645 ISLAND ROAD, VICTORIA, BC, V8S 2T7
Phone: 250-595-0653 Fax: 250-595-7367 email: [email protected]
CLIENT:GLACIER POWER LTD.
500, 1324 - 17th AVENUE, SWCALGARY, AB T2T 5S8
APPROXIMATE SCALE: 1:10,000
DATE: January 4, 2006
DRAWN: S. Allegretto
DESIGNED: S. Allegretto
CHECKED: M. Miles
APPROVED:
REFERENCED DRAWING DESCRIPTIONREFERENCED DRAWING NO.
A4314 #168
Issued for discussionJan. 4, 2006A
A7-5
August 17, 1992 Air Photo
Kilometers upstream ofKilometers upstream ofproposed headworksproposed headworks
18181717
1616
1515
Fluvial terraceFluvial island or vegetated bar of recent origin
Colluvial veneer over rockColluvial fan or colluvial apronFluvial fan
100 50 0 100 200 300 400Metres
MAP SCALE 1:10,000 1 mm = 10 m

DUNVEGAN HYDROELECTRIC PROJECT
SHORELINE MATERIAL MAPPING
FIGURE A7-6PROJECT NO 136
Km NO 15 to 12
REV:
A
M. MILES AND ASSOCIATES LTD.645 ISLAND ROAD, VICTORIA, BC, V8S 2T7
Phone: 250-595-0653 Fax: 250-595-7367 email: [email protected]
CLIENT:GLACIER POWER LTD.
500, 1324 - 17th AVENUE, SWCALGARY, AB T2T 5S8
APPROXIMATE SCALE: 1:10,000
DATE: January 4, 2006
DRAWN: S. Allegretto
DESIGNED: S. Allegretto
CHECKED: M. Miles
APPROVED:
REFERENCED DRAWING DESCRIPTIONREFERENCED DRAWING NO.
A4314 #168
Issued for discussionJan. 4, 2006A
A7-6
August 17, 1992 Air Photo
Kilometers upstream ofKilometers upstream ofproposed headworksproposed headworks
14141313
12121515
Fluvial terraceFluvial island or vegetated bar of recent origin
Colluvial veneer over rockColluvial fan or colluvial apronFluvial fan
100 50 0 100 200 300 400Metres
MAP SCALE 1:10,000 1 mm = 10 m

DUNVEGAN HYDROELECTRIC PROJECT
SHORELINE MATERIAL MAPPING
FIGURE A7-7PROJECT NO 136
Km NO 28 to 25
REV:
A
M. MILES AND ASSOCIATES LTD.645 ISLAND ROAD, VICTORIA, BC, V8S 2T7
Phone: 250-595-0653 Fax: 250-595-7367 email: [email protected]
CLIENT:GLACIER POWER LTD.
500, 1324 - 17th AVENUE, SWCALGARY, AB T2T 5S8
APPROXIMATE SCALE: 1:10,000
DATE: January 4, 2006
DRAWN: S. Allegretto
DESIGNED: S. Allegretto
CHECKED: M. Miles
APPROVED:
REFERENCED DRAWING DESCRIPTIONREFERENCED DRAWING NO.
A4314 #30, 31 & 63
Issued for discussionJan. 4, 2006A
A7-7
August 17, 1992 Air Photos
Kilometers upstream ofKilometers upstream ofproposed headworksproposed headworks
1111
10109
8
Fluvial terraceFluvial island or vegetated bar of recent origin
Colluvial veneer over rockColluvial fan or colluvial apronFluvial fan
100 50 0 100 200 300 400Metres
MAP SCALE 1:10,000 1 mm = 10 m
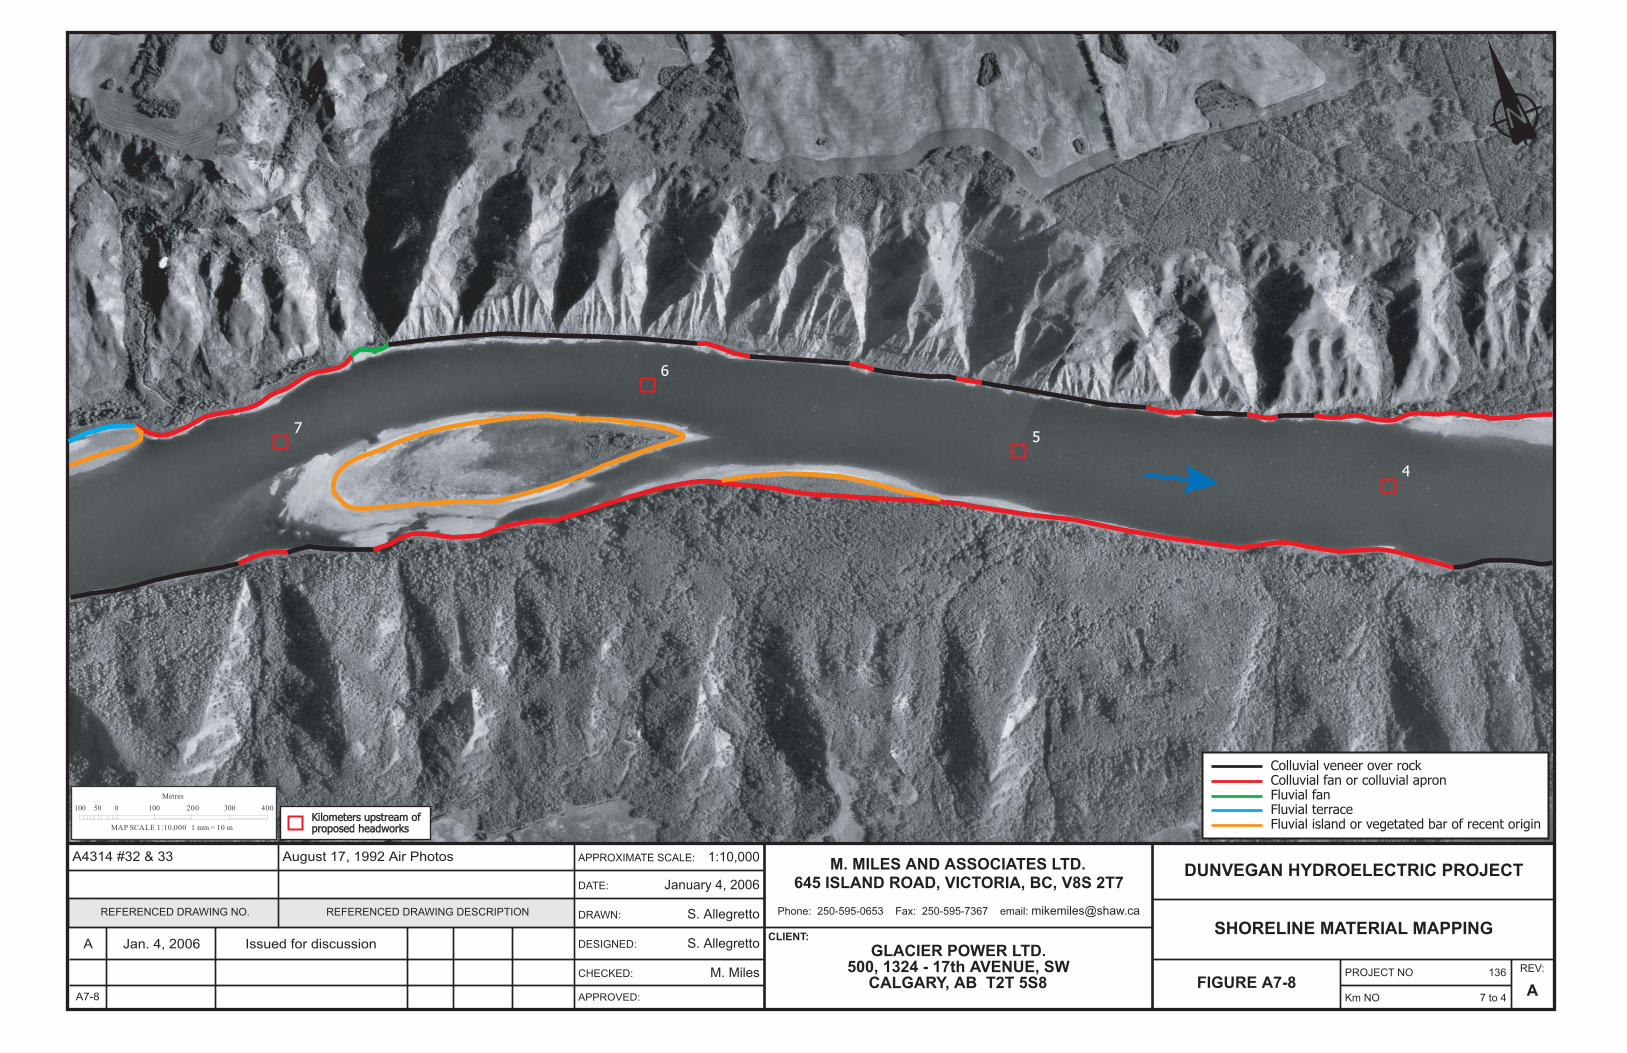
DUNVEGAN HYDROELECTRIC PROJECT
SHORELINE MATERIAL MAPPING
FIGURE A7-8PROJECT NO 136
Km NO 7 to 4
REV:
A
M. MILES AND ASSOCIATES LTD.645 ISLAND ROAD, VICTORIA, BC, V8S 2T7
Phone: 250-595-0653 Fax: 250-595-7367 email: [email protected]
CLIENT:GLACIER POWER LTD.
500, 1324 - 17th AVENUE, SWCALGARY, AB T2T 5S8
APPROXIMATE SCALE: 1:10,000
DATE: January 4, 2006
DRAWN: S. Allegretto
DESIGNED: S. Allegretto
CHECKED: M. Miles
APPROVED:
REFERENCED DRAWING DESCRIPTIONREFERENCED DRAWING NO.
A4314 #32 & 33
Issued for discussionJan. 4, 2006A
A7-8
August 17, 1992 Air Photos
Kilometers upstream ofKilometers upstream ofproposed headworksproposed headworks
7
6
5
4
Fluvial terraceFluvial island or vegetated bar of recent origin
Colluvial veneer over rockColluvial fan or colluvial apronFluvial fan
100 50 0 100 200 300 400Metres
MAP SCALE 1:10,000 1 mm = 10 m

DUNVEGAN HYDROELECTRIC PROJECT
SHORELINE MATERIAL MAPPING
FIGURE A7-9PROJECT NO 136
Km NO 4 to 1
REV:
A
M. MILES AND ASSOCIATES LTD.645 ISLAND ROAD, VICTORIA, BC, V8S 2T7
Phone: 250-595-0653 Fax: 250-595-7367 email: [email protected]
CLIENT:GLACIER POWER LTD.
500, 1324 - 17th AVENUE, SWCALGARY, AB T2T 5S8
APPROXIMATE SCALE: 1:10,000
DATE: January 4, 2006
DRAWN: S. Allegretto
DESIGNED: S. Allegretto
CHECKED: M. Miles
APPROVED:
REFERENCED DRAWING DESCRIPTIONREFERENCED DRAWING NO.
A4314 #2, 3, 33 & 34
Issued for discussionJan. 4, 2006A
A7-9
August 17, 1992 Air Photos
Kilometers upstream ofKilometers upstream ofproposed headworksproposed headworks
4
3
21
Fluvial terraceFluvial island or vegetated bar of recent origin
Colluvial veneer over rockColluvial fan or colluvial apronFluvial fan
KsituanKsituanRiverRiver
100 50 0 100 200 300 400Metres
MAP SCALE 1:10,000 1 mm = 10 m

DUNVEGAN HYDROELECTRIC PROJECT
SHORELINE MATERIAL MAPPING
FIGURE A7-10PROJECT NO 136
Km NO 0 to -3
REV:
A
M. MILES AND ASSOCIATES LTD.645 ISLAND ROAD, VICTORIA, BC, V8S 2T7
Phone: 250-595-0653 Fax: 250-595-7367 email: [email protected]
CLIENT:GLACIER POWER LTD.
500, 1324 - 17th AVENUE, SWCALGARY, AB T2T 5S8
APPROXIMATE SCALE: 1:10,000
DATE: January 4, 2006
DRAWN: S. Allegretto
DESIGNED: S. Allegretto
CHECKED: M. Miles
APPROVED:
REFERENCED DRAWING DESCRIPTIONREFERENCED DRAWING NO.
A4314 #4, 35 & 36
Issued for discussionJan. 4, 2006A
A7-10
August 17, 1992 Air Photos
Kilometers upstream ofKilometers upstream ofproposed headworksproposed headworks
Fluvial terraceFluvial island or vegetated bar of recent origin
Colluvial veneer over rockColluvial fan or colluvial apronFluvial fan
DunveganDunveganCreekCreek
HinesHinesCreekCreek
0
-1-1
-2-2
-3-3
100 50 0 100 200 300 400Metres
MAP SCALE 1:10,000 1 mm = 10 m