Sediment Site Prioritization
29
FINAL DRAFT KING COUNTY DEPARTMENT OF NATURAL RESOURCES YEAR 2000 CSO PLAN UPDATE PROJECT SEDIMENT MANAGEMENT PLAN Sediment Site Prioritization Task 1100 Technical Memorandum BROWN AND CALDWELL AND ASSOCIATED FIRMS ADOLFSON ASSOCIATES, INC. ANCHOR ENVIRONMENTAL, INC. HDR, INC. HERRERA ENVIRONMENTAL CONSULTANTS KCM, INC. NORTON-ARNOLD & JANEWAY Prepared by: ANCHOR ENVIRONMENTAL, INC. January 1999
Transcript of Sediment Site Prioritization
FINAL DRAFT
KING COUNTY DEPARTMENT OF NATURAL RESOURCESYEAR 2000 CSO PLAN UPDATE PROJECT
SEDIMENT MANAGEMENT PLAN
Sediment Site Prioritization
Task 1100 Technical Memorandum
BROWN AND CALDWELLAND ASSOCIATED FIRMS
ADOLFSON ASSOCIATES, INC.ANCHOR ENVIRONMENTAL, INC.HDR, INC.HERRERA ENVIRONMENTAL CONSULTANTSKCM, INC.NORTON-ARNOLD & JANEWAY
Prepared by:ANCHOR ENVIRONMENTAL, INC.
January 1999
FINAL DRAFT
Sediment Site Prioritization Technical Memorandum
Page i
CONTENTS
Executive Summary ............................................................................................................ i
Introduction ......................................................................................................................... 1
SEDRANK – Ecology’s Site Ranking Method (1990)....................................................... 2
SEDRANK Input Parameters.............................................................................................. 3Maximum Concentration of Individual Contaminants............................................ 3Area of Contaminated Sediments............................................................................ 3Historical Versus Ongoing Sources ........................................................................ 4Net Sedimentation Rates ......................................................................................... 4Water Depth Of Contaminated Sediments .............................................................. 4Habitat Complexity ................................................................................................. 4Proximity To Special Marine Habitats, Wildlife Refuges, and Fisheries ............... 4
SEDRANK Scoring............................................................................................................. 5
Elliott Bay/Duwamish Restoration Program (1994) ........................................................... 7
Bellingham Bay Pilot Project (1998) ................................................................................ 10
Bellingham Bay Work Group Goals and Evaluation Criteria........................................... 12Development of Bellingham Bay Work Group Goals .......................................... 12
Goal 1 - Human Health and Safety ........................................................... 12Goal 2 - Ecological Health ........................................................................ 13Goal 3 - Protect and Restore Ecosystems.................................................. 13Goal 4 - Social and Cultural Uses ............................................................. 13Goal 5 - Resource Management ................................................................ 14Goal 6 - Faster, Better, Cheaper................................................................ 14Goal 7 - Economic Vitality ....................................................................... 14
Ranking of Prospective Cleanup Sites .............................................................................. 16SEDRANK Scoring Guidelines and Assumptions – Primary Goals 1 through 4. 16Scoring Guidelines and Assumptions – Secondary Goals 5 through 7................. 16
Recommended King County SMP Site Prioritization....................................................... 17
SEDRANK Scoring Guidelines and Assumptions – Primary Criteria ............................. 19SEDRANK Model Modifications ......................................................................... 19
Maximum Concentration Of Individual Contaminants............................. 19Area Of Contaminated Sediments............................................................. 19Source Control........................................................................................... 20Water Depth Of Contaminated Sediments ................................................ 21
Scoring Guidelines and Assumptions – Secondary Criteria ................................. 21
FINAL DRAFT
Sediment Site Prioritization Technical Memorandum
Page i
EXECUTIVE SUMMARY
This technical memorandum presents prioritization criteria for consideration. Sedimentsite prioritization models that have been used in similar regional programs have beenreviewed and evaluated. These programs include the State of Washington SedimentManagement Standards (SMS), the Elliott Bay/Duwamish Restoration Program(EBDRP), and Bellingham Bay Demonstration Pilot Project.
The Washington State Department of Ecology’s (Ecology’s) SMS model incorporates thegeneral ecological and human health risk reduction objectives of sediment cleanup.These objectives were transformed by Ecology into a set of detailed scoring guidelines,which in turn were incorporated into a spreadsheet-based scoring model designated as theSediment Ranking System (SEDRANK).
The EBDRP developed a structured project identification and screening process for theprioritization of sediment remediation projects, similar in some respects to theSEDRANK criteria, but relying to a greater degree on various site-specific “statements”that could be evaluated qualitatively. The statement-based criteria included:
� Contaminated sediment present (high toxicity).
� Control of combined sewer overflows, storm drains, industrial input andrecontamination from adjacent sediment.
� Potential for addressing injury to target species/fish.
� Potential to incorporate extra habitat improvement or proximity to other habitatprojects or sediment remediation sites.
� Potential for human health risk.
� Potential for public education.
� Coordination with other projects.
Pilot Project sediment prioritization was performed using a consistent application of thebaywide goals that reflected the collective interests and desired outcomes of the Pilotactions. The Pilot goals were applied to a range of project elements (i.e., source controland sediment cleanup, sediment disposal, habitat restoration, and aquatic land use) andwere designed to represent key regulatory and policy issues and concerns. Thesestatements are listed in logical goal groupings as follows:
� Goal 1 - Human Health and Safety
� Goal 2 - Ecological Health
FINAL DRAFT
Sediment Site Prioritization Technical Memorandum
Page ii
� Goal 3 - Protect and Restore Ecosystems
� Goal 4 - Social and Cultural Uses
� Goal 5 - Resource Management
� Goal 6 - Faster, Better, Cheaper
� Goal 7 - Economic Vitality
Based largely on the successful Bellingham Pilot model, a recommended prioritizationmodel is presented. This model consists of the SEDRANK scoring model modified in amanner similar to the Bellingham Pilot model to include relevance to local conditions inKing County. The information contained within this document will be used to developpreliminary (programmatic) cleanup priorities at seven identified King County CSOsediment cleanup sites
FINAL DRAFT
Sediment Site Prioritization Technical Memorandum
Page 1
INTRODUCTION
King County recently contracted with Brown & Caldwell and it's subconsultants (HerreraEnvironmental Consultants and Anchor Environmental) to develop a SedimentManagement Plan (SMP) for King County’s Combined Sewer Overflow (CSO) Program.One of the initial tasks (Task 1100) of this effort is to develop a list of criteria for use inprioritizing sediment remediation sites, along with a decision-making process for theSMP. Relevant criteria may include public health and environmental impacts,cost/benefit, cost effectiveness, opportunities for coincident benefits, potential for sourcetrading, and “window of opportunity” issues. The decision-making process addresses thetypes of decisions that need to be made, responsible party for making decisions, andissues to be considered in decision-making. This technical memorandum presentsprioritization criteria for consideration, to support development of preliminary(programmatic) cleanup priorities at seven identified King County CSO sediment cleanupsites.
FINAL DRAFT
Sediment Site Prioritization Technical Memorandum
Page 2
SEDRANK – ECOLOGY’S SITERANKING METHOD (1990)
As set forth in the SMS regulation, Ecology has developed a methodology to identify andprioritize agency resources to implement the SMS. The general ecological and humanhealth risk reduction objectives of sediment cleanup, as defined by the SMS, weretransformed by Ecology into a set of detailed scoring guidelines, which in turn wereincorporated into a spreadsheet-based scoring model denoted the Sediment RankingSystem (SEDRANK), January, 1990. The SEDRANK model integrates availableinformation on toxicity potential, extent, natural recovery potential, habitat attributes,fisheries utilization, and other factors to derive a total score for each prospective sedimentcleanup site. Use of the SEDRANK model has been incorporated into the SMSregulation (Chapter 173-204-540 WAC).
FINAL DRAFT
Sediment Site Prioritization Technical Memorandum
Page 3
SEDRANK INPUTPARAMETERS
Inputs to the SEDRANK model include the following:
� Maximum concentration of individual contaminants;
� Area of contaminated sediments;
� Historical versus ongoing sources;
� Net sedimentation rate;
� Water depth of contaminated sediments;
� Habitat complexity;
� Proximity to special marine habitats and wildlife refuges;
� Proximity to tribal and other commercial fisheries; and
� Proximity to recreational fisheries and public access.
Each of these factors is discussed individually in the sections below.
Maximum Concentration of Individual Contaminants
The SEDRANK model uses as input the maximum concentration of individual analytesdetected at a site, and then compares the maximum values with ecological and humanhealth benchmarks derived from relevant toxicity criteria. The degree of exceedance ofthe Sediment Quality Standard (SQS) chemical criteria is used in the SEDRANK modelas a measure of relative ecological risk. The concentration data are also used in ascreening-level human health risk assessment.
Area of Contaminated Sediments
The SEDRANK model differentiated the areal extent of sediment contamination intohigh, medium, and low categories, with the cutoffs for such ranking occurring at intervalsof 400 and 200 acres, respectively. Typically, most SMS sites fall within the “low”category of less than 200 acres.
FINAL DRAFT
Sediment Site Prioritization Technical Memorandum
Page 4
Historical Versus Ongoing Sources
For the purpose of natural recovery estimates, the SEDRANK model differentiatesbetween sites affected by ongoing inputs versus sites affected solely by historicalreleases. Best professional judgement is commonly used in this determination.
Net Sedimentation Rates
In addition to source control (and chemical-specific degradation rates coded into themodel), the other parameter that determines natural sediment recovery in the SEDRANKmodel is the net sedimentation rate, which is a measure of the long-term burial rate ofcontaminated sediments beneath cleaner, more recent sediment materials. Netsedimentation rate estimates are typically based on 210Pb and 137Cs core profiles, and/or netchanges in the mudline elevation over time, as determined from a comparison of channelcondition surveys.
Water Depth Of Contaminated Sediments
In consideration of the well documented preference for many fish and shellfish species toutilize shallow water habitats over deeper zones, the SEDRANK model assigns a higherscore to those sediment sites that are located within relatively shallow water.
Habitat Complexity
In developing the ecological risk score, the SEDRANK model utilizes information on siterelief or the areal extent of habitat enhancing materials such as eelgrass, shell hash, orother similar enhancements within the contamination area.
Proximity To Special Marine Habitats, Wildlife Refuges, andFisheries
The final set of parameters used in the SEDRANK model refers to the location of the sedimentsite relative to important ecological and human health exposure areas, including specialmarine habitats, tribal fisheries, and public access points.
FINAL DRAFT
Sediment Site Prioritization Technical Memorandum
Page 5
SEDRANK SCORING
Using the input data described above, the SEDRANK model calculates an overallecological and human health score. However, to date Ecology has only published theresults of the ecological scoring, though the SEDRANK algorithm includes bothelements.
Both the ecological and human health scores are based on Ecology’s professionaljudgement, transformed into a set of detailed scoring algorithms that are integrated intothe following equation:
Overall Score = Waste Characteristics Score x (Site Score + Affected Resources Score)
where:
Waste Characteristics Score = Area Score x Overall Chemical Toxicity Score/3
(using different chemical-specific toxicity scores for ecological and humanhealth);
Site Score = Natural Recovery Factor x Habitat Quality Score; and
Affected Resources Score = Habitat Score + Sanctuary Score (ecological) or
(5/8) x Commercial Fisheries Score + Recreational Fisheries Score (humanhealth)
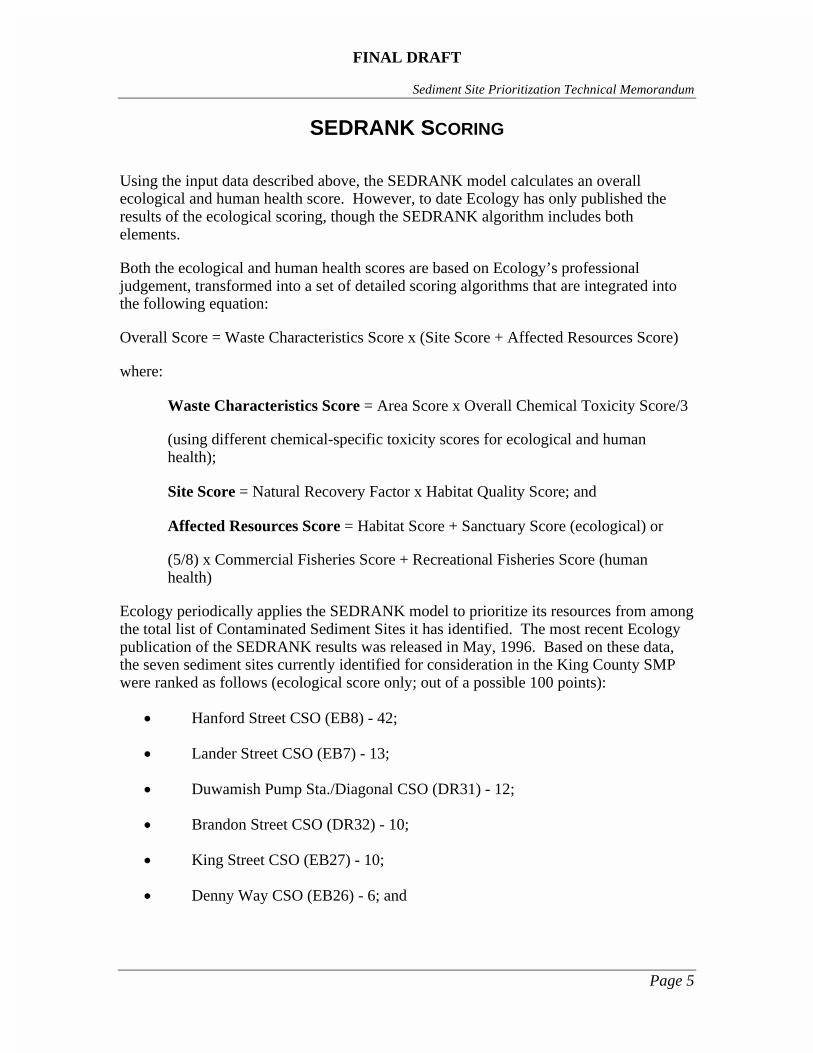
Ecology periodically applies the SEDRANK model to prioritize its resources from amongthe total list of Contaminated Sediment Sites it has identified. The most recent Ecologypublication of the SEDRANK results was released in May, 1996. Based on these data,the seven sediment sites currently identified for consideration in the King County SMPwere ranked as follows (ecological score only; out of a possible 100 points):
� Hanford Street CSO (EB8) - 42;
� Lander Street CSO (EB7) - 13;
� Duwamish Pump Sta./Diagonal CSO (DR31) - 12;
� Brandon Street CSO (DR32) - 10;
� King Street CSO (EB27) - 10;
� Denny Way CSO (EB26) - 6; and
FINAL DRAFT
Sediment Site Prioritization Technical Memorandum
Page 6
� Chelan Avenue CSO (EB13) – Not Scored [within general Superfund siteboundary]
(based on the relatively low exceedance of SQS criteria reported by Ecology within thevicinity of the Chelan Avenue CSO, the site would likely have a relatively low ecologicalscore if ranked using the SEDQUAL algorithm).
FINAL DRAFT
Sediment Site Prioritization Technical Memorandum
Page 7
ELLIOTT BAY/DUWAMISHRESTORATION PROGRAM
(1994)
The Elliott Bay/Duwamish Restoration Program (EBDRP), consisting of a panel ofcooperating governments, is responsible for implementing the requirements of a 1991Consent Decree addressing alleged natural resource damages within the ElliottBay/Duwamish area resulting from CSO and storm drain discharges. One of the initialtasks of the EBDRP Panel (Panel) was the development of a process to identify andevaluate potential sites for sediment remediation and habitat development projects. Aspresented in the June 1994 “Concept Document”, the identification of sedimentremediation project opportunities was carried out through a structured projectidentification and screening process for 24 sites in Elliott Bay and the lower DuwamishRiver. This process involved the following:
� Evaluation criteria that reflect the goals of the EBDRP;
� Weighting factors and scoring guidelines for each criterion;
� Prioritization between the various criteria;
� Identification of potential projects; and
� Evaluation of identified projects against the developed criteria.
The criteria selected by the Panel for the prioritization of sediment remediation projectswere similar in some respects to the SEDRANK criteria outlined above, but relied to agreater degree on various site-specific “statements” that could be evaluated qualitatively.The Panel’s statement-based criteria are described below, along with their associatedweighting (each criterion was assigned a numerical weight of 1 to 5, with 5 meaning“highest priority and 1 meaning “lowest priority”):
� Contaminated sediment present (high toxicity) – Sites with sedimentcontamination potentially related to resource injury AND greater than theSMS Cleanup Screening Level (CSL). Weighted score = 5;
� Control of combined sewer overflows, storm drains, industrial input andrecontamination from adjacent sediment is adequate – Sites adjacent tosources for which significant source control actions have been implemented orwill be implemented by the time the remediation project is initiated, and forwhich minimal input of toxic contaminants is expected. Weighted score = 5;
� Potential for addressing injury to target species/fish – Sites with livingestuarine resources having measurable injuries. Weighted score = 3;
FINAL DRAFT
Sediment Site Prioritization Technical Memorandum
Page 8
� Potential to incorporate extra habitat improvement, or proximity to otherhabitat projects or sediment remediation sites – Sites adjacent to otherareas that have received or have the potential of receiving sedimentremediation or habitat restoration. Weighted score = 3;
� Potential for human health risk – Sites that have higher potential risks topublic health. Weighted score = 3;
� Potential for public education – Sites in areas with existing, or highpotential for, extensive public use and visibility. Weighted score = 3; and
� Coordination with other projects (for example, confined disposal ormaintenance dredging) – Sites involved in projects that obtain majoradvantages by coordinating with other projects. Weighted score = 3.
Additional criteria originally established but not included in the ranking were as follows:
� Proximity to City or King County CSO or storm drain;
� Site ownership (Type of ownership was not anticipated to influence aproject’s feasibility or ease of implementation);
� Cost-effectiveness (Cost-effectiveness could not be determined for projects atthe early stage of the process); and
� Opportunity (This criterion could not be determined at the early stage in theprocess. However, this criterion was used with several other factors in thefinal stage of project selection; see below).
The weighted criteria outlined above were used to score potential sediment remediationprojects identified by the Panel. Each project was assigned a score depending on howwell that project met the criterion as follows:
� Project received a high score of 3 if the match to a specific criterion was verygood;
� Project received a medium score of 2 if the match was medium; and
� Project received a low score of 1 if the match was poor.
The overall priority of the various projects was determined by multiplying the weighting of eachcriterion by the score assigned to each project for how well the project met the criterion. Theresulting numbers for the criteria were added together for each project to determine anoverall score. Based on these scores, the projects were divided into a high, medium and lowpriority group with approximately the same number of projects in each group:
FINAL DRAFT
Sediment Site Prioritization Technical Memorandum
Page 9
In order to complete the selection process, the Sediment Remediation Technical WorkingGroup of the Panel evaluated potential sites in the order they were ranked and consideredother factors that either supported or argued against proceeding with each project. Thesefactors included:
� Potential for recontamination from other sources;
� Source control schedule;
� Potential for the project to be implemented by different sponsors;
� Opportunity for partial funding by another party; and
� Availability of capping material and/or disposal sites.
Following final project selection, the Panel proceeded with more specific planning andimplementation. The Panel is currently in the process of developing and implementingdetailed cleanup plans at several sites within the Elliott Bay/Duwamish area.
FINAL DRAFT
Sediment Site Prioritization Technical Memorandum
Page 10
BELLINGHAM BAY PILOTPROJECT (1998)
Based on recent Puget Sound experiences, cleanup of contaminated sediments has provento be a difficult task, complicated by high costs, limited disposal site options, concernsabout environmental liability, source control issues, habitat alterations, and complexregulatory and land owner constraints. To address the need for sediment cleanup andovercome some of the existing roadblocks to expedited actions, in May 1994 a group offive federal and state agencies in Washington state formed the Cooperative SedimentManagement Program (CSMP) and signed an intergovernmental agreement. Theagencies that signed the CSMP Intergovernmental Agreement included:
� Washington State Department of Ecology (Ecology);
� Washington State Department of Natural Resources (DNR);
� U.S. Environmental Protection Agency, Region 10 (EPA);
� U.S. Army Corps of Engineers (Corps); and
� Puget Sound Water Quality Action Team.
The cooperating agencies, later including the Washington State Departments ofTransportation (WSDOT) and Fish and Wildlife (WDFW) decided to focus on a pilotdemonstration project in a selected embayment with the goal of overcoming roadblocksto expedited cleanup actions at that location. The agencies proposed to help fund aDemonstration Pilot Project (Pilot) to develop sediment cleanup and disposal, habitatrestoration, and source control priorities in an urban embayment of Puget Sound bycreating a partnership with local governments and businesses. The key goals of the Pilotwere to control sources of contamination, expedite cleanup of high priority sedimentsites, test various incentives for cleanup, and create new and flexible methods forachieving cleanup. The sponsoring agencies set aside a grant available to localgovernments under the Model Toxics Control Act (MTCA) to help fund the Pilot.
In June 1996, Bellingham Bay was selected as the location for the Pilot. Bellingham Baywas selected in part due to the responsiveness of a local group that had already initiatedcollaborative efforts. The local group included:
� Port of Bellingham (Port);
� City of Bellingham (City);
� Whatcom County Health Department; and
� Georgia-Pacific, West, Inc. (G-P).
FINAL DRAFT
Sediment Site Prioritization Technical Memorandum
Page 11
In September 1996, the Bellingham Bay Work Group (BBWG) was established to initiatethe Pilot. The BBWG “Pilot Team” included the sponsoring and cooperating state andfederal agencies, the four local proponents, the U.S. Fish & Wildlife Service, andrepresentatives of the Lummi Nation and Nooksack Tribe. The Pilot Team developedenvironmental, process, partnering, and policy objectives specific to the Pilot, whichwere intended to ensure achievement of the following overall mission statement:
“To use a new cooperative approach to expedite source control, sediment cleanupand associated habitat restoration in Bellingham Bay.”
The Pilot has four fundamental project elements, including:
� Sediment cleanup and source control;
� Sediment disposal;
� Habitat restoration; and
� Aquatic land use.
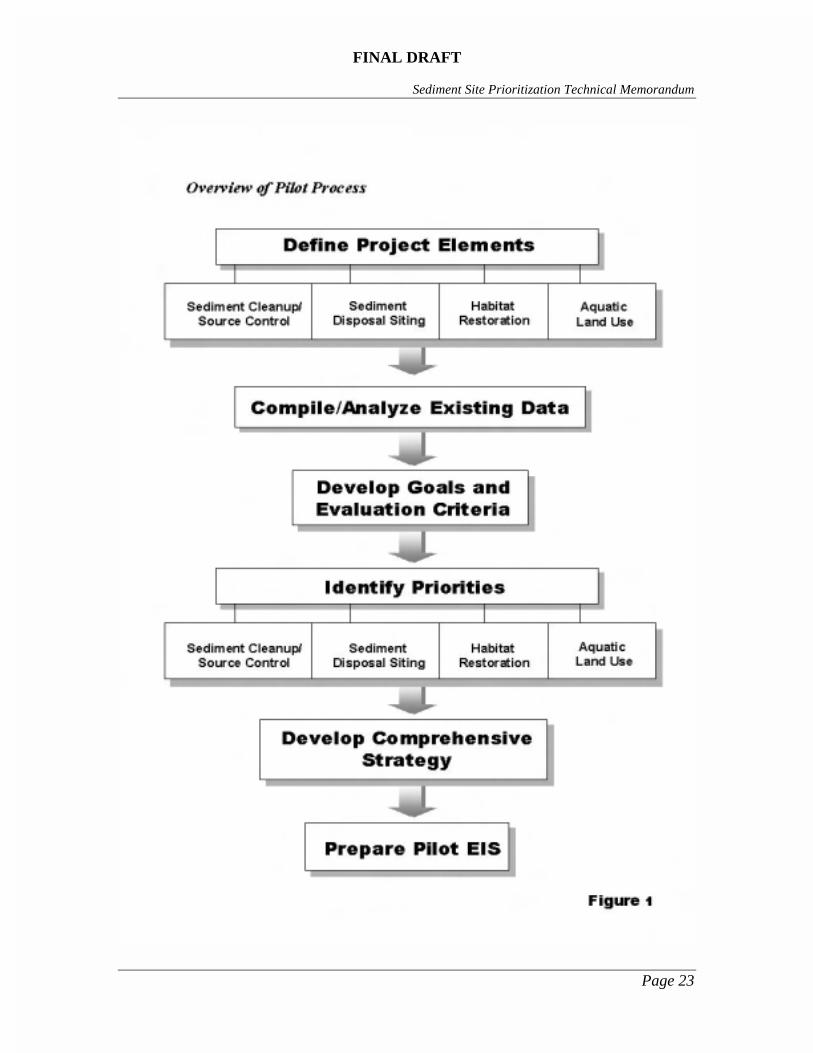
The Pilot was designed to expand opportunities for achieving multiple goals inBellingham Bay, through comprehensive strategic environmental planning and well-integrated projects that would encompass the four elements listed above. AComprehensive Strategy is currently being developed by the Pilot Team that integratessediment cleanup and source control with the other project elements. TheComprehensive Strategy will include near-term project alternatives that are priorityaction items from each of the elements, integrated together into near-term actions. Ageneralized flow chart depicting this process is presented in Figure 1.
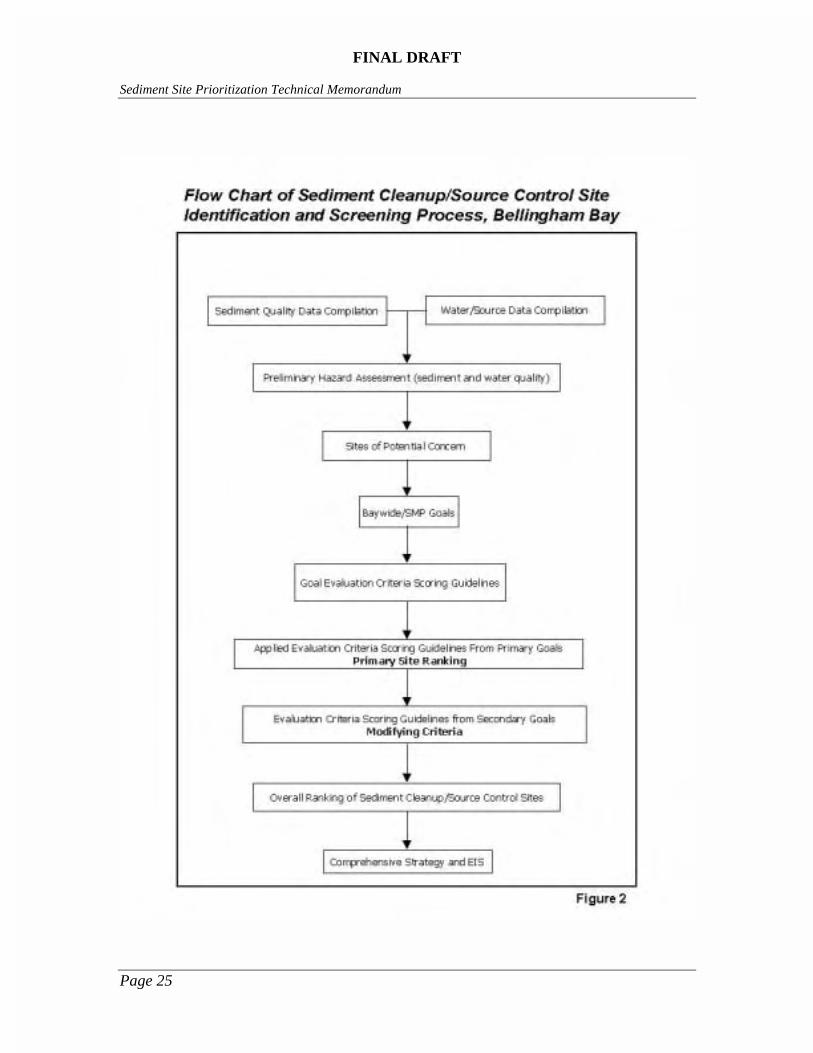
The Pilot’s sediment cleanup and source control evaluation and prioritization wasperformed in several sequential steps as follows:
� Initial review of sediment and water quality contamination areas throughoutBellingham Bay, resulting in the identification of 12 sediment sites ofpotential concern;
� Development and description of the overall goals and correspondingevaluation criteria used by the Pilot Team to assess each potential sedimentcleanup and source control site; and
� Assumptions, rationale, and results of applying these goals and evaluationcriteria to the inventory of identified sediment cleanup and source controlsites, resulting in the relative ranking of the 12 prospective cleanup sites.
A flow chart depicting the process used by the Pilot Team to identify and rank sedimentcleanup and source control sites is presented in Figure 2.
FINAL DRAFT
Sediment Site Prioritization Technical Memorandum
Page 12
BELLINGHAM BAY WORKGROUP GOALS AND
EVALUATION CRITERIA
The evaluation and prioritization of the 12 prospective sediment cleanup and sourcecontrol sites, identified based on a preliminary hazard assessment as described in SMSregulations, was performed using a consistent application of the Pilot goals. Thedevelopment of baywide goals and evaluation criteria for this application is discussedbelow.
Development of Bellingham Bay Work Group Goals
Beginning in August 1997, the Pilot Team started a process of developing and refiningbaywide goals that reflected the collective interests and desired outcomes of the Pilotactions. The Pilot goals were initially developed as simple statements (the bullet itemslisted below under “goal descriptors”) of desired outcomes that can be applied to all ofthe project elements (i.e., source control and sediment cleanup, sediment disposal, habitatrestoration, and aquatic land use). The statements were also designed to represent keyregulatory and policy issues and concerns of individual Pilot members (see below). Thesestatements were then consolidated, reviewed, and refined into logical goal groupings asfollows:
Goal 1 - Human Health and Safety
Goal Descriptors:
� Protect human health.
� Human safety.
� Protect drinking water supplies.
� Reduce contaminant sources.
� Control point and non-point sources.
� Minimize chemical releases and maintain integrity.
� Cleanup contaminated sediments posing human health risks.
� Protect water quality.
FINAL DRAFT
Sediment Site Prioritization Technical Memorandum
Page 13
Goal 2 - Ecological Health
Goal Descriptors:
� Enhance or maintain aquatic organism health.
� Reduce contaminant sources.
� Control point and non-point sources.
� Minimize chemical releases and maintain integrity.
� Cleanup contaminated sediments posing ecological risks.
� Protect water quality.
Goal 3 - Protect and Restore Ecosystems
Goal Descriptors:
� Environmental protection/minimize environmental harm.
� Maintain physical integrity of habitats, including shoreline erosion/accretion.
� Habitat improvement.
� Avoid/minimize loss of in-water habitats and compensatory mitigation.
� Protect/restore aquatic life and aquatic resources.
� Maintain/enhance ecosystem diversity, productivity, stability, and biologicalfunction.
� Restore threatened and endangered fish and wildlife species.
Goal 4 - Social and Cultural Uses
Goal Descriptors:
� Protect spiritual use and location.
� Protect/enhance ceremonial and subsistence resource use.
� Ensure compatibility with community goals and property uses.
� Enhance recreation, aesthetic values, public use and access.
FINAL DRAFT
Sediment Site Prioritization Technical Memorandum
Page 14
Goal 5 - Resource Management
Goal Descriptors:
� Utilize renewable resources.
� Use dredged material beneficially.
� Protect and develop water supplies.
� Conserve resources.
Goal 6 - Faster, Better, Cheaper
Goal Descriptors:
� Technical feasibility.
� Implementability.
� Timely completion.
� Cost effectiveness.
� Integrate multiple land-use and environmental objectives and actions.
� Efficient use of existing built-environment.
Goal 7 - Economic Vitality
Goal Descriptors:
� Encourage water dependent commerce.
� Allow only water dependent discharges.
� Maintain/enhance navigation.
� Tribal access to and use of treaty resources.
� Minimize treaty fishing losses.
� Develop marine transportation facilities.
� Maintain/enhance commercial property use and redevelopment.
� Enhance economic vitality.
FINAL DRAFT
Sediment Site Prioritization Technical Memorandum
Page 15
As part of this goal development process, the Pilot Team assessed the relative priority ofeach of the goals. On a baywide basis (i.e., with all four project elements combined), thefirst three goals (Human Health and Safety, Ecological Health, and Protect/RestoreEcosystems) ranked higher than the remaining four goals.
Subsequent to the development of the agreed-upon Pilot goals, they were transformedinto evaluation criteria scoring guidelines that were used to evaluate and rank prospectivesediment cleanup and source control sites. Goals were transformed into evaluationcriteria by developing generalized narrative descriptions of each goal that defined ordiscussed the goal in the context of sediment cleanup and source control. In developingthe scoring criteria, an attempt was made to incorporate key regulatory and policy issuesexpressed by individual Pilot Team members. These key issues included (in no particularorder):
� Model Toxics Control Act (MTCA) and SMS regulations for cleanup remedyselection.
� State Environmental Policy Act (SEPA) guidelines and policies.
� Local Shoreline Management Program (SMP) requirements.
� Port Development and Navigation Improvement/Maintenance Plans.
� Clean Water Act Regulations (esp. Section 404[b][1]).
� Washington State Department of Natural Resources Land Management Laws,Public Trust Doctrine, and related policies.
� Endangered Species Act (ESA) Section 7/10 Requirements.
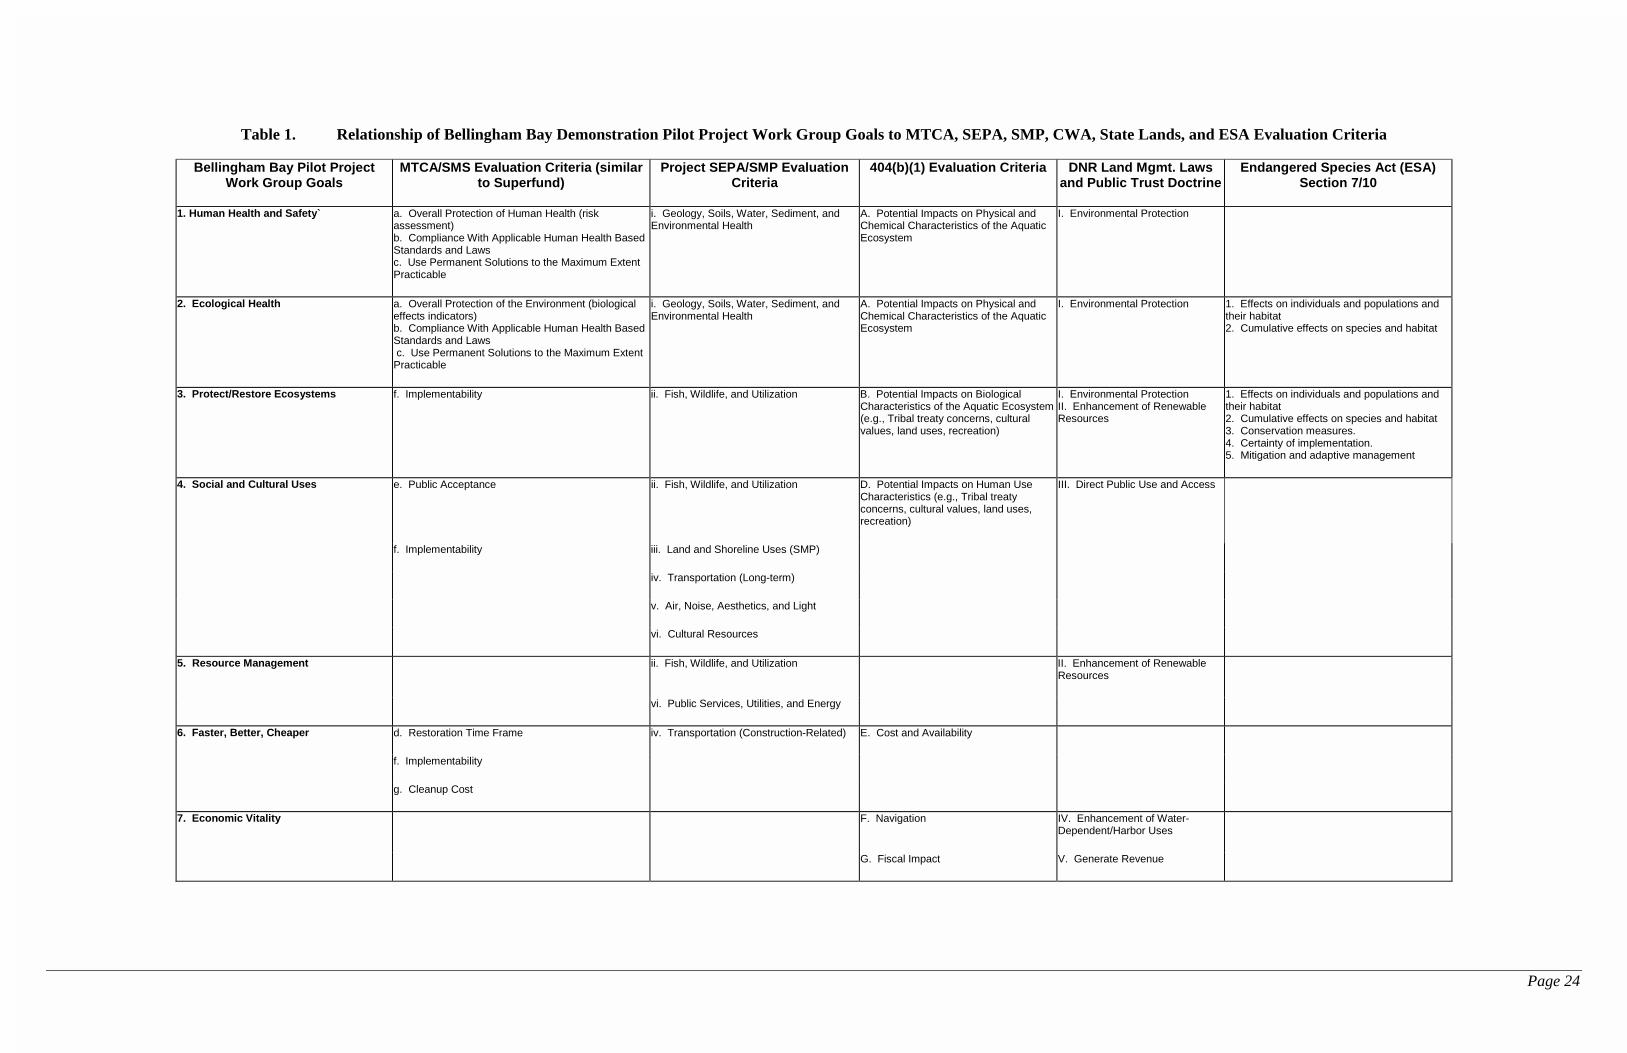
The general relationship of the Pilot’s goals to these key regulatory and policy issues isdepicted on Table 1.
The seven goals were also evaluated to determine if there were priority goals among themwith respect to sediment cleanup and source control (not on a bay-wide basis). The PilotTeam determined that the first four goals represented the primary elements of sedimentcleanup and source control, and the remaining three goals were secondary. The relativeimportance of the first four goals was utilized in the scoring of sediment cleanup andsource control sites.
FINAL DRAFT
Sediment Site Prioritization Technical Memorandum
Page 16
RANKING OF PROSPECTIVECLEANUP SITES
The guidelines for scoring developed by the Pilot for the sediment site and source controlprioritization were found to be conceptually similar to guidelines previously developedby Ecology for SEDRANK (see Section 2.0). Because the SEDRANK model reasonablyreflected a range of the Pilot’s goals, particularly the primary Goals 1 through 4, and toprovide consistency with SMS policies and guidelines, the Pilot Team decided to used theSEDRANK model to prioritize sediment cleanup and source control sites. In this case,minor modifications to the SEDRANK model were made to optimize its application inBellingham Bay (see below).
SEDRANK Scoring Guidelines and Assumptions – PrimaryGoals 1 through 4
As discussed in Section 2.0, the SEDRANK model integrates available information ontoxicity potential, extent, natural recovery potential, habitat attributes, fisheriesutilization, and other factors to derive a total score for each prospective sediment cleanupsite, consistent with evaluation criteria for Pilot Goals 1 through 4. Most of theSEDRANK input parameters were incorporated into the Bellingham Bay ranking model,though several of the parameters were modified as follows to improve resolution (i.e.,relative site comparison) of the scoring:
� Maximum concentration of individual contaminants.
� Area of contaminated sediments.
� Water depth of contaminated sediments.
The Pilot’s modifications to these parameters were consistent with those presented inSection 5.1. All other components of the ranking model for Goals 1 through 4 wereunchanged from the original SEDRANK model.
Scoring Guidelines and Assumptions – Secondary Goals 5through 7
Although the primary evaluation criteria for sediment cleanup and source control siteswere represented by Goals 1 through 4, as reflected in the SEDRANK model, theremaining three Pilot goals were nevertheless relevant to the overall scoring and thedevelopment of the Pilot’s Comprehensive Strategy. Accordingly, the last three Pilotgoals were utilized to develop balancing criteria, and were applied to identify priority
FINAL DRAFT
Sediment Site Prioritization Technical Memorandum
Page 17
sites in cases where scores for the first four goals were equivalent (i.e., tiebreakercriteria).
The results of the initial sediment site scoring ranked sites into the following categories:
� Highest Priority Sites (3 total).
� Medium/High Priority Sites (2 total).
� Medium Priority Sites (2 total).
� Medium/Low Priority Sites (2 total).
� Lowest Priority Sites (3 total).
As discussed above, a Comprehensive Strategy is currently being developed by the PilotTeam that integrates sediment cleanup and source control with the other project elements.The Comprehensive Strategy will include near-term project alternatives that are priorityaction items from each of the elements, integrated together into near-term actions. The 5to 7 highest priority sediment cleanup sites are likely to be included in the near-termaction for Bellingham Bay. Cleanup and restoration plans for these sites will beevaluated in more detail in a forthcoming EIS (Figures 1 and 2).
FINAL DRAFT
Sediment Site Prioritization Technical Memorandum
Page 18
RECOMMENDED KING COUNTYSMP SITE PRIORITIZATION
Our preliminary recommendation is to use the Sediment Site and Source Controlprioritization model recently developed by the Bellingham Bay Pilot Project, with minormodifications, to prioritize sediment cleanup sites for the SMP. That is, the SEDRANKscoring model, modified as discussed below, would be used as the primary basis to rankthe various sites. Secondary goals as determined by the Bellingham Pilot (ResourceManagement; Faster, Better, Cheaper; and Economic Vitality) would be used asbalancing criteria. For the seven identified sites, the ranking could be performed usingexisting data.
Application and adaptation of the Bellingham Pilot’s prioritization model for sedimentremediation sites in this case is supported by the following:
� The objectives of the Bellingham Pilot (e.g., to use a cooperative approach toexpedite sediment cleanup) are similar to the goals of King County’s SMP.Indeed, the Pilot envisioned that its efforts could be used to aid similarsediment cleanup efforts elsewhere in Puget Sound.
� The Bellingham Pilot is utilizing a decision-making process (including EIScomponents) that is similar in many respects to the expected process for KingCounty’s SMP, and which also addresses the importance of recent regionalregulatory and policy developments including ESA.
� The Bellingham Pilot’s sediment site and source control prioritization criteriaaddress many of the key issues identified previously by King County for theSMP, including considerations of public health and environmental impacts,cost/benefit, cost effectiveness, opportunities for coincident benefits, potentialfor source trading, “window of opportunity” issues, and other relevant criteria.
� The goals and criteria developed by the Bellingham Pilot for sediment site andsource control prioritization reflect the collective interests of key federal,tribal, state, local, and responsible party interests that are very similar incomposition to stakeholders of the King County SMP project area.
� The Bellingham Pilot effort is successfully accomplishing its objectives.
� The methodology, outlined below, proposed for use in the King County SMPwill not require new method development efforts, and so can be appliedefficiently to identify sediment cleanup priorities in this area.
FINAL DRAFT
Sediment Site Prioritization Technical Memorandum
Page 19
SEDRANK SCORINGGUIDELINES AND ASSUMPTIONS
– PRIMARY CRITERIA
The SEDRANK model will be used to integrate available information on toxicitypotential, extent, source control, natural recovery potential, habitat attributes, fisheriesutilization, and other factors to derive a total score for each sediment site. Most of theSEDRANK input parameters will be incorporated into the SMP ranking model, thoughseveral of the parameters will be modified as follows to improve resolution (i.e., relativesite comparison) of the scoring as described in more detail below.
SEDRANK Model Modifications
The SMP ranking model will include the following specific modifications to improve itsapplication for this project:
Maximum Concentration Of Individual Contaminants
The SEDRANK model uses as input the maximum concentration of individual analytesdetected at a site, and then compares the maximum values with ecological and humanhealth benchmarks derived from relevant toxicity criteria. However, other elements ofthe SMS program, including cleanup site identification, utilize the somewhat differentconcept of a “station cluster”, which is defined as a group of geographically andchemically similar stations that together define the highest average chemicalconcentrations or biological effects. The station cluster concept addresses to some extentthe characteristic variability of environmental measurements, and also is beingconsidered for use in the SMS to define sediment “hotspots”. For these reasons, a“station cluster hotspot”, defined as a group of three contiguous sampling locations withthe highest average chemical concentrations or biological effects, will be used to definethe concentration term input to the SEDRANK model.
Area Of Contaminated Sediments
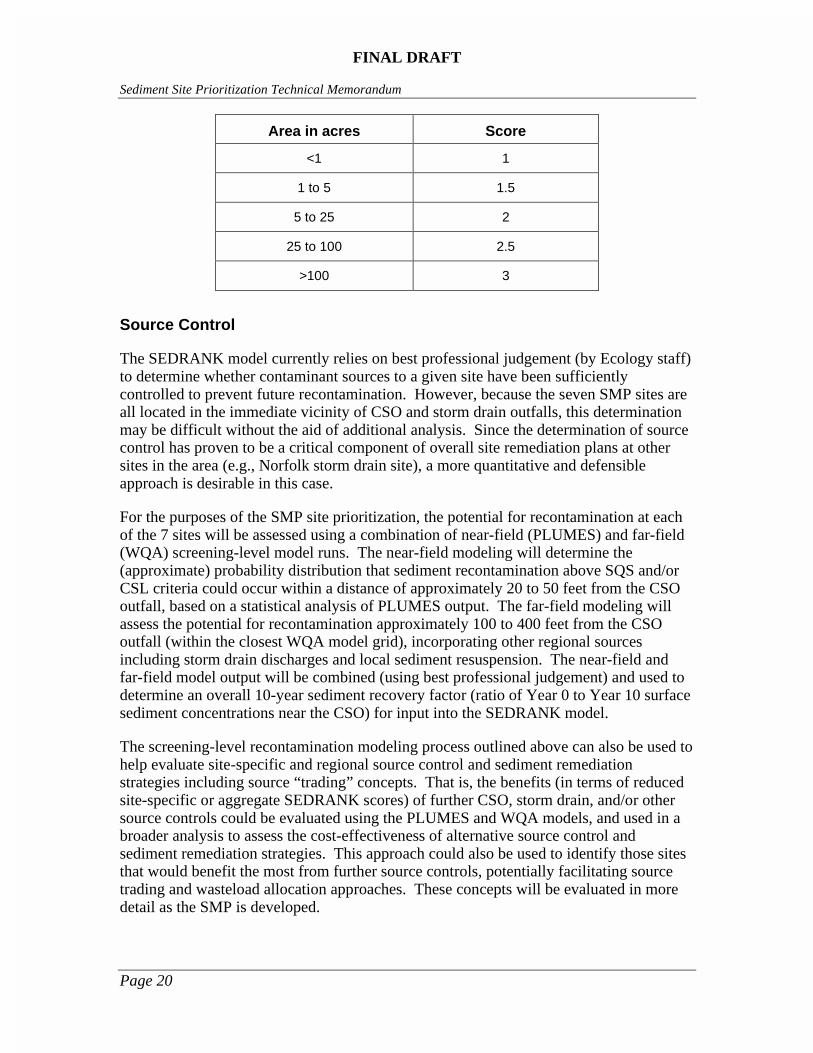
The SEDRANK model differentiates the areal extent of sediment contamination intohigh, medium, and low categories, with the cutoffs for such ranking occurring at intervalsof 400 and 200 acres, respectively. However, because all prospective sediment cleanupsites in the SMP area would fall within the “low” category of less than 200 acres, thescale for this analysis will be adjusted to represent the logarithmic range of areasobserved in the study area. The adjusted area scale will be as follows:
FINAL DRAFT
Sediment Site Prioritization Technical Memorandum
Page 20
Area in acres Score
<1 1
1 to 5 1.5
5 to 25 2
25 to 100 2.5
>100 3
Source Control
The SEDRANK model currently relies on best professional judgement (by Ecology staff)to determine whether contaminant sources to a given site have been sufficientlycontrolled to prevent future recontamination. However, because the seven SMP sites areall located in the immediate vicinity of CSO and storm drain outfalls, this determinationmay be difficult without the aid of additional analysis. Since the determination of sourcecontrol has proven to be a critical component of overall site remediation plans at othersites in the area (e.g., Norfolk storm drain site), a more quantitative and defensibleapproach is desirable in this case.
For the purposes of the SMP site prioritization, the potential for recontamination at eachof the 7 sites will be assessed using a combination of near-field (PLUMES) and far-field(WQA) screening-level model runs. The near-field modeling will determine the(approximate) probability distribution that sediment recontamination above SQS and/orCSL criteria could occur within a distance of approximately 20 to 50 feet from the CSOoutfall, based on a statistical analysis of PLUMES output. The far-field modeling willassess the potential for recontamination approximately 100 to 400 feet from the CSOoutfall (within the closest WQA model grid), incorporating other regional sourcesincluding storm drain discharges and local sediment resuspension. The near-field andfar-field model output will be combined (using best professional judgement) and used todetermine an overall 10-year sediment recovery factor (ratio of Year 0 to Year 10 surfacesediment concentrations near the CSO) for input into the SEDRANK model.
The screening-level recontamination modeling process outlined above can also be used tohelp evaluate site-specific and regional source control and sediment remediationstrategies including source “trading” concepts. That is, the benefits (in terms of reducedsite-specific or aggregate SEDRANK scores) of further CSO, storm drain, and/or othersource controls could be evaluated using the PLUMES and WQA models, and used in abroader analysis to assess the cost-effectiveness of alternative source control andsediment remediation strategies. This approach could also be used to identify those sitesthat would benefit the most from further source controls, potentially facilitating sourcetrading and wasteload allocation approaches. These concepts will be evaluated in moredetail as the SMP is developed.
FINAL DRAFT
Sediment Site Prioritization Technical Memorandum
Page 21
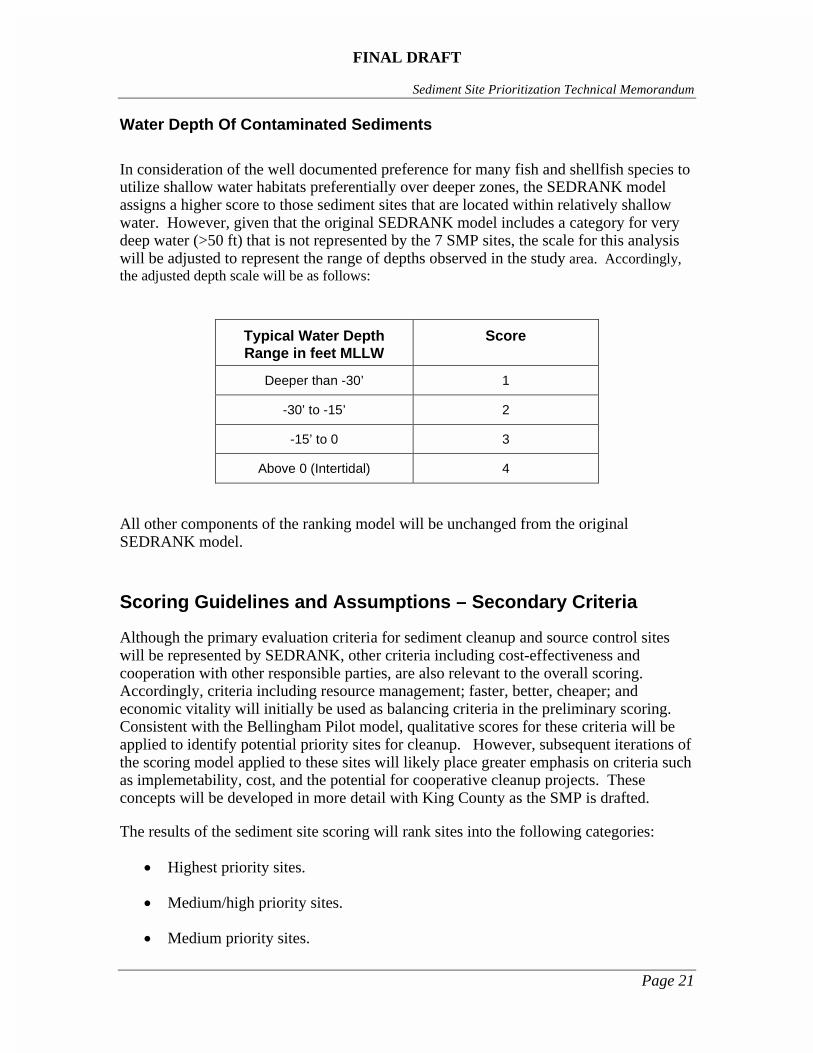
Water Depth Of Contaminated Sediments
In consideration of the well documented preference for many fish and shellfish species toutilize shallow water habitats preferentially over deeper zones, the SEDRANK modelassigns a higher score to those sediment sites that are located within relatively shallowwater. However, given that the original SEDRANK model includes a category for verydeep water (>50 ft) that is not represented by the 7 SMP sites, the scale for this analysiswill be adjusted to represent the range of depths observed in the study area. Accordingly,the adjusted depth scale will be as follows:
Typical Water DepthRange in feet MLLW
Score
Deeper than -30’ 1
-30’ to -15’ 2
-15’ to 0 3
Above 0 (Intertidal) 4
All other components of the ranking model will be unchanged from the originalSEDRANK model.
Scoring Guidelines and Assumptions – Secondary Criteria
Although the primary evaluation criteria for sediment cleanup and source control siteswill be represented by SEDRANK, other criteria including cost-effectiveness andcooperation with other responsible parties, are also relevant to the overall scoring.Accordingly, criteria including resource management; faster, better, cheaper; andeconomic vitality will initially be used as balancing criteria in the preliminary scoring.Consistent with the Bellingham Pilot model, qualitative scores for these criteria will beapplied to identify potential priority sites for cleanup. However, subsequent iterations ofthe scoring model applied to these sites will likely place greater emphasis on criteria suchas implemetability, cost, and the potential for cooperative cleanup projects. Theseconcepts will be developed in more detail with King County as the SMP is drafted.
The results of the sediment site scoring will rank sites into the following categories:
� Highest priority sites.
� Medium/high priority sites.
� Medium priority sites.
FINAL DRAFT
Sediment Site Prioritization Technical Memorandum
Page 22
� Medium/low priority sites.
� Lowest priority sites.
As discussed above, the results of the scoring and supplemental source control modelingmay also be used to identify those sites that would benefit the most from further sourcecontrols, potentially facilitating source trading and wasteload allocation approaches.These concepts will be evaluated in more detail as the SMP is developed.
FINAL DRAFT
Sediment Site Prioritization Technical Memorandum
Page 23
Page 24
Table 1. Relationship of Bellingham Bay Demonstration Pilot Project Work Group Goals to MTCA, SEPA, SMP, CWA, State Lands, and ESA Evaluation Criteria
Bellingham Bay Pilot ProjectWork Group Goals
MTCA/SMS Evaluation Criteria (similarto Superfund)
Project SEPA/SMP EvaluationCriteria
404(b)(1) Evaluation Criteria DNR Land Mgmt. Lawsand Public Trust Doctrine
Endangered Species Act (ESA)Section 7/10
1. Human Health and Safety` a. Overall Protection of Human Health (riskassessment)b. Compliance With Applicable Human Health BasedStandards and Lawsc. Use Permanent Solutions to the Maximum ExtentPracticable
i. Geology, Soils, Water, Sediment, andEnvironmental Health
A. Potential Impacts on Physical andChemical Characteristics of the AquaticEcosystem
I. Environmental Protection
2. Ecological Health a. Overall Protection of the Environment (biologicaleffects indicators)b. Compliance With Applicable Human Health BasedStandards and Laws c. Use Permanent Solutions to the Maximum ExtentPracticable
i. Geology, Soils, Water, Sediment, andEnvironmental Health
A. Potential Impacts on Physical andChemical Characteristics of the AquaticEcosystem
I. Environmental Protection 1. Effects on individuals and populations andtheir habitat2. Cumulative effects on species and habitat
3. Protect/Restore Ecosystems f. Implementability ii. Fish, Wildlife, and Utilization B. Potential Impacts on BiologicalCharacteristics of the Aquatic Ecosystem(e.g., Tribal treaty concerns, culturalvalues, land uses, recreation)
I. Environmental ProtectionII. Enhancement of RenewableResources
1. Effects on individuals and populations andtheir habitat2. Cumulative effects on species and habitat3. Conservation measures.4. Certainty of implementation.5. Mitigation and adaptive management
4. Social and Cultural Uses e. Public Acceptance ii. Fish, Wildlife, and Utilization D. Potential Impacts on Human UseCharacteristics (e.g., Tribal treatyconcerns, cultural values, land uses,recreation)
III. Direct Public Use and Access
f. Implementability iii. Land and Shoreline Uses (SMP)
iv. Transportation (Long-term)
v. Air, Noise, Aesthetics, and Light
vi. Cultural Resources
5. Resource Management ii. Fish, Wildlife, and Utilization II. Enhancement of RenewableResources
vi. Public Services, Utilities, and Energy
6. Faster, Better, Cheaper d. Restoration Time Frame iv. Transportation (Construction-Related) E. Cost and Availability
f. Implementability
g. Cleanup Cost
7. Economic Vitality F. Navigation IV. Enhancement of Water-Dependent/Harbor Uses
G. Fiscal Impact V. Generate Revenue
FINAL DRAFT
Sediment Site Prioritization Technical Memorandum
Page 25