SEDIMENT BALANCE AND FLUSHING FLOW ANALYSIS: TRINITY RIVER ... · SEDIMENT BALANCE AND FLUSHING...
13
SEDIMENT BALANCE AND FLUSHING FLOW ANALYSIS: TRINITY RIVER CASE STUDY Robert T. Milhous l ABSTRACT The use of sediment yield as one aspect of a flushing flow analysis is explored in a case study of the Trinity River in California. Understanding sediment balance can help in the development of a flushing flow need, but hydraulic analysis must also be done. The most important flushing flow need for the Trinity River is to increase the Trinity River when in Grass Valley Creek and other tributaries draining the Shasta Bally Batholith are high. The goal is preventing deposition o! sand and f ine:s. These flows should be followed by clear-water flushing (Le., flushing tlows when the tributaries are not high) to remove fines and sand from the stream bed. INTRODUCTION The use of sediment balance as part of a fl ushing floW' study is a relatively new idea. Most flushing floW' studies consider only the hydraUlics of a reach of stream. This case study of the Trinity River in northwestern California shows that the analyst must consider not only the hydraulics of a reach but also the sediment balance of the stream. The .... ork is part of a larger joint study between the U.S. Bureau of Reclamation and the National Biological survey to develop techniques to determine tlushing flows for western rivers. The Trinity River .....as used as a case study because much sediment load data have been collected for the river and tributaries below Le..... iston Dam, and some hydraulic data .... ere available. TRINITY RIVER, CALIFORNIA The Trinity River is located in northwestern California and is tributary to the Klamath River. Major tacili ties constructed by the U. S. Bureau o( Reclamation (USBR) divert a high portion of the lNational Ecology Research Center, National Biological Survey, 4512 McMurry Ave. fort Collins, CO 80525-3400. 281
Transcript of SEDIMENT BALANCE AND FLUSHING FLOW ANALYSIS: TRINITY RIVER ... · SEDIMENT BALANCE AND FLUSHING...

SEDIMENT BALANCE AND FLUSHING FLOW ANALYSIS: TRINITY RIVER CASE STUDY
Robert T. Milhous l
ABSTRACT
The use of sediment yield as one aspect of a flushing flow analysis is explored in a case study of the Trinity River in north~estern California. Understanding sediment balance can help in the development of a flushing flow need, but hydraulic analysis must also be done. The most important flushing flow need for the Trinity River is to increase the Trinity River flo~s when rlo~s in Grass Valley Creek and other tributaries draining the Shasta Bally Batholith are high. The goal is preventing deposition o! sand and f ine:s. These flows should be followed by clear-water flushing (Le., flushing tlows when the tributaries are not high) to remove fines and sand from the stream bed.
INTRODUCTION
The use of sediment balance as part of a fl ushing floW' study is a relatively new idea. Most flushing floW' studies consider only the hydraUlics of a reach of stream. This case study of the Trinity River in northwestern California shows that the analyst must consider not only the hydraulics of a reach but also the sediment balance of the stream. The ....ork is part of a larger joint study between the U.S. Bureau of Reclamation and the National Biological survey to develop techniques to determine tlushing flows for western rivers. The Trinity River .....as used as a case study because much sediment load data have been collected for the river and tributaries below Le..... iston Dam, and some hydraulic data ....ere available.
TRINITY RIVER, CALIFORNIA
The Trinity River is located in northwestern California and is tributary to the Klamath River. Major tacili ties constructed by the U. S. Bureau o( Reclamation (USBR) divert a high portion of the
lNational Ecology Research Center, National Biological Survey, 4512 McMurry Ave. fort Collins, CO 80525-3400.
281

natural streamfloW' from the Trinity River to the Sacramento Basin. These facilities are part of the central Valley Project. The diversions started in April 1963. Filling of the reservoirs caused an initial impact on the Trinity River stating in water year 1961. The reservoirs have had a major impact on the Trinity River and are considered to have caused a reduction in chinook salmon production because of fine sediment deposited in the gravels (Nelson et al.,1987).
The reach considered in this paper is that between Lewiston Dam and its junction with~the North Fork of the Trinity. about 38 miles downstream. The reach is important for chinook salmon spawning. The mean daily flow for the period 1912 to 1960 at Lewiston was 1640 crs. The unregulated flows of the Trinity River have a pattern of rain and rain-on-snow flows in fall and winter, with snow-melt flows in spring. The historical peak of the average daily flows occurred on 14 Hay (4289 cfs), and the maximum daily discharge occurred on 22 December (38,700 efs).
The tributary watershed to the reach downstream of Le~iston but upstream of the North Fork of the Trinity has a different pattern because snow-melt is not as important. The average of the daily flows for Grass Valley Creek for the period 1976 to 1992 was 46.8 cts. The maximum average daily discharge (215 cfs) and the maximum of the average daily discharges (2420 cfs) are on the same day (2 March).
Table 1. Annual peak daily flo,",s (cfs) measured in the Trinity River at Lewiston, california for the unregulated period (1912-1960) and the regulated period (1965-1991).
'{ears Mean Median Maximum Minimum 1912-1960 1<661 14400 38700 2860 1965-1991 2528 944 13800 252
The impact of the reservoirs and the diversion on the daily flows has been significant (Table 1). Except during the summer low-flow period, the reduction in the daily flows has been significant, causing the new maximum average daily flow to be 825 cfs with a maximum of the daily loW's to be 13,800 cis. The pattern, or in some ways the lack of a pattern, is completely different from the natural flows in the river.
A high percentage of the tines and sand delivered to the Trinity between Le~i8ton and the North Fork are
282

derived from the Shasta Bally Batholith and transported to the Trinity by Grass Valley Creek. The Shasta Bally Batholith is ....eathering rapidly to easily transported sand and finer ~aterial. Most ot the Grass Valley ....atershed is underlain by the batholith and little of the remaining watershed is underlain by the batholith (Nelson et al., 1987). Grass Valley Creek may be transporting gravel, but the major source of gravel is probably the other tributaries and the channel and banks of the river.
EXISTING TECHNIQUES FOR DETERMINING FLUSHING FLOW NEEDS
Empirical techniques for determining a flushing flow need were reviewed by MilhOUs(1986). The range of the flushing flo.... needs is bounded by the mean annual peak flow (daily or instantaneous) and t ....o times the average annual discharge. The unregulated mean daily peak flow 15 14,660 cfs and two times the mean annual flow is 3280 cfs. If either of these flows had been used as a required flushing flow at the beginning of regUlation, good conditions for salmon spawning may have resulted, but they ....er~ not used and the existing conditions are not good for spa....ning. The result of low peak flows between 1961 and the present is that the channel has changed. The eXisting bankfull width may be less than 50 percent of the pre-project bankfull width (Frederiksen, Kamine and Associates, 1980). Because of channel change, none of the empirical techniques should be used.
The state of the art is to use an analysis of the hydraUlics of a reach of stream and to determine a flushing floW' on the basis of a critical discharge calculated from the critical shear stress required to move the bed material. These techniques were described by Milhous (1986 and 1990).
From a habitat viewpoint there are three levels of flushing flows. The first is the level needed to keep fines and sand from being deposited in and on the stream bed ("keep sand moving"); the second is the flow level needed to remove fines and sand from the surface of the streao bed (surface flushing); and the third is the flow level needed to remove sediment from .... ithin the stream bed (depth flushing) . The levels are determined using a movement parameter, beta, which is calculated the same way as the Shields coeff icient, but the beta parameter is about movement and not about stability. The parameters needed for surface and depth flushing flows have been previously shown (Hilhous, 1986) to
283

be 0.035 for depth flushing and 0.021 for surface flushing. The equation (Milhous,1990) used for the "keep sand moving" case is
beta _ O.066(d50bl/d50a)O.47
where beta is the lllovement parameter, d50bl is the median size ot the transported material, and d50a is the median size ot the bed surface naterial. The size of the material to keep in motion (i.e. transport) vas assuned to be 1.0 mrn.
The data used to e~timate the streamflo.... in the Trinity that would result in the required values of beta were adapted tram Barta, WilcocK, and Shea (1993). The values used for two locations near Limekiln Gulch are given in Table 2. There is at least one problem; the report ...as not clear as to vhat the 050 represented. Was D50 for a bulk sample that included both surface and sub-surface material, or 'Was it for the surface material? The D50 is assumed to be surface (armour) material.
Using these data the "keep sand moving" critical flO'o.' vas calculated to be 1800 efs, the critical flow for surface flushing 2820 ets, and critical flov for depth flushing 4560 crs.
Table 2: Data used to develop a beta versus stream flow function for the Trinity River. (J\dapted from Barta, Wilcock and Shea, 1993. )
Site Streamflo.... Depth Slope 050 Beta ems m \ em
Poker Bar 75.7 1. 52 0.08 3.4 0.022 164 2.17 0.11 '.3 0.065
steel Bridge 75.7 1. 05 0.16 6.5 0.016 164 1.85 0.14 •• 3 0.038
The "keep sand moving" and the surface scour concepts are similar - the objective being to keep the surface clean ot fines and sand. The lIkeep sand moving" case is best used when there is a small amount of fines and sand introduced into the stream. The scour surface case is best used to remove sand and fines and to transport fines and sand when there is a large amount of sand introduced into the stream. Grass valley Creek introduces a lot of sand to the Trinity River. Therefore, the flushing flo... for the Trinity is either the surface flushing flow (2820 cts) or the depth flushing case (4560 cfs). Salmon spavming requires depth flushing; hence, the flushing flow need is 4560 cfs.
284

SEDIMENT BALANCE IN THE TRINITV RIVER
I
Measured data used for the analysis presented in this paper are for two u.s. Geological survey hydrometric stations - one on Grass Valley Creek at Fawn Lodge and the other on the Trinity River belov Limekiln Gulch. The yield of sediment trom Grass Valley Creek is used here as an index to the sediment yield of the ~atershed betveen the Lewiston Gage and the North Fork of the Trinity. The measured annual sediment yields for the two stations are given in Table 3. The are", of the watershed between the gage on the Trinity at Lewiston just downstream of the dam and the gage at Llme~iln Gulch is 9J square miles. Little sediment is transported through the reservoir complex upstream: therefore, the sediment load measured at Limekiln Culch is mostly (ron: the watershed between the dam and the hydrooetric station. The watershed area above the gage on Grass Valley creek is 30. B square miles one third of the source area for sediment at the Limekiln gulch site.
Table 3: Measured suspended Sediment Load in the Trinity River at Limekiln Gulch and in' Grass Valley
I Creek at Fawn Lodge. (Data from the records of the U.S. Geological Survey.)
Water Trinity Grass Valley Year River Creek Ratio
(tons) (tons) 1976 745 1977 126 1978 78306 1979 2861 1980 13552 1981 3877 1982 47864 7127 6.72 1983 315916 304673 1. 04 1984 26338 9714 2.71 1985 1922 977 1. 97 1986 66416 59855 1. 11 1987 ~618 4)54 0.60 1988 1476 1211 1. 22 1989 4060 2560 1. 59 1990 1826 1393 1. 31 1991 1912 232 8.24 1992 3126 Average 58327 48809 1.19 (1982-89)
285

A reservoir constructed to trap some of the sediment in Grass Valley Creek upstream of the hydrometric station was completed in 1990.
The ratio ot the sediment load at Limekiln Gulch to the load at Fawn Lodge is 1.19 for the period 1982 to 1989. If there was no net change in the sediment stored in the river between 1982 and 1989, a rough sediment balance can be calculated by assuming the input of sediment is 1.19 times the measured sediment load at Fawn Lodge, and the output is the measured load at Limekiln Gulch. The annual sediment balance is shown in Figure 1 for the ten years where records exist at both gages. (The ratio of 1.19 will be used for sediment balance calculations in follo..... ing sections.) The data indicate there was storage at sediment in the river between Lewiston Dam and Limekiln Gulch in water years 1983, 1986, and 1987, and flushing occurred in the other years with the best flushing in 1982 and 1984. These conclusions sound at least plausible but there are some problems: (1) there is a large unmeasured load at both sites, (2) the material measured is a mixture of range of sizes of sediment that may be measured with different levels of efficiency at the t .....o gages, and (3) the within year distribution of the sediment load can be important.
40000
30000 ~•g 20000 v
10000•0
0~ in - '0000 C• -20000 .§ "0• -30000
-40000 '" -50000 1982 1984 1986 1988 1990
Water Year
Figure 1: Sediment Balance for the Trinity River Between Lewiston Dam and the Limekiln Gage.
The application of a sediment transport capacity index in the analysis of the sedimentation aspects of an instream flow analysis was presented previously (Hilhous 1992). The average annual
286
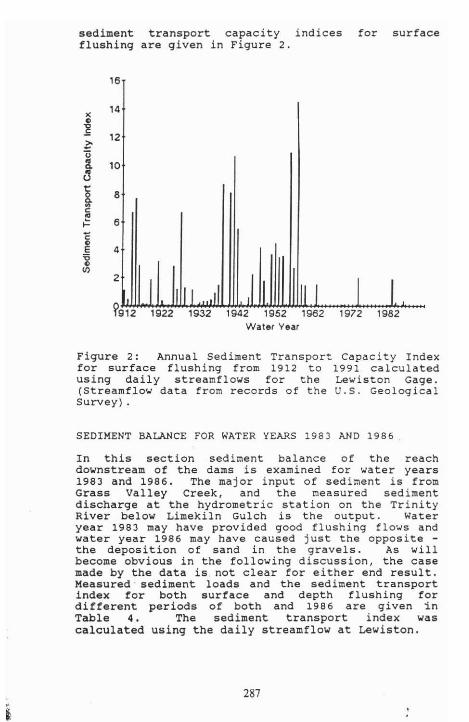
sediment transport capacity indices for surface flushing are given in Figure 2.
16
14 •<
~ 12 ~ <; ~ 10 tl j 8 0
~ 6 C•E 4 ~ <n
2
1/ J I I ?912
,II I .11 1922 1932 1942 1952 1962 1972 1982
Water Year
Figure 2: Annual Sediment Transport Capacity Index for surface flushing from 1912 to 1991 calculated using daily streamflows for the Lewiston Gage. (Streamflow data from records of the u.s. Geological Survey) .
SEDIMENT BALANCE FOR WATER YEARS 1983 AND 1986
In this section sediment balance of the reach downstream of the dams is examined for water years 1983 and 1986. The major input of sediment is from Grass Valley Creek, and the measured sediment discharge at the hydrometric station on the Trinity River below Limekiln Gulch is the output. Water year 1983 may have provided good flushing flows and water year 1986 may have caused just the opposite the deposition of sand in the gravels. As .... ill become obvious in the follo .... ing discussion, the case made by the data is not clear for either end result. Measured· sediment loads and the sediment transport index for both surface and depth flushing for different periods of both and 1986 are given in Table 4. The sediment transport index was calculated using the daily streamflow at Le.... iston.
287
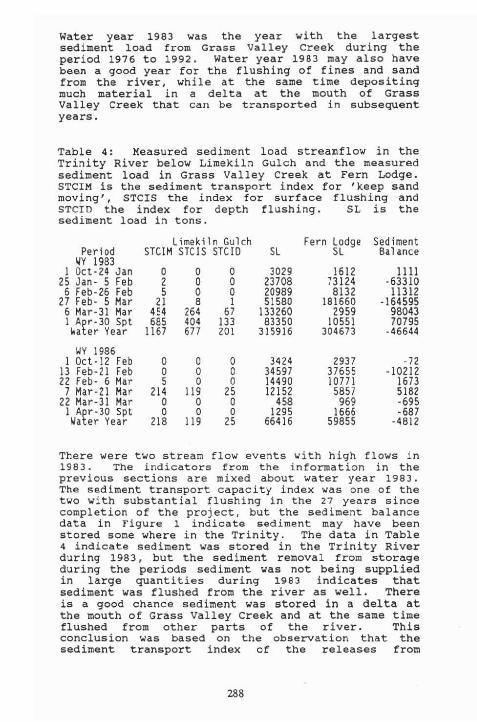
Water year 1983 was the year with the largest sediment load trom Grass Valley Creek during the period 1976 to 1992. Water year 1983 may also have been a good year for the flushing of fines and sand from the river. while at the same time depositing much material in a delta at the mouth of Grass valley Creek that can be transported in subsequent years.
Table 4: Measured sediment load streamflow in the Trinity River below Limekiln Gulch and the measured sediment load in Grass Valley cree): at Fern Lodge. STCIM is the sediment transport index for 'keep sand moving', STCIS the index for surface flushing and STeIn the index for depth flushing. SL is the sediment load in tons.
Period Limekiln Gulch
STCIM STCIS 5TCIO Sl fern lodge
Sl Sediment
Bal ance WY 1983
1 Oct-24 Jan 000 3029 1612 1111 25 Jan 5 Feb 100 23708 73124 -63310
6 Feb-26 Feb 500 20989 8131 11311 27 Feb 5 Mar 21 8 1 51580 181660 -164595 6 Mar~31 Mar 454 164 67 133260 1959 98043 1 Apr-30 SptWater Year
685 1167
404 677
133 101
83350 315916
10551 304673
70795 -46644
WY 1986 1 Oct-12 Feb o o o 3424 2937 - 72
13 Feb-II Feb o o o 34597 37655 -10211 22 Feb 6 Mar 5 o o 14490 10771 1673 7 Mar-21 Mar 214 119 15 11151 5857 5182
22 Mar-31 Mar 1 Apr-3D Spt Water Year
o o
118
o o
119
o o
15
458 1295
66416
969 1666
59855
-695 -687
-4B12
There were two stream flow events with high flows in 1983. The indicators from the information in the previous sections are mixed about water year 1983. The sediment transport capacity index was one of the tIJO with substantial flushing in the 27 years since completion of the project, but the sediment balance data in figure 1 indicate sediment may have been stored some where in the Trinity. The data in Table 4 indicate sediment was stored in the Trinity River during 1983, but the sediment removal trom storage during the periods sediment ....as not being: supplied in large quantities during: 1983 indicates that sediment was flushed from the river as well. There is a good chance sediment was stored in a delta at the mouth of Grass Valley Creek and at the same time flushed from other parts of the river. This conclusion was based on the observation that the sediment transport index of the releases from
288
Lewiston were zero or small during periods of high sediment yield from Grass Valley Creek and higher when there was lower sediment yield form Grass Valley Creek. The end result may have been a cleaner substrate than usual in the river but with a delta upstream that could supply sand and fines to the substrate during certain (but unknown) flow conditions. To determine the flow conditions that would deliver sediment from the delta to the river would require hydraulic modeling of the river and the delta.
The situation in 1966 ....as significantly different froIn what happened in 1983. A high sediment load period occurred in mid February but was not followed by flow conditions needed to clean the surface or, part of the time, to keep the sediment moving. In the period following the stonn the stream bed was flushed to a limited extent but not to the degree the data for 1983 indicates is possible because the 1983 data indicate the measured sediment load would be reasonably high for a while during a flushing event with a reasonable sediment transport index; there shOUld have been flushing but there ...as not. It is possible there was so much sand deposited in and on the stream bed that the channel became a sand-bed channel as a result of the m.id-February storm. The data for 1986 are rather confusing in comparison to 198J, but the lack of significant measured sediment loads following the mid-February storm indicate the stream was probably transporting sand without moving the gravel and cobbles. In 1986 the conditions may have been correct for deposition in and on the stream channel instead of 10 the del tllo; the reason cannot be determined without a hydraulic model of· the Trinity River below Grass Valley Creek and a hydraulic study of the junction of Grass Valley Creek and the Trinity River (the delta area).
CONCLUSIONS
The major conclusion about the Trinity River is that the system is dynamic and that sediment can be removed by the available flows but the frequency of flows producing surface (2820 efs) and depth tlushing conditions (4560 cfs) must be increased. The best use of flushing flows is to keep the sediment from being deposited when the flows in Grass Valley Creek are high by increasing the flow from the dam to at least the Ilkeep sand moving ll level (1600 cfs). During water year 1983 sediment may have been deposited in a delta at the mouth of Grass Valley Creek because the sediment transport
289

capacity was too small (see Table 4). This indicates flushing flows should be released when the tributary flows are high but not high enough to keep the sediment in motion once in the Trinity River. The increased reservoir releases would increase the transport capacity in the river at the delta and reduce sedimentation in the delta. Clear water release"s (Le., releases when the tributary flows are low) should be ccmsidered to improve the stream bed.
Conclusions about the methodological approach are that the logic associated with the beta parameters needs to be improved and that hydraulic analysis must be done on the fate of sediment in the river. Too many assumptions were required about what was happening in the stream channel. Sediment can be routed through a stream channel and the hydraulics of the deltas modeled with two- or threedimensional models. This was not done because the objective was to see how far sediment balance logic could be pushed to develop a flushing flow need for the Trinity. The sediment balance approach adds information to the usual results from the state of the art j however, this is still not good enough. Hydraulics of sediment movement through the Trinity River must be added.
Better than average spawning conditions may have occurred in the period 1982 to 1985 because of possible flushing of fines from the stream bed in 1982 and in 1983. The stream bed conditions may have became more like the average in 1986 because sediment may have been transported from the delta or directly from Grass Valley Creek to the stream bed.
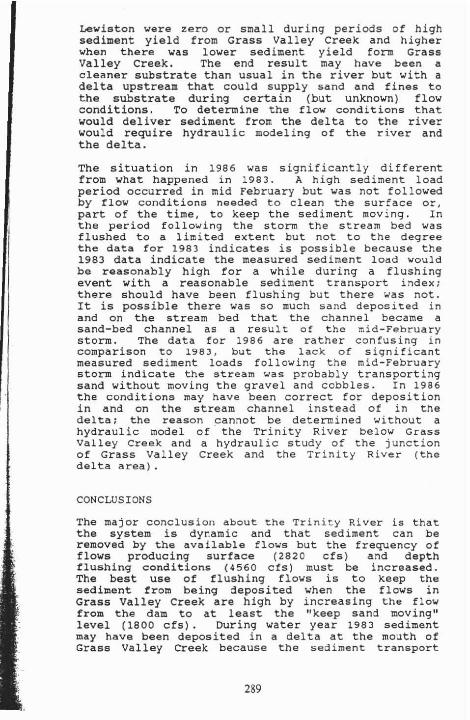
If the spawning fish return to the Trinity 3 to 4 years after they were deposited as eggs, then there should have been good returns of spawning fish in 1986 to 1989, with more typical returns in the other years. Figure 3 is in general agreement with idea that the flo..... conditions in 1982 and 1983 created cleaner substrate then occurs in most years. However, one should not assume that the limiting factor on chinook salmon production is sediment in the stream. Many alternative explanations of the increase in spawners in 1986 and the subsequent reduction to previous levels are possible.
290
1.0E+05
9.0E+04
8.0E+04
7.0E+04
6.0E+04
5.0E+04
4.0E+04
3.0E+04
2.0E+04
1.0E+04
01978 1980 198, 1984 1988 1990 1992
Figure 3: Number of Adul t Spa..... ners pass ing above Willow Creek from 1978 to 1992. Hatchery Production Excluded. (Data from California Fish and Game Department).
BIBLIOGRAPHY
California Fish and Game Department. 1992. Klamath-Trinity Program. Escapment data prepared December 20, 1992.
Barta, A.F., P.R. Wilcock, and C.C. Shea. 1993. Determination of Flushing Flows for Salmonid Spawning Gravels. Third Progress Report to Southern California Edison Company. Rosemead, CA.
Frederiksen, Kamine and Associates. 1980. Proposed Trinity River Basin Fish & Wildlife Management Program. Appendix B: Sediment & Related Analysis. U.S. Bureau of Reclamation. Sacramento, CA.
Milhous, R.T. 1986. Determining Instream Flows for Flushing of Fines and Channel Maintenance A Review. in H.J. Horel-Seytoux and J.W. Warner, editors. Proceedings of the Sixth Annual AGU Front range Branch HYDROLOGY DAYS. HYDROLOGY DAYS Publications. Fort Collins, Colorado.
Hilhous R.T. 1990. The Calculation of Flushing Flows for Gravel and Cobble Bed Rivers. .in H. H. Chang and J.C. Hill editors. Hydraulic Engineering. American Society of Civil Engineers. Ne..... York, NY.
291
SpawnlruJ Year
Milhous, R.T. 1992. water and Sediment in the Middle Rio Grande Valley, New Mexico: Use of a Sediment Transport Capacity Index. .in H.J. Morelseytoux editor. proceedings of the Twelfth Annual American Geophysical Union HYDROLOGY DAYS. HYDROLOGY DAYS Publications. 57 Selby Lane. Atherton, CA.
Nelson, R.W., J.R. Dwyer, W.E. Greenberg. 1987. Regulated Flushing in a Gravel-Bed River for channel Habitat Maintenance: A Trinity River Fisheries Case study. Environmental Management. Vol.II, No.4, pp479-493. Springer-Verlag New York.
292

Proceedings
of
American Geophysical Union
Fourteenth Annual
Hydrology Days
Aprol 5·B. 1994
Coloradc State UnIversity
Fort Collins, Colorado
P Jbllshed by
HYDROLOGY DAYS PublicallOns
57 Selby Lane
Atherton California 94027·3926, USA
rei and Fax. (415) 365-40BO