
SECURITY CLASSIFICATION OF THIS PACE REPORT...
24
UNCLASSIFIED SECURITY CLASSIFICATION OF THIS PACE (When Data Entered) REPORT DOCUMENTATION PAGE READ INSTRUCTIONS BEFORE COMPLETING FORM 1. REPORT NUMBER AFGL-TR-83-0270 2. GOVT ACCESSION NO. 3. RECIPIENT'S CATALOG NUMBER 4. TITLE (end Subline) CHARACTERISTICS OF AEROSOL VOLUME DISTRIBUTIONS MEASURED AT MEPPEN, W. GERMANY 5. TYPE OF REPORT a PERIOD COVERED Scientific - Interim Scientific Report No. 4 4. TITLE (end Subline) CHARACTERISTICS OF AEROSOL VOLUME DISTRIBUTIONS MEASURED AT MEPPEN, W. GERMANY 6. PERFORMING ORG. REPORT NUMBER SIO Ref. 84-9 7. AUTMORf»; Bruce W. Fitch 8. CONTRACT OR GRANT NUMBERS) F19628-82-C-0060 t. PERFORMING ORGANIZATION NAME AND ADDRESS University of California, San Diego Visibility Laboratory La Jolla, California 92093 10. PROGRAM ELEMENT. PROJECT, TASK AREA a WORK UNIT NUMBERS 62101F 7670-14-02 II. CONTROLLING OFFICE NAME AND ADDRESS Air Force Geophysics Laboratory Hanscom AFB, Massachusetts 01731 Contract Monitor: Lt.Col. John D. Mill/OPA 12. REPORT DATE October 1983 II. CONTROLLING OFFICE NAME AND ADDRESS Air Force Geophysics Laboratory Hanscom AFB, Massachusetts 01731 Contract Monitor: Lt.Col. John D. Mill/OPA 13. NUMBER OF PAGES 28 14 MONITORING AGENCY NAME a AODRESSf' dlllerenl from Controlling Otllce) IS. SECURITY CLASS, (ot thle report) UNCLASSIFIED 14 MONITORING AGENCY NAME a AODRESSf' dlllerenl from Controlling Otllce) 15a. DECLASSIFICATION/DOWN GRADING SCHEDULE 16. DISTRIBUTION STATEMENT (ol this Report) Approved for public release; distribution unlimited. 17. DISTRIBUTION STATEMENT (ol the mbetrmct entered In Block 20, II dlllerenl from Report) 18. SUPPLEMENTARY NOTES 19. KEY WORDS (Continue on reveree elde II neeeeemry end Identity by block number) Aerosol Extinction Coefficient Atmospheric Extinction Coefficient Atmospheric Aerosols Infrared Extinction Atmospheric Optical Properties Infrared Transmittance 20. ABSTRACT (Continue on reveree elde II neeeeemry mnd Identity by Mock number) Measurements of the number and size distribution of the atmospheric aerosol were made at ground level at Meppen, W. Germany using two optical particle counters. The aerosol was measured infrequently from July, 1977, through March, 1978, over the particle radius range 0.2\-5.9(im using a Royco model 220 particle counter. A Particle Measuring System ASAS 300B aerosol particle counter measured the aerosol over a similar radius range every hour and, often, every half-hour from 14 March through 9 May, 1978. This report discusses the behavior and characteristics of the Meppen aerosol distribution compared to an extensive set of airborne measurements of the aerosol in the lower troposphere at nine sites in DD,^, 1473 EDITION Or 1 NOV 61 It OBSOLKTE 3/N 0102-014-6601 UNCLASSIFIED SECURITY CLASSIFICATION OF THIS PAOE (When Dmtm Entered)
Transcript of SECURITY CLASSIFICATION OF THIS PACE REPORT...
UNCLASSIFIED SECURITY CLASSIFICATION OF THIS PACE (When Data Entered)
REPORT DOCUMENTATION PAGE READ INSTRUCTIONS BEFORE COMPLETING FORM
1. REPORT NUMBER
AFGL-TR-83-0270 2. GOVT ACCESSION NO. 3. RECIPIENT'S CATALOG NUMBER
4. TITLE (end Subline)
CHARACTERISTICS OF AEROSOL VOLUME DISTRIBUTIONS MEASURED AT MEPPEN, W. GERMANY
5. TYPE OF REPORT a PERIOD COVERED
Scientific - Interim Scientific Report No. 4
4. TITLE (end Subline)
CHARACTERISTICS OF AEROSOL VOLUME DISTRIBUTIONS MEASURED AT MEPPEN, W. GERMANY
6. PERFORMING ORG. REPORT NUMBER
SIO Ref. 84-9 7. AUTMORf»;
Bruce W. Fitch
8. CONTRACT OR GRANT NUMBERS)
F19628-82-C-0060
t . PERFORMING ORGANIZATION NAME AND ADDRESS
University of California, San Diego Visibility Laboratory La Jolla, California 92093
10. PROGRAM ELEMENT. PROJECT, TASK AREA a WORK UNIT NUMBERS
62101F 7670-14-02
II. CONTROLLING OFFICE NAME AND ADDRESS Air Force Geophysics Laboratory Hanscom AFB, Massachusetts 01731 Contract Monitor: Lt.Col. John D. Mill/OPA
12. REPORT DATE
October 1983 II. CONTROLLING OFFICE NAME AND ADDRESS
Air Force Geophysics Laboratory Hanscom AFB, Massachusetts 01731 Contract Monitor: Lt.Col. John D. Mill/OPA
13. NUMBER OF PAGES
28 14 MONITORING AGENCY NAME a AODRESSf' dlllerenl from Controlling Otllce) IS. SECURITY CLASS, (ot thle report)
UNCLASSIFIED
14 MONITORING AGENCY NAME a AODRESSf' dlllerenl from Controlling Otllce)
15a. DECLASSIFICATION/DOWN GRADING SCHEDULE
16. DISTRIBUTION STATEMENT (ol this Report)
Approved for public release; distribution unlimited.
17. DISTRIBUTION STATEMENT (ol the mbetrmct entered In Block 20, II dlllerenl from Report)
18. SUPPLEMENTARY NOTES
19. KEY WORDS (Continue on reveree elde II neeeeemry end Identity by block number)
Aerosol Extinction Coefficient Atmospheric Extinction Coefficient Atmospheric Aerosols Infrared Extinction Atmospheric Optical Properties Infrared Transmittance
20. ABSTRACT (Continue on reveree elde II neeeeemry mnd Identity by Mock number)
Measurements of the number and size distribution of the atmospheric aerosol were made at ground level at Meppen, W. Germany using two optical particle counters. The aerosol was measured infrequently from July, 1977, through March, 1978, over the particle radius range 0.2\-5.9(im using a Royco model 220 particle counter. A Particle Measuring System ASAS 300B aerosol particle counter measured the aerosol over a similar radius range every hour and, often, every half-hour from 14 March through 9 May, 1978. This report discusses the behavior and characteristics of the Meppen aerosol distribution compared to an extensive set of airborne measurements of the aerosol in the lower troposphere at nine sites in
D D , ^ , 1473 EDITION Or 1 NOV 61 I t OBSOLKTE 3/N 0102-014-6601
UNCLASSIFIED SECURITY CLASSIFICATION OF THIS PAOE (When Dmtm Entered)

UNCLASSIFIED SECURITY CLASSIFICATION OF THIS PAGE (When Data Entered)
20. ABSTRACT continued:
Europe, including Meppen, and the use of local meteorological observations to estimate the local particle size distribution.
Volume distribution plots and the results of a model fit using log-normal distributions show good agreement between the airborne and ground data sets. Both data sets show three volume modes, each well fit by a log-normal distribution. The behavior and values of the log-normal fit parameters for the accumulation and middle modes are in good agreement between the two data sets. The greater frequency of occurrence and, generally, bigger size of the ground coarse modes compared to the airborne coarse modes indicates a larger average particle number concentration for the ground measured modes.
The data show that each of the three modes is not equally affected by changes in relative humidity. The middle mode is the most sensitive and the coarse mode is the least sensitive. It appears that the relative humidity sensitive middle mode must be present for the formation of a mist or fog. Local meteorological conditions which produce high humidity, however, do not always insure the presence of an aerosol necessary for the formation of a mist or fog. When present, the middle mode can occur with or without the accumulation and coarse particle modes. It is anticipated that as the more complete aerosol/meteorology data base becomes available, the task of describing the aerosol distribution based on meteorological observations will be continued.
UNCLASSIFIED SECURITY CLASSIFICATION OF THIS P A G E O W I M I Dele Entered)

AFGL-TR-83-0270 SIO 84-9
CHARACTERISTICS OF AEROSOL VOLUME DISTRIBUTIONS MEASURED AT MEPPEN, W. GERMANY
Bruce W. Fitch
Visibility Laboratory University of California, San Diego Scripps Institution of Oceanography
La Jolla, California 92093
Approved:
Roswell W. Austin, Director Visibility Laboratory
Approved ^ _
William A Nierenberg, Director Scripps Institution of Oceanography
CONTRACT NO. F19628-82-C-0060 Project No. 7670
Task No. 7670-14 Work Unit No. 7670-14-02
Scientific Report No. 4 August 1983
Contract Monitor Lt. Col. John D. Mill, Atmospheric Optics Branch, Optical Physics Division
Approved for public release; distribution unlimited.
Prepared for
AIR FORCE GEOPHYSICS LABORATORY AIR FORCE SYSTEMS COMMAND
UNITED STATES AIR FORCE HANSCOM AFB, MASSACHUSETTS 01731

SUMMARY
Measurements of the number and size distribution of the atmospheric aerosol were made at ground level at Meppen, W. Germany using two optical particle counters. The aerosol was measured infrequently from July, 1977, through March, 1978, over the particle radius range 0.21-5.9^m using a Royco model 220 particle counter. A Particle Measuring System ASAS 300B aerosol particle counter measured the aerosol over a similar radius range every hour and, often, every half-hour from 14 March through 9 May, 1978. This report discusses the behavior and characteristics of the Meppen aerosol distribution compared to an extensive set of airborne measurements of the aerosol in the lower troposphere at nine sites in Europe, including Meppen, and the use of local meteorological observations to estimate the local particle size distribution.
Volume distribution plots and the results of a model fit using log-normal distributions show good agreement between the airborne and ground data sets. Both data sets show three volume modes, each well fit by a log-normal distribution. The behavior and values of the log-normal fit parameters for the accumulation and middle modes are in good agreement between the two data sets. The greater frequency of occurrence and, generally, bigger size of the ground coarse modes compared to the airborne coarse modes indicates a larger average particle number concentration for the ground measured modes.
The data show that each of the three modes is not equally affected by changes in relative humidity. The middle mode is the most sensitive and the coarse mode is the least sensitive. It appears that the relative humidity sensitive middle mode must be present for the formation of a mist or fog. Local meteorological conditions which produce high humidity, however, do not always insure the presence of an aerosol necessary for the formation of a mist or fog. When present, the middle mode can occur with or without the accumulation and coarse particle modes. It is anticipated that as the more complete aerosol/meteorology data base becomes available, the task of describing the aerosol distribution based on meteorological observations will be continued.
•v-

TABLE OF CONTENTS
SUMMARY v
LIST OF TABLES AND ILLUSTRATIONS ix
1.0 INTRODUCTION 1
2.0 AEROSOL SAMPLING SYSTEMS 1
2.1 Royco System 1 2.2 PMS System 2 2.3 Royco-PMS Intercomparison 3
3.0 RESULTS OF ROYCO MEASUREMENT 3
3.1 Accumulation Mode 5 3.2 Coarse Particle Mode 6 3.3 Middle Mode 6 3.4 Combinations of the Modes 7
4.0 RESULTS OF PMS MEASUREMENT 8
5.0 A CASE STUDY 11
6.0 SUMMARY AND CONCLUSIONS 15
7.0 ACKNOWLEDGEMENTS 15
8.0 REFERENCES 16
-vn-

LIST OF TABLES AND ILLUSTRATIONS
Table No. Page
3.1 The occurrence of different mode combinations 7 3.2 Different mode combinations vs relative humidity 8
4.1 Volume concentration V, vs relative humidity 10 4.2 Volume concentration V2 vs relative humidity 10 4.3 Volume concentration V, vs wind direction 11 4.4 Volume concentration V2 vs wind direction 11
6.1 Summary of the volume mode parameters 15
Fig. No. Page
1-1 Project OPAQUE flight tracks and ground sites 1
2-1 Diagram of Royco 220 detector 2 2-2 Royco 220 installation schematic 3 2-3 Diagram of PMS ASAS 300B detector 3
3-1 Volume distribution sampled on 1 Dec and 23 Aug 4 3-2 Volume distribution sampled on 4 Nov and 7 Mar 4 3-3 Maximum volume in accumulation mode vs standard deviation 5 3-4 Maximum volume in accumulation mode vs mode radius 5 3-5 Maximum volume in accumulation mode vs relative humidity 6 3-6 Maximum volume in middle mode vs standard deviation 6 3-7 Maximum volume in middle mode vs mode radius 7
4-1 Volume distribution sampled on 8 May 8 4-2 Volume distribution sampled on 25 Mar 8 4-3 Volume distribution sampled on 17 Apr at 1400 and 2400 hrs 9 4-4 Volume concentration Vi vs time of day 10 4-5 Volume concentration V2 vs time of day 10 4-6 Volume concentration V, vs relative humidity 10 4-7 Volume concentration V2 vs relative humidity 10
5-1 Aerosol and meteorological parameters for ten days 12 5-2 Volume distribution sampled between 4 Mar & 13 Mar 14
-IX-

CHARACTERISTICS OF AEROSOL VOLUME DISTRIBUTIONS MEASURED AT MEPPEN, W. GERMANY
Bruce W. Fitch
1.0 INTRODUCTION In the increasingly sophisticated world of electro-
optical detection, search and guidance, it has become an operational necessity to predict the atmospheric optical environment and the behavior of the contributing atmospheric constituents. In support of this goal the Visibility Laboratory, in cooperation with and under the sponsorship of the Air Force Geophysics Laboratory, has been a primary participant in an extensive program [Johnson (1981) and Johnson and Hering (1981)] to measure and model the atmosphere in conjunction with the NATO program OPAQUE (Optical Atmospheric Quantities in Europe). This report presents and discusses the characteristics and behavior of aerosol number and size distributions measured at the NATO ground station at Meppen, W. Germany.
Fig. 1-1. Sites of OPAQUE ground stations and flight tracks.
The OPAQUE plan is a collaborative research effort by eight NATO countries to document the atmospheric optical properties in western and central Europe. The foundation of this program was the development of a data base of all the parameters pertinent to image propagation and the transmission of visible and infrared radiation in the atmosphere. This data was gathered through an extensive program of airborne and ground based optical and meteorological measurements.
As part of the research effort, the U.S., in cooperation with the FRG, maintained and operated a ground station at Meppen, Federal Republic of Germany, whose location is shown in Fig. 1-1. The station is located in a topographically flat area surrounded by agricultural fields which provide the only major industry for the surrounding area. The measurements made at the site fall into three major categories: (1) Optical/IR, described by Shields (1981), (2) Meteorological and (3) Aerosol. In this report, the aerosol size and number distributions measured with two separate instruments from March through May, 1978 are discussed. The characteristics of the aerosol distributions, as they appear in a volume display, are analyzed as a function of relative humidity, wind direction and wind speed.
2.0 AEROSOL SAMPLING SYSTEMS Two commercially available aerosol sampling sys
tems were used to measure the aerosol number and size distribution at the Meppen ground site. One system is based on a Royco 220 Single Particle Counter and the other on a Particle Measuring System (PMS) ASAS 300B aerosol particle counter. Each of these two systems, with their individual strengths and weaknesses, complements the other.
2.1 Royco System The entire Royco system consists of a Royco 220
particle counter, a one-hundred channel Technical Measurement Corporation Model 102 Gamma Scope II Pulse Height Analyzer (PHA), a clock/printer and an intake manifold system. The Royco 220, diagrammed in Fig. 2-1, is a right-angle scattering counter which uses a tungsten light source and a photomultiplier detector to size individual aerosol particles over the radius range 0.21 to 5.9/xm. A chopper and light pipe subassembly, together with the use of submicrometer size polystyrene spheres, both provide calibration. As shown in the lower right of
-1-

CONDENSATION LENS
PHOTOMULTIPLIER
.->f5>
LAMP
CHOPPER MOTOR
Fig. 2-1. Diagrammatical representation of the Royco 220 detector subassembly.
the figure, the effective illuminated volume, through which the individual particles must pass to be counted, is 2.63 mm3- The optimum flow rate of the ambient air through the detector is 46.7 cc/sec. There are two fundamental sources of error inherent in the Royco system. The first is an inadequate knowledge of the index of refraction of the ambient aerosol and the second is possible modifications to the particle size distribution which may occur in the plumbing between the ambient air and the counter. •
Investigations by Cooke and Kerker (1975) and Quenzel (1969) have demonstrated that significant errors in the determination of particle size can occur when the refractive index m of the particles is not known. Assuming a calibration with polystyrene-latex spheres (m = 1.58-O.Oi), Quenzel (1969) found that a maximum sizing error of a factor of 2.4 could occur when measuring carbon particles (m = 1.95-0.660 over the particle radius range 0.1 to 3.0/j.m. If the refractive index of water (m = 1.33-O.Oi) or an average atmospheric aerosol (m = 1.50-O.Oi) is used, the sizing error is less than a factor of 2.0. A value of m = 1.50-0.02i, that includes absorption, produces a sizing error that increases with increasing particle radius. The magnitude of the error was difficult to determine from Fig. 2 of Quenzel (1969) but its maximum is estimated to be a factor of about 2 to 3.
The physical properties of the ambient aerosol sample may have been modified in its passage from the free
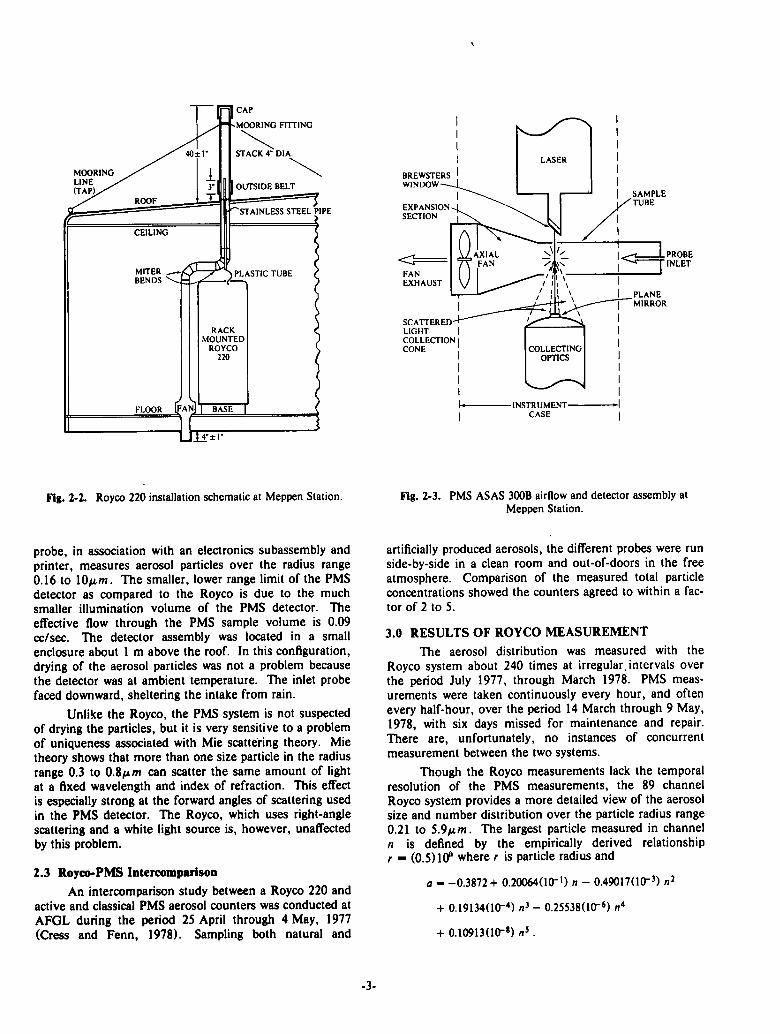
atmosphere to inside the trailer which houses the counter. The path followed by the aerosol to the Royco is schematically represented in Fig. 2-2. The aerosol enters the intake system through a 10 cm diameter stack which was designed to provide turbulent flow and thus minimize inertial separation and loss of particles. The fan at the base of the large diameter intake system provides air to the stainless steel Royco sampling probe at a flow matched to the Royco pumps. This flow matching produces a nearly isokinetic, isoaxial sampling of the aerosol which, once inside the stainless steel probe, flows at a fairly constant velocity to the counter.
Possible modification to the aerosol samples may have resulted from a partial drying of the particles as they transited the intake piping, located inside the warmed trailer. It was necessary to maintain a controlled temperature inside the trailer to stabilize the temperature sensitive PHA. Thus, aerosols whose growth and size are strongly dependent on relative humidity may have been partially dried during their time of residence in the intake, about 1.8 sec. The magnitude of this effect is not known, though the shape of the distributions was probably preserved due to the small size range measured.
2.2 PMS System
The PMS ASAS 300B detector, as diagrammed in Fig. 2-3, is a forward scattering single particle counter using a 5 mW He-Ne laser for illumination. The detector
- 2 -
*
Fig. 2-2. Royco 220 installation schematic at Meppen Station.
probe, in association with an electronics subassembly and printer, measures aerosol particles over the radius range 0.16 to lOfim. The smaller, lower range limit of the PMS detector as compared to the Royco is due to the much smaller illumination volume of the PMS detector. The effective flow through the PMS sample volume is 0.09 cc/sec. The detector assembly was located in a small enclosure about 1 m above the roof. In this configuration, drying of the aerosol particles was not a problem because the detector was at ambient temperature. The inlet probe faced downward, sheltering the intake from rain.
Unlike the Royco, the PMS system is not suspected of drying the particles, but it is very sensitive to a problem of uniqueness associated with Mie scattering theory. Mie theory shows that more than one size particle in the radius range 0.3 to O.&pm can scatter the same amount of light at a fixed wavelength and index of refraction. This effect is especially strong at the forward angles of scattering used in the PMS detector. The Royco, which uses right-angle scattering and a white light source is, however, unaffected by this problem.
2.3 Royco-PMS Intercomparison An intercomparison study between a Royco 220 and
active and classical PMS aerosol counters was conducted at AFGL during the period 25 April through 4 May, 1977 (Cress and Fenn, 1978). Sampling both natural and
INSTRUMENT-CASE
Fig. 2-3. PMS ASAS 300B airflow and detector assembly at Meppen Station.
artificially produced aerosols, the different probes were run side-by-side in a clean room and out-of-doors in the free atmosphere. Comparison of the measured total particle concentrations showed the counters agreed to within a factor of 2 to 5.
3.0 RESULTS OF ROYCO MEASUREMENT The aerosol distribution was measured with the
Royco system about 240 times at irregular, intervals over the period July 1977, through March 1978. PMS measurements were taken continuously every hour, and often every half-hour, over the period 14 March through 9 May, 1978, with six days missed for maintenance and repair. There are, unfortunately, no instances of concurrent measurement between the two systems.
Though the Royco measurements lack the temporal resolution of the PMS measurements, the 89 channel Royco system provides a more detailed view of the aerosol size and number distribution over the particle radius range 0.21 to S.9nm. The largest particle measured in channel n is defined by the empirically derived relationship r — (0.5)10^ where r is particle radius and
a - -0.3872+ 0.20O64U0-1) n - 0.49017(l<r3) n2
+ 0.19134U0-4) n3 - 0.25538UO-6) «4
+ 0.10913(10-*) n5 .
-3-
The lower radius limit of the first channel is defined by setting n=0. The sampling time of the Royco was 10 minutes and the flow of the sample air through the sample volume was 47 cc/sec.
Typically, size distribution data has been presented in figures of \og(dN/ dlogr) versus logr where N is the total number density of particles smaller than radius r. Such a display, therefore, represents the number of particles counted in a particular bin per cc of sampled air, dN, divided by the log interval of the bin, rflog/% versus the log of the mean radius of the channel. The measured distributions are often compared to a model size distribution such as the power-law formula developed by Junge (1963): dN I d\ogr = cr~p where c is a constant depending on the total number of particles and /3 is estimated to be about 3 for particle radii between 0.3 and 10fim (Junge and Jaenicke, 1971).
Departures of the measured size distribution from the power-law distribution appear small on the four or five log-cycles traditionally used in figures of aerosol number distribution. These small departures were found, however, to yield multi-mode curves when the data were plotted as volume (or mass) versus particle size, as pointed out by Whitby et al. (1972), Shettle (1975) and demonstrated for an extensive airborne data set by Fitch and Cress (1981 and 1983). The airborne data were taken within the lower troposphere at nine sites in western Europe, including Meppen.
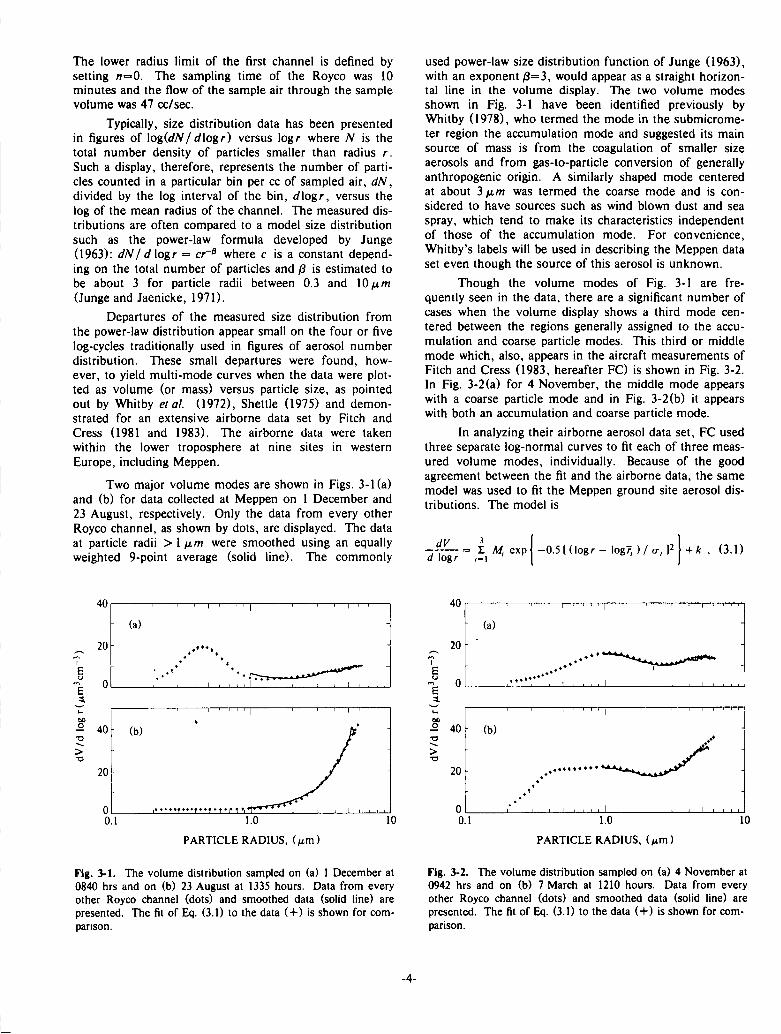
Two major volume modes are shown in Figs. 3-1 (a) and (b) for data collected at Meppen on 1 December and 23 August, respectively. Only the data from every other Royco channel, as shown by dots, are displayed. The data at particle radii > 1 fim were smoothed using an equally weighted 9-point average (solid line). The commonly
used power-law size distribution function of Junge (1963), with an exponent /3=3, would appear as a straight horizontal line in the volume display. The two volume modes shown in Fig. 3-1 have been identified previously by Whitby (1978), who termed the mode in the submicrome-ter region the accumulation mode and suggested its main source of mass is from the coagulation of smaller size aerosols and from gas-to-particle conversion of generally anthropogenic origin. A similarly shaped mode centered at about 3 ixm was termed the coarse mode and is considered to have sources such as wind blown dust and sea spray, which tend to make its characteristics independent of those of the accumulation mode. For convenience, Whitby's labels will be used in describing the Meppen data set even though the source of this aerosol is unknown.
Though the volume modes of Fig. 3-1 are frequently seen in the data, there are a significant number of cases when the volume display shows a third mode centered between the regions generally assigned to the accumulation and coarse particle modes. This third or middle mode which, also, appears in the aircraft measurements of Fitch and Cress (1983, hereafter FC) is shown in Fig. 3-2. In Fig. 3-2 (a) for 4 November, the middle mode appears with a coarse particle mode and in Fig. 3-2(b) it appears with both an accumulation and coarse particle mode.
In analyzing their airborne aerosol data set, FC used three separate log-normal curves to fit each of three measured volume modes, individually. Because of the good agreement between the fit and the airborne data, the same model was used to fit the Meppen ground site aerosol distributions. The model is
— r—= I M, exp -0.5[(logr- log?, )/o-, P d log/- ,-i [ + k , (3.1)
E 4
40
20
- (a)
, i n ,
* •
| 1 1 1 1
-- (a)
, i n ,
* •
1 1 1
| 1 1 1 1
-
0.1
I— so o
—. >
40 " (b)
' 1 i i | i i i i
•o
20 /
0 , „ „ f „ . t „ f , t , M , i 1 r » T l T i | l
1.0
PARTICLE RADIUS, (ixm)
10
E 4
20
0
CO
1 1 1 | 1 1 1 1 | 1 1 1 | 1 1 1 1
t_ 1 1 1 | 1 1 1 1 | 1 1 1 | 1 1 1 1
00
.0
•o >
40 " (b) J •o
20
0
* •
0.1 1.0
PARTICLE RADIUS, (/im)
10
Fig. 3-1. The volume distribution sampled on (a) 1 December at 0840 hrs and on (b) 23 August at 1335 hours. Data from every other Royco channel (dots) and smoothed data (solid line) are presented. The fit of Eq. (3.1) to the data (+) is shown for comparison.
Fig. 3-2. The volume distribution sampled on (a) 4 November at 0942 hrs and on (b) 7 March at 1210 hours. Data from every other Royco channel (dots) and smoothed data (solid line) are presented. The fit of Eq. (3.1) to the data (+) is shown for comparison.
-4-

where k is a constant, o- the standard deviation, 7, the mode radius and M the value of dVI d\o%r occurring at the mode radius. The values i — 1 - 3 refer to the accumulation, middle and coarse modes, respectively. The quantity M may be expressed as M— V/ [<r(2ir)V2], where V is the total particle volume concentration of the mode. To visualize easily the character of the entire volume distribution, the value M was used instead of the equivalent expression containing V. The least-squares fit of Eq. (3.1) to the volume distributions was performed using the algorithm of Marquardt (Bevington, 1969).
The efficacy of Eq. (3.1) in fitting the volume modes is demonstrated by the close agreement between the data and the fit (plus marks) shown in Figs. 3-1 and 3-2. The values of the coefficient of determination for Figs. 3-1 (a), 3-Kb), 3-2(a) and 3-2(b) are 0.98, 1.0, 0.98 and 0.98, respectively. The average value of the coefficient for all the fitted modes is 0.97, indicating the fit explains 97% of the variance. Similar to the aircraft data, an examination of the fitted data reveals two major sources of unexplained variation. The first source is deviations between irregularities of a coarse particle mode curve and the fitted log-normal distribution. These irregularities probably represent sampling uncertainties due to small particle counts, which can make the coarse mode appear prominent because of volumes r} dependence. The coarse particle concentrations are generally much larger for the ground data than for the aircraft data which may explain the larger average value of the coefficient of determination for the Meppen ground data, 0.97, compared to the aircraft data, 0.91. The second source of unexplained variation is the consistent overestimation of the data in the first six to eight Royco channels by the log-normal fit. If the overestimation is a result of a modification to the aerosol distribution by the Royco system, then the cause must be
common to both ground and airborne systems because the overestimation appears in both data sets.
3.1 Accumulation Mode
The accumulation mode is heavily influenced by anthropogenic aerosols, and dominates scattering of visible radiation. The results of Fitch and Cress (1981 and 1983) indicate that this mode is well fit by a log-normal distribution and that the fit parameters behave predictably.
The airborne data show a fairly narrow distribution of the values o-i about the average value 0.11, suggesting that <T\ may be a constant. Similarly, Fig. 3-3 shows a narrow distribution of the values o-\ as a function of the corresponding value of M\ for the Meppen ground data. A symmetric distribution is indicated since the average, 0.141, is close in value to the median, 0.146. To eliminate modes artificially created by the fitting routine, cases where A/i is <0.5/xm3cm~3 and7| is <0.25fxm - the fifth Royco channel - are ignored.
Analysis of the airborne data indicated that there is a functional relationship between the fit parameters M\ and 7\. The values of M\ and 7\ for the Meppen ground data are shown in Fig. 3-4. The data in the figure, which show increasing values of M\ with increasing values of 7], are fit fairly well by a straight line. The regression line (solid line) was fit to the data using the least-squares criterion and explains 79% of the observed variation in the values of 7\ from the values of M\. In comparison, a straight line explains 89% of the variation observed in the airborne data from all of western Europe. A possible reason for the better fit of the line to the airborne data is that the airborne accumulation mode generally appears alone while the Meppen ground accumulation mode generally appears overlapped with another volume mode, making the fit of Eq. (3.1) less precise.
0:05 0.10 0.15 0.20 0.25 STANDARD DEVIATION, o-,
0.30 0.2 0.4 0.6 PARTICLE RADIUS, r, (fxm)
Fig. 3-3. The maximum volume concentration Mx as a function of the standard deviation <ri for the accumulation mode.
Fig. 3-4. The maximum volume concentration M\ as a function of the mode radius 7\ for the accumulation mode. A straight line fit to the data (solid line) and the r3 dependence of A/, (dashed line) are shown for comparison.
-5-

The linearity of the data distribution shown in Fig 3-4, like that for the airborne data, is a result of opposing trends in 7? and dN / d log r, upon which M\ depends The dashed line in the figure is a curve of the values A/, = (4/3)7r 7? 185, which depicts the rj* dependence of M\ for a fixed value of dN/d\o%r = 185 particles cm-3
In contrast, a plot of the trend in the values of dN I d logr shows an opposite curvature (not shown)
Relative humidity shows a tendency to be high for the larger values of M\ Figure 3-5 shows values of M\ plotted against the value of relative humidity measured within 1/2 hour of the aerosol sample The preference shown in the figure for the relative humidity to be ^ 75% when Mi ^ 20fxmicm~i has a probability of < 0 001 of occurring in a random sample The aircraft measured accumulation mode shows no relative humidity preference The difference in relative humidity preference between the two data sets may be due to a partial drying of the aerosol by the aircraft sampling system
3.2 Coarse Particle Mode Another significant volume mode appearing in the
volume distribution plots is the coarse particle mode This mode exists in the size range from about 3ixm to beyond 5 9ixm, the last channel of the fitted Royco data Often, the upper particle size limit of the Royco did not allow the complete shape of the coarse mode to be viewed This may explain the lack of a clear dependence between the coarse mode fit parameters The large spread in the data, however, may well be masking a relationship between these fit parameters The average values of o-3 and 73 for the fitted data are 0 33 and 8 3fxm, respectively There is little skew in the distribution of these parameters as the median values of o-3 and 73 are 0 32 and 8 2/im Aerosol samples collected during periods of rain and where A/3 < 5ixmicm~i were ignored There may be more cases of rain than the 14 shown in the data because the rain rate
80
60
I
E O
"g 40 a.
20
O l ' 1 i 1 — . 1
50 60 70 80 90 100 RELATIVE HUMIDITY, (%)
Fig. 3-5. The maximum volume concentration Mx as a function of relative humidity
channel was operational for only 10% of the coarse mode observations The AWS climatic briefs (1982) show that at Ahlhorn, a station within 15-20 km of Meppen, rain or drizzle occurs with a frequency of 7-24% during the months the Royco was in operation
Comparison of the values of the log-normal fit parameters shows that the Meppen ground coarse mode is generally larger than the airborne coarse mode The maximum value of Mi seen in the ground data is I62ixm3 cm~3 with an average value of 40ixm3 cm~3 For the airborne data, the maximum value of A/3 is 50fxm3cm~3 and the average is \6fxm3cm~3 Like the airborne data, the ground coarse mode particles do not show a preference for high values of relative humidity These data were, however, generally collected near midday The PMS data, which were collected every hour throughout the day, show a strong relative humidity preference for particles in both the accumulation and coarse mode size ranges
3.3 Middle Mode A volume mode exists between the two regions gen
erally associated with the accumulation and coarse particle modes This third or middle mode also appears in the volume distribution plots of the aircraft data as shown by FC The values of the fit parameter Af2 for this mode are plotted in Fig 3-6 with the corresponding values of o-2 for the Meppen ground data The standard deviation o-2 for the middle mode is broadly but evenly distributed around the average value of o-2, which is 0 27 The median value is 0 26 To reduce the influence of errors associated with low particle counts, only values of M2> 1 5ixm3cm~3 are presented False middle modes caused by deviations between the log-normal fit to either an accumulation or coarse particle mode were reduced by ignoring cases where the value A/2 was < 20% of the value M for the accumulation or coarse modes when present
300
- 200-I
E O
E 4
2 100
n l , , • , -. ' ,~- -1 •_. , , 1 01 02 03 04 05
STANDARD DEVIATION, <r2
Fig. 3-6. The maximum volume concentration A/2 as a function of the standard deviation <r2 for the middle mode Values of M2 > 100/im3cm~3 are all from 4 March
-6-

Comparison of the M values in Figs. 3-3 and 3-6 shows that the values M2 for the middle mode can be as large and, sometimes, larger than the values M\ for the accumulation mode. Figure 3-6 shows that the values of Mi are < 3Sixm3cm~3 for all but eleven samples which range from 109 to 249fxm3cm~3. It appears that the eleven samples, all taken on 4 March, 1978, over a 4.5 hour period centered around local noon, represent the actual ambient aerosol and are not the result of an instrument anomaly. For seven of the samples, near simultaneous measurements of the volume extinction coefficient in the photopic wavelength band and the transmission in the 3.4-5/im band are available. These seven points represent episodes of distinctly reduced transmission and enhanced extinction as compared to the rest of the data set. The average value of <r2 for the eleven points is 0.20.
Figure 3-7 presents values of M2 and 72 for the Meppen ground data. The average value of 72 for the data is the same as the median value, which is l.l/*m. A strong relationship between M2 and 72 is shown in Fig. 3-7 for the eleven values. The dashed line in the figure is a hand fit of the curve M2 = (4/3)n 72 36, which depicts the r dependence of M2 for a fixed value of dN/d\ogr = 36 particles cm~3. The close agreement between the dashed line and the data indicates that the size of the aerosol particles changed with relative humidity while the number concentration remained constant. Relative humidity was 91% for the values of M2 > 200ixm3cm~3 and about 85% for M2 = \60fim3cm~3. The narrow distribution of o-2 for these eleven points, as previously shown in Fig. 3-6, indicates that the aerosol composition was homogeneous and sufficiently narrow to preserve the shape of the mode even as particle size decreased with relative humidity. The entire middle mode data set shows no tendency for relative humidity to be high for the larger values of 72. This may be the result of variations in dN/d\ogr between samples.
3.4 Combinations of the Modes In this section, the frequency in the data base of
various combinations of the modes and their relative humidity preference is discussed. The second column of Table 3.1 presents the number of times the different mode combinations appear in the volume distributions of the ground data set. Each of the possible combinations are labeled using a, m or c to denote the accumulation, middle, or coarse particle modes, respectively. The label none refers to the absence of a discernible mode (Mx < 0.5fim3cm~3, 7, < 0.25/xm, M2 < \.5ixm3cmT3, and Mi < 5fxm3cm~3). The percent of the total number of samples each combination represents for the ground data set appears in the third column under the label %. Examination of the third column shows that the combinations o, a-m, m and none rarely occur. Of the individual mode combinations, a-c and a-m-c show the greatest frequency of occurrence. Combinations containing the coarse particle mode, which include a-c, m-c, a-m-c and c, dominate the data set, accounting for 92% of the measured distributions. Of all the individual volume modes, the middle mode occurs less frequently, appearing in only 47% of the data.
The fourth column of Table 3.1 shows the frequency of occurrence of the mode combinations in the Meppen airborne data. The airborne data were taken during November, 1976; August, 1977; March, 1978; and August, 1978. Comparison of the third and fifth columns of the table shows that the accumulation mode appears with fairly equal frequency in the ground data, 63%, as in the airborne data, 74%. The frequency of occurrence of the middle mode is probably not greatly different between the ground data at 47% and the airborne data at 30% when the sampling biases are considered. The frequency of the coarse mode in the ground data at 92% is, however, more than 3.5 times that found in airborne data, which is 25%.
250
/
~ 200 t i
E ^ 150 4
S 100
i i
/ / / / 9'
50 -
0 0.5 1.0 1.5 2.0
PARTICLE RADIUS, r2 (Mm) 2.5
Table 3.1. The' occurrence of different combinations of the modes for the Meppen ground station and the Meppen airborne data. Modes: a, accumulation; m, middle, c, coarse
Modes Meppen (ground) Meppen (airborne)
Modes Number % Number %
a 5 2 24 41 a-m 1 0 7 12 a-c 64 30 8 14 m 8 4 5 9
m-c 25 12 1 2 a-m-c 65 31 4 7
c 41 19 1 2 none 4 2 8 14
Total 213 58
Fig. 3-7. The maximum volume concentration M2 as a function of the mode radius 72 for the middle mode. The r3 dependence of M2 (dashed line) is shown for comparison.
The large difference in the frequency of occurrence and size of the coarse mode between the ground and airborne data sets suggests that the coarse particles are not always
-7-

uniformly distributed within the mixed layer. It is possible that the coarse particles are locally produced or modified and, therefore, not always well distributed within the mixed layer. In contrast, the accumulation and middle mode particles are probably advected in from an industrial/urban or maritime environment and, therefore, are more evenly distributed as shown by comparison of the two data sets.
Table 3.2 shows the number of occurrences of the different combinations of the modes for relative humidity ^ and < 70%, the value used in the analysis of the airborne data. The total number of combinations in Table 3.2 is less than in Table 3.1, since for some samples no value of relative humidity is available. Combinations containing the middle mode show a preference for values of relative humidity >70%, as was similarly seen in the aircraft data. The coarse mode in combinations of a-c and c shows a tendency to exist at the lower values of relative humidity which though not as strong, again, agrees with the preference seen in the aircraft data. The number of occurrences shown for the individual combinations a, a-m, m and none are too small to show a pattern.
4.0 RESULTS OF PMS MEASUREMENT Frequent sampling of the ambient aerosol with the
PMS system produced a data set with sufficient temporal resolution for persistence studies and comparison with meteorological parameters. The PMS ASAS 300B probe used in the sampling program operates over four selectable ranges of particle radii: 0.16-0.38, 0.25-1.38, 0.5-6.13 and 1.0-10.0/xm. Each of these ranges is composed of 15 equally spaced accumulator channels. The particle counting time was initially 128 sec for each of the ranges but was later changed to 128, 256, 512 and 1024 sec respectively, to compensate for the often small particle concentrations found at the larger particle sizes. For this early data set, though, 128 sec was used throughout.
This section presents data from the middle two ranges only, as particle counts in the first and fourth ranges were too low to be useful. When the aerosol particle counts for the second and third ranges are assumed in the order listed above, there is poor agreement in the
Table 3.2. The occurrence of different combinations of the modes as a function of relative humidity for the Meppen ground station data.
Modes RH<70%
Number
RH»70%
Number
a 0 2 a-m 0 0 a-c 24 9 m 0 3
m-c 5 8 a-m-c 6 21
c 10 8 none 0 2
region of overlap (0.5-1.38/*m). The agreement in the region of overlap is greatly improved, however, when the order of the data on the computer generated magnetic tape is assumed to be in reverse order as listed above. Unfortunately, there are no cases of concurrent sampling between the Royco and PMS systems to provide a check. For this report, it is assumed the data on our tape is in reverse order as listed above.
1U" Z 1 1 1 1 1 — 1 1 | " i i i | I I I i :
105 _- ' -
- ~
?" 10" E O
E
3io3
o \ /vfl :
•o
> 102
•o r^A <-V
10' l • -
10° , 1 1 1 1 1 1 1 1 1 .._! 1 1_ I l l l l
0.1 1.0
PARTICLE RADIUS, (fxm)
10
Fig. 4-1. The volume distribution sampled at Meppen on 8 May at 1500 hours.
IU"
105
= 1 1 1 1 1—1 1 1 | 1 1 1 | i I i i :
7* 104 r ^ \ ^ E e*%fr^ \ U
J9^ \ B JT 1
3io 3 jr -r : OO *+ -O j -
-o j * -> 102 r -•o
- -i
101 r -=
10° • i i l i i i i 1 i i i ._!_ 1 1 1 1
0.1 1.0
PARTICLE RADIUS, (Mm)
10
Fig. 4-2. The volume distribution sampled at Meppen on 25 March at 0550 hours.

A volume distribution plot of the PMS data for the second and third ranges appears in Fig. 4-1. These data were taken on 8 May at 1500 hrs when relative humidity was about 52% and the total volume scattering coefficient measured in the photopic was about 0.35km~K As shown in the figure, the particle size range covered by the second and third ranges of the PMS system is very close to that of the Royco. Despite the coarse size resolution of the PMS system, the data curves of Fig. 4-1 show what appear to be accumulation and coarse particle volume (mass) modes. Note that in this figure of the PMS data, dV/ dlogr is plotted on a log scale while for the Royco data a linear scale is used. A log scale is needed in displaying the PMS data because values of dV/dlogr can vary over several decades. Figure 4-2 shows a volume distribution measured on 25 March at 0550 hrs at which time, the relative humidity was >90% and the scattering coefficient was >2km~x. The absence of a relative humidity dependence in the Royco coarse mode data is probably the result of a time of sample bias. The Royco data was generally collected in the late morning or early afternoon, while the PMS data was collected at least every hour during the entire day. The variation in the magnitude of the volume concentration for different meteorological conditions will be discussed in more detail later.
The agreement between the two ranges in the region of overlap is good for Figs. 4-1 and 4-2 but in some cases, the curves can differ by a factor of 5 and, sometimes, a factor of 10. Figure 4-3 (a) for 17 April shows a case of poor agreement that 10 hours later was greatly diminished, as seen in Fig. 4-3 (b). In another example, on 25 March (not shown) an agreement as good as that shown in Fig. 4-3(b) degenerated to a factor of 2 disagreement 2.5 hours later. For all of these cases, the particle counting time is shown to be a constant of 128 sec. The difference between the total particle volume concentration of the two curves in the region of overlap is less than the volume concentration in the region of overlap for range 1 (submi-crometer range) for 99% of the data, less than half its volume for 76% of the data, and less than a quarter of its volume for 19% of the data. The coarse size resolution and overlap between the two ranges in the region of the middle mode makes it difficult to see any of the three volume modes in the PMS data. For this reason, the particle volume integrated over the range 0.25 to \fim (Vi) and 1 to 6iim (V2) was used in the analysis of the PMS data.
The total particulate volume concentrations V\ for all of the PMS data, except known instances of rain, are presented in Fig. 4-4 with time of day. The figure shows that large values of V\ are biased toward the early morning and late night hours. Out of 149 cases of K, > Idl3ixm3 cm~3, only 5 occur from 1100 to 1900 hours.
Figure 4-5 shows the variation of V2 with time of day for all of the PMS aerosol samples. Large values of V2 show a similar but much stronger preference for time of day as compared to the large values of V\. There are only a few cases of V2 > 3xl& ixm3 cm'3 for the time period 1000 to 1900 hrs, yet during the early morning and
late night hours there are many values of V2 > \&ixm3cm~3. The time preference of the large particle volumes V\ and V2 suggests they are strongly influenced by vicissitudes in relative humidity.
Values of Vi and V2 are presented in Figs. 4-6 and 4-7 with relative humidity. Both these figures clearly demonstrate the strong preference of large K, and V2 for values of relative humidity > 75-80%. Table 4.1 presents the number of occurrences of V\ ^ \Qiiixmicm~3 for RH < and ^ 80%. The number of occurrences expected from random chance appears in parentheses. As clearly seen in the table, large values of V\, which comprise about 15% of the total data set, show a strong preference for RH^ 80%. The total particulate volume Vx is, however, not always large when this threshold value of rela-
01
0.1
1.0 10.0 PARTICLE RADIUS, (^m)
i i r
: (b)
-;
104 r •
A | r > ' •
| - / / "H 103
o*S* S 4 p * + \ —Jrnf ^mXl*^*-"* k*
^ « * V - ^ 00 -
•2 102 - uf -•o : : **•*
> ~ ! •o - -
10' —
10° :
, i . , , , 1 , . 1 1 1 1
1.0
PARTICLE RADIUS, dim)
10.0
Fig. 4-3. The volume distribution sampled at Meppen on 17 April at (a) 1400 hours and (b) 2400 hours.
-9-

0 6 12 18
TIME OF DAY (Hour)
Fig. 4-4. The volume concentration of particles in range 1 as a function of time of day
6 12 IS
TIME OF DAY (Hour)
Fig. 4-5. The volume concentration of particles in range 2 as a function of time of day
4
3
1
E
E 4 2 ,
o X ' 1
>~ 1 - - i -
n 1 1 1 - — h.. '. _ . 1 * . ; . i i j . fc; ini} . 20 40 60 80
RELATIVE HUMIDITY (%)
100 20 40 60 80
RELATIVE HUMIDITY (%)
Fig. 4-6. The volume concentration of particles in range 1 as a function of relative humidity
Fig. 4-7. The volume concentration of particles in range 2 function of relative humidity
as a
Table 4.1. The number of occurrences of K, as a function of relative humidity
RH < 80% RH > 80%
K, > 103^m3cm"3
K, < \03^m3cm'3
6(67) 143 (82)
443 (382) 406 (467)
Table 4.2. The number of occurrences of V2 as a function of relative humidity
RH<75% RH>75%
V21* 3x\03fim3cm-3
V2 < 3xl03Mm3cm-3
2(86) 251 (167)
337 (253) 408 (492)
tive humidity is exceeded For nearly all cases of high relative humidity during the period 1100 to 1900 hrs , the value of V\ is < 103ixm3cm'3 Even during the early morning and late night hours, when almost all large V\ occur, high relative humidity does not insure a large V\ The dependence of V2 on relative humidity is similar, as shown in Table 4 2 High relative humidity is required but
is not sufficient for large values of V2. Thus, while high relative humidity may be necessary for a large aerosol volume, other conditions must also be favorable for a large particle volume to be present. Wind direction and speed provide additional insight into the characteristics of the aerosol
-10-
The wind direction preference of Vx for only those cases where relative humidity is >80% is presented in Table 4.3. The table presents the number of occurrences of large Vx for four different wind direction zones. The number of occurrences expected from random chance appears in parentheses. With a x2= 40.7, the probability is < 0.001 that the table could occur from random chance. The table shows that in the wind direction zones 100-200° and 300-360° the number of occurrences of Ki ^ \(fiiim3cm~3 is not different than that. expected from chance. The zone 0-100° shows a larger number of occurrences of large Vx than expected from chance, while the zone 200-300° shows a smaller number than expected. An examination of the wind speed measured at a height of 10m shows that over 90% of the large values of Vx occur when wind speed is ^ 1 and < 5 m/sec. When wind speed is > 7 m/sec, the wind direction is almost always 200-300°. The behavior of V2 is very similar to that of Vx.
The wind direction preference of V2 for relative humidity ^ 75% is shown in Table 4.4. The table shows that the number of occurrences of V2 > 3xl03/xm3cm-3
in the two wind zones 100-200° and 300-360° is not significantly different than that expected from random chance. In the 200-300° zone, however, the number of occurrences of large V2 is significantly smaller than expected from chance. In the 0-100° zone, the number of cases of V2 ^ 3xl(fi ixm3 cm~3 is larger than expected from random chance. The probability is less than 0.001 of exceeding the value x2 =68.1 for this table. Wind speed shows, again, that almost all values of large V2 occur for wind speed > 1 and < 5 m/sec.
Tables 4.3 and 4.4 show that the volumes Vx and V2
tend to be smaller than their respective threshold values in the wind zone 200-300°. Because high wind speeds are generally confined to this zone, it may represent a storm track which would provide clean frontal air and moisten the ground, inhibiting the formation of wind generated coarse soil particles. The 100-200° zone, which contains a majority of the large particle volumes, appears to provide the necessary conditions for the formation of large aerosol volumes in the presence of high relative humidity. Since these large volumes generally occur during periods of moderate wind speed an advection fog or mist is indicated. As shown in Figs. 4-4 and 4-5 there are no occurrences of large volumes during the warmest part of the day from about 1600 to 1900 hours. The wind speed and direction preferences shown by the large volumes suggest that aerosol sources and transformation processes not local to Meppen strongly influence the character of the Meppen aero-
Table 4.3. The number of occurrences of Vx for wind from four direction zones measured at 10m for RH>80%.
Wind Direction Zones 0-100° 100-200° 200-300° 300-360°
Vx > 10Vm3cm-3
f, < 103/im3cm-3
69 (46)
109(132)
45 (42)
115(118)
10 (37)
132 (105)
19 (18)
50 (51)
sol. There is a problem of uniqueness, therefore, in predicting the characteristics of the Meppen aerosol using only local meteorological observations. When the data set is filtered according to the preferences of the large volumes for relative humidity, wind speed, wind direction and time of day the frequency of occurrence of large Vx
and V2 in the resultant data subset is only doubled to 50% and 30%, respectively. A more detailed description of the aerosol volume distribution for different meteorological conditions is provided by the Royco data base.
5.0 A CASE STUDY
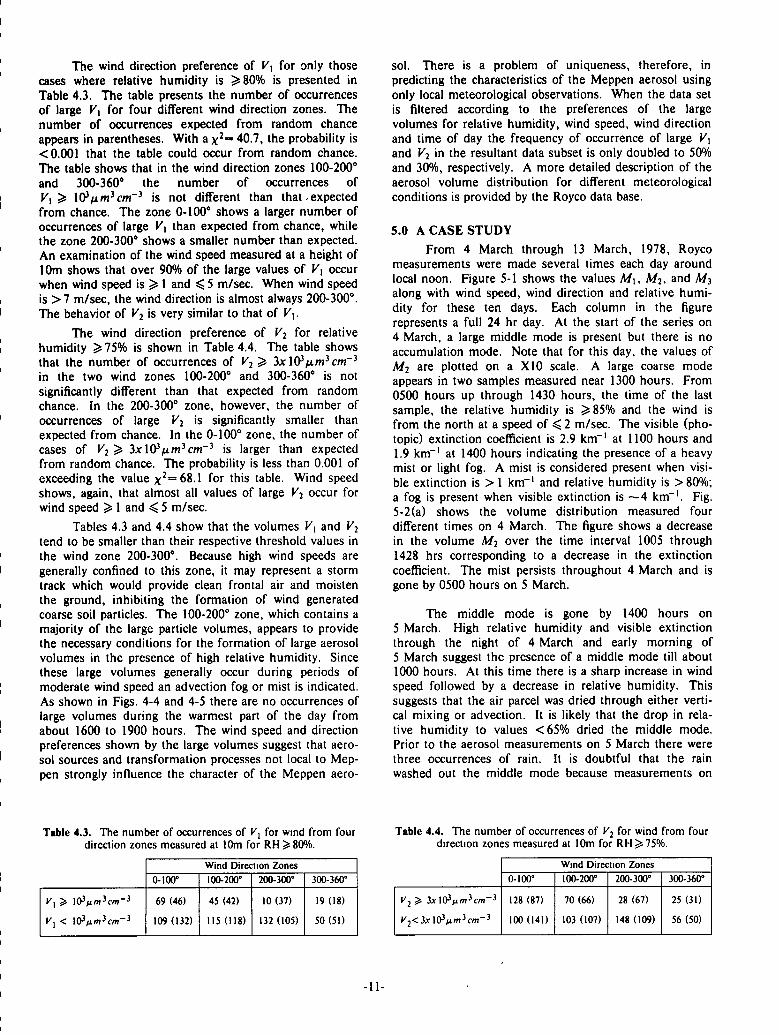
From 4 March through 13 March, 1978, Royco measurements were made several times each day around local noon. Figure 5-1 shows the values Mx, M2, and Mj along with wind speed, wind direction and relative humidity for these ten days. Each column in the figure represents a full 24 hr day. At the start of the series on 4 March, a large middle mode is present but there is no accumulation mode. Note that for this day, the values of M2 are plotted on a X10 scale. A large coarse mode appears in two samples measured near 1300 hours. From 0500 hours up through 1430 hours, the time of the last sample, the relative humidity is >85% and the wind is from the north at a speed of < 2 m/sec. The visible (pho-topic) extinction coefficient is 2.9 km-1 at 1100 hours and 1.9 km-1 at 1400 hours indicating the presence of a heavy mist or light fog. A mist is considered present when visible extinction is > 1 km-1 and relative humidity is >80%; a fog is present when visible extinction is -—4 km-1. Fig. 5-2(a) shows the volume distribution measured four different times on 4 March. The figure shows a decrease in the volume M2 over the time interval 1005 through 1428 hrs corresponding to a decrease in the extinction coefficient. The mist persists throughout 4 March and is gone by 0500 hours on 5 March.
The middle mode is gone by 1400 hours on 5 March. High relative humidity and visible extinction through the night of 4 March and early morning of 5 March suggest the presence of a middle mode till about 1000 hours. At this time there is a sharp increase in wind speed followed by a decrease in relative humidity. This suggests that the air parcel was dried through either vertical mixing or advection. It is likely that the drop in relative humidity to values <65% dried the middle mode. Prior to the aerosol measurements on 5 March there were three occurrences of rain. It is doubtful that the rain washed out the middle mode because measurements on
Table 4.4. The number of occurrences of V2 for wind from four direction zones measured at 10m for RH^75%.
Wind Direction Zones 0-100° 100-200° 200-300° 300-360°
V2 » 3*103Mm3cm-3
K2<3.x-10Vm3cm-3
128 (87)
100(141)
70 (66)
103 (107)
28 (67)
148 (109)
25 (31)
56 (50)

360
z o
270
180 W a! 3
90
X
E
E a.
E O
E" a.
E
E a.
0
50
0
40
20
0
20
0
40
20
0
R R_ _R_ R _R_ R_ R R R R R R •
. / •" • •• • • •• • . • •• ^ •*-..' •. •• -
• * • • • ***•** . " , • • • DIRECTION (•) • . _• ' ' . • SPEED (x)
. . • •
K X X X XX
x»o<% V X XX
X X XX x X X X
x x x x x x x x x
X x x x x
X v X xx
x x x
x x
v xxx x X X *
x x x x x x x x x x x x XX „
xx x x xx , X
x* x x x x x >f
* X
xx" X X X X x XX
XX
' • •. • . . • . • . •
_ • • • -
- -
(85)
#
, * .
- • M -• • • • "••• * • ""« t. •» •
(X10) 1
X . . v \ . . • •
•_ •" •
. • •
. . .•
• '
• 1 .
— •• -4 MARCH 8 9
DAY OF MONTH
10 11 12
30 u (1> w
20 F
n 10 UJ
UJ Ou
0 c/o
13
Fig. 5-1. Maximum volume concentrations M of the three modes with relative humidity (RH), wind direction, wind speed and periods of rain (R) for ten days in March.
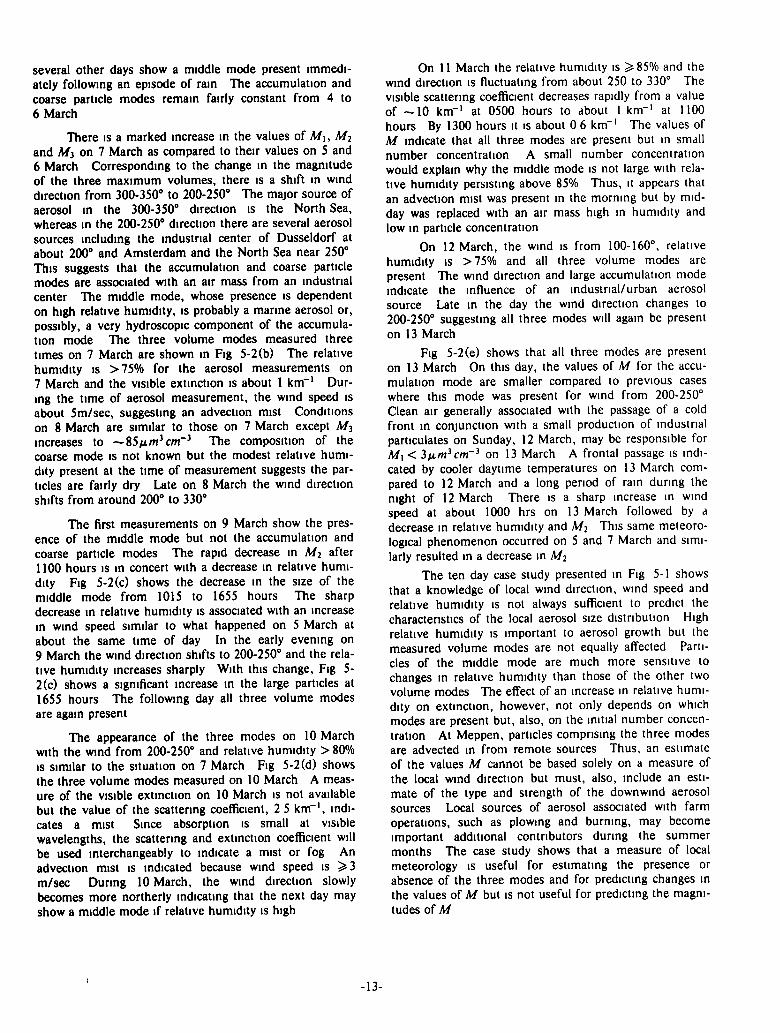
several other days show a middle mode present immediately following an episode of rain The accumulation and coarse particle modes remain fairly constant from 4 to 6 March
There is a marked increase in the values of Mx, M2
and M) on 7 March as compared to their values on 5 and 6 March Corresponding to the change in the magnitude of the three maximum volumes, there is a shift in wind direction from 300-350° to 200-250° The major source of aerosol in the 300-350° direction is the North Sea, whereas in the 200-250° direction there are several aerosol sources including the industrial center of Dusseldorf at about 200° and Amsterdam and the North Sea near 250° This suggests that the accumulation and coarse particle modes are associated with an air mass from an industrial center The middle mode, whose presence is dependent on high relative humidity, is probably a marine aerosol or, possibly, a very hydroscopic component of the accumulation mode The three volume modes measured three times on 7 March are shown in Fig 5-2(b) The relative humidity is >75% for the aerosol measurements on 7 March and the visible extinction is about 1 km-1 During the time of aerosol measurement, the wind speed is about 5m/sec, suggesting an advection mist Conditions on 8 March are similar to those on 7 March except M3
increases to —S5ixm3cm~3 The composition of the coarse mode is not known but the modest relative humidity present at the time of measurement suggests the particles are fairly dry Late on 8 March the wind direction shifts from around 200° to 330°
The first measurements on 9 March show the presence of the middle mode but not the accumulation and coarse particle modes The rapid decrease in M2 after 1100 hours is in concert with a decrease in relative humidity Fig 5-2(c) shows the decrease in the size of the middle mode from 1015 to 1655 hours The sharp decrease in relative humidity is associated with an increase in wind speed similar to what happened on 5 March at about the same time of day In the early evening on 9 March the wind direction shifts to 200-250° and the relative humidity increases sharply With this change, Fig 5-2(c) shows a significant increase in the large particles at 1655 hours The following day all three volume modes are again present
The appearance of the three modes on 10 March with the wind from 200-250° and relative humidity > 80% is similar to the situation on 7 March Fig 5-2(d) shows the three volume modes measured on 10 March A measure of the visible extinction on 10 March is not available but the value of the scattering coefficient, 2 5 km-1, indicates a mist Since absorption is small at visible wavelengths, the scattering and extinction coefficient will be used interchangeably to indicate a mist or fog An advection mist is indicated because wind speed is > 3 m/sec During 10 March, the wind direction slowly becomes more northerly indicating that the next day may show a middle mode if relative humidity is high
On 11 March the relative humidity is ^ 85% and the wind direction is fluctuating from about 250 to 330° The visible scattering coefficient decreases rapidly from a value of —10 km-1 at 0500 hours to about 1 km-1 at 1100 hours By 1300 hours it is about 0 6 km-1 The values of M indicate that all three modes are present but in small number concentration A small number concentration would explain why the middle mode is not large with relative humidity persisting above 85% Thus, it appears that an advection mist was present in the morning but by midday was replaced with an air mass high in humidity and low in particle concentration
On 12 March, the wind is from 100-160°, relative humidity is >75% and all three volume modes are present The wind direction and large accumulation mode indicate the influence of an industrial/urban aerosol source Late in the day the wind direction changes to 200-250° suggesting all three modes will again be present on 13 March
Fig 5-2(e) shows that all three modes are present on 13 March On this day, the values of M for the accumulation mode are smaller compared to previous cases where this mode was present for wind from 200-250° Clean air generally associated with the passage of a cold front in conjunction with a small production of industrial particulates on Sunday, 12 March, may be responsible for Mx< 3ixm3cm~3 on 13 March A frontal passage is indicated by cooler daytime temperatures on 13 March compared to 12 March and a long period of rain during the night of 12 March There is a sharp increase in wind speed at about 1000 hrs on 13 March followed by a decrease in relative humidity and M2 This same meteorological phenomenon occurred on 5 and 7 March and similarly resulted in a decrease in M2
The ten day case study presented in Fig 5-1 shows that a knowledge of local wind direction, wind speed and relative humidity is not always sufficient to predict the characteristics of the local aerosol size distribution High relative humidity is important to aerosol growth but the measured volume modes are not equally affected Particles of the middle mode are much more sensitive to changes in relative humidity than those of the other two volume modes The effect of an increase in relative humidity on extinction, however, not only depends on which modes are present but, also, on the initial number concentration At Meppen, particles comprising the three modes are advected in from remote sources Thus, an estimate of the values M cannot be based solely on a measure of the local wind direction but must, also, include an estimate of the type and strength of the downwind aerosol sources Local sources of aerosol associated with farm operations, such as plowing and burning, may become important additional contributors during the summer months The case study shows that a measure of local meteorology is useful for estimating the presence or absence of the three modes and for predicting changes in the values of M but is not useful for predicting the magnitudes of M

250
200
150
00 -2 100 -o > •o 50
01
(a) 4 March
T—I—I—r
10
PARTICLE RADIUS, (fim) PARTICLE RADIUS, Ijim)
flU ' ' ' ' ' ' ' 1 Time 1015 1105 (c) 9 March
1 60 1156
1342 fc 1655
E J- 40 -00
o •o ' ^^ ^ \ '—. ' S ^ * > 20
'X''' - —~~~ ^
0 *r 1 01 10
PARTICLE RADIUS, (jim)
10
80
sr 60 E
f 40
> •o
20
0L_ 01
- i — i — i — i i i
Time - - 0855
1231 1341
1005 ' N
/ \
(d) 10 March
PARTICLE RADIUS, (ixm)
10
40
30
20
E J-
SO
_o 73
> •a 10
0 l _ 01
Time - - 1100 — 1158 — 1335
1500
(e) 13 March
PARTICLE RADIUS, (ixm)
10
Fig. 5-2. Volume distributions sampled during the day on (a) 4 March, (b) 7 March, (c) 9 March, (d) 10 March, and (e) 13 March Time is local time
-14-

6.0 SUMMARY AND CONCLUSIONS This report presents the results of analysis of a data
base consisting of aerosol size distributions measured concurrently with the local meteorology at Meppen. The purpose of the analysis was to corroborate an extensive set of airborne aerosol measurements described in Fitch and Cress (1981 and 1983) and to determine the utility of local meteorological measurements in uniquely defining the local aerosol size and number distribution.
The characteristics and behavior of the ground measured aerosol volume distributions agree well with the airborne measured distributions. Volume distribution plots for both data sets show three volume modes, each well fit by a log-normal distribution. The behavior and values of the log-normal fit parameters for the accumulation and middle modes are in good agreement as shown in Table 6.1. The table presents the average value of standard deviation o- and the range of mode radii 7 for each of the three modes that appear in both the ground and airborne data bases. The greater frequency of occurrence and, generally, bigger size of the ground coarse modes compared to the airborne coarse modes indicates a larger average particle number concentration for the ground modes. The lack of agreement between o-3 for the two data sets is probably a result of low particle counts in the airborne data and an incomplete sampling of the entire coarse mode. A fit of three log-normal curves to the measured distributions of both data sets explains more than 90% of the variance. The recurring behavior and, often, constant value of the fit parameters 7 and o- for the three modes show that the aerosol distribution over the measured particle radius range could be estimated using only a measure of the maximum volumes Mx, M2, and M^
Concurrent measurements of the aerosol distribution and local meteorology show that the formation of large particle volumes associated with mist and fog requires high values of relative humidity. High relative
Table 6.1. Summary of the volume mode parameters.
Fit Parameters Airborne Ground
Accumulation
"\ 0.11 0.14
71 0.25-0.5 0.25-0.6
Middle
"1 0.30 0.27
~rl 0.5-1.4 0.75-1.8
Coarse
^3 0.2 0.33
73 5 8.3
humidity, however, does not always produce a large particle volume. A case study of the aerosol distribution and meteorology indicates conditions which promote high humidity do not always insure the presence of an aerosol necessary for the formation of a mist or fog. The PMS data show that the local meteorology is not a definitive predictor of aerosol presence. During a mist, the Royco data show that the aerosol distribution can be a middle mode solo or all three modes in combination. It is anticipated that as more aerosol and meteorological data become available, the task of determining the presence and characteristics of the aerosol distribution based on a measure of the meteorology will be continued. It is recommended that future studies concentrate on the behavior of the three volume modes.
The data analysis indicates that accurate short term prediction of aerosol size distribution morphisis is possible by combining methodologies of predicting local episodes of mixing and changes in relative humidity with measurements of Mx, M2 and M3. This technique would avoid the complexities and expense involved in developing an elaborate scheme which uses air mass trajectory analyses in conjunction with a location and time dependent aerosol source inventory. With a local measure of the values M, there would be no need to develop or maintain an aerosol source inventory or to predict changes in the aerosol distribution during long passages from its source to the site of interest. The data suggest that extinction in the visible and infrared could be predicted using LOWTRAN, a measure of the present values of M and a six to twelve hour estimate of future meteorological conditions. Such a methodology would not require a complex aerosol source inventory and could provide a mesoscale map of the optical environment when implemented over a network of meteorological stations.
Recommendation It is recommended that future studies in predicting
the optical environment of the atmosphere focus on the recurring behavior and characteristics of the three individual volume modes. Specific topics of interest for future research may include: (1) defining the source of the middle mode, (2) determining the uncertainties involved in estimating visible and infrared extinction using only a measure of the values M and (3) combining methodologies for estimating changes in relative humidity and the values of M for the prediction of atmospheric optical properties.
7.0 ACKNOWLEDGEMENTS This report has been prepared for the Air Force
Geophysics Laboratory under Contract No. F19628-82-C-0060. The author wishes to thank the members of the Visibility Laboratory technical staff for their assistance, and the members of the Atmospheric Optics Branch of the Air Force Geophysics Laboratory, for their technical support and council.
-15-
8.0 REFERENCES
Air Weather Service (1982), "AWS Climatic Briefs, Europe", Air Force Environmental Technical Applications Center, USAFETAC/DS-81/056, ADAH 8450.
Bevington, P.R. (1969), Data Reduction and Error Analysis for the Physical Sciences, McGraw-Hill, 336 pp.
Cooke, D.D. and M. Kerker (1975), "Response Calculations for Light Scattering Aerosol Particle Counters", Appl. Opt. 14, 734-739.
Cress, T.S. and R.W. Fenn (1978), "Climatology of Atmospheric Aerosols in Europe: Project OPAQUE', SPIE, 142,45-52.
Fitch, B.W. and T.S. Cress (1981), "Measurements of Aerosol Size Distributions in the Lower Troposphere Over Northern Europe", J. Appl. Meteor., 20, 1119-1128.
Fitch, B.W. and T.S. Cress (1983), "Spatial and Temporal Variations of Tropospheric Aerosol Volume Distributions", J. Clim. Appl. Meteor., 22, 1262-1269.
Johnson (1981), "Airborne Measurements of European Sky and Terrain Radiance", University of California, San Diego, Scripps Institution of Oceanography, Visibility Laboratory, SIO Ref. 82-2, AFGL-TR-81-0275, NTIS No. ADA 114 637.
Johnson, R.W. and W.S. Hering (1981), "An Analysis of Natural Variations in European Sky and Terrain
Radiance Measurements", University of California, San Diego, Scripps Institution of Oceanography, Visibility Laboratory, SIO Ref. 82-6, AFGL-TR-81-0317, NTIS No. ADA 120 487.
Junge, C.E. (1963), Air Chemistry and Radioactivity, Academic Press, 382 pp.
Junge, C. and R. Jaenicke (1971), "New Results in Background Aerosols Studies from the Atlantic Expedition of the R.V. Meteor., Spring 1969', Aerosol Sci., 2, 305-314.
Quenzel, H. (1969), "Influence of Refractive Index on the Accuracy of Size Determination of Aerosol Particles with Light Scattering Aerosol Counters", Appl. Opt., 8, 165-169.
Shettle, E.P. (1975), Comment on "Atmospheric Aerosol Size Spectra, Rapid Concentration Fluctuations and Bimodality", by T.E. Graedel and J.P. Franey. J. Geophys. Res., 80, 3050-3051.
Shields, J.E. (1981), "An Analysis of Infrared and Visible Atmospheric Extinction Measurements in Europe", University of California, San Diego, Scripps Institution of Oceanography, Visibility Laboratory, SIO Ref. 82-4, AFGL-TR-81-0251, NTIS No. ADA 123 999.
Whitby, K.T., R.B. Husar and B.Y.H. Liu (1972), "The Aerosol Size Distribution of Los Angeles Smog", J. Colloid and Interface Sci., 39, 177-204.
-16-

Notes
-17-

Notes
-18-