Security Analysis and Portfolio Management PPT.pdf · Security Analysis and Portfolio Management...
278
Security Analysis and Portfolio Management Prepared by B. Tulasi Bai, Assistant Professor Department of MBA
Transcript of Security Analysis and Portfolio Management PPT.pdf · Security Analysis and Portfolio Management...
Security Analysis and Portfolio Management
Prepared by
B. Tulasi Bai, Assistant Professor
Department of MBA
UNIT- I
INVESTMENT AND SECURITY ANALYSIS
Financial Investment
There are numerous components to financialinvestment
• Markets: where assets are bought and sold, and theforms of trade
• Securities: the kinds of securities available, theirreturns and risks
• Investment process: the decision about whichsecurities, and how much of each
• Financial theory: the factors that determine therewards from investment (and the risks)
Markets
A market is any organized system for connecting buyersand sellers
• There are many security markets
• Markets may have a physical location
• The New York Stock Exchange
• Or exist only as computer networks
• The London Stock Exchange
• Markets vary in the securities that are traded and inthe way securities are traded
Characteristics of Markets
There are a number of ways to classify markets
• Primary/Secondary• Primary markets are security markets where new
issues of securities are traded• A secondary market is a market where securities are
resold
• The London Stock Exchange is a secondary market
• Most activity on stock exchanges is in the secondary market
Characteristics of Markets
Trades on the primary market raise capital for firms
• Trades on the secondary market do not raise additional capital for firms
• The secondary market is still important
• It gives liquidity to primary issues. New securities would have a lower value if they could not be subsequently traded
• It signifies value. Trading in assets reveals information and provides a valuation of the assets. This helps to guide investment decisions
Characteristics of Markets
A second way to classify markets is the times of trading
• Call/continuous
• In a call market trading takes place at a specified time intervals
• Some call markets have a provision that limits movement from the prior price. This is to prevent a temporary order imbalance from dramatically moving the price
• In a continuous market there is trading at all times the market is open
Characteristics of Markets
Markets can also be characterized by the lifespan of the assets traded
• Money/Capital
• Money market: the market for assets with a life of less than 1 year
• Capital market: the market for assets with a life greater than 1 year
• Some assets, such as most bonds, have a fixed lifespan
• Common stock have an indefinite lifespan
Brokers
A broker is a representative appointed by an individualinvestor
Brokers have two conflicting roles
• An advisor: a broker can offer investment advice and information
• A sales person: brokers are rewarded through commission and have an incentive to encourage trade
• A full-service broker is a brokerage house that can offer a full range of services including investment advice and portfolio management
Brokers
• A discount broker offers a restricted range of services at a lower price
• To complete a trade additional brokers are needed
• A floor broker is located on the floor of the exchange and does the actual buying and selling
• A specialist ensures trade happens by holding an inventory of stock and posting prices
Securities
The standard definition of a security is:
"A legal contract representing the right to receive future benefits under a stated set of conditions"
The piece of paper defining the property rights held by the owner is the security
Securities
Money market securities• Short-term debt instruments sold by governments,
financial institutions and corporations• They have maturities when issued of one year or
less• The minimum size of transactions is typically large,
usually exceeding $100,000
• 1Treasury Bills are the least risky and the mostmarketable of all money markets instruments
• They represent a short-term IOU of the US federalgovernment
• Similar bills are issued by many other governments
Securities
• New 91- and 182- day T-bills are issued weekly, byauction whereas 52-week T-bills are issued monthly.
• An active secondary market with very lowtransactions costs exists for trading T-bills
• T-bills are sold at a discount from face value and payno explicit interest payments.
• T-bills are considered to have no risk of default, havevery short-term maturities, and have a known return
• T-bills are the closest approximations that exist to arisk-free investment
Securities
Capital market securities
• Instruments having maturities greater than oneyear and those having no designated maturity at all
• 1. Fixed income securities
• Fixed income securities have a specified paymentschedule
• Bonds promise to pay specific amounts at specifictimes
• Failure to meet any specific payment puts the bondinto default with all remaining payments. Thecreditor can put the defaulter into bankruptcy
Securities
• Fixed income securities differ from each other inpromised return for several reasons
• The maturity of the bonds
• The creditworthiness of the issuer
• The taxable status of the bond
• Income and capital gains are taxed differently inmany countries
• Bonds are designed to exploit these differences
Securities
1.1 Treasury notes and bonds• The government issues fixed income securities over a
broad range of the maturity spectrum
• Both notes and bonds pay interest twice a year andrepay principal on the maturity date
1.2 Corporate bonds• These promise to pay interest at periodic intervals and
to return principal at a fixed date
• These bonds are issued by business entities and thushave a risk of default
Securities
2. Common stock (shares, equity)• Common stock represents an ownership claim on
the earnings and assets of a corporation
• After holders of debt claims are paid, the management of the company can either pay out the remaining earnings to stockholdings in the form of dividends or reinvest part or all of the earnings
• The holder of a common stock has limited liability –the most they can lose is the value of the shares
Securities
3. Derivative instruments• Derivative instruments are securities whose value
derives from the value of an underlying security orbasket of securities
• The instruments are also known as contingentclaims, since their values are contingent on theperformance of underlying assets
• The most common contingent claims are optionsand futures
3.1 An option on a security gives the holder the right toeither buy (a call option) or sell (a put option) aparticular asset at a future date or during aparticular period of time for a specified price
Securities
3.2 A future is the obligation to buy or sell a particularsecurity or bundle of securities at a particular timefor a stated price
• A future is simply a delayed purchase or sale of asecurity
3.3 The corporation can issue contingent claims.
• Corporate-issued contingent claims include rightsand warrants, which allow the holder to purchasecommon stocks from the corporation at a set pricefor a particular period of time
Securities
Indirect investing • The purchase of a shares of an investment portfolio• A mutual fund holds a portfolio of securities, usually in
line with a stated policy objective.• Unit trusts invest depositors' funds in bonds or equities.
Size is determined by inflow of funds.• Investment trusts Issue a certain fixed sum of stock to
raise capital. This fixed capital is then managed by thetrust. The initial investors purchase shares, which arethen traded on the stock market
• Hedge funds actively manage deposits in excess of£100,000. Trade in all financial markets, includingderivatives.
Return and Risk
2. Creditworthiness
• The governments of the US, UK and other developedcountries are all judged as safe since they have no historyof default in the payment of their liabilities
• Some other countries have defaulted in the recent past
• Corporations vary even more in their creditworthiness.Some are so lacking in creditworthiness that an active''junk bond'' market exists for high return, high riskcorporate bonds that are judged very likely to default
The Investment Process
A description of the process is:
1. Set investment policy
• Objectives
• Amount
• Choice of assets
2. Conduct security analysis
• Examine securities (identify those which are mispriced?)
• Technical analysis – the examination of past prices for trends
• Fundamental analysis – true value based on future expected returns
The Investment Process
3. Portfolio Construction
• Identify assets
• Choose extent of diversification
4. Portfolio Evaluation
• Assess the performance of portfolio
5. Portfolio Revision
• Repeat previous three steps
Buying Common Stocks
Open an account with a brokerage and specify
1. Name of firm
2. Buy or sell
3. Size of order
4. How long until order is cancelled
5. Type of order
Buying Common Stocks
Time Limit
• This is the time within which the broker should attempt to fill the order
• Day order – fill during the day it is entered or else cancel
• Open order (or Good Till Cancelled) – remains in effect until filled or cancelled
• Fill-or-kill – cancelled if not executed immediately
• Discriminatory order – left to broker
Buying Common Stocks
Type of Order
Market Order – buy or sell, with broker making besteffort
• price uncertain
• execution certain
Limit Order – A limit price is specified
• a maximum if buying
• a minimum if selling
• execution uncertain
• price certain
Buying Common Stocks
Type of OrderStop Order – a stop price is specified
• Sell if price falls below the stop price• A stop-loss is used to lock-in profits• Buy if price rises above the stop price• Execution is certain if stop price passed
Stop Limit Order • A minimum price is placed below the stop-price
for a sell• A maximum price is placed above the stop-
price for a buy• Price is certain within a range

SECURITY ANALYSIS
Three Steps of Top-Down Fundamental Analysis
Macroeconomic analysis:
• evaluates current economic environment and its effect on industry and company fundamentals
Industry analysis:
• evaluates outlook for particular industries
Company analysis:
• evaluates company’s strengths and weaknesses within industry

Macroeconomic Analysis
Business Cycles• Expansion, Peak, Contraction, Trough
• Impact of Inventory and Final Sales
Economic Indicators• Leading (10): new orders, building permits, first
time unemployment claims, stock prices, ratespreads
• Coincident(4):Non-ag payroll, industrial production
• Lagging (7): Inventory-to-sales, labor cost
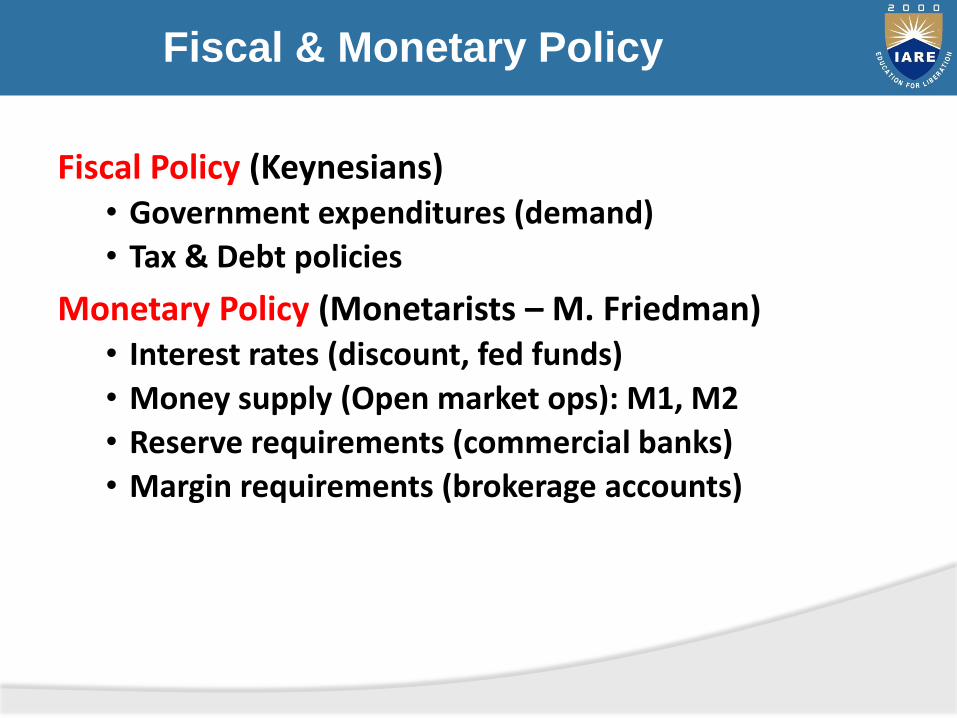
Fiscal & Monetary Policy
Fiscal Policy (Keynesians)• Government expenditures (demand)
• Tax & Debt policies
Monetary Policy (Monetarists – M. Friedman)• Interest rates (discount, fed funds)
• Money supply (Open market ops): M1, M2
• Reserve requirements (commercial banks)
• Margin requirements (brokerage accounts)
Goals of Policy
Full Employment• Interest Rates
• Money Supply
Price Stability (control inflation)• Interest Rates
• Money Supply
Economic Growth• Interest Rates
• Money Supply
Impediments to Effective Policy
• Time lags between [stimulus] and [desired effect]
• Unintended consequencesi. “irrational” expectations on part of policy makers
ii. Adverse influence of speculators
iii. Adverse global responses
• Consumer behavior (rational expectations)
• Incorrect analysis, actions, or timing by policy makers
Industry Analysis
Classifying industries• Cyclical industry - performance is positively related
to economic activity
• Defensive industry - performance is insensitive toeconomic activity
• Growth industry - characterized by rapid growth insales, independent of the business cycle

Industry Analysis
Industry Life Cycle Theory: • Birth (heavy R&D, large losses - low revenues)
• Growth (building market share and economies ofscale)
• Mature growth (maximum profitability)
• Stabilization (increase in unit sales may beachieved by decreasing prices)
• Decline (demand shifts lead to declining sales andprofitability - losses)
Industry Analysis
Life Cycle of an Industry (Marketing view)• Start-up stage: many new firms; grows rapidly
(example: genetic engineering)
• Consolidation stage: shakeout period; growthslows (example: video games)
• Maturity stage: grows with economy (example:automobile industry)
• Declinestage:grows lower than economy (example:railroads)

Industry Analysis
Qualitative Issues• Competitive Structure
• Permanence (probability of product obsolescence)
• Vulnerability to external shocks (foreign competition)
• Regulatory and tax conditions (adverse changes)
• Labor conditions (unionization)
Industry Analysis
End use analysis • identify demand for industry’s products
• estimates of future demand
• identification of substitutes
Ratio analysis• examining data over time
• identifying favorable/unfavorable trends
Regression analysis • determining the relationship between variables
Company Analysis: Qualitative Issues
• Sales Revenue (growth)
• Profitability (trend)
• Product line (turnover, age)
• Pricing Strategy
• Patents and technology
Company Analysis: Qualitative Issues
Organizational performance• Effective application of company resources
• Efficient accomplishment of company goals
Management functions• Planning - setting goals/resources
• Organizing - assigning tasks/resources
• Leading - motivating achievement
• Controlling - monitoring performance
Company Analysis: Qualitative Issues
Evaluating Management Quality
Age and experience of management
Strategic planning
• Understanding of the global environment
• Adaptability to external changes
Marketing strategy
• Track record of the competitive position
• Sustainable growth
• Public image
Finance Strategy - adequate and appropriate
Employee/union relations
Effectiveness of board of directors
Company Analysis: Quantitative Issues
Operating efficiency• Productivity• Production function
Importance of Q.A.• Understanding a company’s risks• Financial, operating, and business risks
Financial Ratio Analysis• Past financial ratios • With industry, competitors, and
Regression analysis• Forecast Revenues, Expenses, Net Income• Forecast Assets, Liabilities, External Capital
Requirements
Company Analysis: Quantitative Issues
Balance Sheet• Snapshot of company’s Assets, Liabilities and Equity.
Income statement• Sales, expenses, and taxes incurred to operate
• Earnings per share
Cash flow statement• Sources and Uses of funds
• G.A.A.P. vs Cleverly Rigged Accounting Ploys
Company Analysis: Quantitative Issues
Financial Ratio Analysis• Liquidity (ability to pay bills)
• Debt (financial leverage)
• Profitability (cost controls)
• Efficiency (asset management)
DuPont Analysis• Top-down analysis of company operations
• Objective: increase ROE
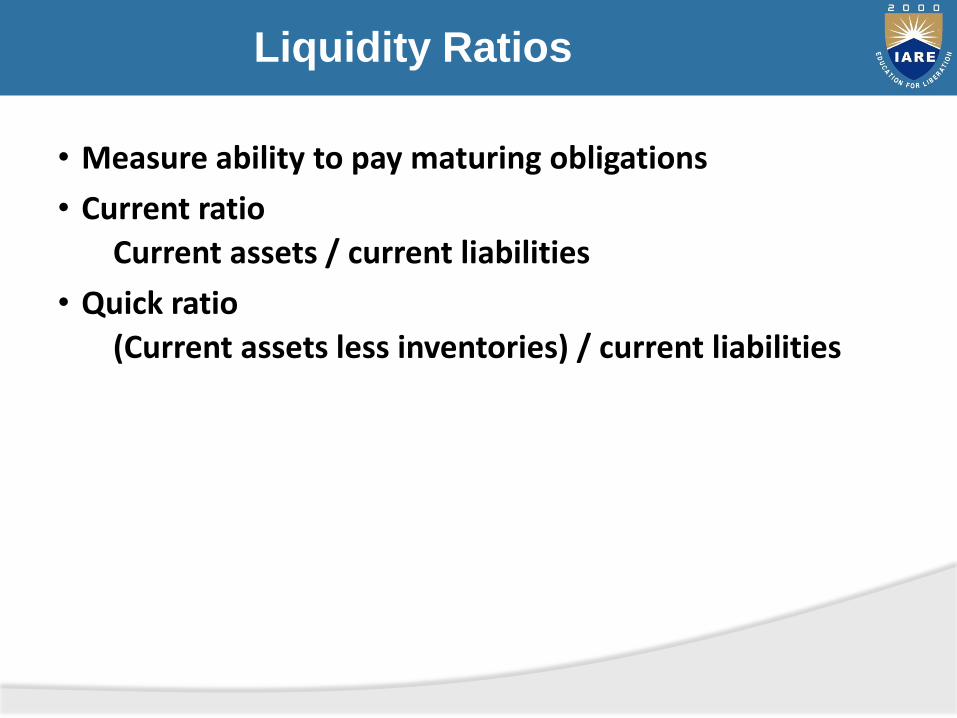
Liquidity Ratios
• Measure ability to pay maturing obligations
• Current ratio
Current assets / current liabilities
• Quick ratio
(Current assets less inventories) / current liabilities
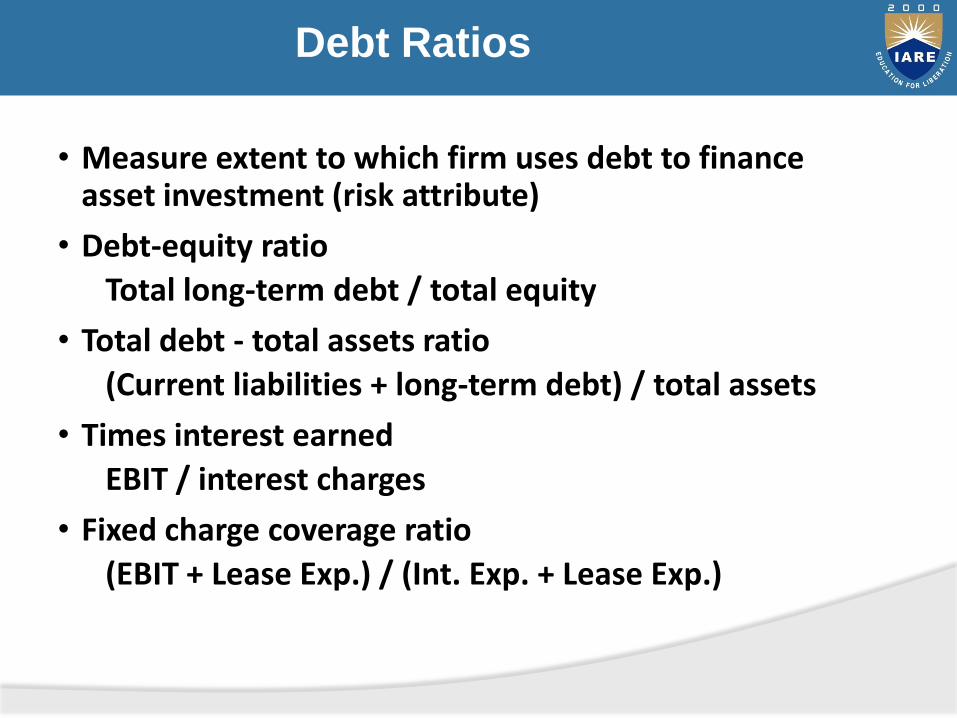
Debt Ratios
• Measure extent to which firm uses debt to finance asset investment (risk attribute)
• Debt-equity ratio
Total long-term debt / total equity
• Total debt - total assets ratio
(Current liabilities + long-term debt) / total assets
• Times interest earned
EBIT / interest charges
• Fixed charge coverage ratio
(EBIT + Lease Exp.) / (Int. Exp. + Lease Exp.)
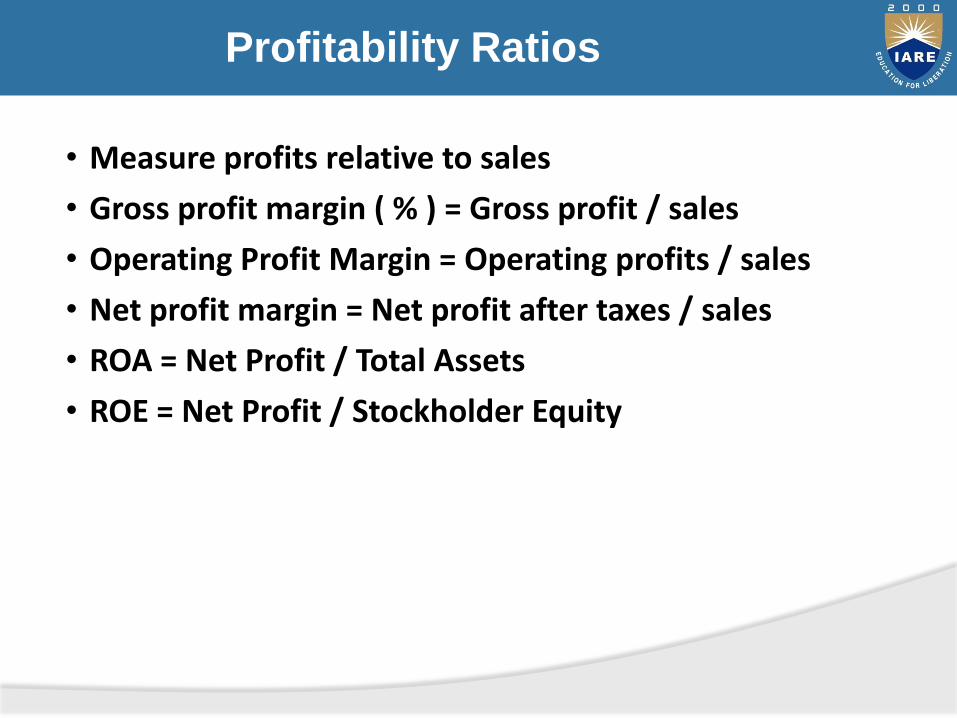
Profitability Ratios
• Measure profits relative to sales
• Gross profit margin ( % ) = Gross profit / sales
• Operating Profit Margin = Operating profits / sales
• Net profit margin = Net profit after taxes / sales
• ROA = Net Profit / Total Assets
• ROE = Net Profit / Stockholder Equity
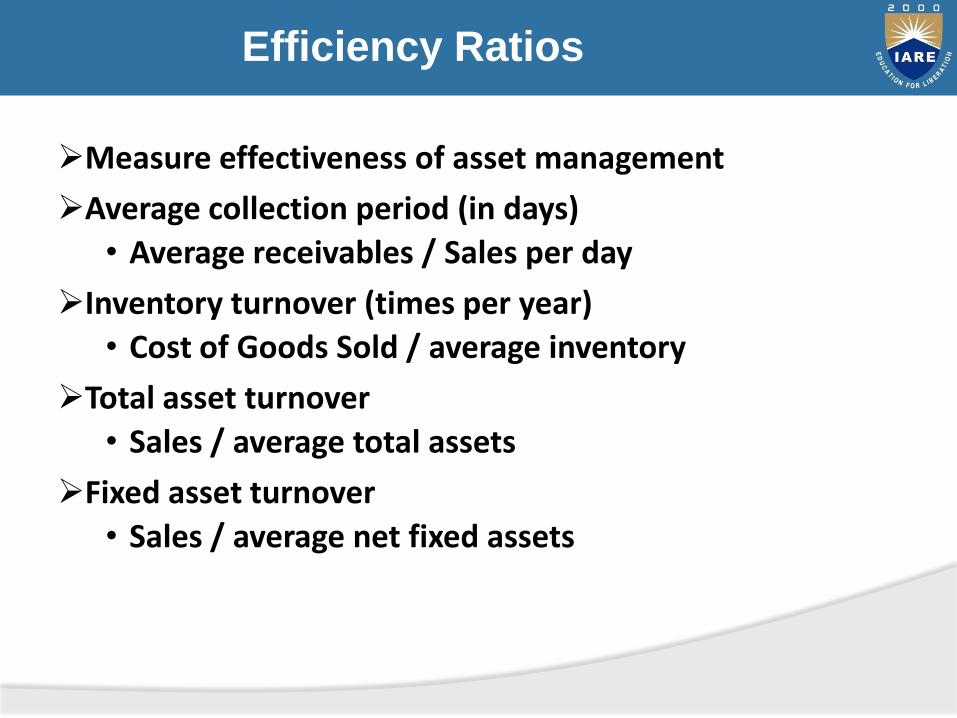
Efficiency Ratios
Measure effectiveness of asset management
Average collection period (in days)
• Average receivables / Sales per day
Inventory turnover (times per year)
• Cost of Goods Sold / average inventory
Total asset turnover
• Sales / average total assets
Fixed asset turnover
• Sales / average net fixed assets
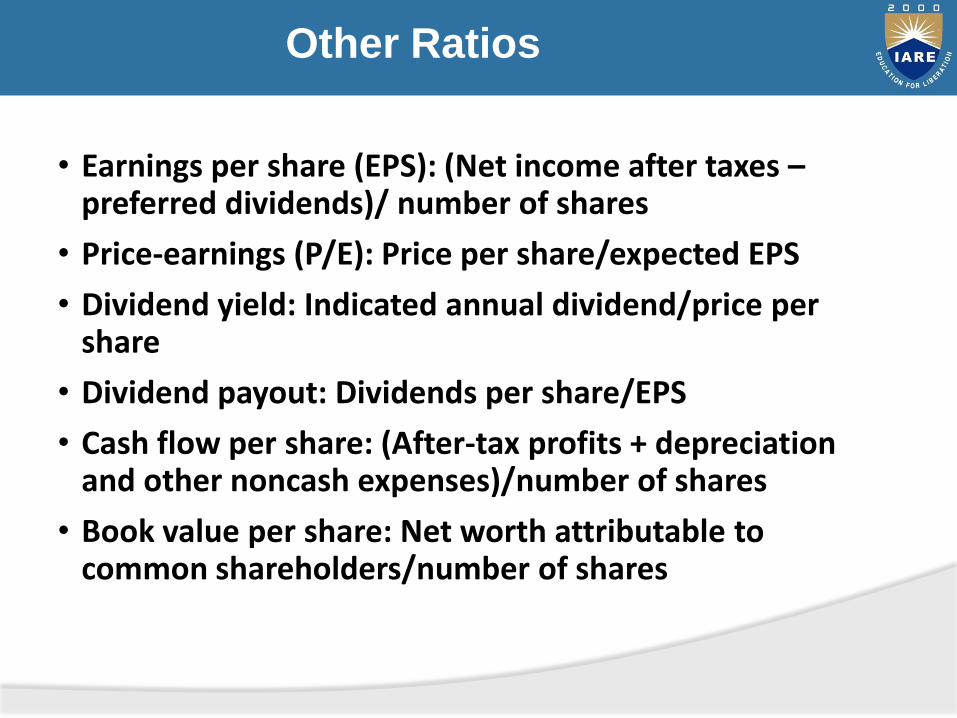
Other Ratios
• Earnings per share (EPS): (Net income after taxes –preferred dividends)/ number of shares
• Price-earnings (P/E): Price per share/expected EPS
• Dividend yield: Indicated annual dividend/price per share
• Dividend payout: Dividends per share/EPS
• Cash flow per share: (After-tax profits + depreciation and other noncash expenses)/number of shares
• Book value per share: Net worth attributable to common shareholders/number of shares
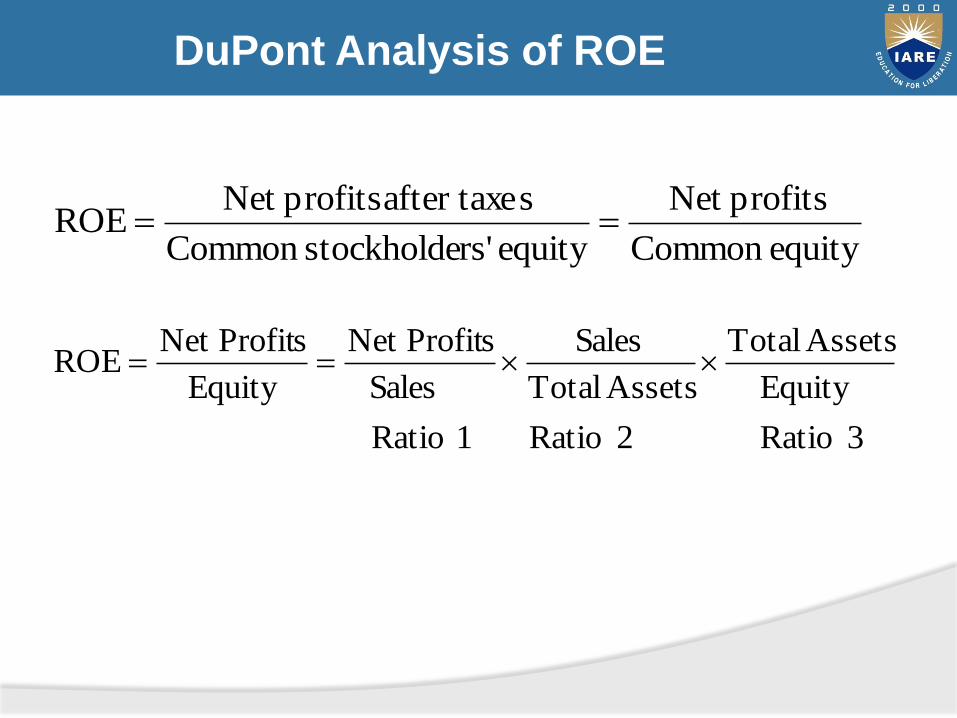
DuPont Analysis of ROE
equity Common
profitsNet
equity rs'stockholde Common
safter taxe profitsNet ROE
3 Ratio
Equity
Assets Total
2 Ratio
Assets Total
Sales
1 Ratio
Sales
sNet Profit
Equity
sNet ProfitROE
Introduction
Two major types of analysis for predicting the performance of a company’s stock
• fundamental
• technical
Technical • looks for peaks, bottoms, trends, patterns, and other
factors affecting a stock’s price movement
• makes a buy/sell decision based on those factors
What is Technical Analysis?
Method of evaluating securities by analyzing statistics generated by
• Market activity
• Past Prices
• Volume
History and Background
• Technical analysis is, perhaps, the oldest form of security analysis. It is believed that the first technical analysis occurred in 17th century Japan, where analysts used charts to plot price changes in rice.

History and Background
• Indeed, many present-day Japanese analysts still rely on technical analysis to forecast prices in their stock exchange, which is the second largest in the world. In the United States, technical analysis has been used for more than 100 years
Technical Analysis vs. Fundamental Analysis
• Technical analysis involves the development of trading rules based on past price and volume data for individual stocks and the overall stock market.
• Fundamental analysis involves economic, industry, and company analysis that lead to valuation estimates for companies, which can then be compared to market prices to aid in investment decisions.
Advantages of Technical Analysis
• Unlike fundamental analysis, technical analysis is not heavily dependent on financial accounting statements
Advantages of Technical Analysis
• Fundamental analyst must process new information and quickly determine a new intrinsic value, but technical analyst merely has to recognize a movement to a new equilibrium
• Technicians trade when a move to a new equilibrium is underway but a fundamental analyst finds undervalued securities that may not adjust to “correct” prices as quickly
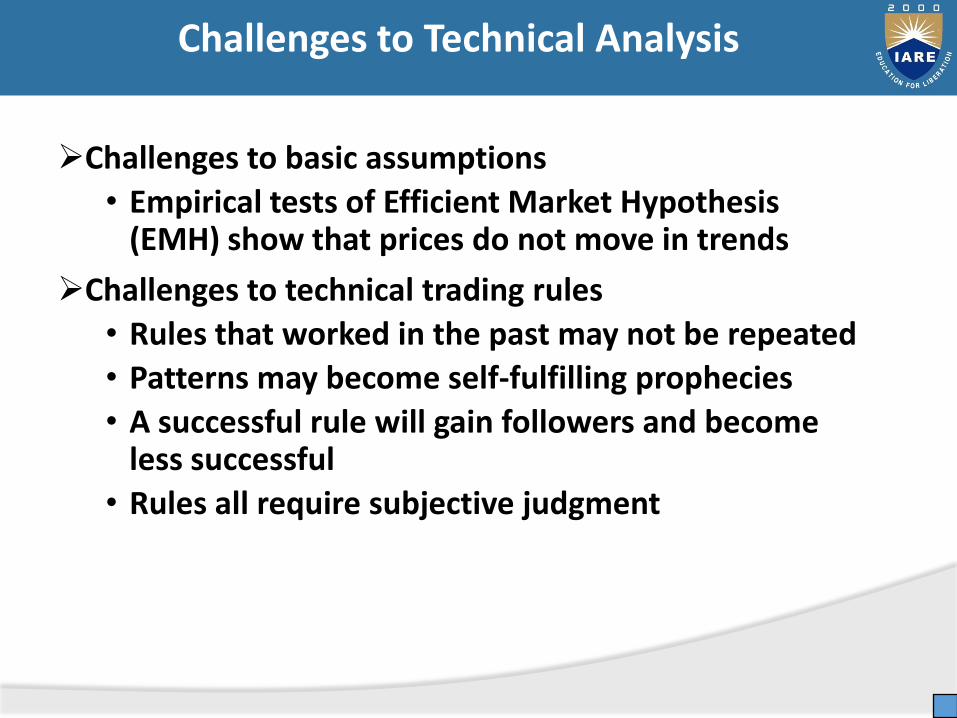
Challenges to Technical Analysis
Challenges to basic assumptions
• Empirical tests of Efficient Market Hypothesis (EMH) show that prices do not move in trends
Challenges to technical trading rules
• Rules that worked in the past may not be repeated
• Patterns may become self-fulfilling prophecies
• A successful rule will gain followers and become less successful
• Rules all require subjective judgment
Dow Theory
• Average discounts everything
• Market has three movements
• Price action determines trend
• Lines indicate movement
• Price/Volume relationship provides background
• Averages must confirm
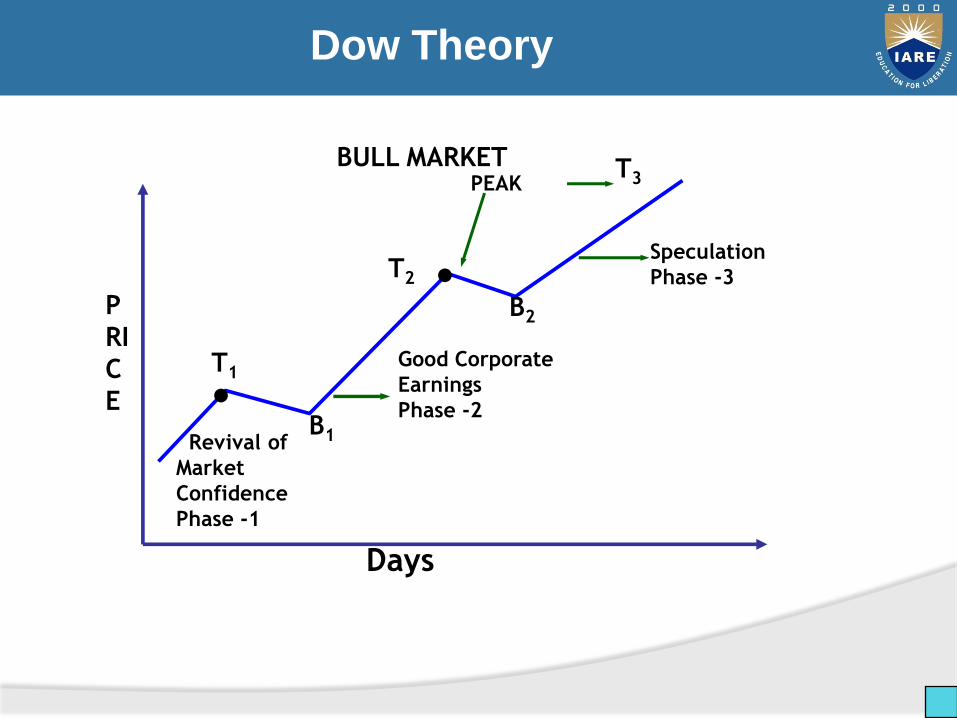
Dow Theory
Revival of
Market
Confidence
Phase -1
B1
B2
T1
T2
T3
Good Corporate
Earnings
Phase -2
Speculation
Phase -3
PEAK
●
●
BULL MARKET
P
RI
C
E
Days
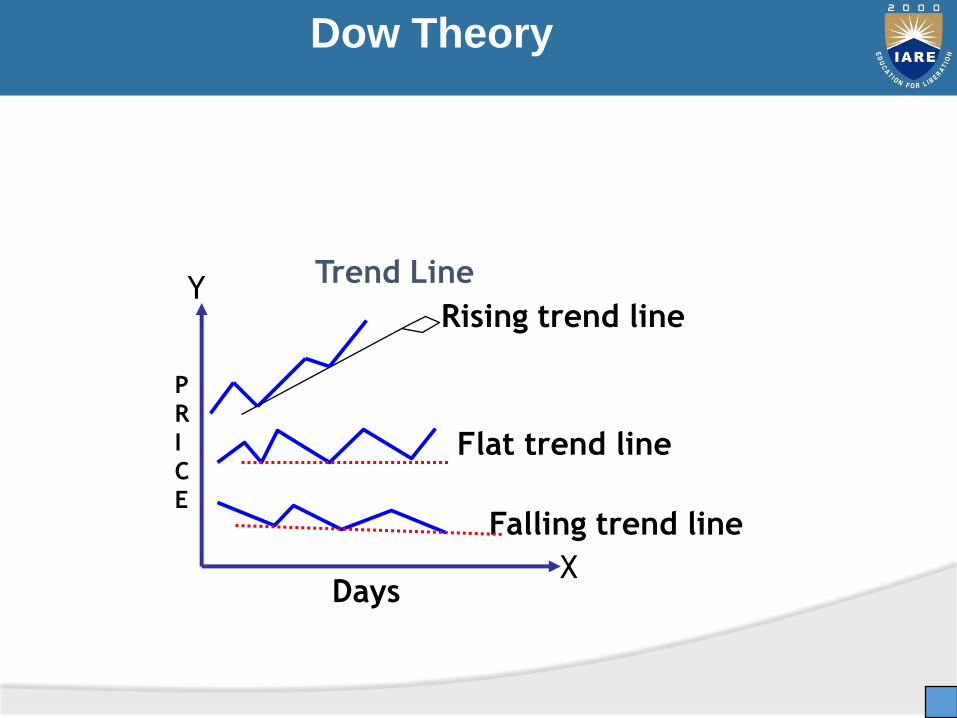
Dow Theory
Falling trend line
Flat trend line
Rising trend line
Trend Line
Days
P
R
I
C
E
X
Y
Types of Charts
• Bar Chart
• Line Chart
• Candle Stick Charting
• Point and Figure Chart
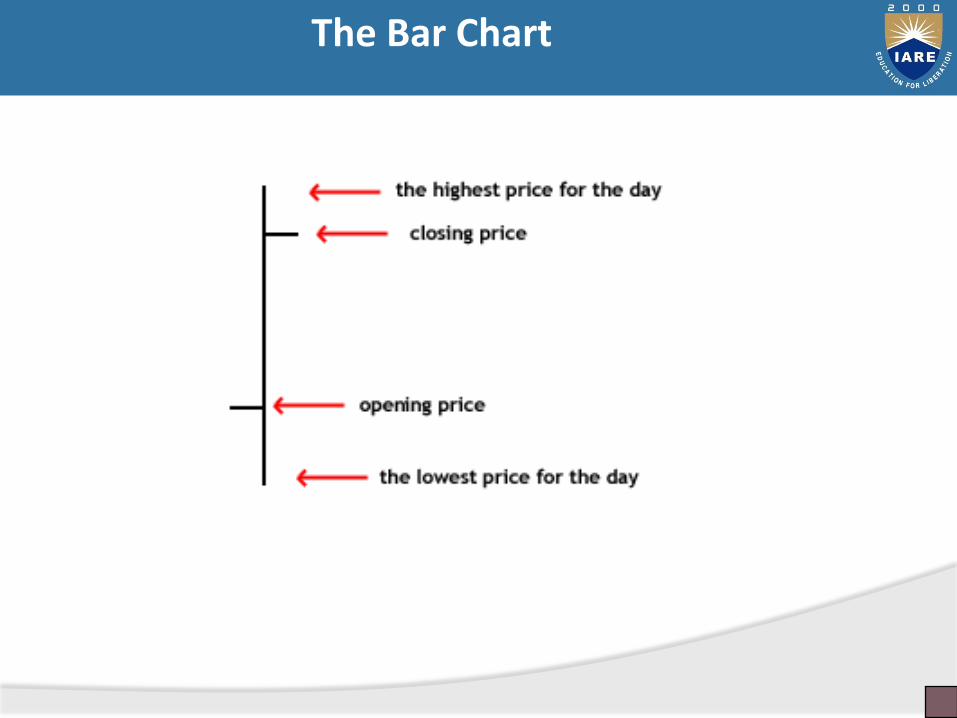
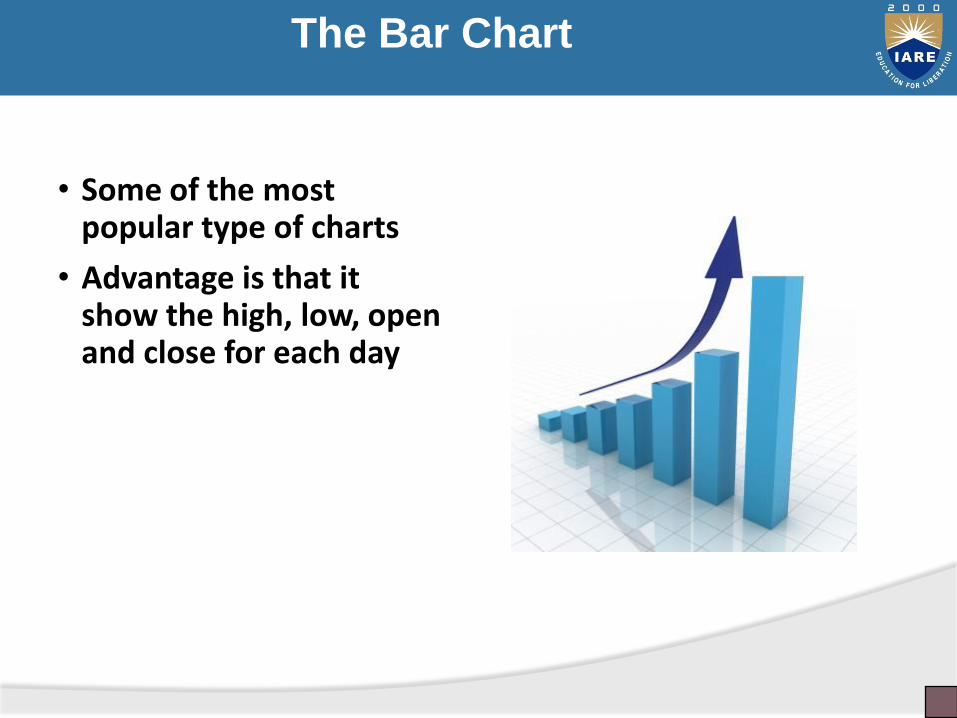
The Bar Chart
The Bar Chart
• Some of the most popular type of charts
• Advantage is that it show the high, low, open and close for each day
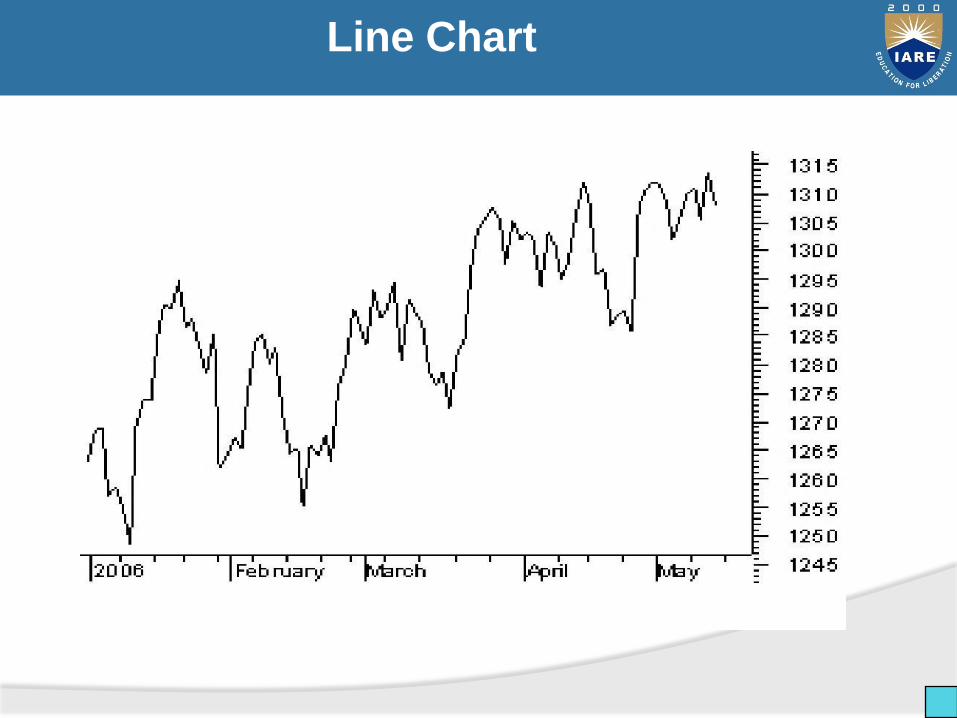
Line Chart
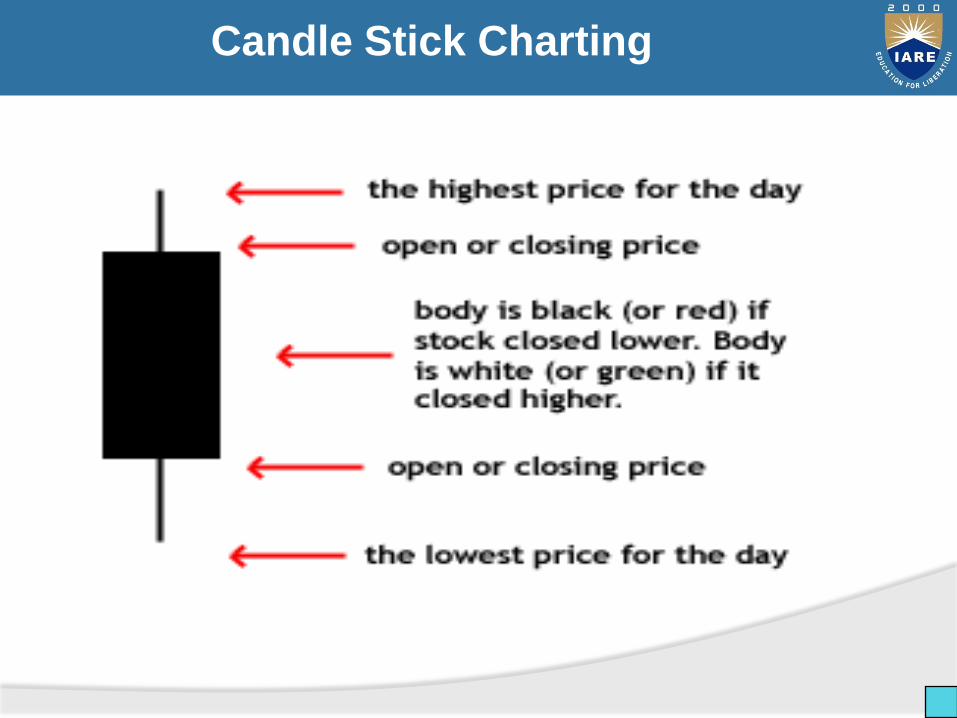
Candle Stick Charting
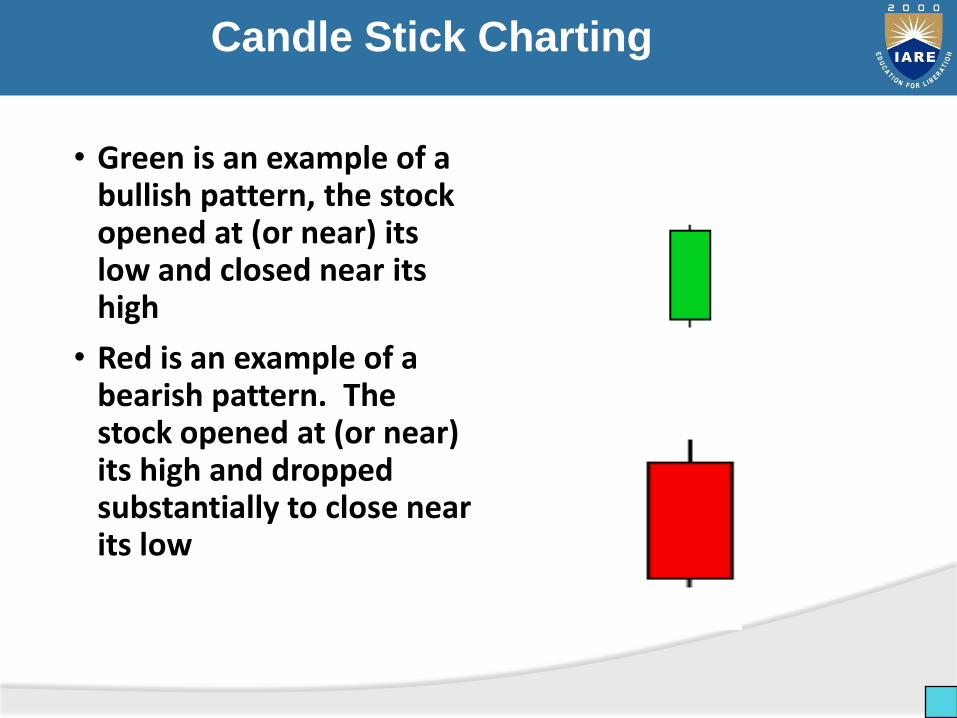
Candle Stick Charting
• Green is an example of a bullish pattern, the stock opened at (or near) its low and closed near its high
• Red is an example of a bearish pattern. The stock opened at (or near) its high and dropped substantially to close near its low
Point and Figure Chart
• Somewhat rare
• Plots day-to-day increases and declines in price.
• A rising stack of XXXX’s represents increases
• A rising stack of OOOO’s represents decreases.
• Typically used for intraday charting
• If used for multi-day study, only closing prices will be used
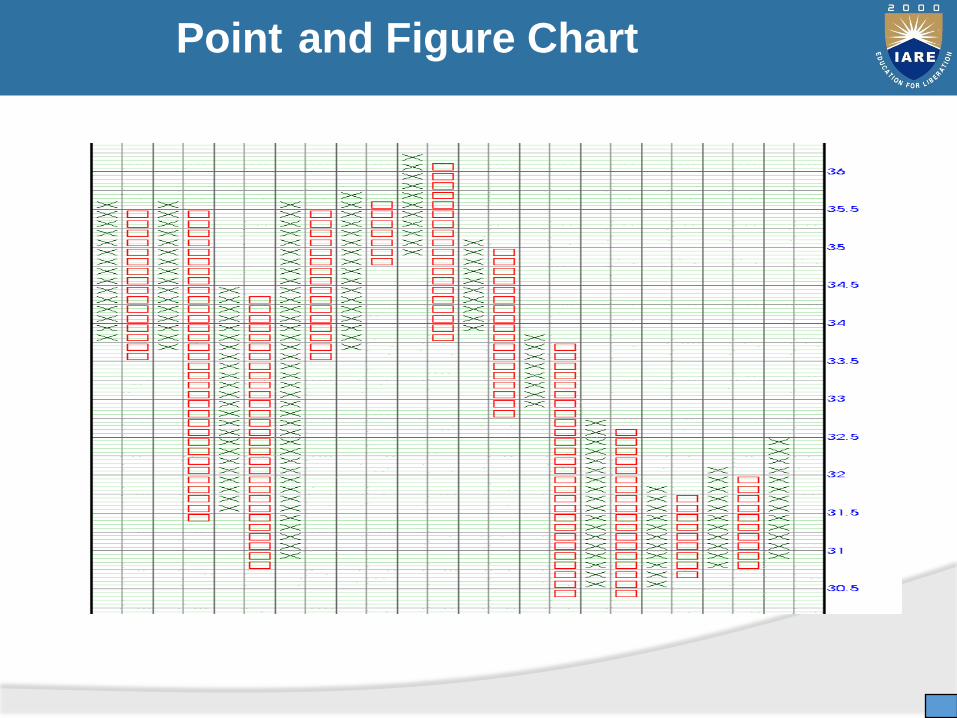
Point and Figure Chart
Point and Figure Chart
• Helps to filter out less-significant price movements allowing analyst to focus on most important trends
• Used to keep track of emerging price patterns
• Two attributes affecting the appearance of a point & figure chart
Technical Indicators
• There are, literally, hundreds of technical indicators used to generate buy and sell signals.
• We will look at just a few that I use:
1. Relative Strength Index (RSI)
2. On Balance Volume
3. Bollinger Bands
Relative Strength Index (RSI)
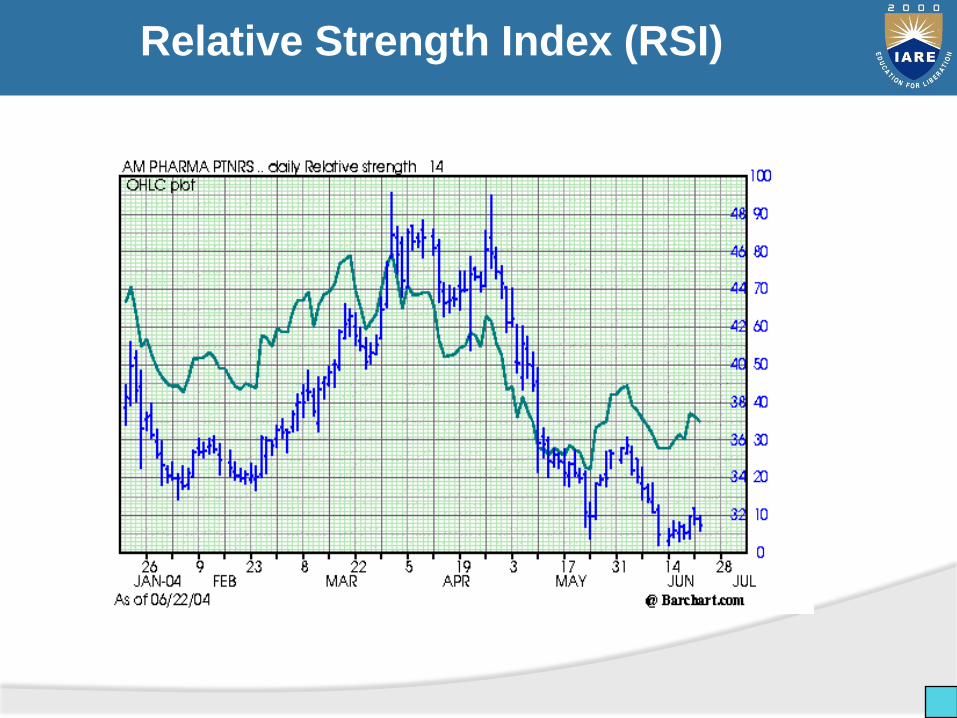
• A comparison between the days a stock finishes up against the days it finishes down.
• Big tool with momentum trading
• Ranges from 0 to 100
1. Stock considered overbought around the 70 level
2. Stock considered oversold around 30
• The shorter the number of days used to calculate the more volatile
Relative Strength Index (RSI)

Resistance and Support
Resistance
Support
Resistance/Suppor
t
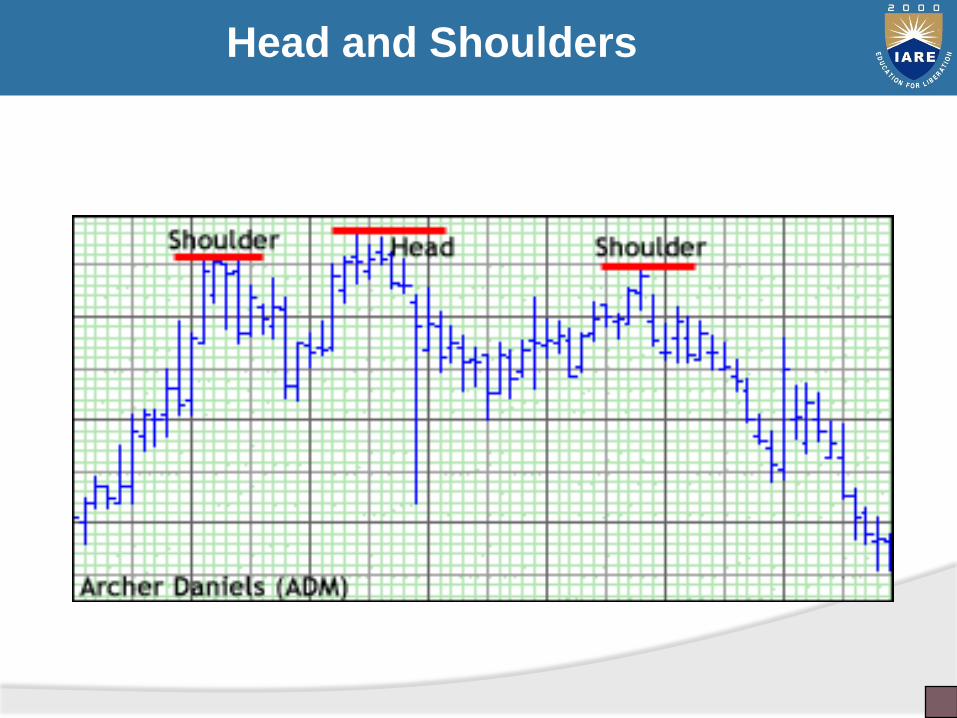
Head and Shoulders
• Resembles an “M” in which a stock’s price
1. Rises to a peak and then declines, then
2. Rises above the former peak and again declines,and then
3. Rises again but not the second peak and againdeclines
• The first and third peaks are shoulders, and thesecond peak forms the head.
• Very bearish indicator
Head and Shoulders
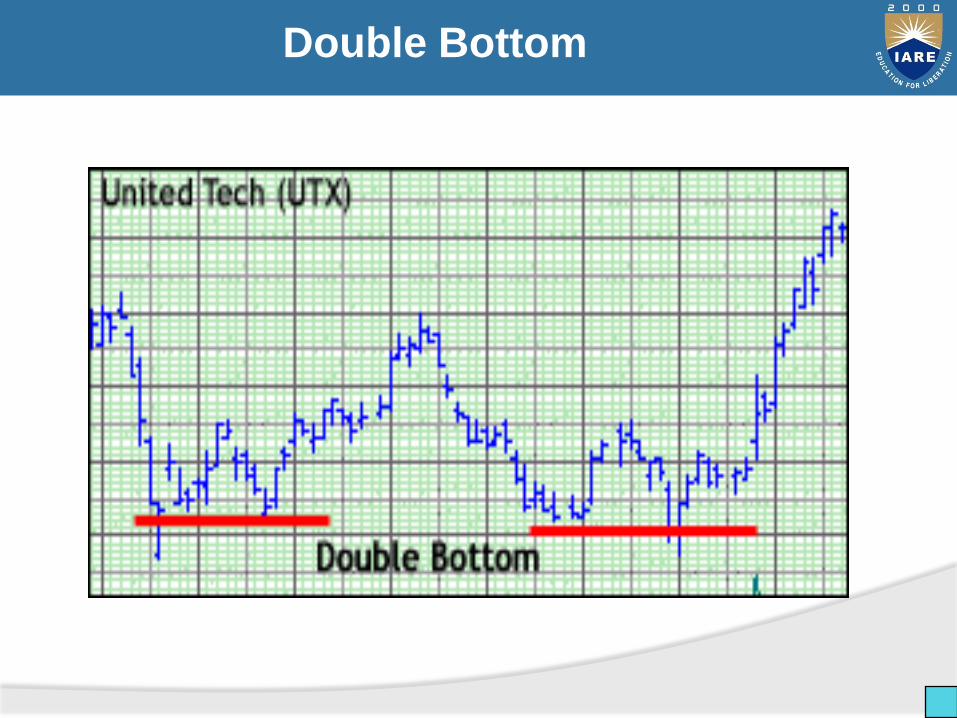
Double Bottom
• Occurs when a stock price drops to a similar price level twice within a few weeks or months
• The double-bottom pattern resembles a “W”
• Buy when the price passes the highest point in the handle.
• In a perfect double bottom, the second decline should normally go slightly lower than the first decline to create a shakeout of jittery investors
• The middle point of the “W” should not go into new high ground.
• This is a very bullish indicator
Double Bottom
UNIT II
PORTFOLIO ANALYSIS
Unit-II: Return and Risk
The risk inherent in holding a security is the variability, or the uncertainty, of its return
Factors that affect risk are
1. Maturity
• Underlying factors have more chance to change over a longer horizon
• Maturity value of the security may be eroded by inflation or currency fluctuations
• Increased chance of the issuer defaulting the longer is the time horizon
Return and Risk
2. Priority
• Bond holders have the first claim on the assets of a liquidated firm
• Bond holders are also able to put the corporation into bankruptcy if it defaults on payment
3. Liquidity
• Liquidity relates to how easy it is to sell an asset
• The existence of a highly developed and active secondary market raises liquidity
• A security's risk is raised if it is lacking liquidity
Risk and Return
4. Underlying Activities
• The economic activities of the issuer of the security can affect how risky it is
• Stock in small firms and in firms operating in high-technology sectors are on average more risky than those of large firms in traditional sectors

Return and Risk
• The greater the risk of a security, the higher is expected return
• Return is the compensation that has to be paid to induce investors to accept risk
• Success in investing is about balancing risk and return to achieve an optimal combination
• The risk always remains because of unpredictable variability in the returns on assets
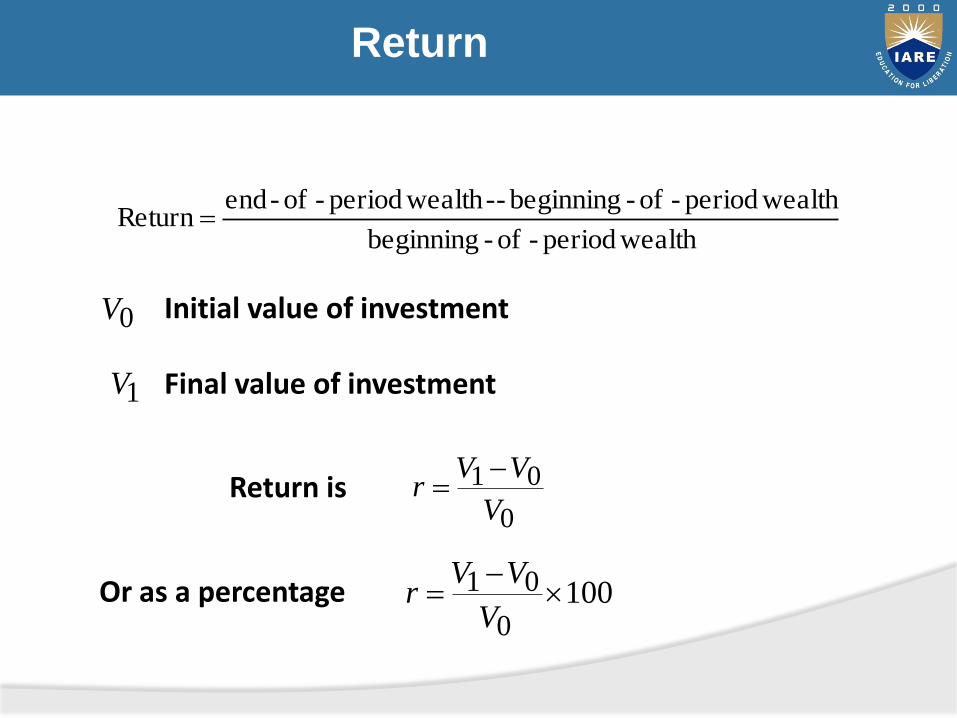
Return
wealthperiod-of-beginning
wealthperiod-of-beginning wealth period-of-endReturn
--
0V
1V
0
01
V
VVr
Initial value of investment
Final value of investment
Return is
Or as a percentage 1000
01
V
VVr
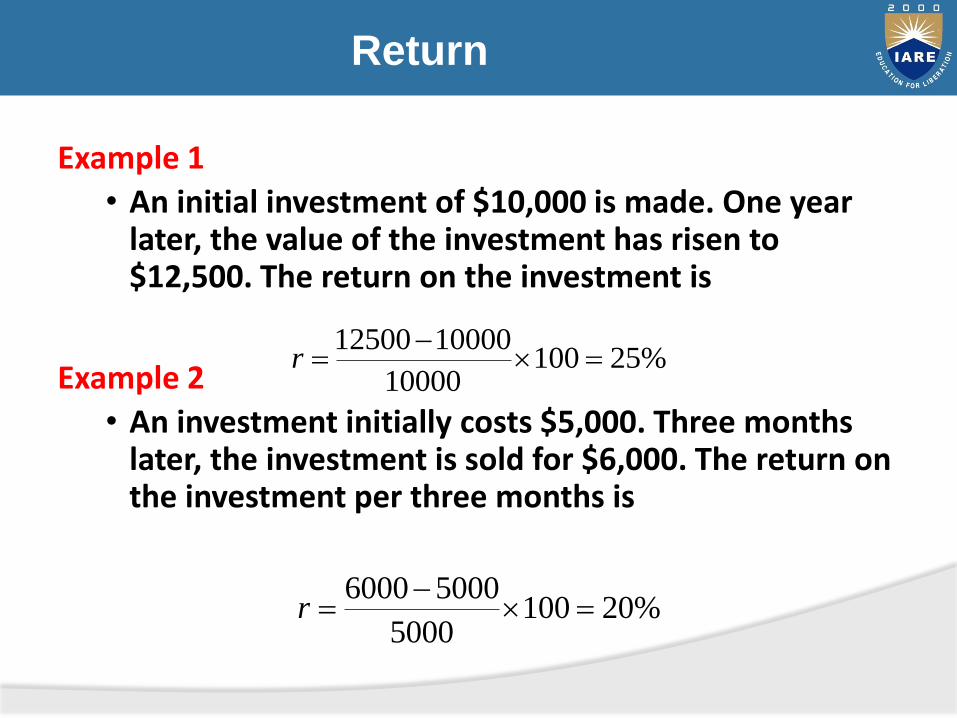
Return
Example 1
• An initial investment of $10,000 is made. One year later, the value of the investment has risen to $12,500. The return on the investment is
Example 2
• An investment initially costs $5,000. Three months later, the investment is sold for $6,000. The return on the investment per three months is
%2510010000
1000012500
r
%201005000
50006000
r
Efficient Markets Theory
Efficient Markets Hypothesis (EMH)
• Implication: you cannot consistently beat the market
• Prices Reflect all information
a. Past (Weak form efficiency)
b. Present or New (Semi-Strong form efficiency)
c. Inside (Strong form efficiency)
• Results of Academic Research
a. Markets mostly weak form efficient
b. Several Anomalies question semi-strong
c. Insiders consistently outperform the market
Lecture #3 All Rights Reserved 86
Modern Portfolio Theory (Markowitz)
MPT: 2 Sources of Risk
a. Variation
b. Covariance
Risk Management Strategy
a. Hold a diversified portfolio of assets
b. The more assets, the lower the risk
c. Assets are considered in terms of the variance and covariance they add to the portfolio
Lecture #3 All Rights Reserved 87
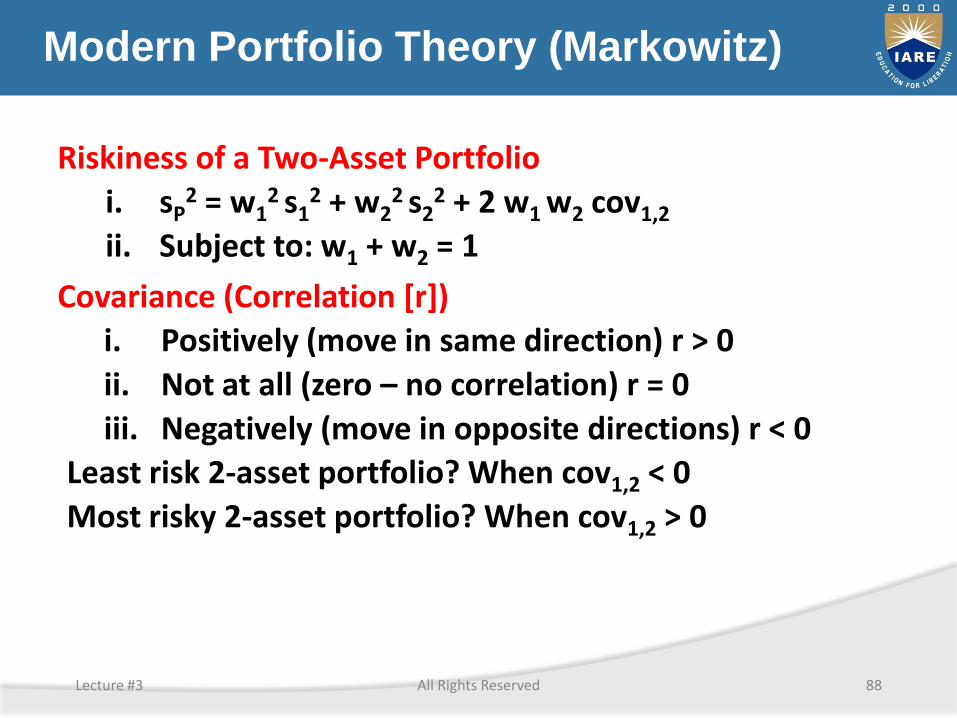
Modern Portfolio Theory (Markowitz)
Riskiness of a Two-Asset Portfolio
i. sP2 = w1
2 s12 + w2
2 s22 + 2 w1 w2 cov1,2
ii. Subject to: w1 + w2 = 1
Covariance (Correlation [r])
i. Positively (move in same direction) r > 0
ii. Not at all (zero – no correlation) r = 0
iii. Negatively (move in opposite directions) r < 0
Least risk 2-asset portfolio? When cov1,2 < 0
Most risky 2-asset portfolio? When cov1,2 > 0
Lecture #3 All Rights Reserved 88
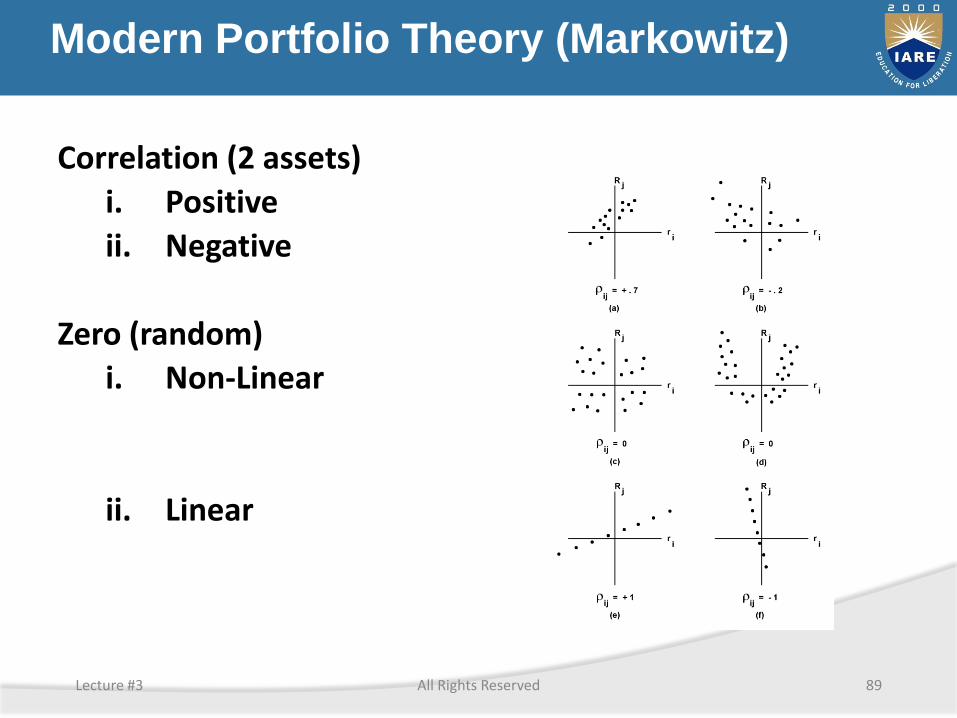
Modern Portfolio Theory (Markowitz)
Correlation (2 assets)
i. Positive
ii. Negative
Zero (random)
i. Non-Linear
ii. Linear
Lecture #3 All Rights Reserved 89
Modern Portfolio Theory (Markowitz)
Return on a Two-Asset Portfolio
• E (Rp) = w1 E(R1) + w2 E(R2)
General Form of MPT
• E(RP) = S wi E (Ri)
• sP2 = S wi
2 si2 + S S wi wj covi,j
• Subject to: S wi = 1
Lecture #3 All Rights Reserved 90
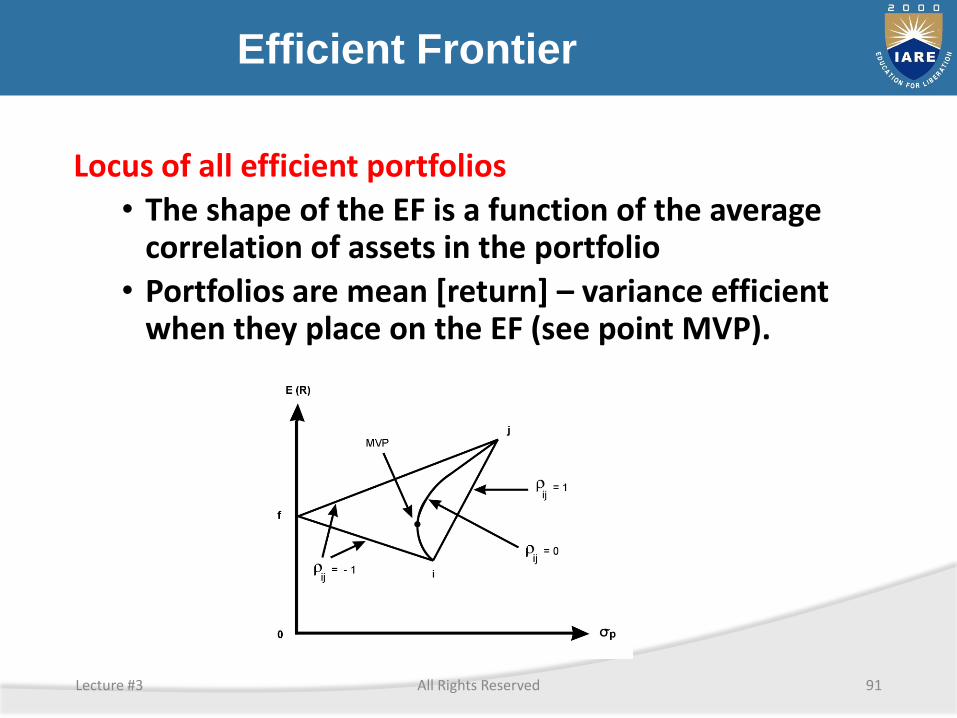
Efficient Frontier
Locus of all efficient portfolios
• The shape of the EF is a function of the average correlation of assets in the portfolio
• Portfolios are mean [return] – variance efficient when they place on the EF (see point MVP).
Lecture #3 All Rights Reserved 91
Selecting a Portfolio
Risk Preferences or Indifference1. Investors are generally assumed to be risk
averse.
• Prefer less risk to more for a given rate of return
• Prefer a higher return for a given level of risk
2. Indifference curves tell us something about our utility functions relative to wealth.
• How much do we value an additional unit of wealth?
• How much are we willing to risk to obtain it?
• See Figure 3-8 on page 3.20
Lecture #3 All Rights Reserved 92

Indifference Curves (Examples)
Lecture #3 All Rights Reserved 93
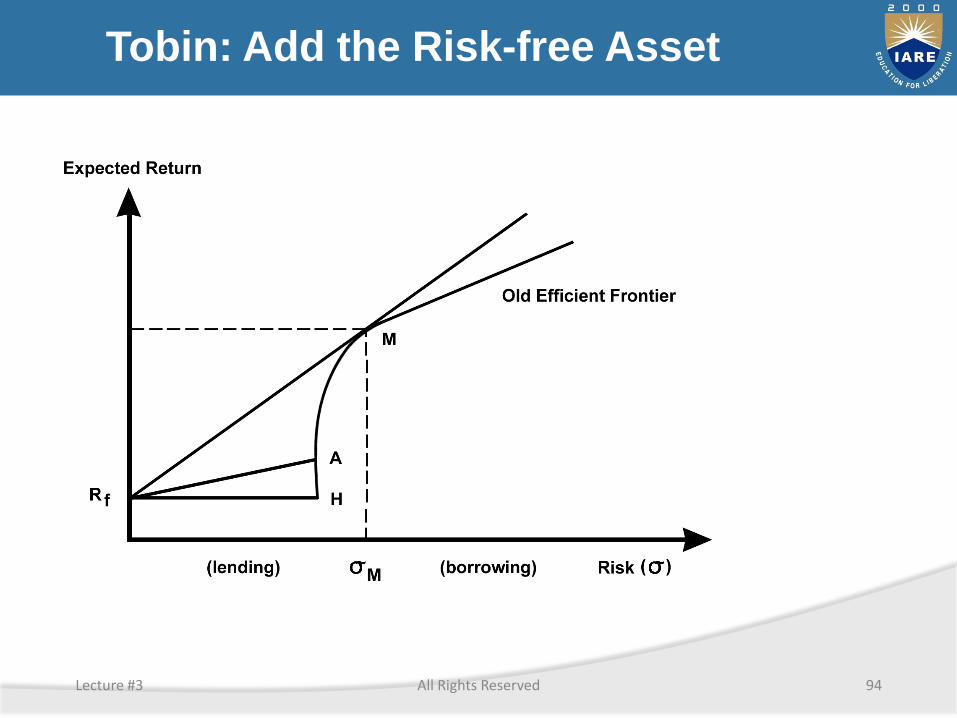
Tobin: Add the Risk-free Asset
Lecture #3 All Rights Reserved 94
Market Portfolio as Construct
Hypothetical portfolio representing each investment asset in the world in proportion to its relative weight in the universe of investment assets
Index Construction
i. Value weighted
ii. Equal weighted
Lecture #3 All Rights Reserved 95
Separation Theorem
Return to any efficient portfolio and its risk can be completely described by appropriate weighted average of two assets
1. the risk-free asset
2. the market portfolio
Two separate decisions
1. What risky investments to include in the market portfolio
2. How one should divide one’s money between the market portfolio and risk-free asset
Lecture #3 All Rights Reserved 96
Capital Asset Pricing Theory (Sharpe)
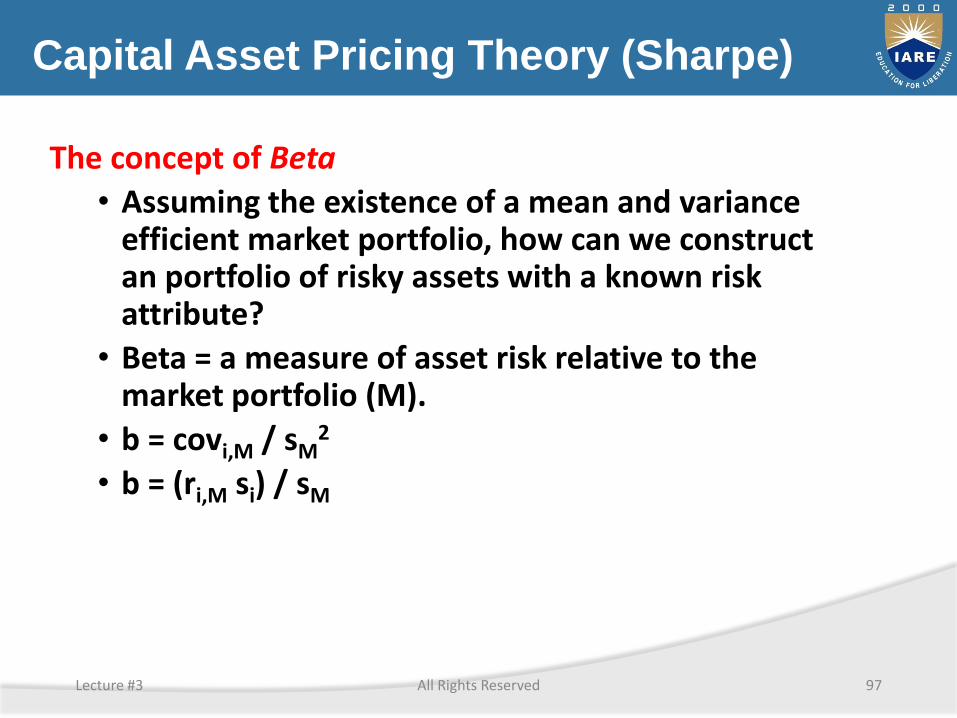
The concept of Beta
• Assuming the existence of a mean and variance efficient market portfolio, how can we construct an portfolio of risky assets with a known risk attribute?
• Beta = a measure of asset risk relative to the market portfolio (M).
• b = covi,M / sM2
• b = (ri,M si) / sM
Lecture #3 All Rights Reserved 97
Capital Asset Pricing Theory (Sharpe)
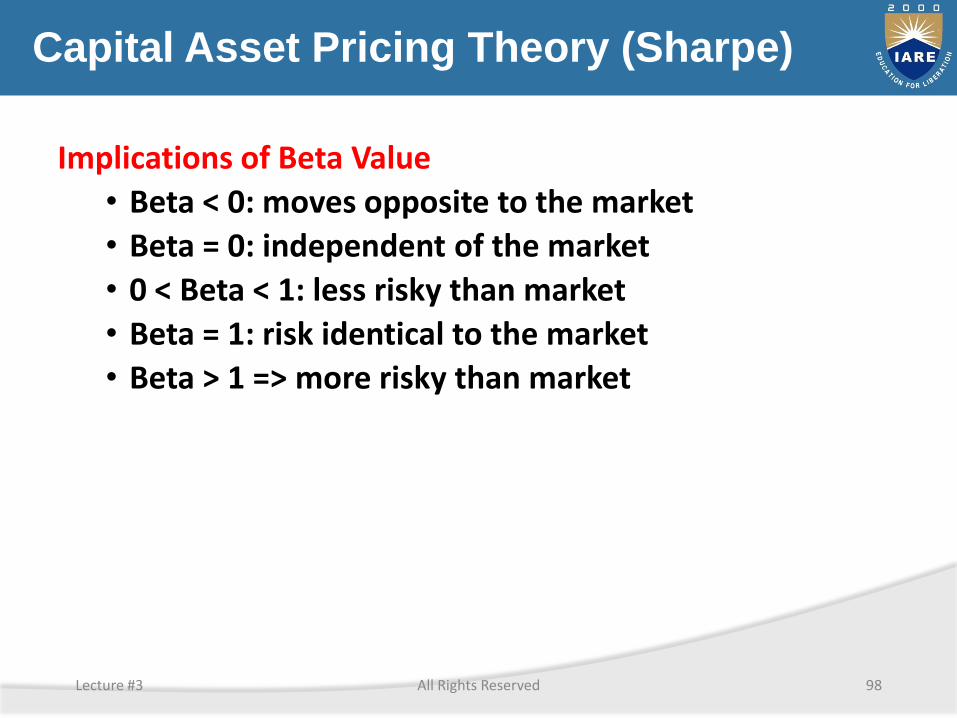
Implications of Beta Value
• Beta < 0: moves opposite to the market
• Beta = 0: independent of the market
• 0 < Beta < 1: less risky than market
• Beta = 1: risk identical to the market
• Beta > 1 => more risky than market
Lecture #3 All Rights Reserved 98
Capital Asset Pricing Theory (Sharpe)
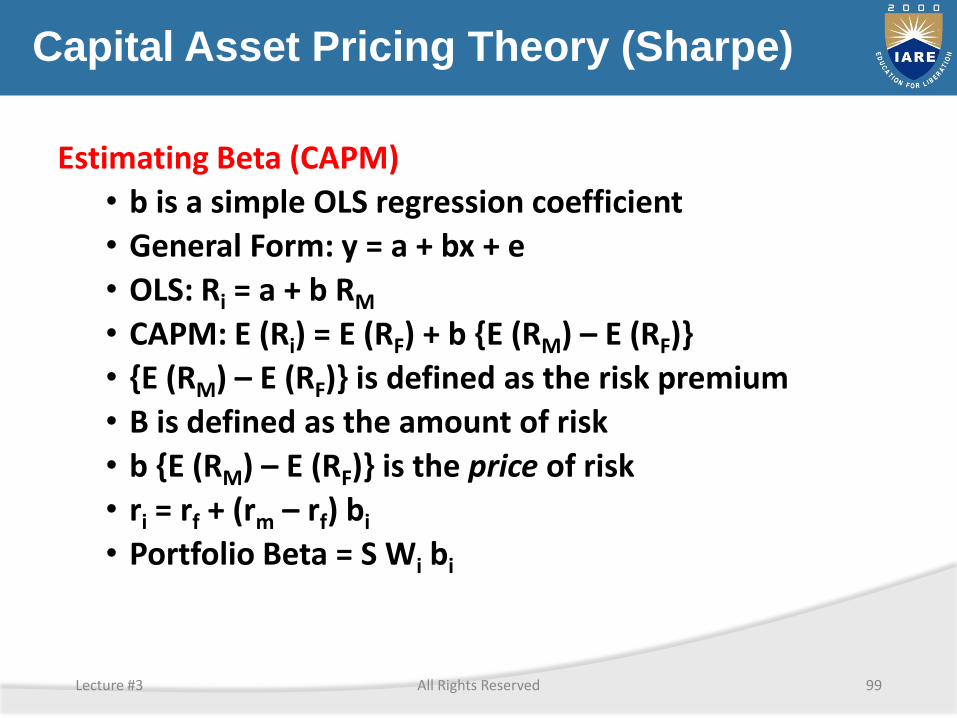
Estimating Beta (CAPM)
• b is a simple OLS regression coefficient
• General Form: y = a + bx + e
• OLS: Ri = a + b RM
• CAPM: E (Ri) = E (RF) + b {E (RM) – E (RF)}
• {E (RM) – E (RF)} is defined as the risk premium
• B is defined as the amount of risk
• b {E (RM) – E (RF)} is the price of risk
• ri = rf + (rm – rf) bi
• Portfolio Beta = S Wi bi
Lecture #3 All Rights Reserved 99
Capital Asset Pricing Theory (Sharpe)
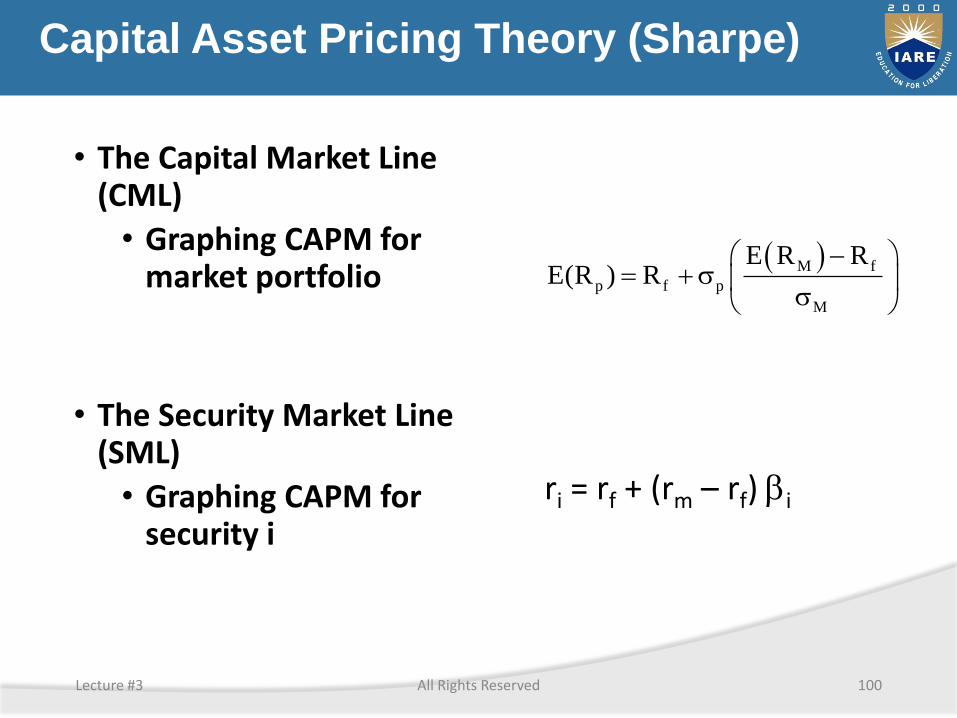
• The Capital Market Line (CML)
• Graphing CAPM for market portfolio
• The Security Market Line (SML)
• Graphing CAPM for security i
M f
p f p
M
E R RE(R ) R
ri = rf + (rm – rf) bi
Lecture #3 All Rights Reserved 100
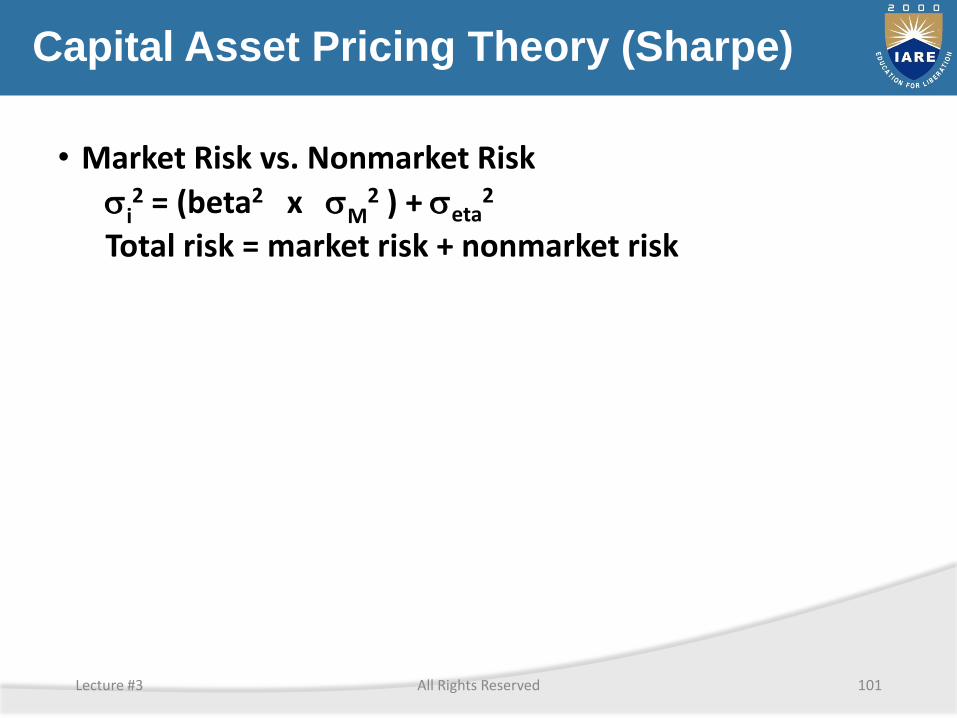
Capital Asset Pricing Theory (Sharpe)
• Market Risk vs. Nonmarket Risk
i2 = (beta2 x M
2 ) + eta2
Total risk = market risk + nonmarket risk
Lecture #3 All Rights Reserved 101
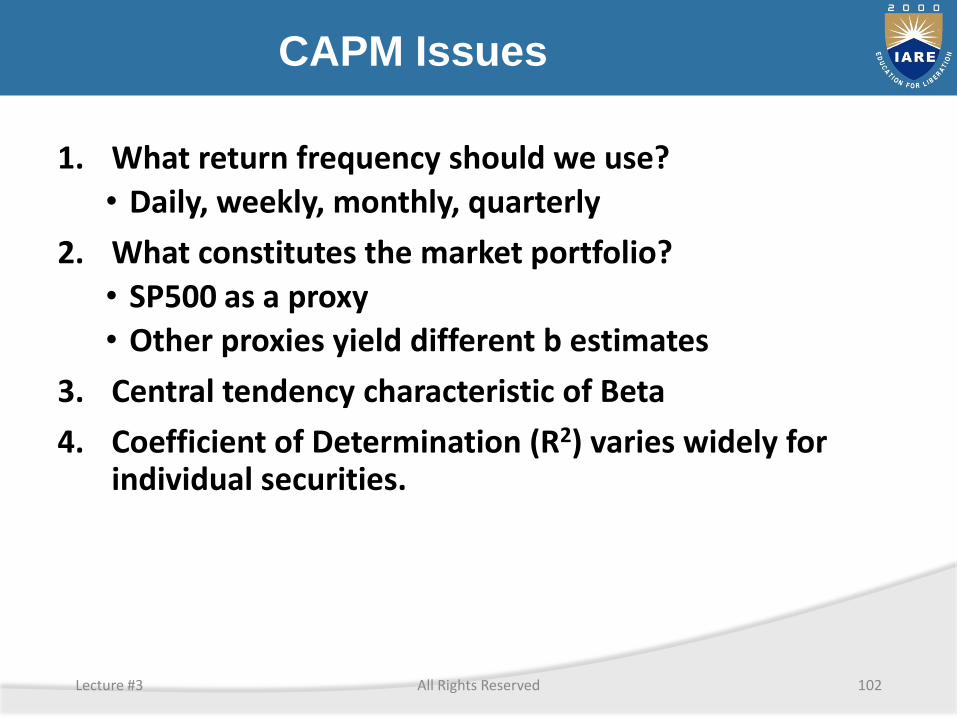
CAPM Issues
1. What return frequency should we use?
• Daily, weekly, monthly, quarterly
2. What constitutes the market portfolio?
• SP500 as a proxy
• Other proxies yield different b estimates
3. Central tendency characteristic of Beta
4. Coefficient of Determination (R2) varies widely for individual securities.
Lecture #3 All Rights Reserved 102
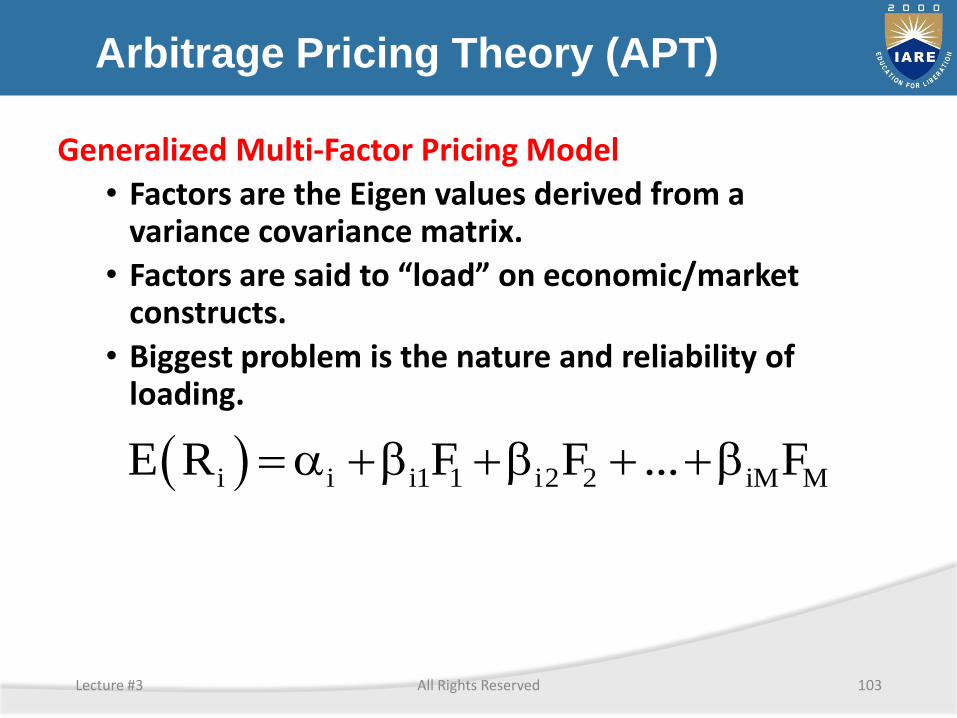
Arbitrage Pricing Theory (APT)
Generalized Multi-Factor Pricing Model
• Factors are the Eigen values derived from a variance covariance matrix.
• Factors are said to “load” on economic/market constructs.
• Biggest problem is the nature and reliability of loading.
i i i1 1 i2 2 iM ME R F F ... F b b b
Lecture #3 All Rights Reserved 103
UNIT III
BOND ANALYSIS AND VALUATION AND MANAGEMENT
Unit-III: Characteristics of Bonds
Bonds: debt securities that pay a rate of interest based upon the face amount or par value of the bond.
Price changes as market interest changes
Interest payments are commonly semiannual
Bond investors receive full face amount when bonds mature
Zero coupon bonds – no periodic payment (no interest reinvestment rate)
Bond Pricing
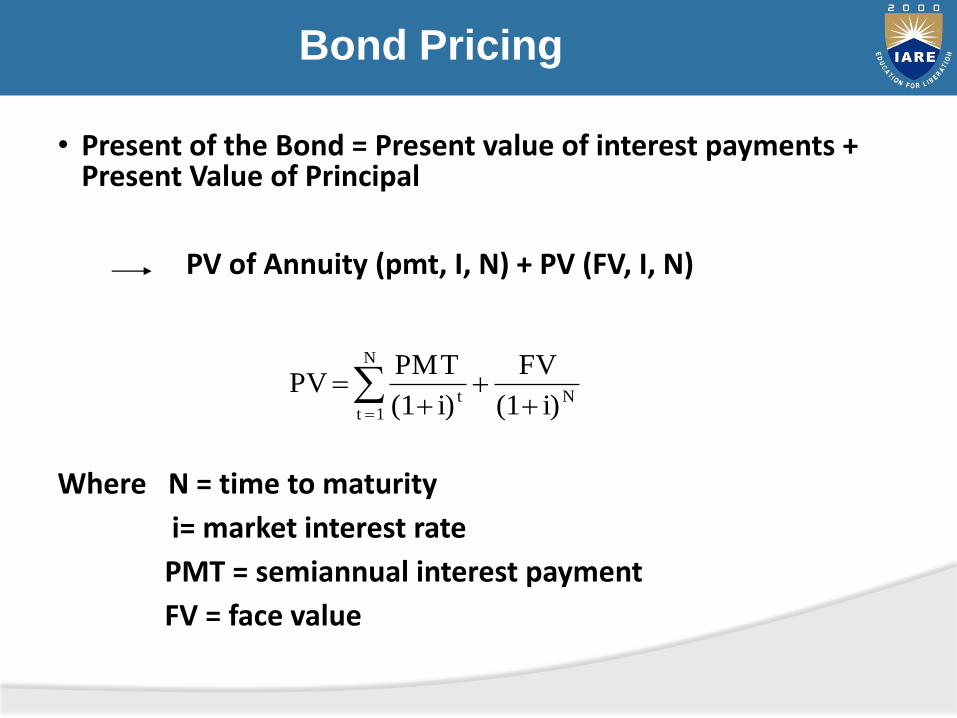
• Present of the Bond = Present value of interest payments + Present Value of Principal
PV of Annuity (pmt, I, N) + PV (FV, I, N)
Where N = time to maturity
i= market interest rate
PMT = semiannual interest payment
FV = face value
N
N
1 t t i)(1
FV
i)(1
PMT PV

Bond price calculation
The bond pays $25 semiannual coupon payment Maturity:three years and one month Market interest rate: 6% (APR)
Solution:
Using financial calculator
N = 2 x 3 1/12 = 6.167 yrs
I/Y = 6% /2 = 3%
PMT = 25
FV = $1,000
PV = $972.23
Callable Bonds
• Call provision allows the issuer to repay the investors’ principal early.
• Issuers call the bond when they want to refinance their debt at the lower interest rate
• Call price is commonly the face value plus one year of interest payments.
• Call protection: amount of the time before the bond becomes callable.

Expected yield Calculation
Yield to maturity (or yield to call): expected total rate of return if investor were to buy and hold the bond until maturity or until call date.
• Internal rate of return of the bond that equates the present value of the cash flow with the price of the bond.
Solve for I in
Bond price = PV of Annuity (pmt, I, N) + PV (FV , I, N)
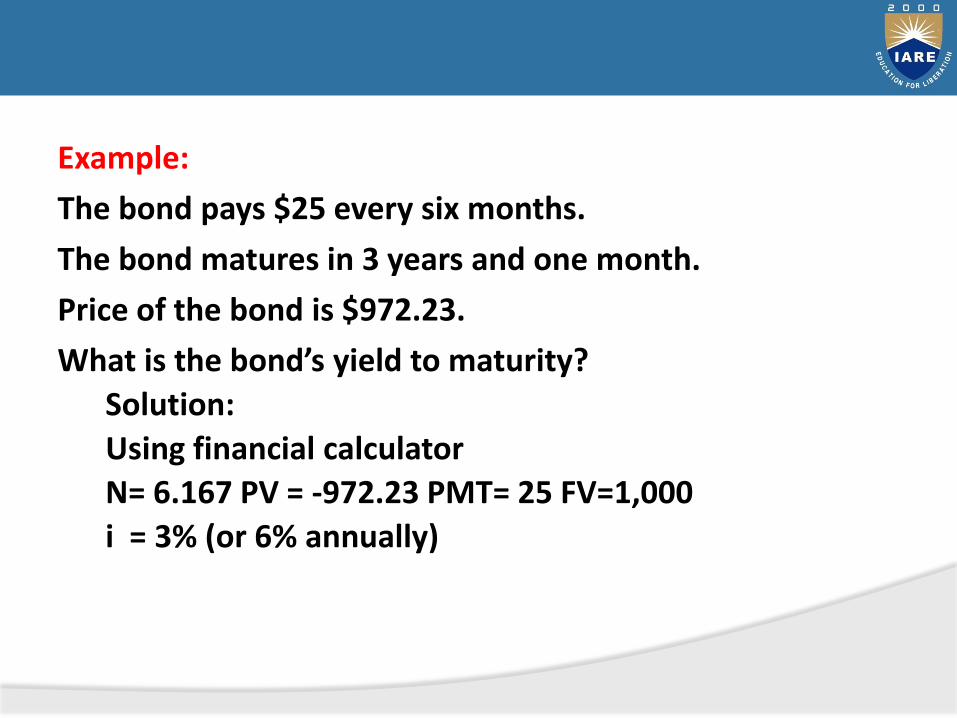
Example:
The bond pays $25 every six months.
The bond matures in 3 years and one month.
Price of the bond is $972.23.
What is the bond’s yield to maturity?
Solution:
Using financial calculator
N= 6.167 PV = -972.23 PMT= 25 FV=1,000
i = 3% (or 6% annually)
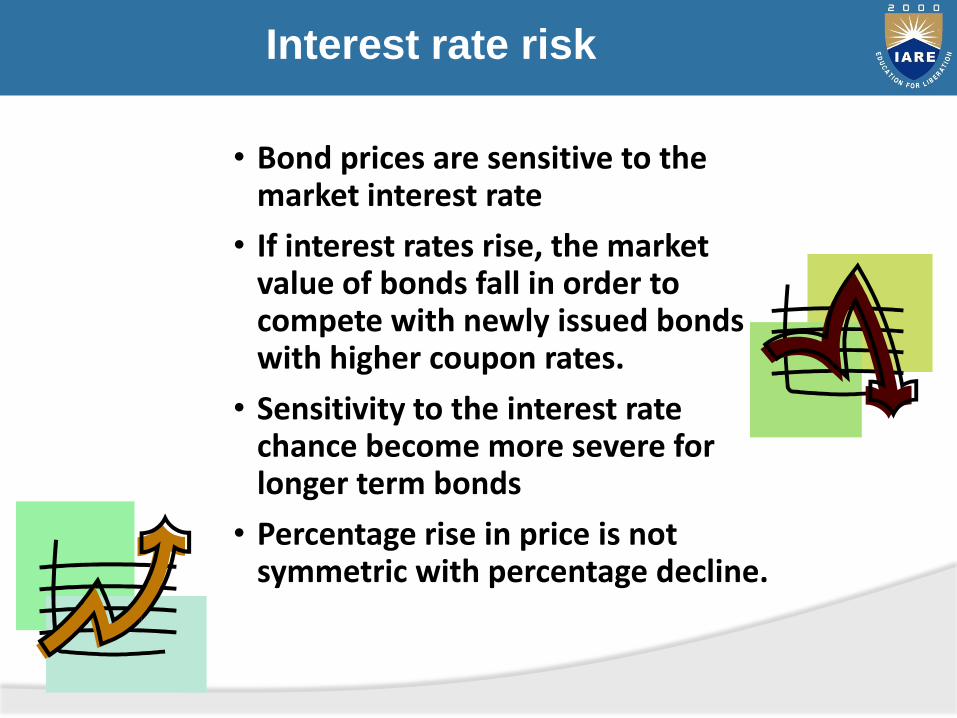
Interest rate risk
• Bond prices are sensitive to the market interest rate
• If interest rates rise, the market value of bonds fall in order to compete with newly issued bonds with higher coupon rates.
• Sensitivity to the interest rate chance become more severe for longer term bonds
• Percentage rise in price is not symmetric with percentage decline.
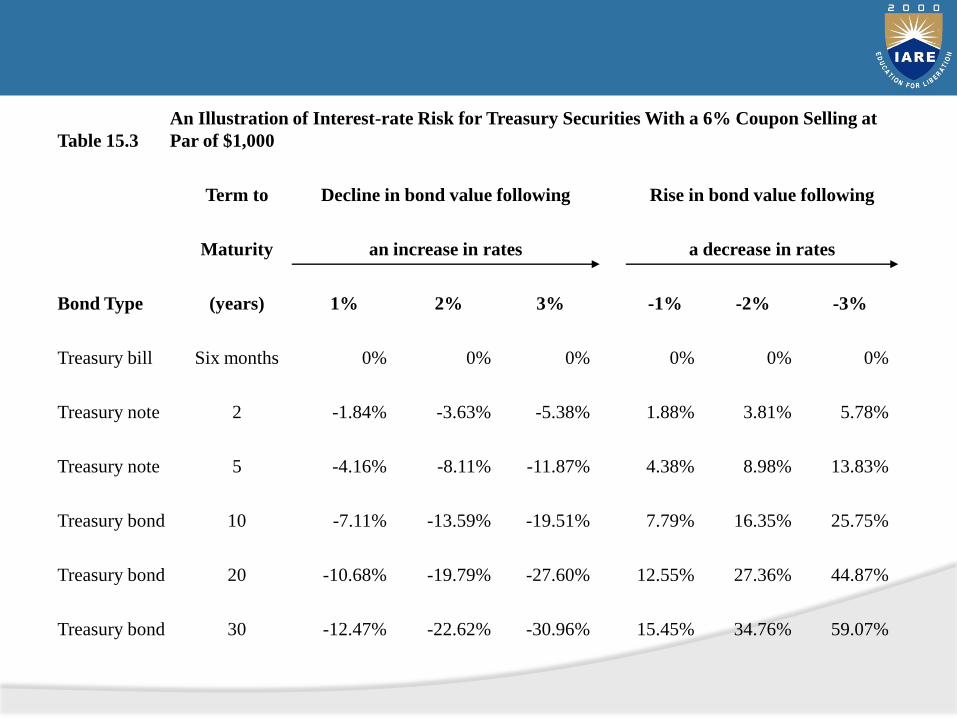
Table 15.3
An Illustration of Interest-rate Risk for Treasury Securities With a 6% Coupon Selling at
Par of $1,000
Term to Decline in bond value following Rise in bond value following
Maturity an increase in rates a decrease in rates
Bond Type (years) 1% 2% 3% -1% -2% -3%
Treasury bill Six months 0% 0% 0% 0% 0% 0%
Treasury note 2 -1.84% -3.63% -5.38% 1.88% 3.81% 5.78%
Treasury note 5 -4.16% -8.11% -11.87% 4.38% 8.98% 13.83%
Treasury bond 10 -7.11% -13.59% -19.51% 7.79% 16.35% 25.75%
Treasury bond 20 -10.68% -19.79% -27.60% 12.55% 27.36% 44.87%
Treasury bond 30 -12.47% -22.62% -30.96% 15.45% 34.76% 59.07%
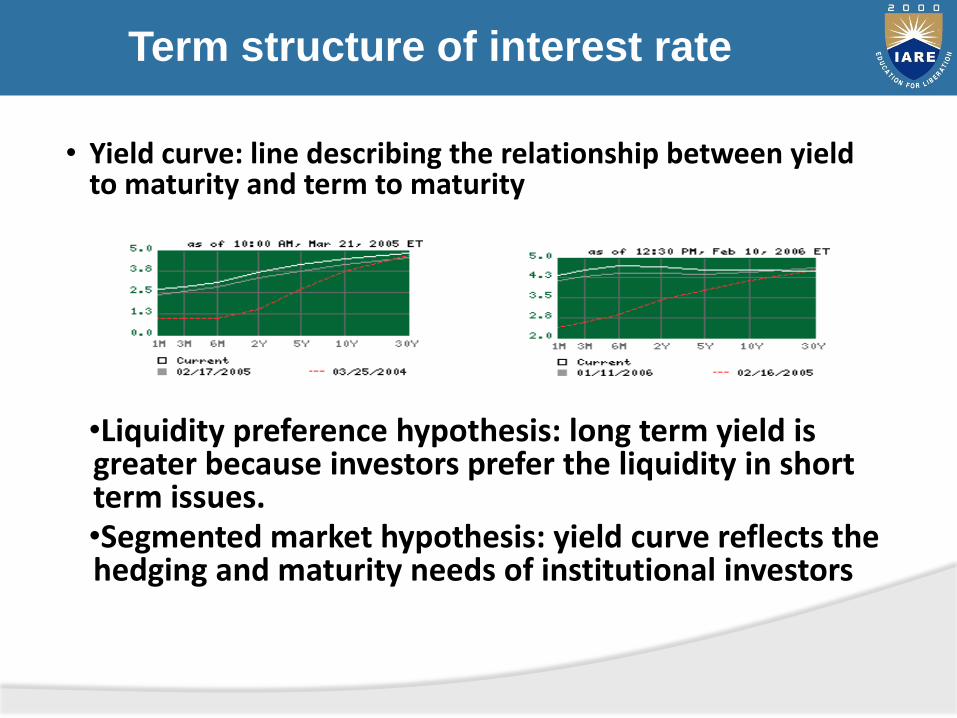
Term structure of interest rate
• Yield curve: line describing the relationship between yield to maturity and term to maturity
•Liquidity preference hypothesis: long term yield is greater because investors prefer the liquidity in short term issues.•Segmented market hypothesis: yield curve reflects the hedging and maturity needs of institutional investors
Duration
• Term to maturity is an imperfect measure of bond risk because it ignores the valuation effects of differences in coupon rate and principal payment schedule
• Duration: an estimate of economic life of a bond measured by the weighted average time to receipt of cash flows
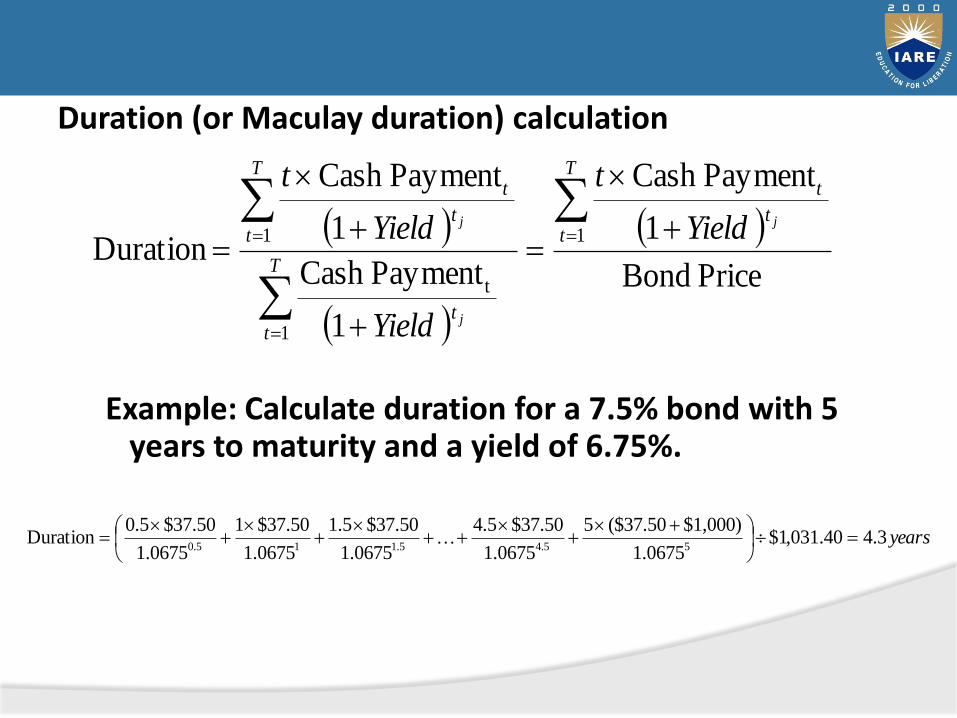
Duration (or Maculay duration) calculation
Example: Calculate duration for a 7.5% bond with 5 years to maturity and a yield of 6.75%.
Price Bond
1
PaymentCash
1
PaymentCash
1
PaymentCash
Duration 1
1
t
1
T
tt
t
T
tt
T
tt
t
j
j
j Yield
t
Yield
Yield
t
years3.440.031,1$0675.1
$1,000)$37.50(5
0675.1
$37.504.5
0675.1
$37.501.5
0675.1
$37.501
0675.1
$37.500.5Duration
55.45.115.0

• Direct estimate of the percentage change in bond price for each percentage point change in the market interest rate.
% change in bond price = – 1 ×% Yield change ×modified duration
Example: given that duration is 4.3 yrs, if interest rates fall by 0.5% what is the change in the bond price?
Modified duration = 4.3 / (1.0337) = 4.16
% change in price= -1× (–0.5%)×4.16 = 2.08%
Yearper PaymentsCoupon
Yield1
Durationduration Modified
Convexity
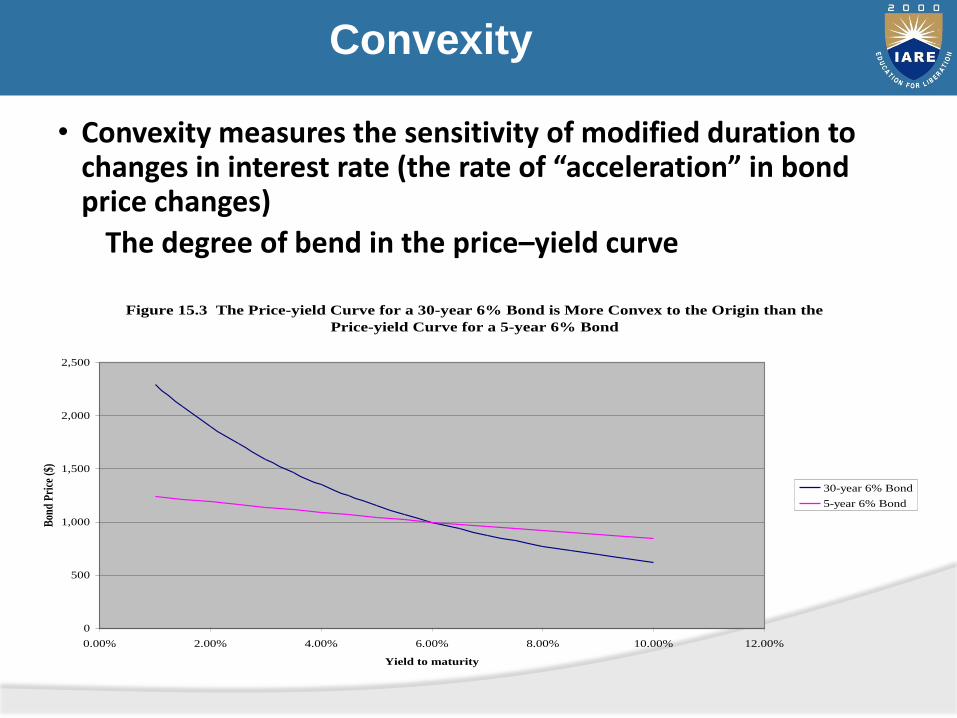
• Convexity measures the sensitivity of modified duration to changes in interest rate (the rate of “acceleration” in bond price changes)
The degree of bend in the price–yield curve
Figure 15.3 The Price-yield Curve for a 30-year 6% Bond is More Convex to the Origin than the
Price-yield Curve for a 5-year 6% Bond
0
500
1,000
1,500
2,000
2,500
0.00% 2.00% 4.00% 6.00% 8.00% 10.00% 12.00%
Yield to maturity
Bon
d P
rice
($)
30-year 6% Bond
5-year 6% Bond

Bond pricing using convexity and duration
• % bond price change = – 1 × % Yield change × modified duration + ½ × convexity × (Yield change)2
• Using both duration and convexity allows for a more accurate estimation
2
1
2
1Price Bond
1
PaymentCash
Convexity Yield
Yield
ttT
tt
t
j
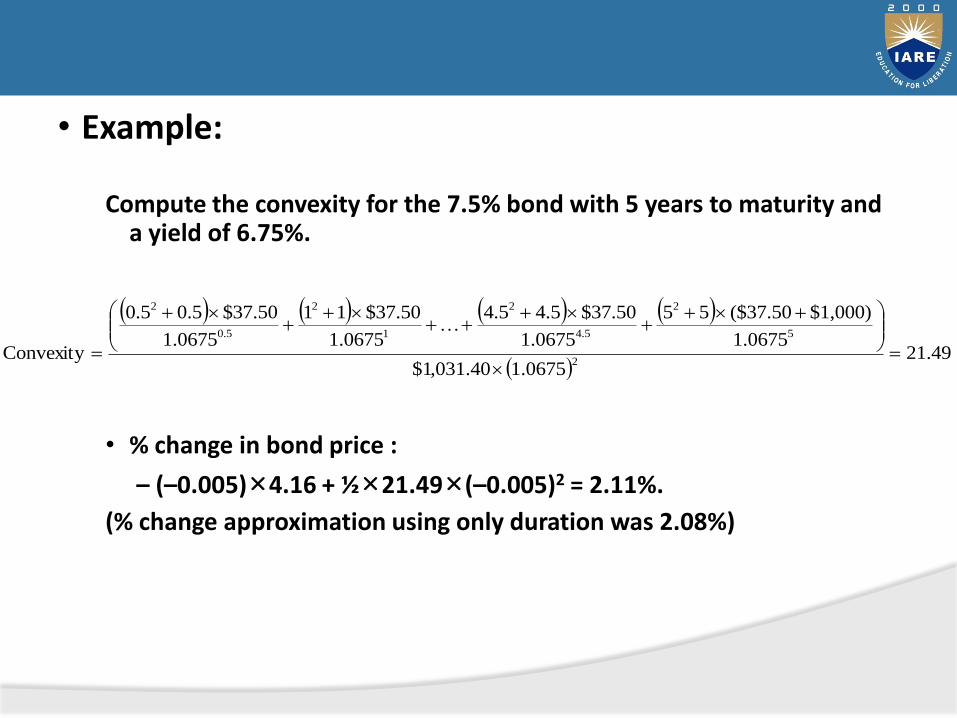
• Example:
Compute the convexity for the 7.5% bond with 5 years to maturity and a yield of 6.75%.
• % change in bond price :
– (–0.005)×4.16 + ½×21.49×(–0.005)2 = 2.11%.
(% change approximation using only duration was 2.08%)
49.21
0675.140.031,1$
0675.1
$1,000)$37.50(55
0675.1
$37.505.44.5
0675.1
$37.5011
0675.1
$37.505.00.5
Convexity2
5
2
5.4
2
1
2
5.0
2
Convertible bonds
• A special type of bond that can be exchanged into some more junior grade of securities (usually into common stock)
• Conversion value = # of equivalent common shares multiplied by the current share price
• Premium to conversion = % over conversion value at which the convertible trades
• Break even time = # of years needed to recover the conversion premium with the convertible’s higher income
Example:
A common stock pays a 35¢ dividend and has a price of $55/share. The company also has 6% convertible bond selling at 118% of the par value, convertible into common at $50/share. What is the conversion ratio, conversion value, and premium to convert?
Solution:
The conversion ratio is $1,000/$50 = 20:1.
The conversion value is 20$55 = $1,100.
The premium to convert is $1,180 - $1,100 = $80.
• Interest from convertible bond: $60
• Dividend from stocks when converted: $7
• Therefore, holding convertible yields higher income.
Bond Investment Strategies
Why invest in bonds?
• Stable income and diversification
Asset allocation: the process of diversifying an investment portfolio across various asset categories, like stocks and bonds and cash to balance the risk/reward tradeoff.
• Prime benefit: the risk reduction
• Even modest amount of diversification can sharply dampen portfolio risk
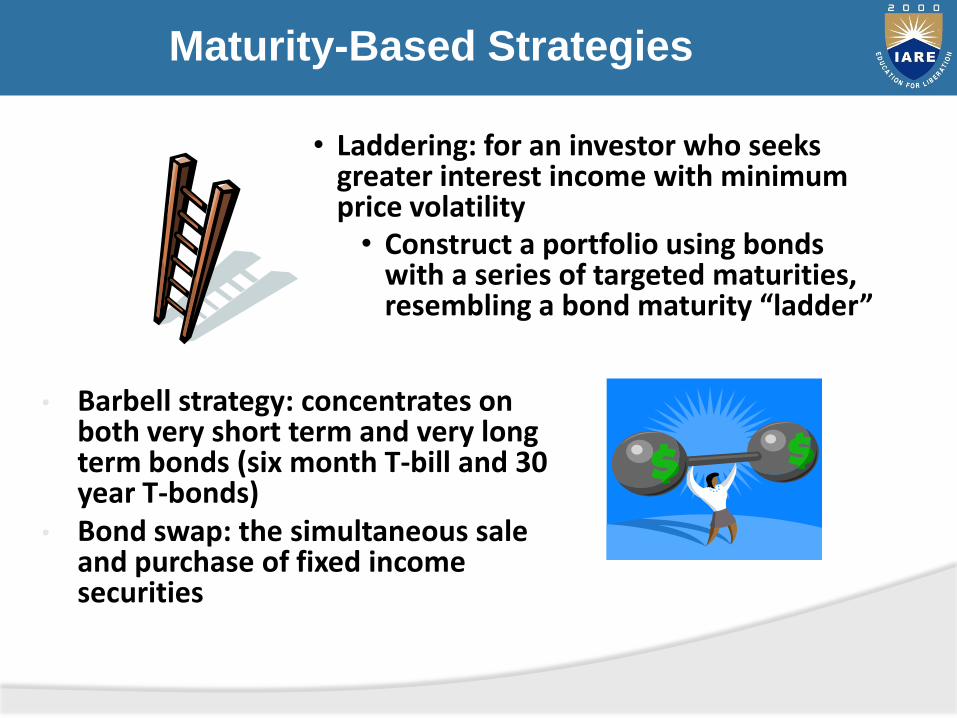
Maturity-Based Strategies
• Laddering: for an investor who seeks greater interest income with minimum price volatility
• Construct a portfolio using bonds with a series of targeted maturities, resembling a bond maturity “ladder”
• Barbell strategy: concentrates on both very short term and very long term bonds (six month T-bill and 30 year T-bonds)
• Bond swap: the simultaneous sale and purchase of fixed income securities
UNIT IV
EQUITY VALUATION AND DERIVATIVES
18-126
Valuation: Fundamental Analysis
• Fundamental analysis models a company’s value by assessing its current and future profitability.
• The purpose of fundamental analysis is to identify mispriced stocks relative to some measure of “true” value derived from financial data.
18-127
• Balance Sheet Models
• Dividend Discount Models (DDM)
• Price/Earnings Ratios
• Free Cash Flow Models
Models of Equity Valuation
18-128
Valuation by Comparables
• Compare valuation ratios of firm to industry averages.
• Ratios like price/sales are useful for valuing start-ups that have yet to generate positive earnings.
18-129
Limitations of Book Value
• Book values are based on historical cost, not actual market values.
• It is possible, but uncommon, for market value to be less than book value.
• “Floor” or minimum value is the liquidation value per share.
• Tobin’s q is the ratio of market price to replacement cost.
18-130
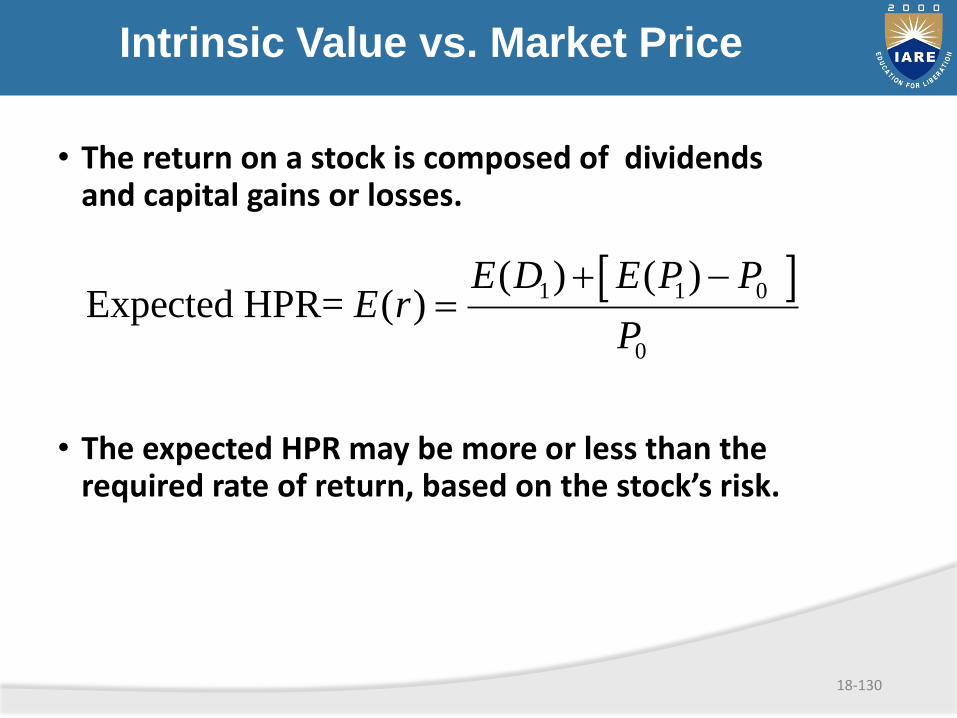
Intrinsic Value vs. Market Price
• The return on a stock is composed of dividends and capital gains or losses.
• The expected HPR may be more or less than the required rate of return, based on the stock’s risk.
1 1 0
0
( ) ( )Expected HPR= ( )
E D E P PE r
P
18-131
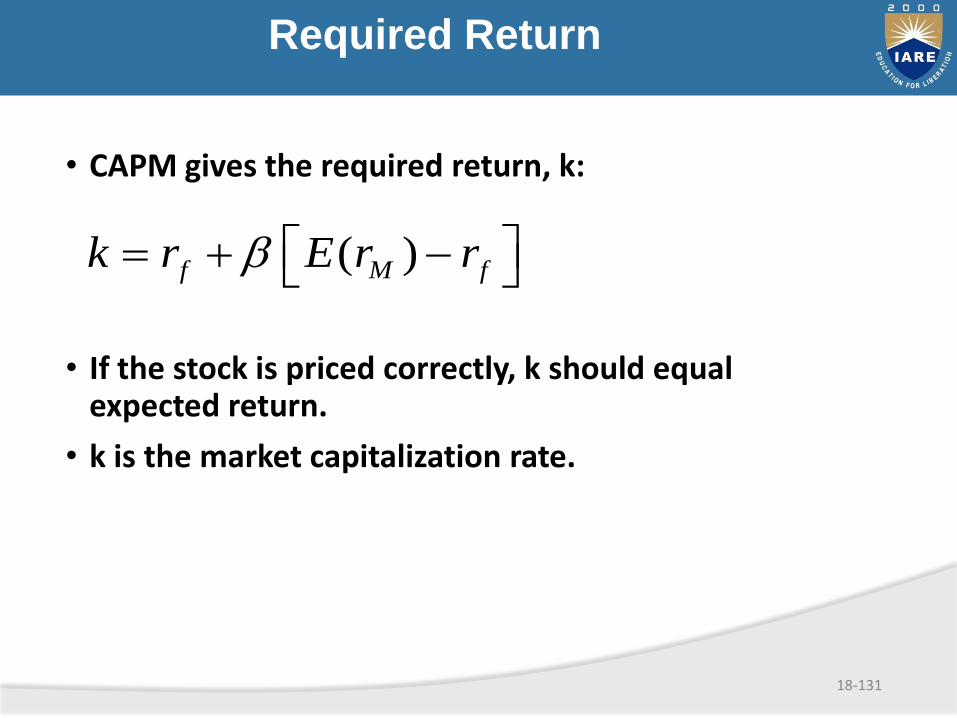
Required Return
• CAPM gives the required return, k:
• If the stock is priced correctly, k should equal expected return.
• k is the market capitalization rate.
( )f M fk r E r rb
18-132
• The intrinsic value (IV) is the “true” value, according to a model.
• The market value (MV) is the consensus value of all market participants
Trading Signal: IV > MV BuyIV < MV Sell or Short SellIV = MV Hold or Fairly Priced
Intrinsic Value and Market Price
18-133
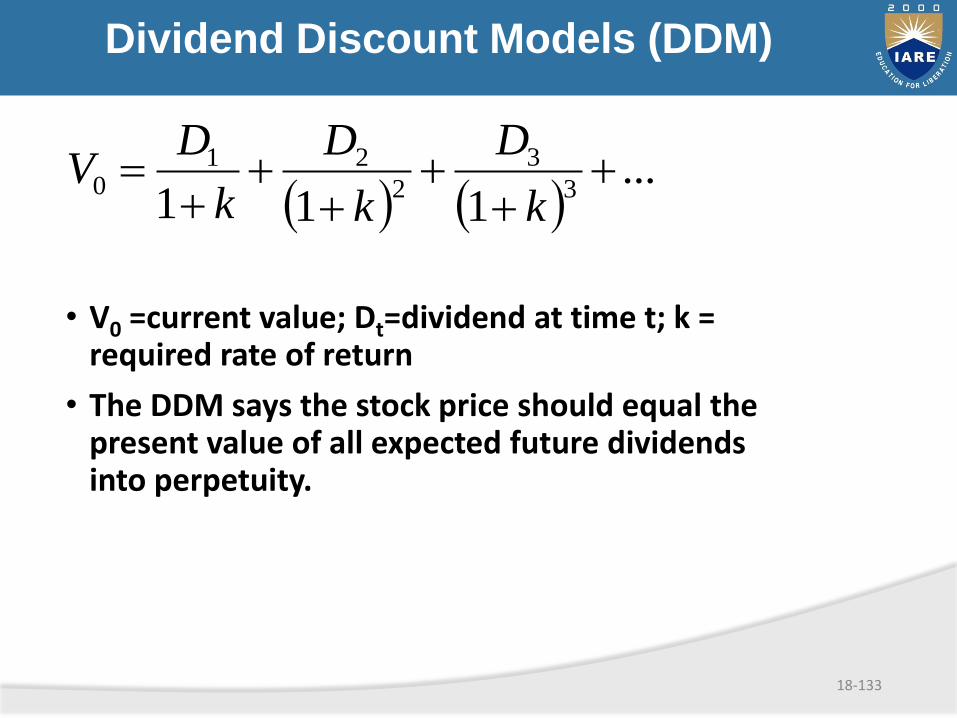
• V0 =current value; Dt=dividend at time t; k = required rate of return
• The DDM says the stock price should equal the present value of all expected future dividends into perpetuity.
Dividend Discount Models (DDM)
...
1113
3
2
210
k
D
k
D
k
DV
18-134
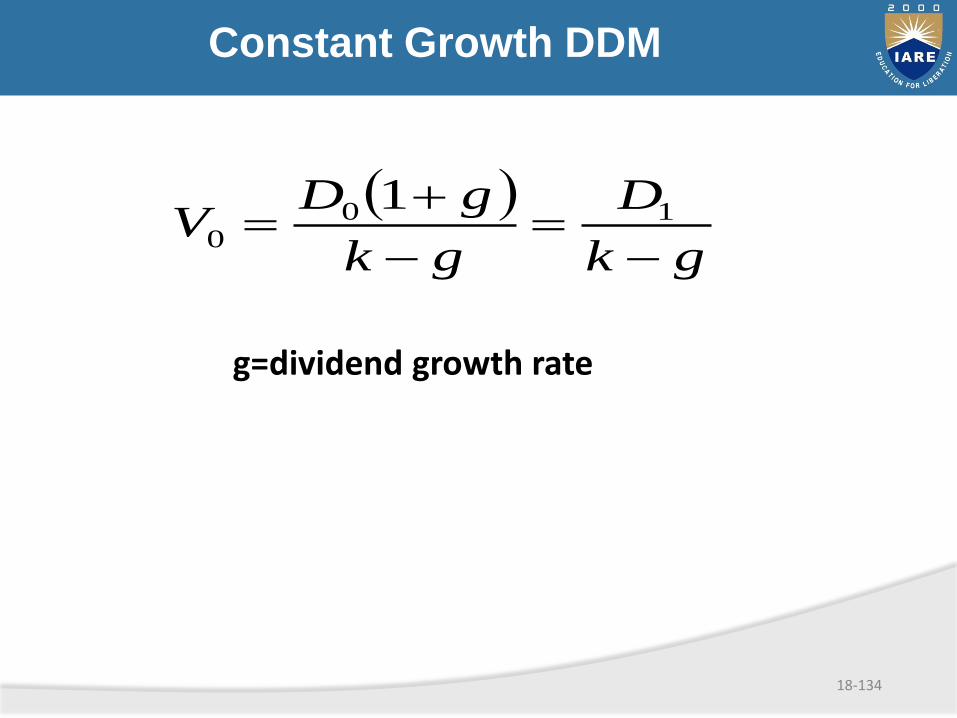
Constant Growth DDM
gk
D
gk
gDV
10
0
1
g=dividend growth rate
18-135
25$008.0
2$
oV
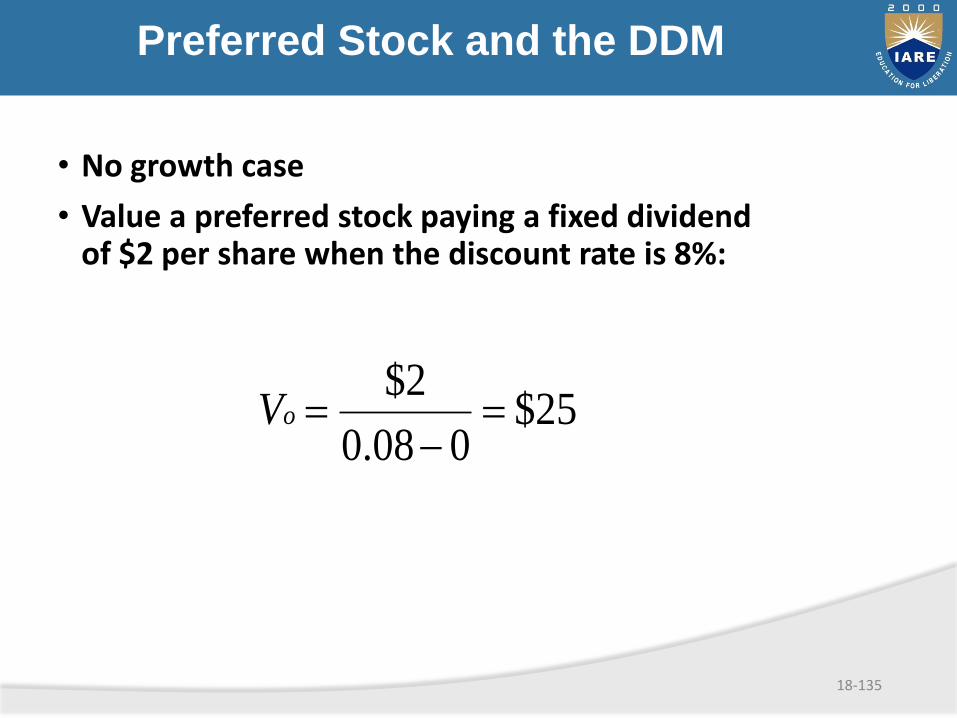
• No growth case
• Value a preferred stock paying a fixed dividend of $2 per share when the discount rate is 8%:
Preferred Stock and the DDM
18-136
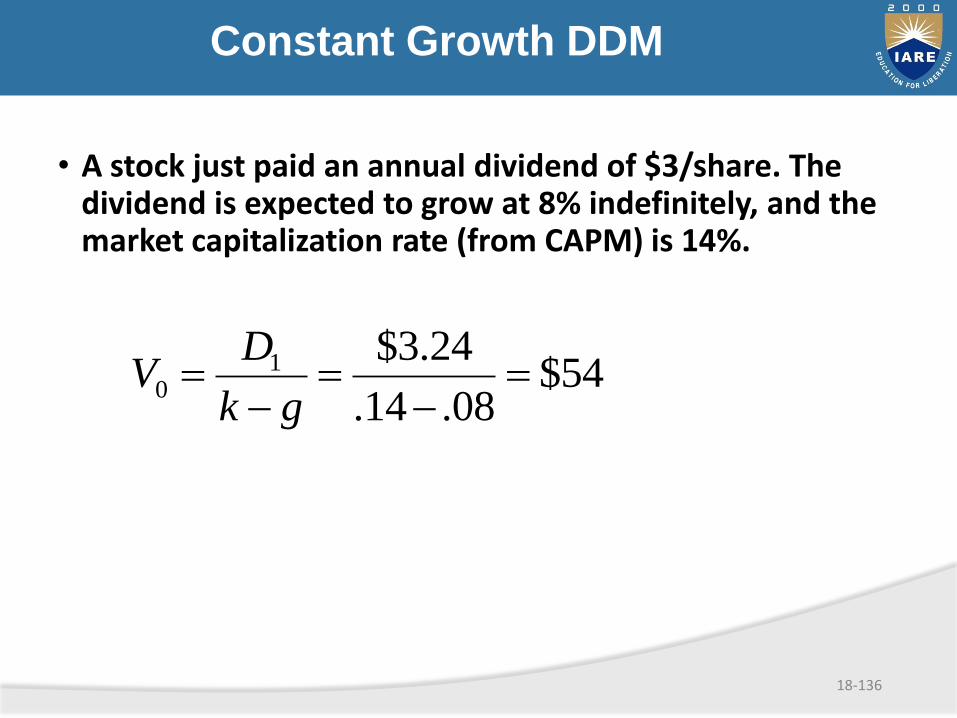
Constant Growth DDM
• A stock just paid an annual dividend of $3/share. The dividend is expected to grow at 8% indefinitely, and the market capitalization rate (from CAPM) is 14%.
54$08.14.
24.3$10
gk
DV
18-137
DDM Implications
• The constant-growth rate DDM implies that a stock’s value will be greater:
1.The larger its expected dividend per share.
2.The lower the market capitalization rate, k.
3.Thehigherthe expected growth rate of dividends.
• The stock price is expected to grow at the same rate as dividends.
18-138
g = growth rate in dividends
ROE = Return on Equity for the firm
b = plowback or retention percentage rate
(1- dividend payout percentage rate)
Estimating Dividend Growth Rates
bROEg x
18-139
Present Value of Growth Opportunities
• The value of the firm equals the value of theassets already in place, the no-growth value ofthe firm,
• Plus the NPV of its future investments,
• Which is called the present value of growthopportunities or PVGO.
18-140
Present Value of Growth Opportunities
• Price = No-growth value per share + PVGO
10
EP PVGO
k
18-141
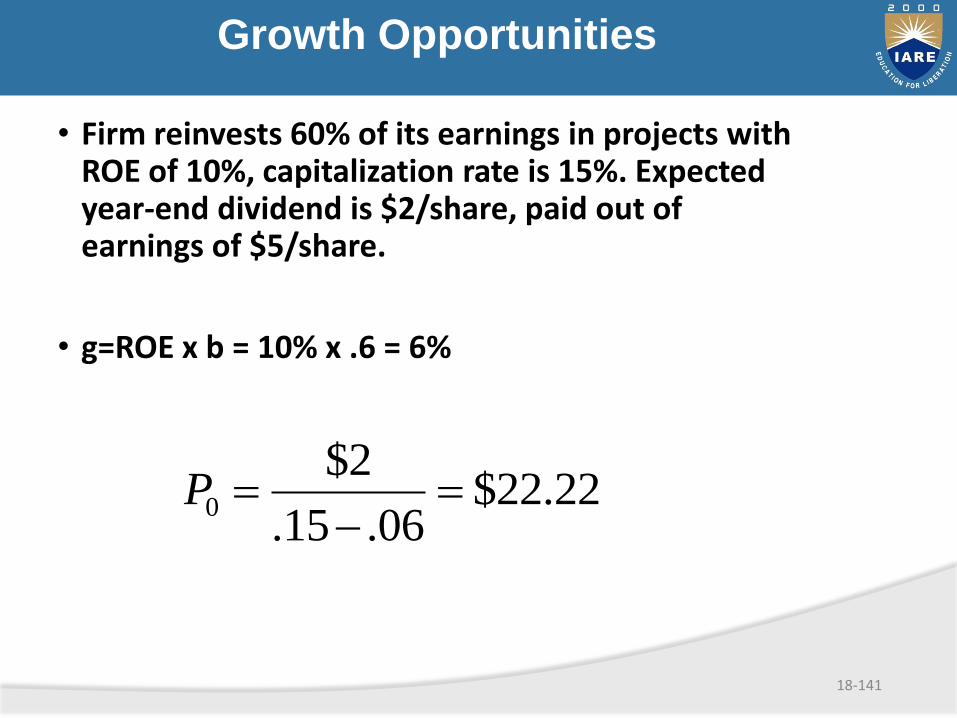
• Firm reinvests 60% of its earnings in projects with ROE of 10%, capitalization rate is 15%. Expected year-end dividend is $2/share, paid out of earnings of $5/share.
• g=ROE x b = 10% x .6 = 6%
Growth Opportunities
22.22$06.15.
2$0
P
18-142
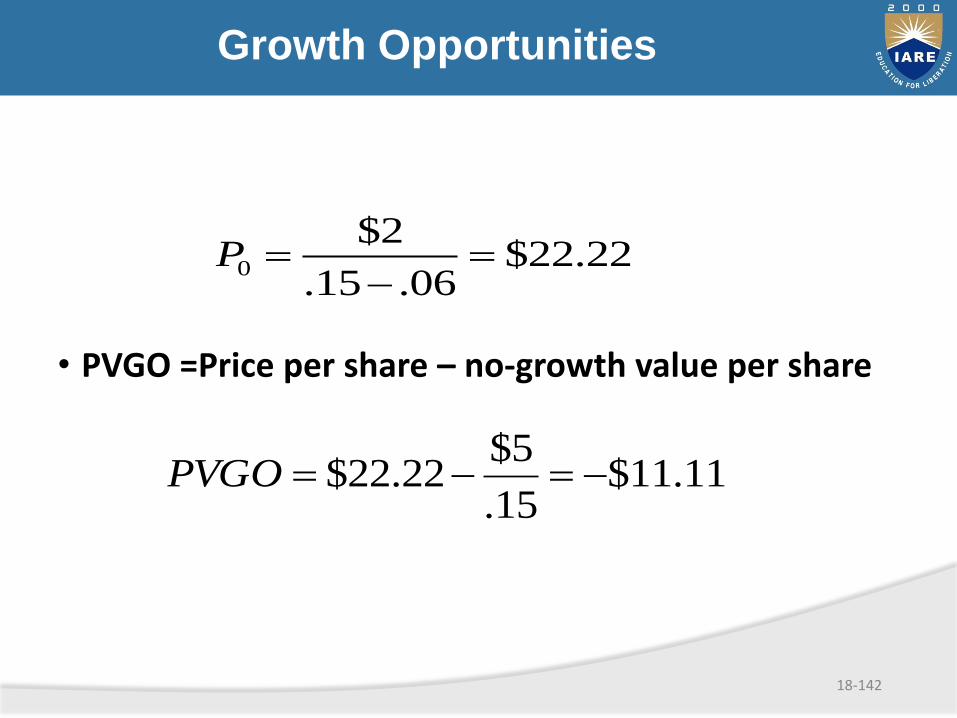
Growth Opportunities
• PVGO =Price per share – no-growth value per share
22.22$06.15.
2$0
P
11.11$15.
5$22.22$ PVGO
18-143
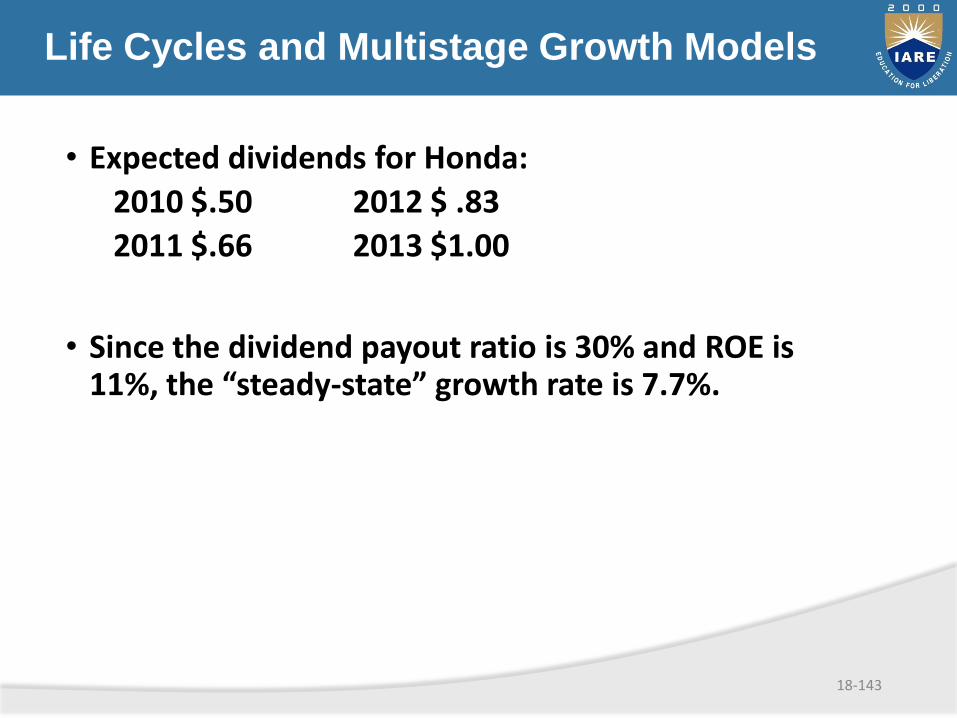
Life Cycles and Multistage Growth Models
• Expected dividends for Honda:
2010 $.50 2012 $ .83
2011 $.66 2013 $1.00
• Since the dividend payout ratio is 30% and ROE is 11%, the “steady-state” growth rate is 7.7%.
18-144
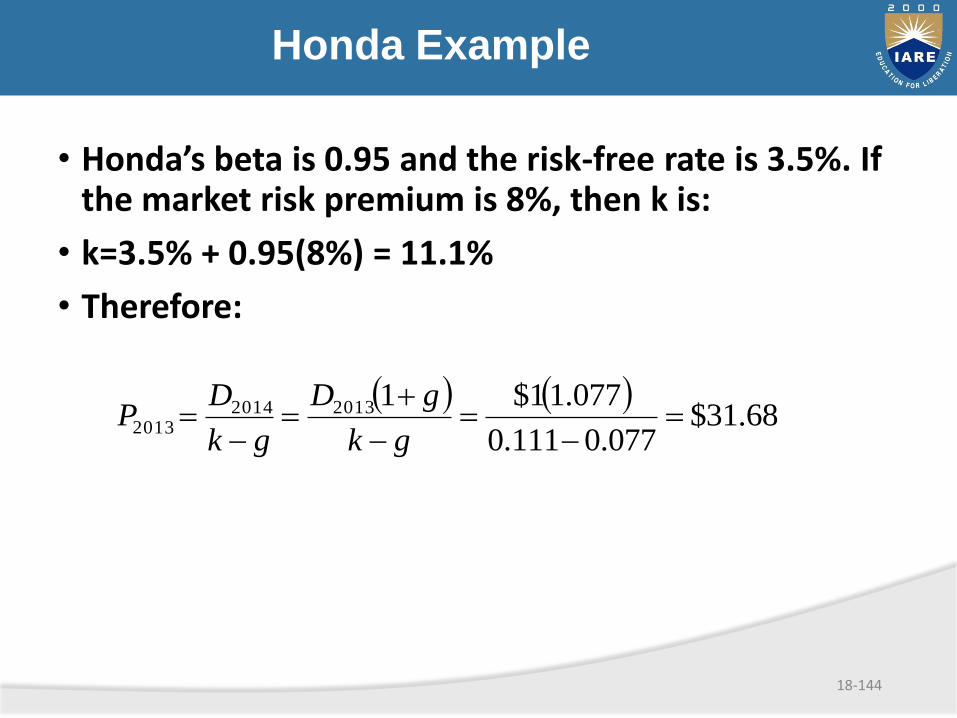
Honda Example
• Honda’s beta is 0.95 and the risk-free rate is 3.5%. If the market risk premium is 8%, then k is:
• k=3.5% + 0.95(8%) = 11.1%
• Therefore:
68.31$
077.0111.0
077.11$1201320142013
gk
gD
gk
DP
18-145
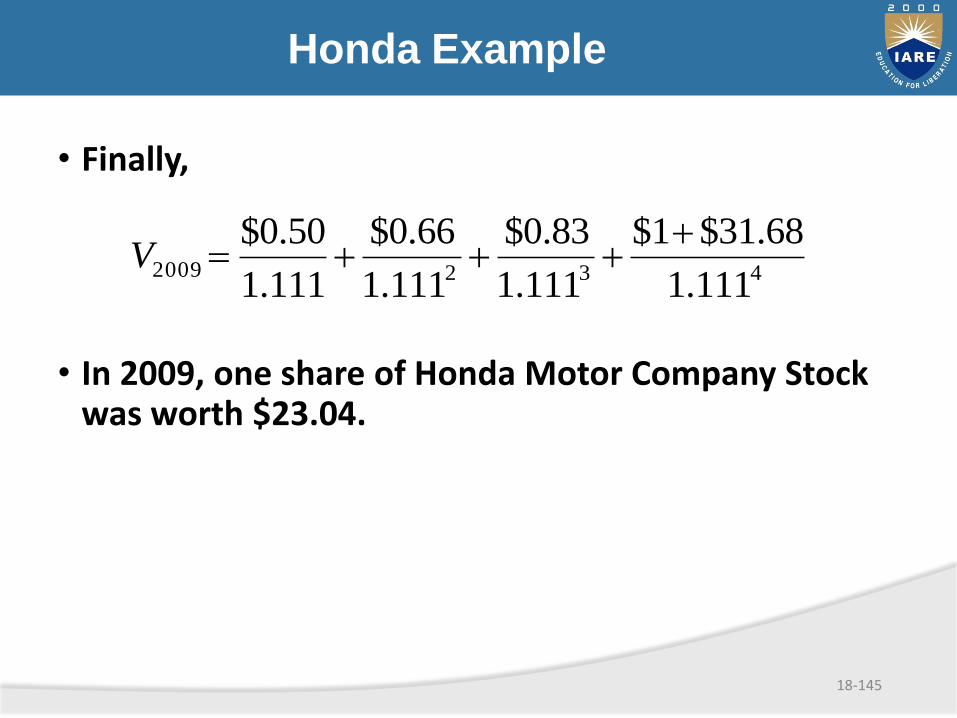
Honda Example
• Finally,
• In 2009, one share of Honda Motor Company Stock was worth $23.04.
4322009111.1
68.31$1$
111.1
83.0$
111.1
66.0$
111.1
50.0$ V
18-146
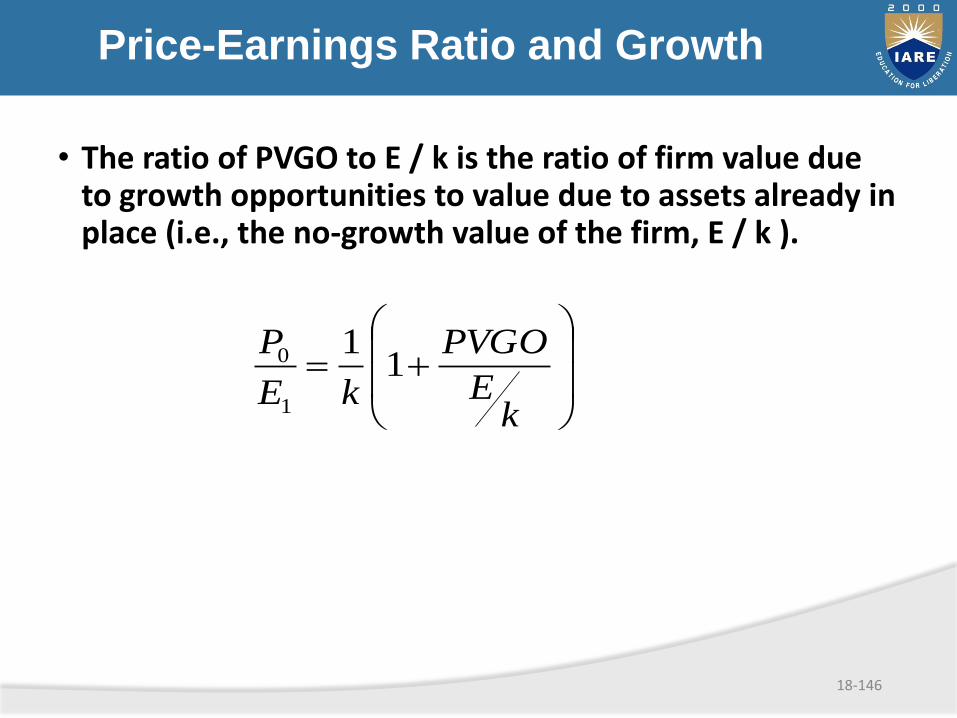
Price-Earnings Ratio and Growth
• The ratio of PVGO to E / k is the ratio of firm value due to growth opportunities to value due to assets already in place (i.e., the no-growth value of the firm, E / k ).
kE
PVGO
kE
P1
1
1
0
18-147
Price-Earnings Ratio and Growth
• When PVGO=0, P0=E1 / k. The stock is valued like a non growing perpetuity.
• P/E rises dramatically with PVGO.
• High P/E indicates that the firm has ample growth opportunities.

18-148
Price-Earnings Ratio and Growth
P/E increases:
• As ROE increases
• As plowback increases, as long as ROE>k
bROEk
b
E
P
x
1
1
0
18-149
P/E and Growth Rate
• Wall Street rule of thumb: The growth rate is roughly equal to the P/E ratio.
• “If the P/E ratio of Coca Cola is 15, you’d expect the company to be growing at about 15% per year, etc. But if the P/E ratio is less than the growth rate, you may have found yourself a bargain.”
Quote from Peter Lynch in One Up on Wall Street.
18-150
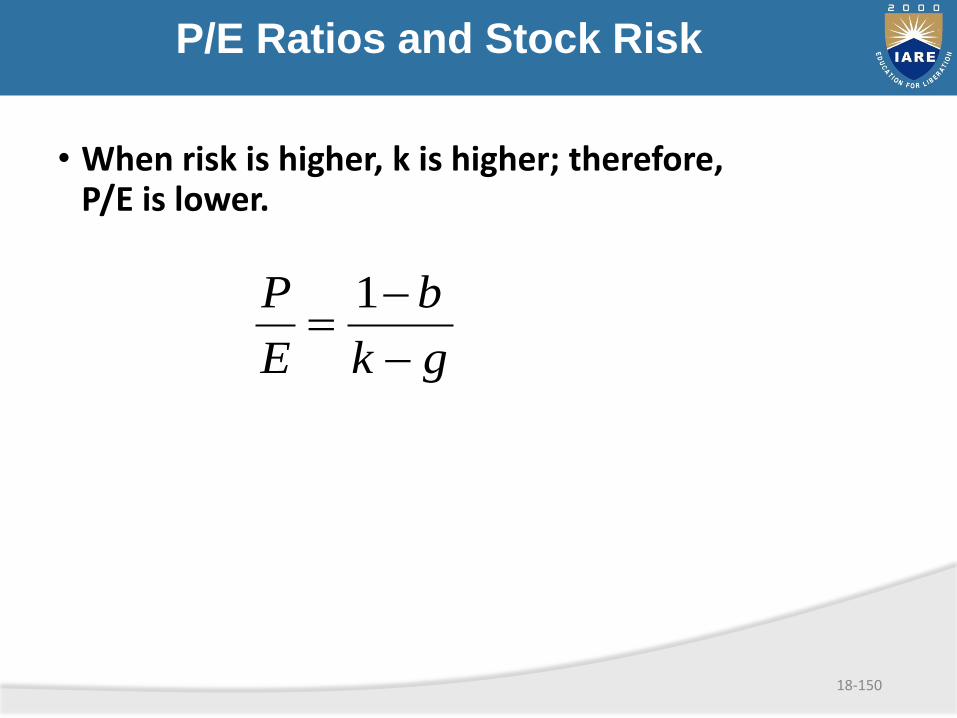
P/E Ratios and Stock Risk
• When risk is higher, k is higher; therefore, P/E is lower.
1P b
E k g

18-151
Pitfalls in P/E Analysis
• Use of accounting earnings
I. Earnings Management
II. Choices on GAAP
• Inflation
• Reported earnings fluctuate around the business cycle
18-152
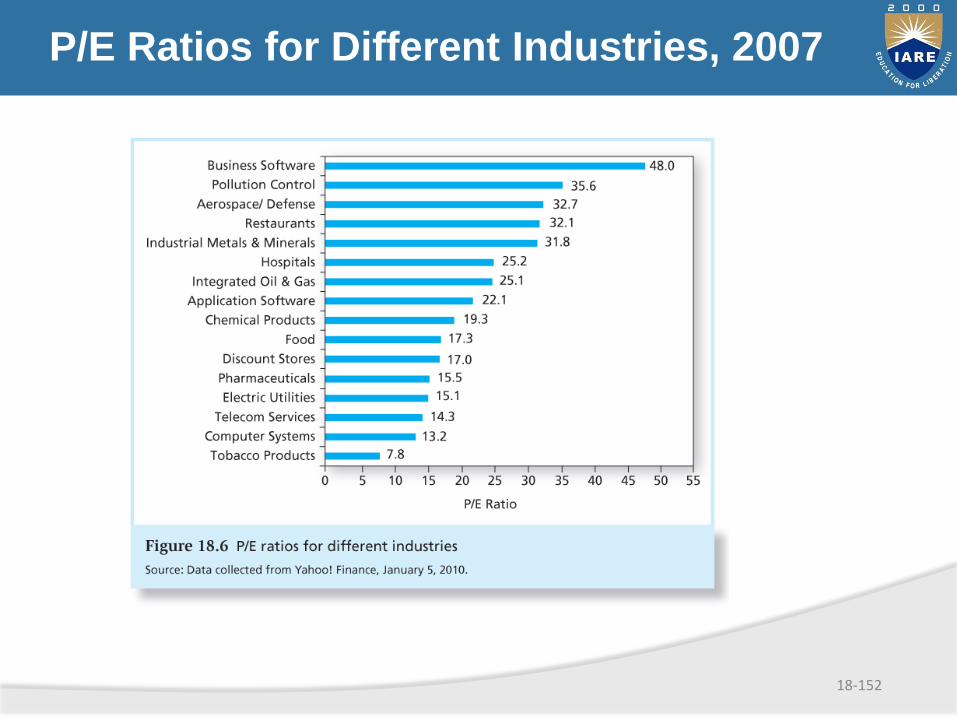
P/E Ratios for Different Industries, 2007
18-153
Other Comparative Value Approaches
• Price-to-book ratio
• Price-to-cash-flow ratio
• Price-to-sales ratio
Capitalization of income method
A complication
• the previous model assumes dividends can be forecast indefinitely
• a forecasting formula can be written
Dt = Dt -1 ( 1 + g t )
where g t = the dividend growth rate
154
The zero growth model
Assumptions
• the future dividends remain constant such thatD1 = D2 = D3 = D4 = . . . = DN
155
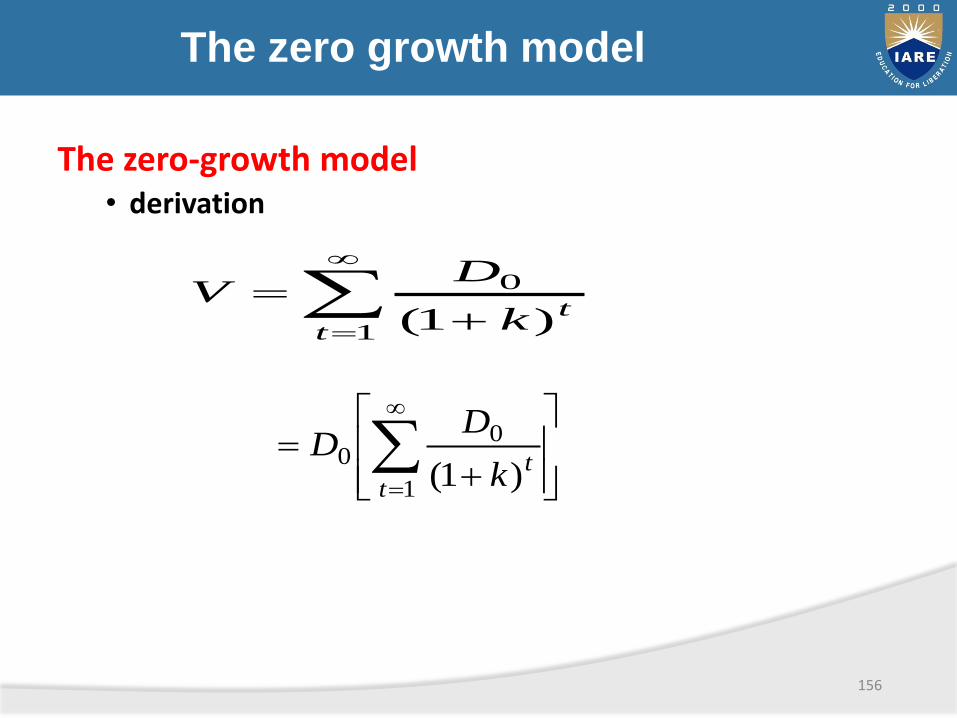
The zero growth model
The zero-growth model• derivation
156
1
0
)1(ttk
DV
1
00
)1(ttk
DD
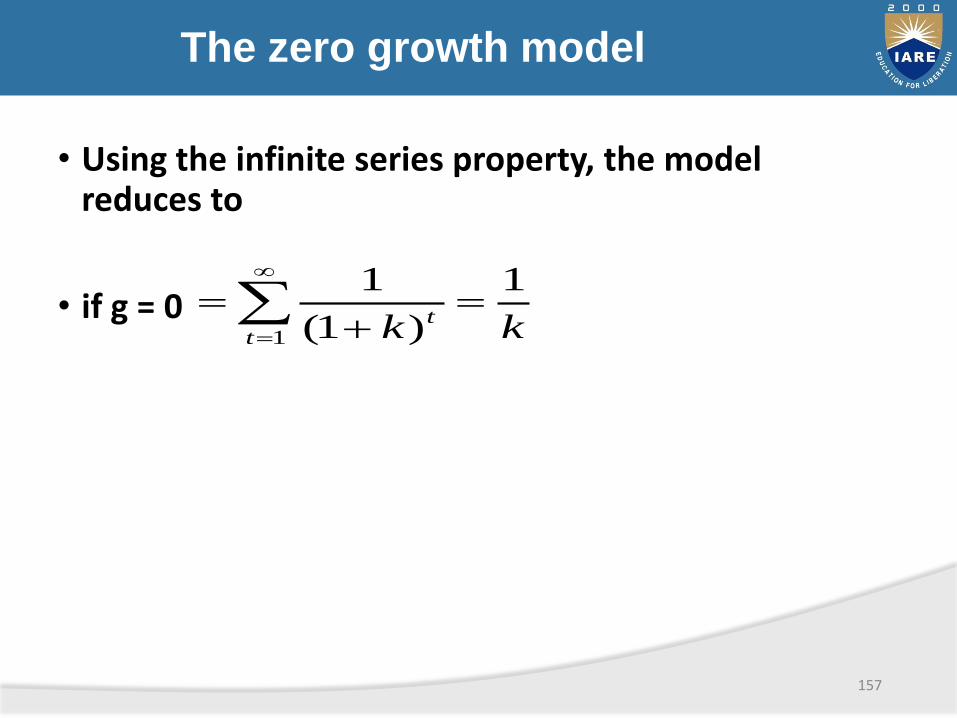
The zero growth model
• Using the infinite series property, the model reduces to
• if g = 0
157
kktt
1
)1(
1
1
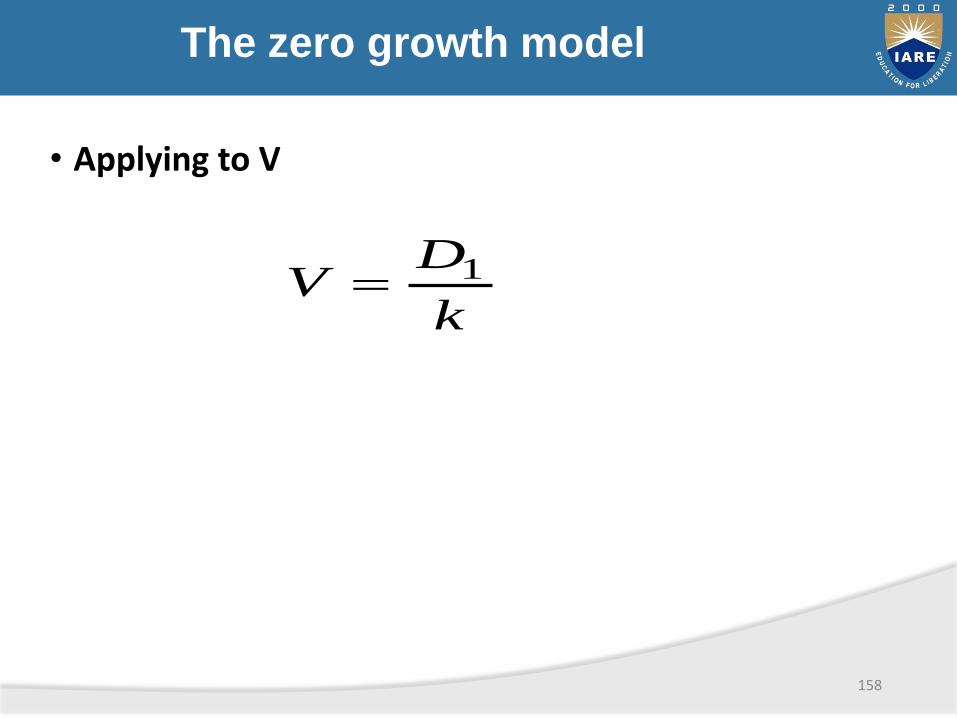
The zero growth model
• Applying to V
158
k
DV 1
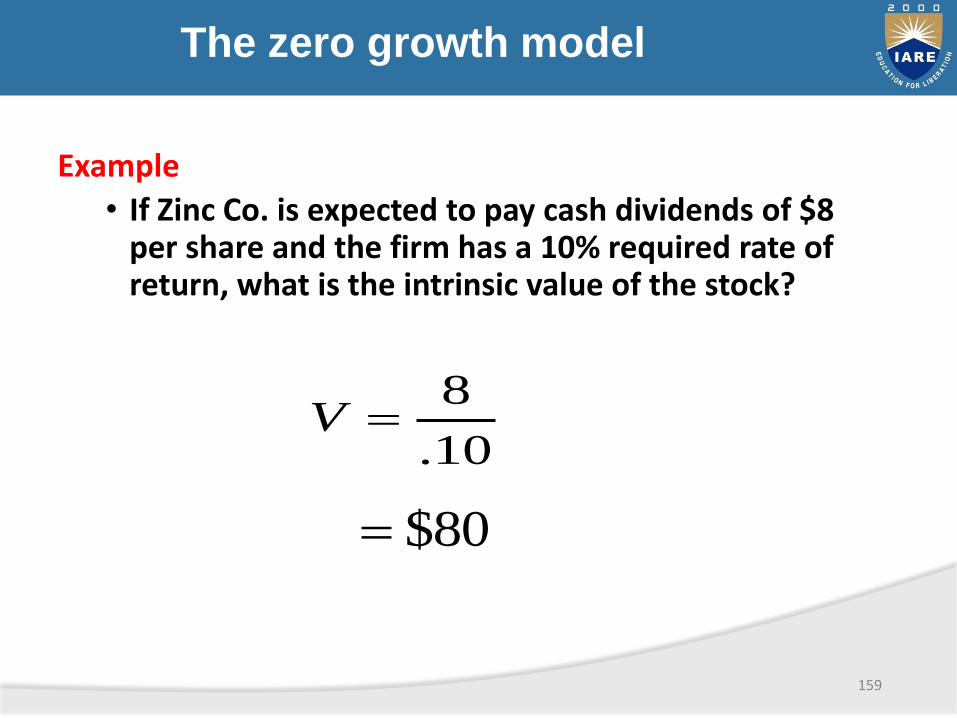
The zero growth model
Example
• If Zinc Co. is expected to pay cash dividends of $8 per share and the firm has a 10% required rate of return, what is the intrinsic value of the stock?
159
10.
8V
80$

THE ZERO GROWTH MODEL
Example(continued)
If the current market price is $65, the stock is underpriced.
Recommendation: BUY
160
CONSTANT GROWTH MODEL
Assumptions:
• Dividends are expected to grow at a fixed rate, g such that
D0 (1 + g) = D1
and
D1 (1 + g) = D2
or D2 = D0 (1 + g)2
161
CONSTANT GROWTH MODEL
• In General
Dt = D0 (1 + g)t
162
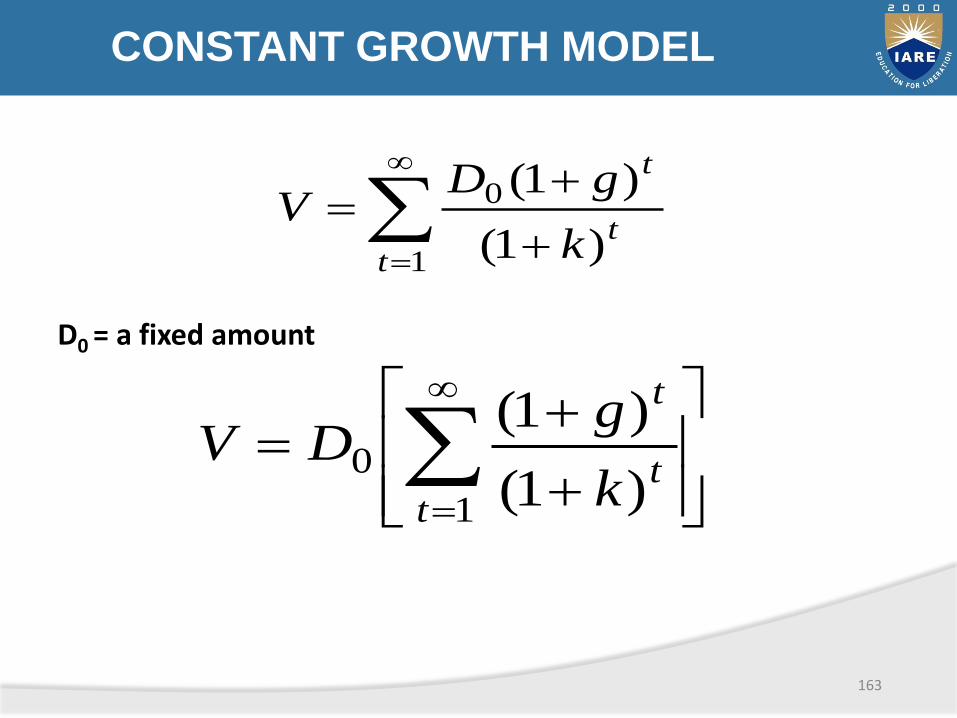
CONSTANT GROWTH MODEL
D0 = a fixed amount
163
1
0
)1(
)1(
tt
t
k
gDV
1
0)1(
)1(
tt
t
k
gDV
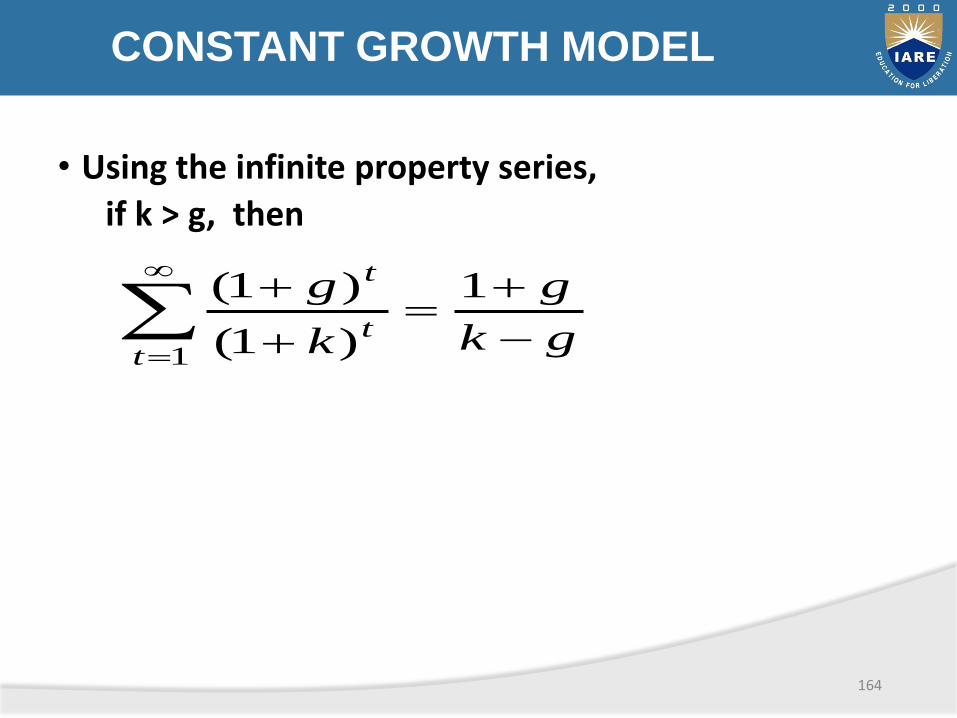
CONSTANT GROWTH MODEL
• Using the infinite property series,
if k > g, then
164
gk
g
k
g
tt
t
1
)1(
)1(
1
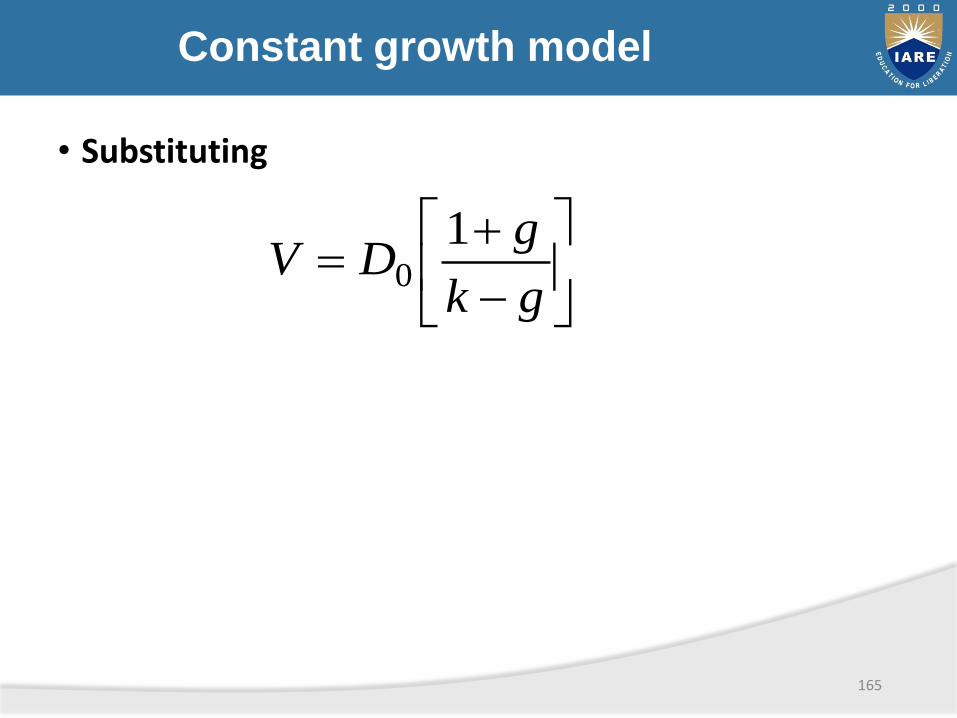
Constant growth model
• Substituting
165
gk
gDV
10
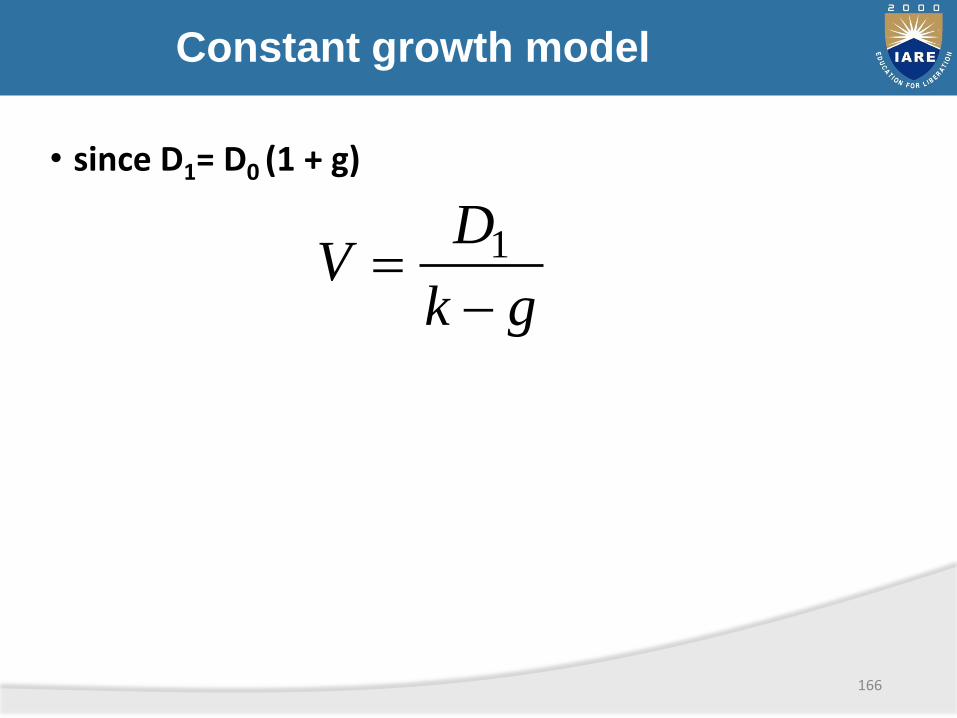
Constant growth model
• since D1= D0 (1 + g)
166
gk
DV
1

The multiple-growth model
ASSUMPTION:
• future dividend growth is not constant
Model Methodology
• to find present value of forecast stream of dividends
• divide stream into parts
• each representing a different value for g
167
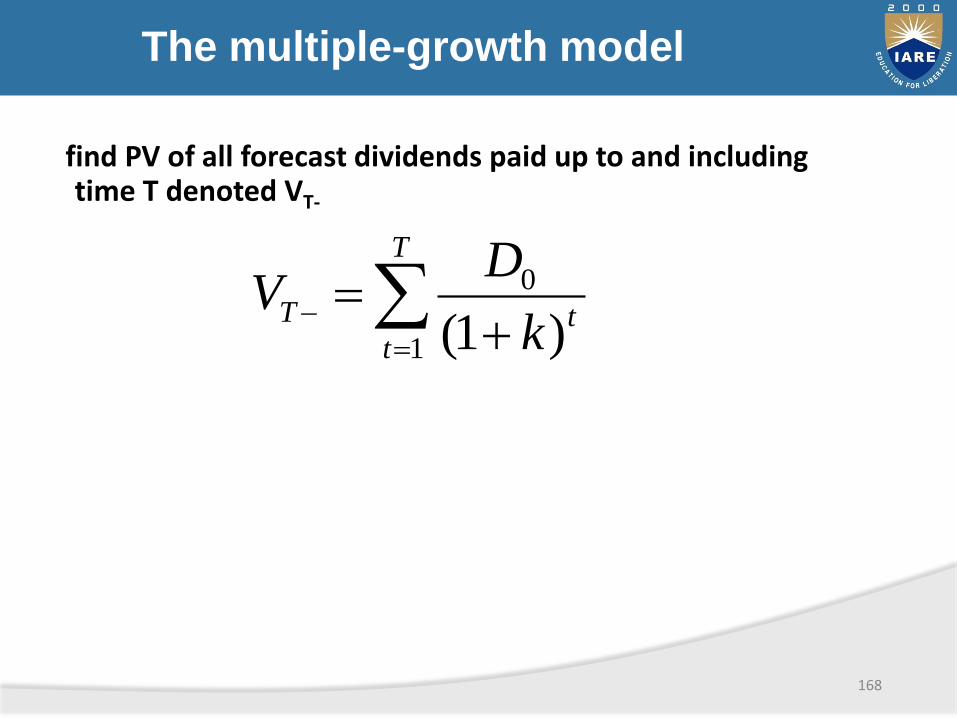
The multiple-growth model
find PV of all forecast dividends paid up to and including time T denoted VT-
168
T
ttT
k
DV
1
0
)1(
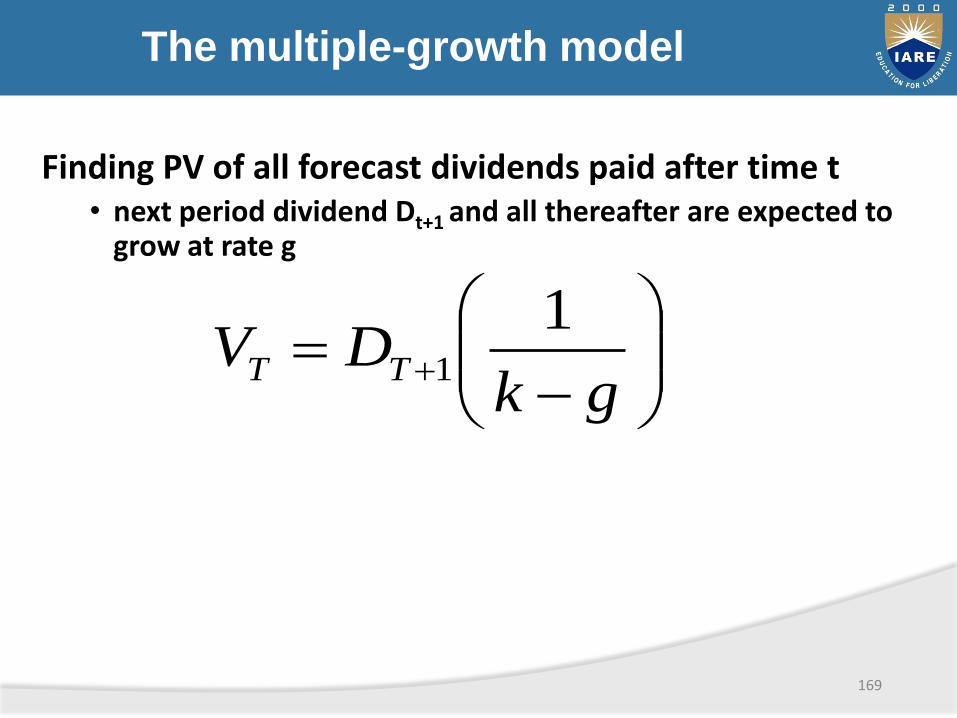
The multiple-growth model
Finding PV of all forecast dividends paid after time t• next period dividend Dt+1 and all thereafter are expected to
grow at rate g
169
gkDV TT
11
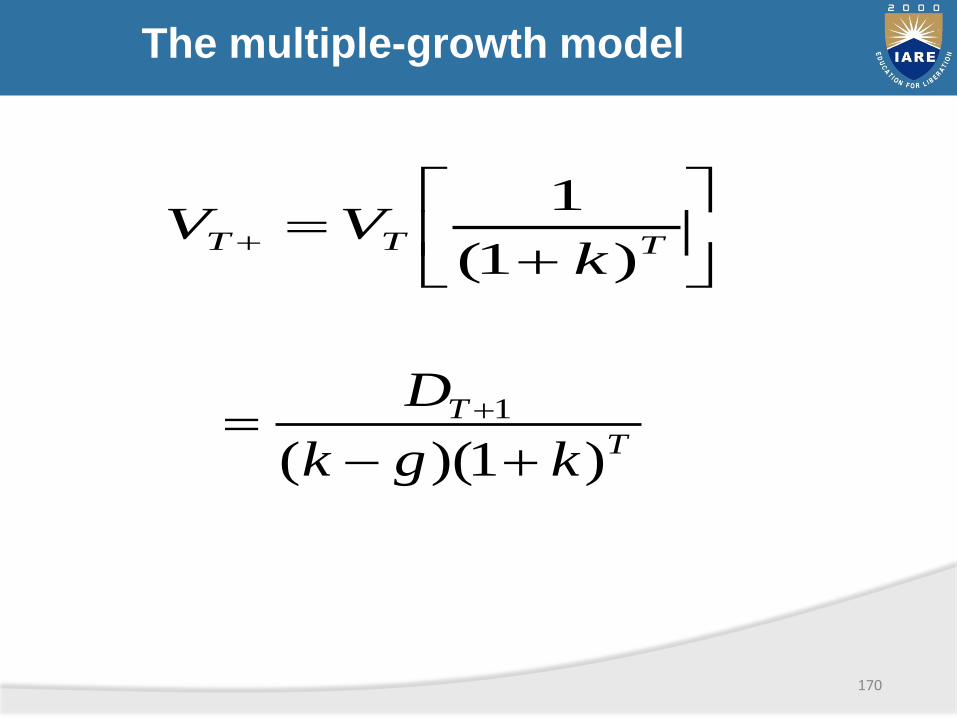
The multiple-growth model
170
TTT
kVV
)1(
1
T
T
kgk
D
)1)((
1
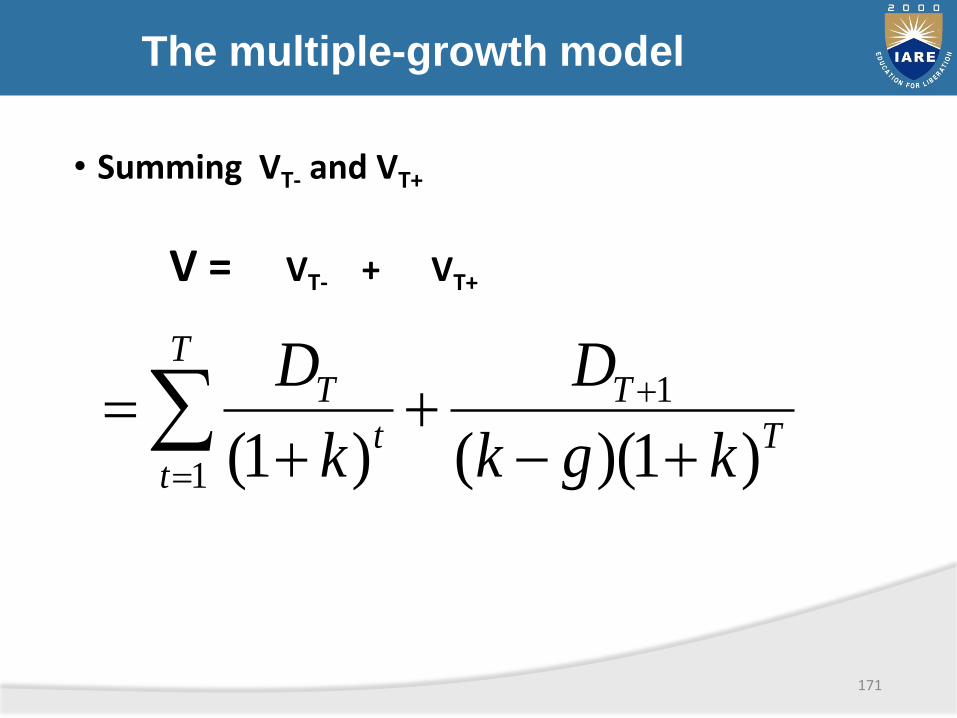
The multiple-growth model
• Summing VT- and VT+
V = VT- + VT+
171
T
TT
tt
T
kgk
D
k
D
)1)(()1(
1
1
Models based on p/e ratio
Price-earnings ratio model
• Many investors prefer the earnings multiplier approach since they feel they are ultimately entitled to receive a firm’s earnings
172
Models based on p/e ratio
PRICE-EARNINGS RATIO MODEL
• EARNINGS MULTIPLIER:
= PRICE - EARNINGS RATIO
= Current Market Pricefollowing 12 month earnings
173
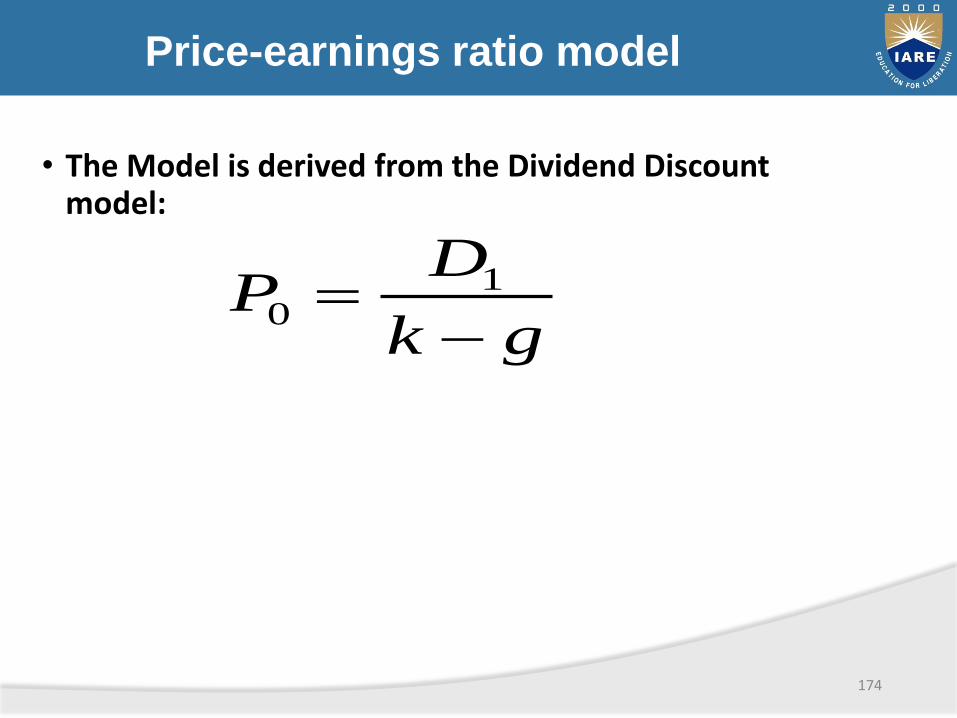
Price-earnings ratio model
• The Model is derived from the Dividend Discount model:
174
gk
DP
1
0
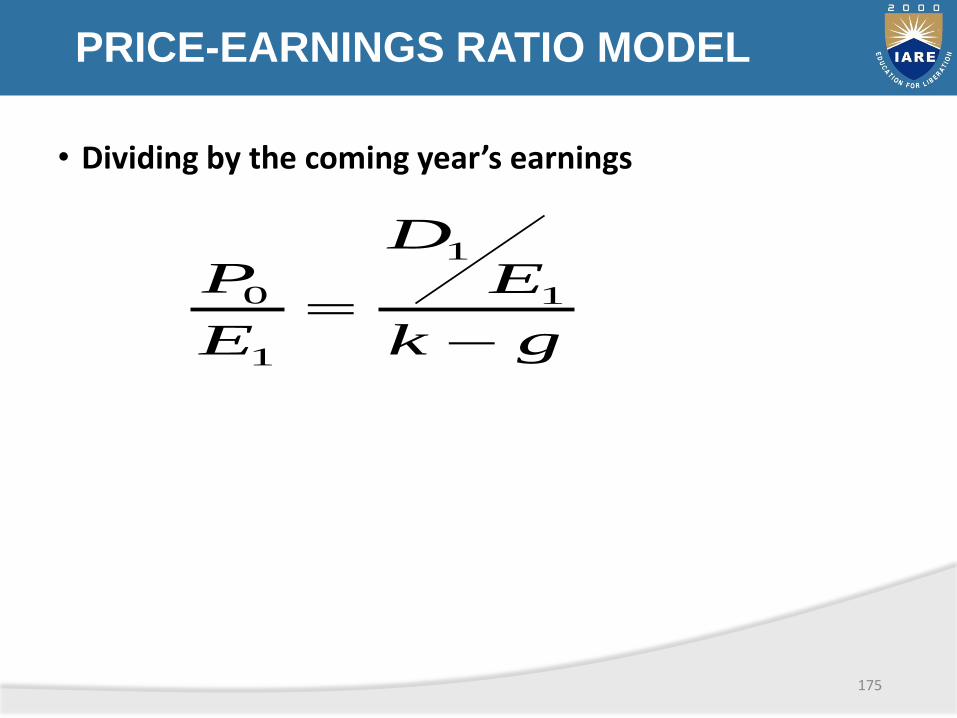
PRICE-EARNINGS RATIO MODEL
• Dividing by the coming year’s earnings
175
gk
ED
E
P
1
1
1
0
Price-earnings ratio model
The P/E Ratio is a function of
• the expected payout ratio ( D1 / E1 )
• the required return (k)
• the expected growth rate of dividends (g)
176
Capitalization of income method
The intrinsic value of a stock
• represented by present value of the income stream
177
Capitalization of income method
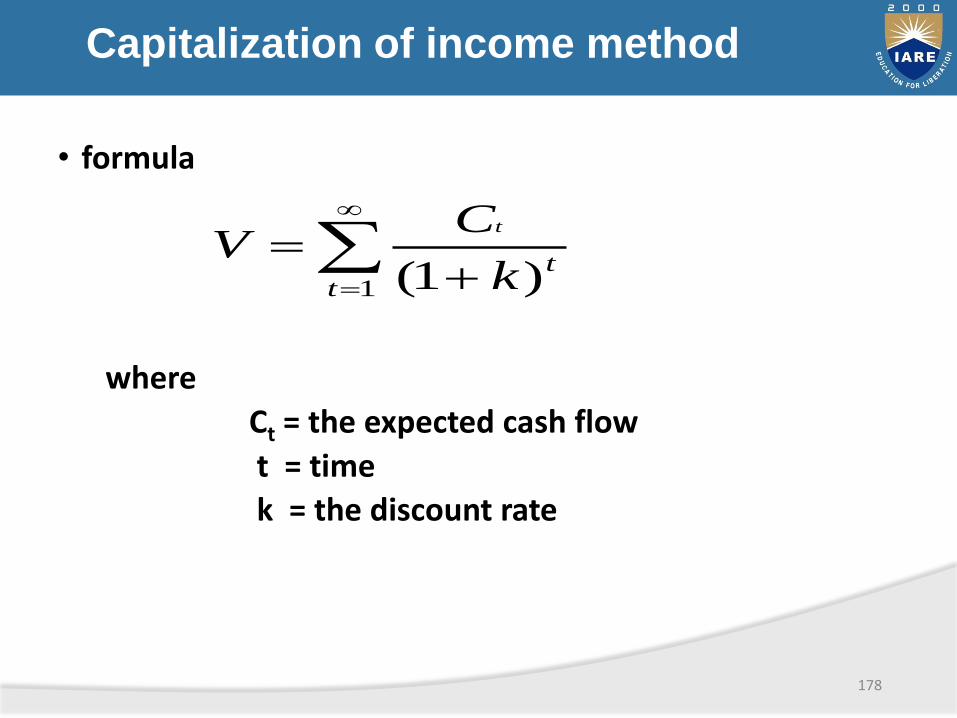
• formula
where
Ct = the expected cash flow
t = time
k = the discount rate
178
1 )1(ttk
CV
t

Capitalization of income method
Net present value
• Under or Overpriced?
1. If NPV > 0
2. If NPV < 0
179
underpriced
overpriced
Capitalization of income method
Internal rate of return (irr)
• set NPV = 0, solve for IRR, or
• the IRR is the discount rate that makes the NPV = 0
180
Capitalization of income method
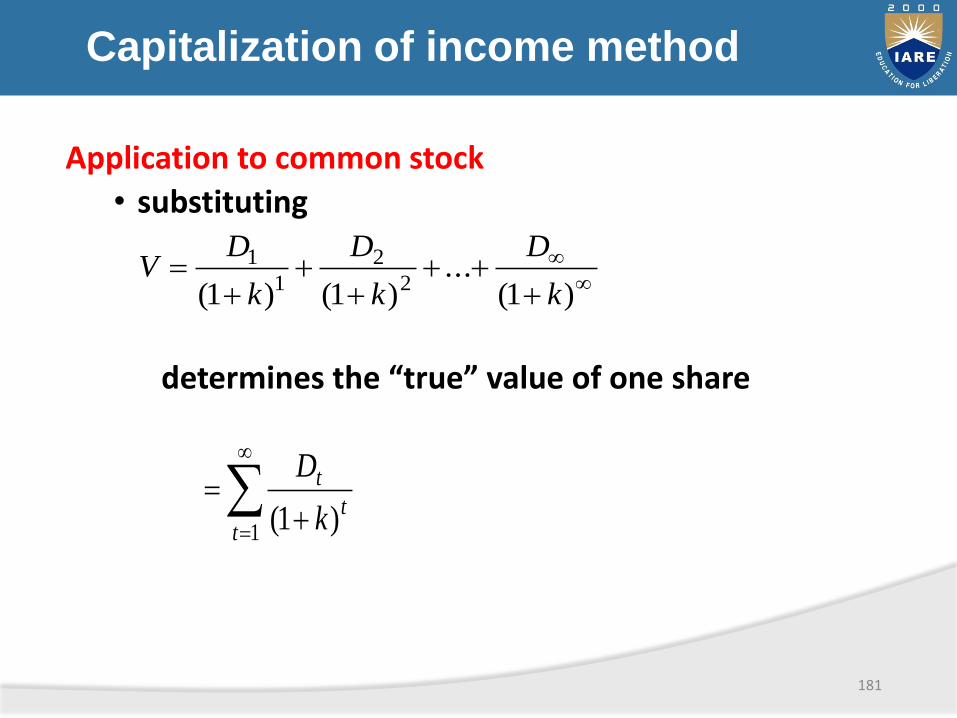
Application to common stock
• substituting
determines the “true” value of one share
181
)1(...
)1()1( 2
2
1
1
k
D
k
D
k
DV
1 )1(tt
t
k
D
Capitalization of income method
A Complication
• the previous model assumes dividends can be forecast indefinitely
• a forecasting formula can be written
Dt = Dt -1 ( 1 + g t )
where g t = the dividend growth rate
182
Sources of earnings growth
What causes growth?
• assume no new capital added
• retained earnings used to pay firm’s new investment
• If pt = the payout ratio in year t
• 1-pt = the retention ratio
183
Sources of earnings growth
• New Investments:
184
ttt EpI )1(
Sources of earnings growth
What about the return on equity?
Let rt = return on equity in time t
rt I t is added to earnings per share in year t+1
and thereafter
185
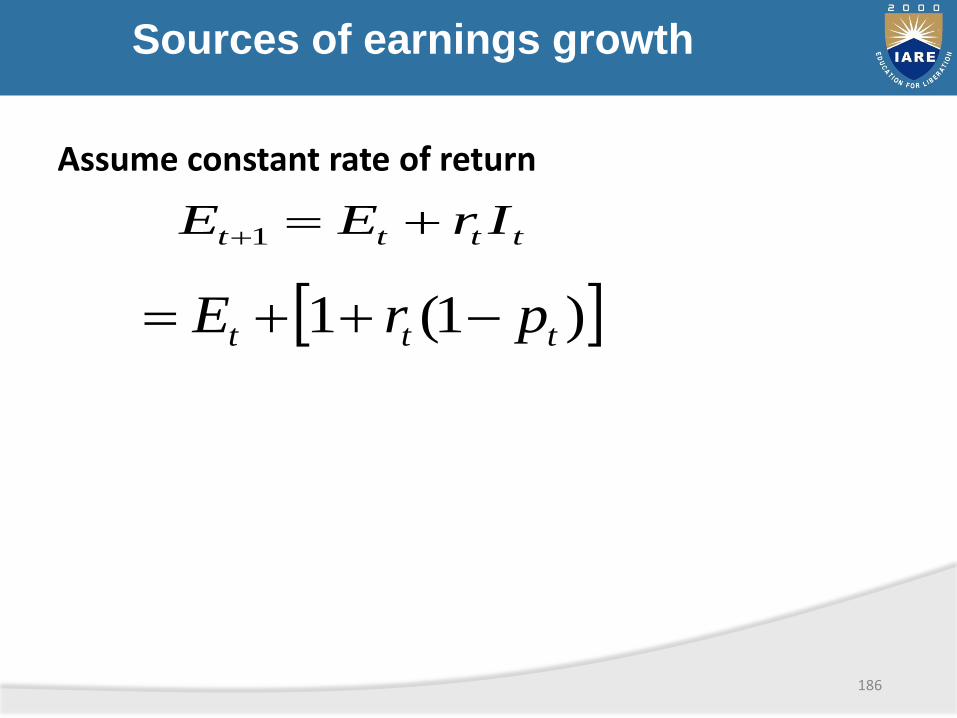
Sources of earnings growth
Assume constant rate of return
186
tttt IrEE 1
)1(1 ttt prE
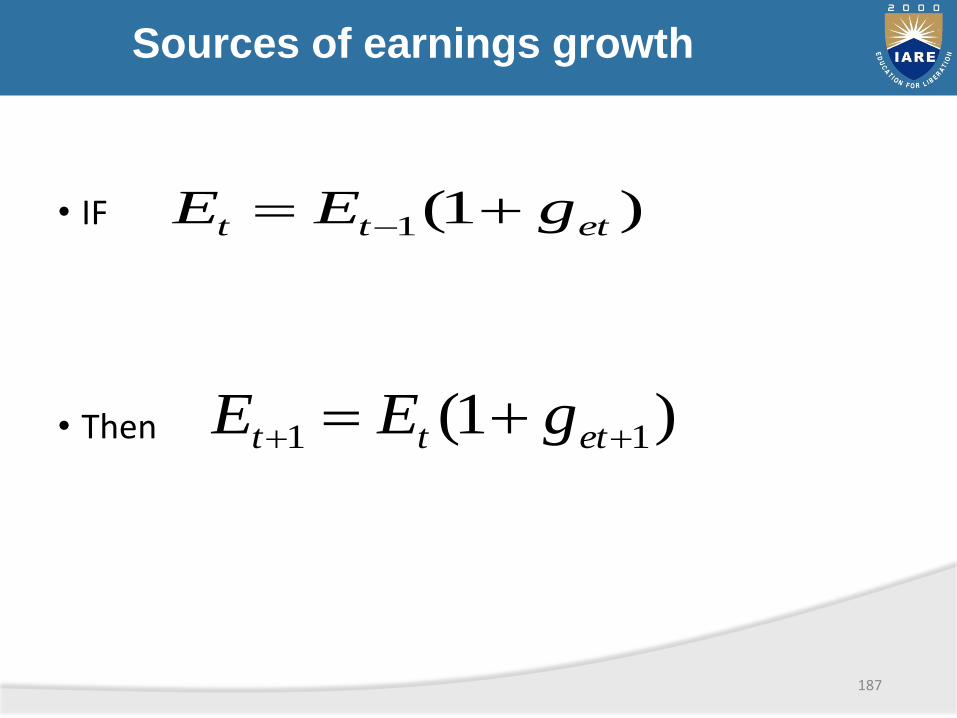
Sources of earnings growth
• IF
• Then
187
)1(1 ettt gEE
)1( 11 ettt gEE
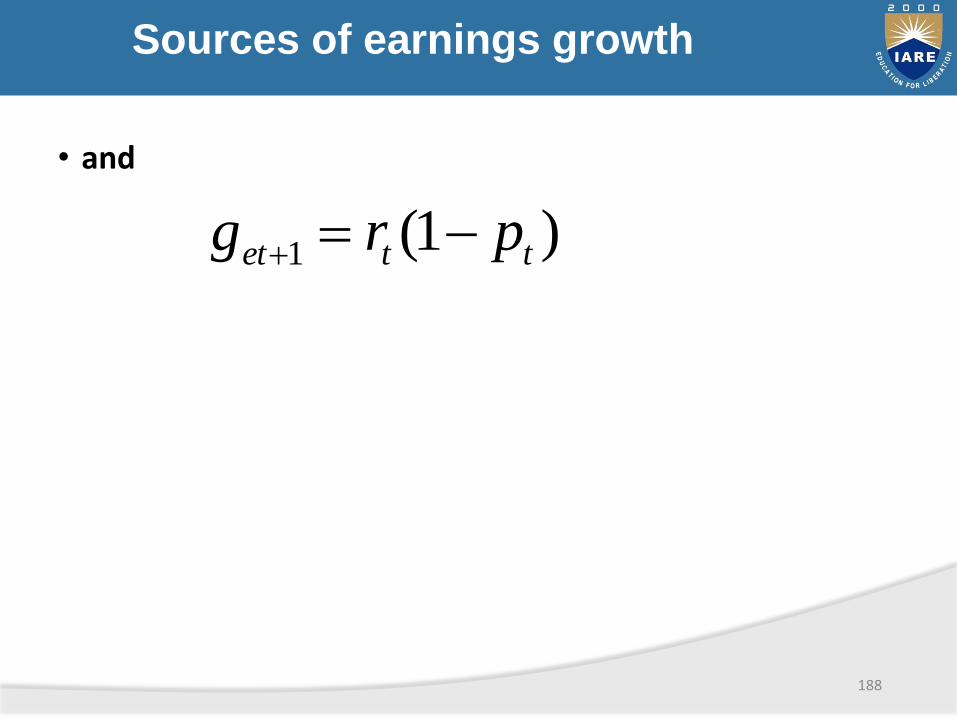
Sources of earnings growth
• and
188
)1(1 ttet prg
sources of earnings growth
• If the growth rate in earnings per share get+1
is constant, then rt and pt are constant
189
Sources of earnings growth
Growth rate depends on
• the retention ratio
• average return on equity
190
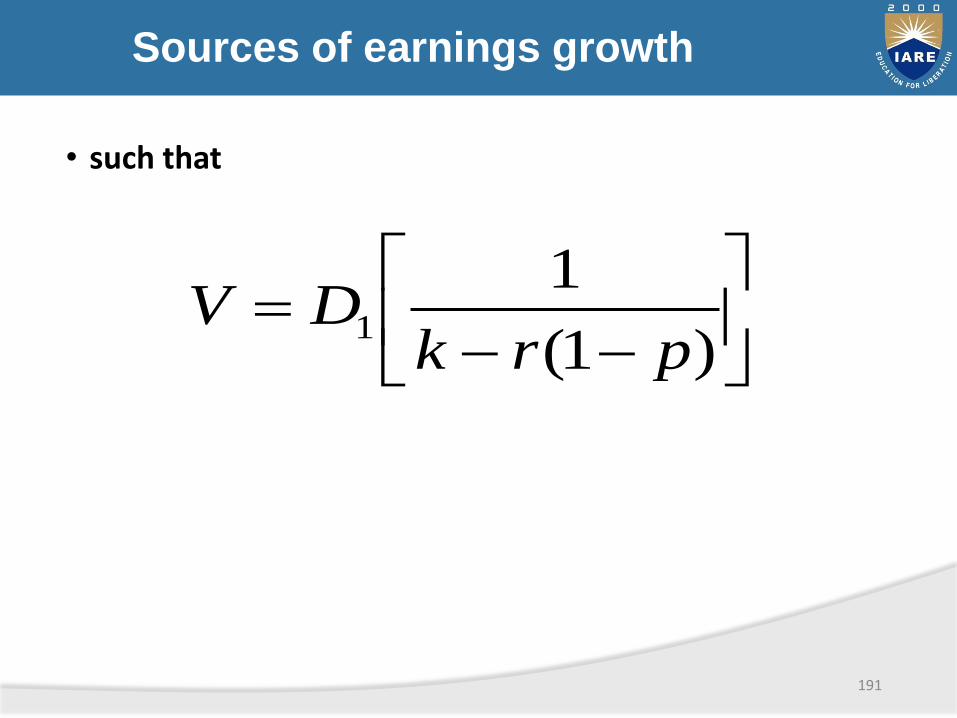
Sources of earnings growth
• such that
191
)1(
11
prkDV

Value concepts
• Traditional financial measures have limitations due to accounting distortions
• A variety of measures capture the economic performance of the firm
• Economic Value Added (EVATM) measures increases in economicvalue and, hence , shareholder value
• Economic Value Added ( EVATM) is a long term measure of valuecreation

Increasing firm value
A firm must earn returns in excess of its cost of capital
» Produce more earnings on existing capital structure (operating)
» Increase capital investment (investing)
» Produce same earnings on less capital ( operating)
» Reduce the cost of capital ( financing)
Economic value added
•Measures real profitably- on a cash basis
•Measures the cost of equity- not shown onbalance sheets
•Cost of equity is its opportunity cost- what theinvestors could do in their next best alternative
•Capital includes long term debt, preferred stock,and common stock
•Cost of capital is its weighted average
FINANCIAL DERIVATIVES
What are Derivatives?
• A derivative is a financial instrument whose value is derived from the value of another asset, which is known as the underlying.
• When the price of the underlying changes, the value of the derivative also changes.
• A Derivative is not a product. It is a contract that derives its value from changes in the price of the underlying.
Example :
The value of a gold futures contract is derived from the
value of the underlying asset i.e. Gold.
There are 3 types of traders in the Derivatives Market :
• HEDGER
A hedger is someone who faces risk associated with price movement of an asset and who uses derivatives as means of reducing risk.
They provide economic balance to the market.
• SPECULATOR
A trader who enters the futures market for pursuit of profits, accepting risk in the endeavor.
They provide liquidity and depth to the market.
Traders in Derivatives Market
• ARBITRAGEUR
A person who simultaneously enters into transactions in two or more markets to take advantage of the discrepancies between prices in these markets.
• Arbitrage involves making profits from relative mispricing.
• Arbitrageurs also help to make markets liquid, ensure accurate and uniform pricing, and enhance price stability
• They help in bringing about price uniformity and discovery.
• Reduces risk
• Enhance liquidity of the underlying asset
• Lower transaction costs
• Enhances liquidity of the underlying asset
• Enhances the price discovery process.
• Portfolio Management
• Provides signals of market movements
• Facilitates financial markets integration
Economic benefits of derivatives

What is a Forward?
• A forward is a contract in which one party commits to buy and the other party commits to sell a specified quantity of an agreed upon asset for a pre-determined price at a specific date in the future.
• It is a customised contract, in the sense that the terms of the contract are agreed upon by the individual parties.
• Hence, it is traded OTC.
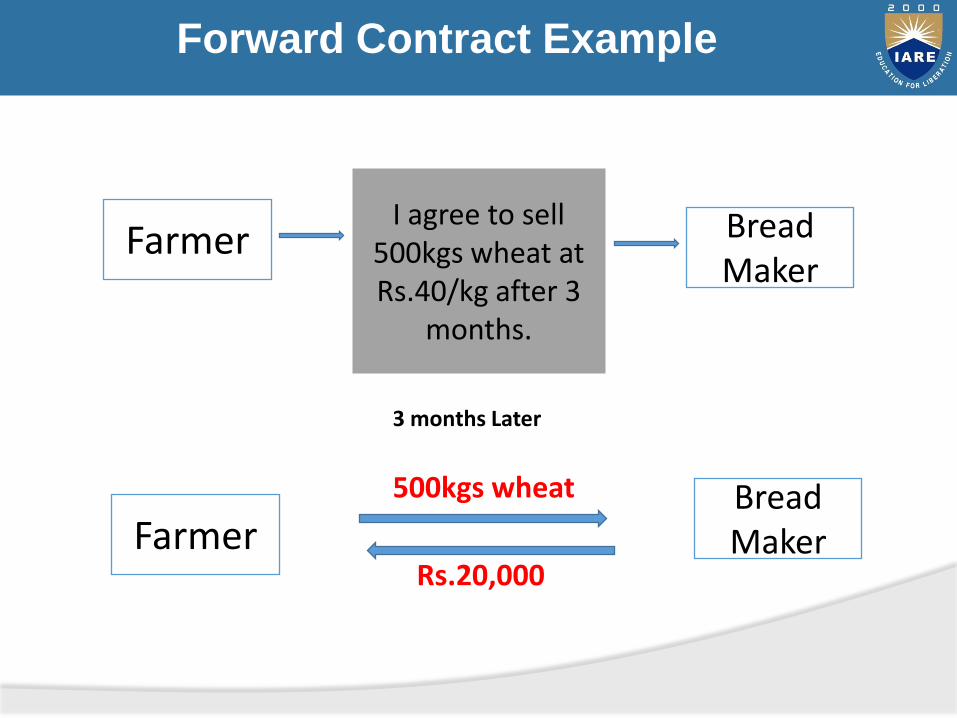
Forward Contract Example
I agree to sell 500kgs wheat at Rs.40/kg after 3
months.
Farmer Bread Maker
3 months Later
FarmerBread Maker
500kgs wheat
Rs.20,000
Risks in Forward Contracts
• Credit Risk – Does the other party have the means to pay?
• Operational Risk – Will the other party make delivery? Will the other party accept delivery?
• Liquidity Risk – Incase either party wants to opt out of the contract, how to find another counter party?
Terminology
• Long position - Buyer
• Short position - seller
• Spot price – Price of the asset in the spot market.(market price)
• Delivery/forward price – Price of the asset at the delivery date.
What are Futures?
• A future is a standardized forward contract.
• It is traded on an organised exchange.
• Standardizations-
- quantity of underlying
- quality of underlying(not required in financial futures)
- delivery dates and procedure
- price quotes
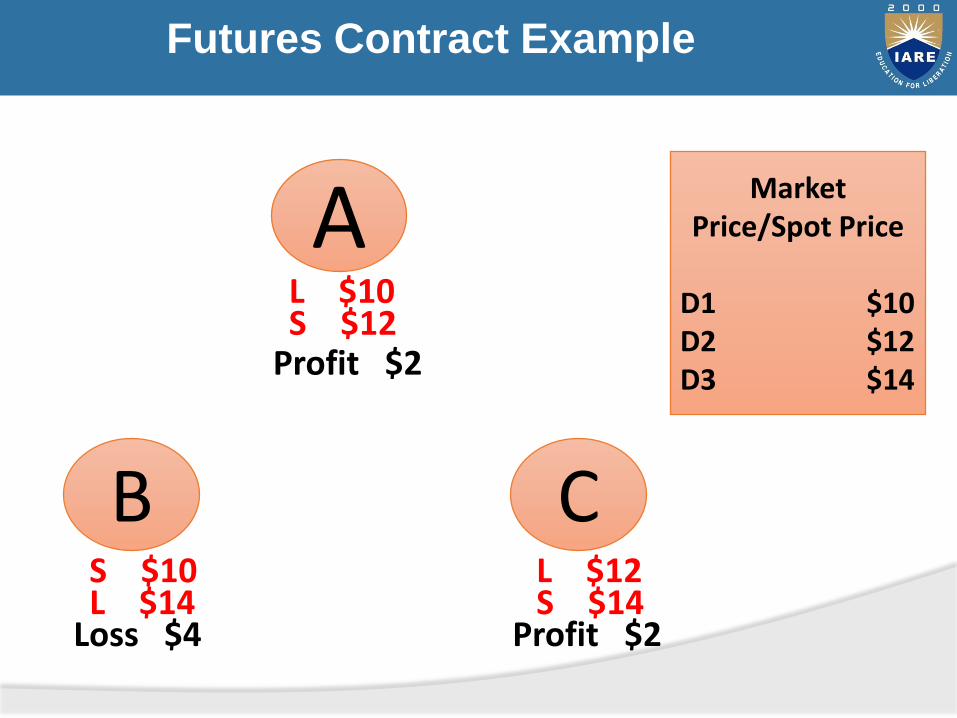
Futures Contract Example
A
B C
L $10S $12
S $10L $14
L $12S $14
Profit $2
Loss $4 Profit $2
Market Price/Spot Price
D1 $10D2 $12D3 $14
Types of Futures Contracts
• Stock Futures Trading (dealing with shares)
• Commodity Futures Trading (dealing with gold futures, crude oil futures)
• Index Futures Trading (dealing with stock market indices)
Closing a Futures Position
• Most futures contracts are not held till expiry, but closed before that.
• If held till expiry, they are generally settled by delivery. (2-3%)
• By closing a futures contract before expiry, the net difference is settled between traders, without physical delivery of the underlying.
Terminology
• Contract size – The amount of the asset that has to be delivered under one contract. All futures are sold in multiples of lots which is decided by the exchange board.
Eg. If the lot size of Tata steel is 500 shares, then one futures contract is necessarily 500 shares.
• Contract cycle – The period for which a contract trades.
The futures on the NSE have one (near) month, two (next) months, three (far) months expiry cycles.
• Expiry date – usually last Thursday of every month or previous day if Thursday is public holiday.
Terminology
• Strike price – The agreed price of the deal is called the strike price.
• Cost of carry – Difference between strike price and current price.
Margins
• A margin is an amount of a money that must be deposited with the clearing house by both buyers and sellers in a margin account in order to open a futures contract.
• It ensures performance of the terms of the contract.
• Its aim is to minimize the risk of default by either counterparty.
Margins
• Initial Margin - Deposit that a trader must make before trading any futures. Usually, 10% of the contract size.
• Maintenance Margin - When margin reaches a minimum maintenance level, the trader is required to bring the margin back to its initial level. The maintenance margin is generally about 75% of the initial margin.
• Variation Margin - Additional margin required to bring an account up to the required level.
• Margin call – If amt in the margin A/C falls below the maintenance level, a margin call is made to fill the gap.
Marking to Market
• This is the practice of periodically adjusting the margin account by adding or subtracting funds based on changes in market value to reflect the investor’s gain or loss.
• This leads to changes in margin amounts daily.
• This ensures that there are o defaults by the parties.
What are Options?
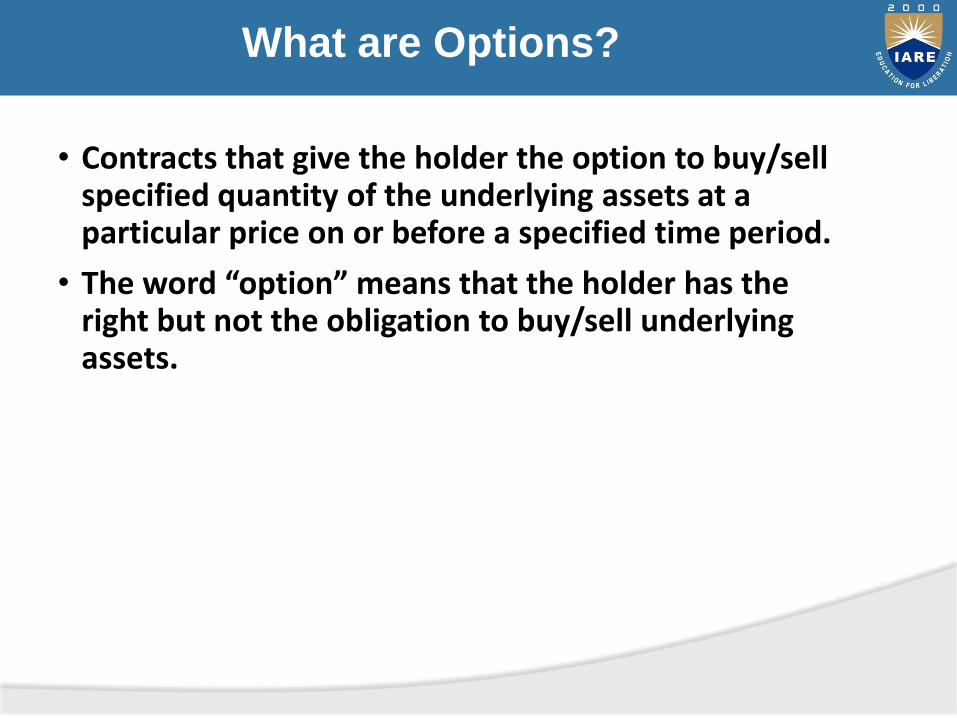
• Contracts that give the holder the option to buy/sell specified quantity of the underlying assets at a particular price on or before a specified time period.
• The word “option” means that the holder has the right but not the obligation to buy/sell underlying assets.
Types of Options
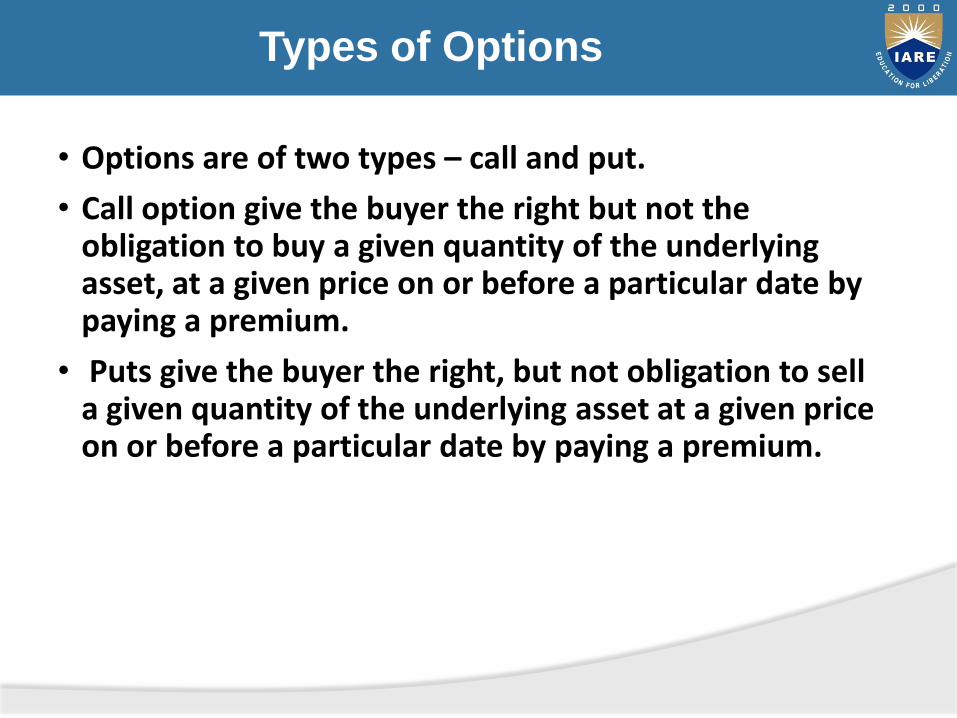
• Options are of two types – call and put.
• Call option give the buyer the right but not the obligation to buy a given quantity of the underlying asset, at a given price on or before a particular date by paying a premium.
• Puts give the buyer the right, but not obligation to sell a given quantity of the underlying asset at a given price on or before a particular date by paying a premium.
Types of Options (cont.)
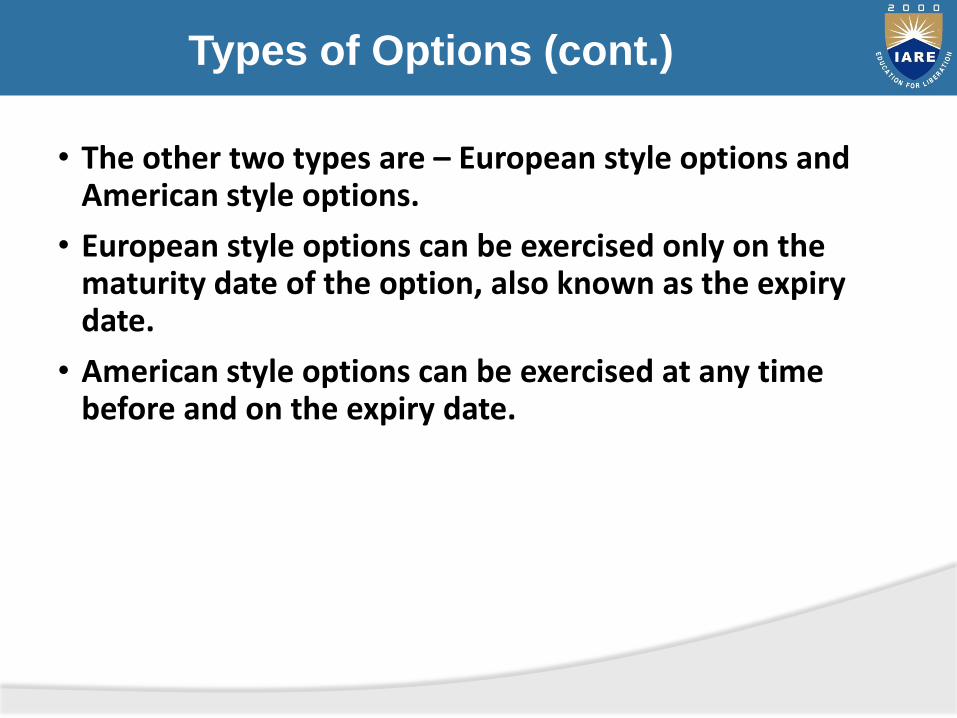
• The other two types are – European style options and American style options.
• European style options can be exercised only on the maturity date of the option, also known as the expiry date.
• American style options can be exercised at any time before and on the expiry date.
Call Option Example
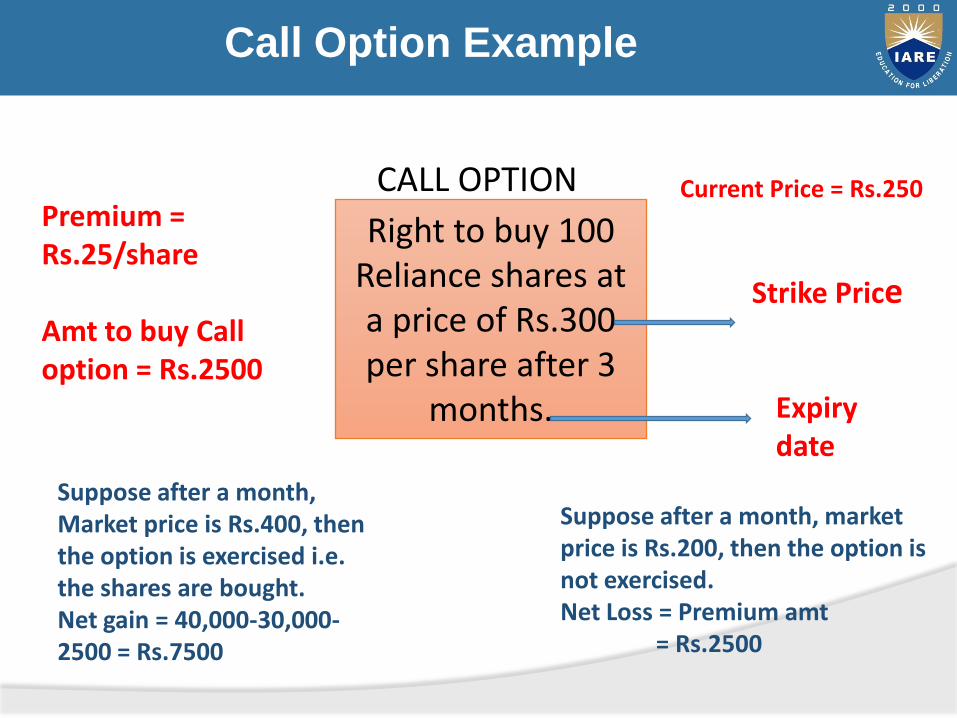
Right to buy 100 Reliance shares at a price of Rs.300 per share after 3
months.
CALL OPTION
Strike Price
Premium = Rs.25/share
Amt to buy Call option = Rs.2500
Current Price = Rs.250
Suppose after a month, Market price is Rs.400, then the option is exercised i.e. the shares are bought.Net gain = 40,000-30,000-2500 = Rs.7500
Suppose after a month, market price is Rs.200, then the option is not exercised.Net Loss = Premium amt
= Rs.2500
Expiry date
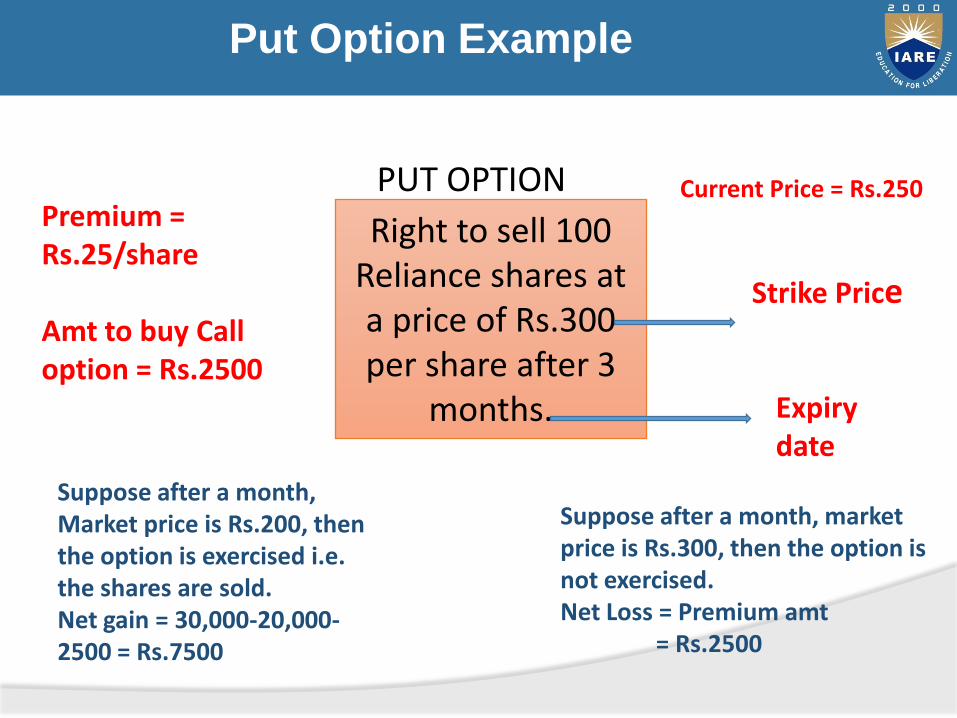
Put Option Example
Right to sell 100 Reliance shares at a price of Rs.300 per share after 3
months.
PUT OPTION
Strike Price
Premium = Rs.25/share
Amt to buy Call option = Rs.2500
Current Price = Rs.250
Suppose after a month, Market price is Rs.200, then the option is exercised i.e. the shares are sold.Net gain = 30,000-20,000-2500 = Rs.7500
Suppose after a month, market price is Rs.300, then the option is not exercised.Net Loss = Premium amt
= Rs.2500
Expiry date
Features of Options
• A fixed maturity date on which they expire. (Expiry date)
• The price at which the option is exercised is called the exercise price or strike price.
• The person who writes the option and is the seller is referred as the “option writer”, and who holds the option and is the buyer is called “option holder”.
• The premium is the price paid for the option by the buyer to the seller.
• A clearing house is interposed between the writer and the buyer which guarantees performance of the contract.
Options Terminology
• Underlying: Specific security or asset.
• Option premium: Price paid.
• Strike price: Pre-decided price.
• Expiration date: Date on which option expires.
• Exercise date: Option is exercised.
• Open interest: Total numbers of option contracts that have not yet been expired.
• Option holder: One who buys option.
• Option writer: One who sells option.
Options Terminology (cont.)
• Option class: All listed options of a type on a particular instrument.
• Option series: A series that consists of all the options of a given class with the same expiry date and strike price.
• Put-call ratio: The ratio of puts to the calls traded in the market.
Options Terminology (cont.)
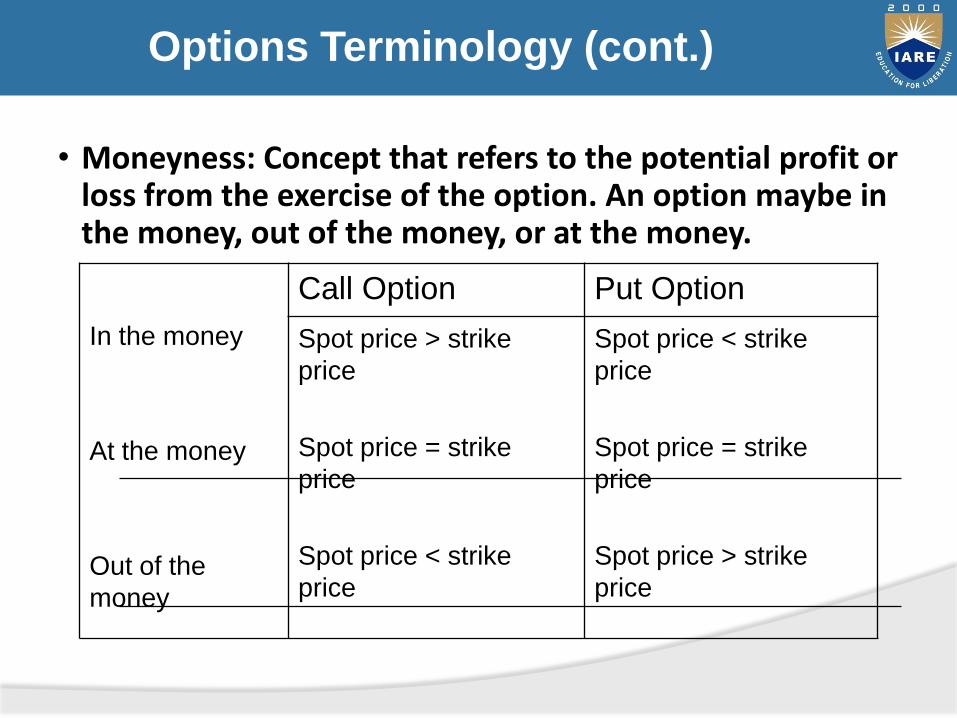
• Moneyness: Concept that refers to the potential profit or loss from the exercise of the option. An option maybe in the money, out of the money, or at the money.
In the money
At the money
Out of the
money
Call Option Put Option
Spot price > strike
price
Spot price = strike
price
Spot price < strike
price
Spot price < strike
price
Spot price = strike
price
Spot price > strike
price
What are SWAPS?
• In a swap, two counter parties agree to enter into a contractual agreement wherein they agree to exchange cash flows at periodic intervals.
• Most swaps are traded “Over The Counter”.
• Some are also traded on futures exchange market.
Types of Swaps
There are 2 main types of swaps
• Plain vanilla fixed for floating swaps
or simply interest rate swaps.
• Fixed for fixed currency swaps
or simply currency swaps.
What is an Interest Rate Swap?
• A company agrees to pay a pre-determined fixed interest rate on a notional principal for a fixed number of years.
• In return, it receives interest at a floating rate on the same notional principal for the same period of time.
• The principal is not exchanged. Hence, it is called a notional amount.
Floating Interest Rate
• LIBOR – London Interbank Offered Rate
• It is the average interest rate estimated by leading banks in London.
• It is the primary benchmark for short term interest rates around the world.
• Similarly, we have MIBOR i.e. Mumbai Interbank Offered Rate.
• It is calculated by the NSE as a weighted average of lending rates of a group of banks.
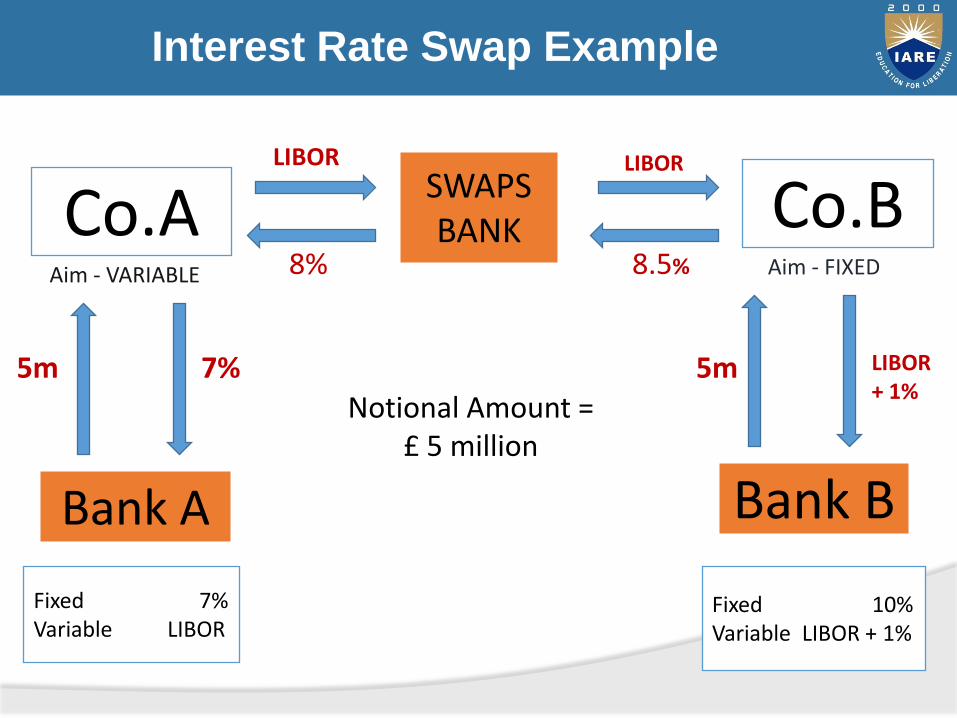
Interest Rate Swap Example
Co.A Co.BSWAPS BANK
Bank A
Fixed 7%Variable LIBOR
Bank B
Fixed 10%Variable LIBOR + 1%
Aim - VARIABLE Aim - FIXED
LIBOR LIBOR
8% 8.5%
7%5m 5m LIBOR + 1%
Notional Amount = £ 5 million
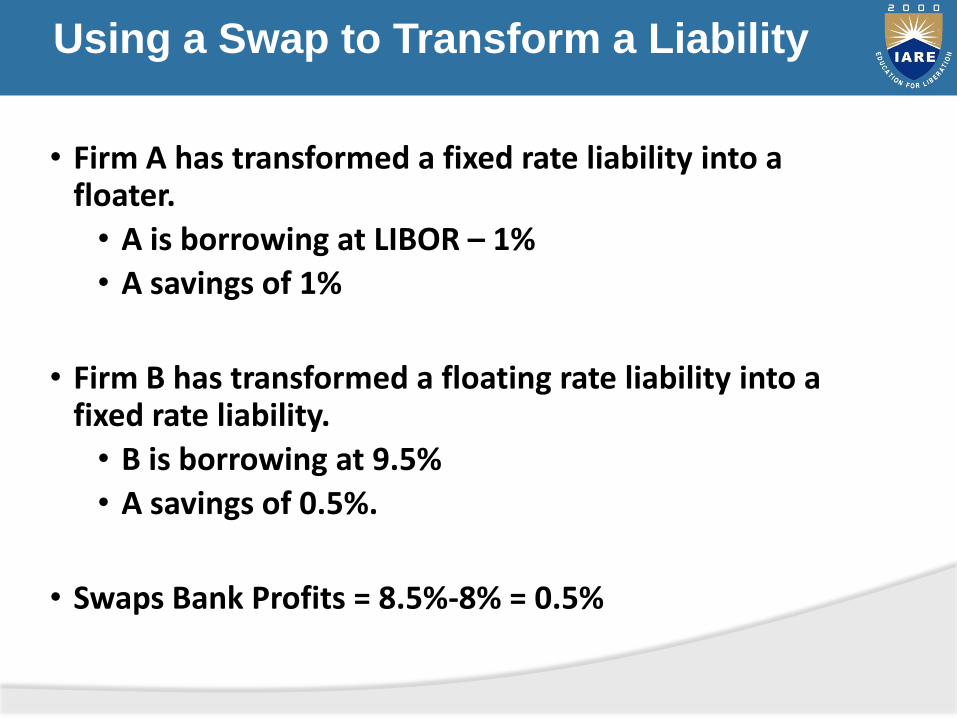
Using a Swap to Transform a Liability
• Firm A has transformed a fixed rate liability into a floater.
• A is borrowing at LIBOR – 1%
• A savings of 1%
• Firm B has transformed a floating rate liability into a fixed rate liability.
• B is borrowing at 9.5%
• A savings of 0.5%.
• Swaps Bank Profits = 8.5%-8% = 0.5%
What is a Currency Swap?
• It is a swap that includes exchange of principal and interest rates in one currency for the same in another currency
• It is considered to be a foreign exchange transaction.
• It is not required by law to be shown in the balance sheets.
• The principal may be exchanged either at the beginning or at the end of the tenure.
• However, if it is exchanged at the end of the life of the swap, the principal value may be very different.
• It is generally used to hedge against exchange rate fluctuations.
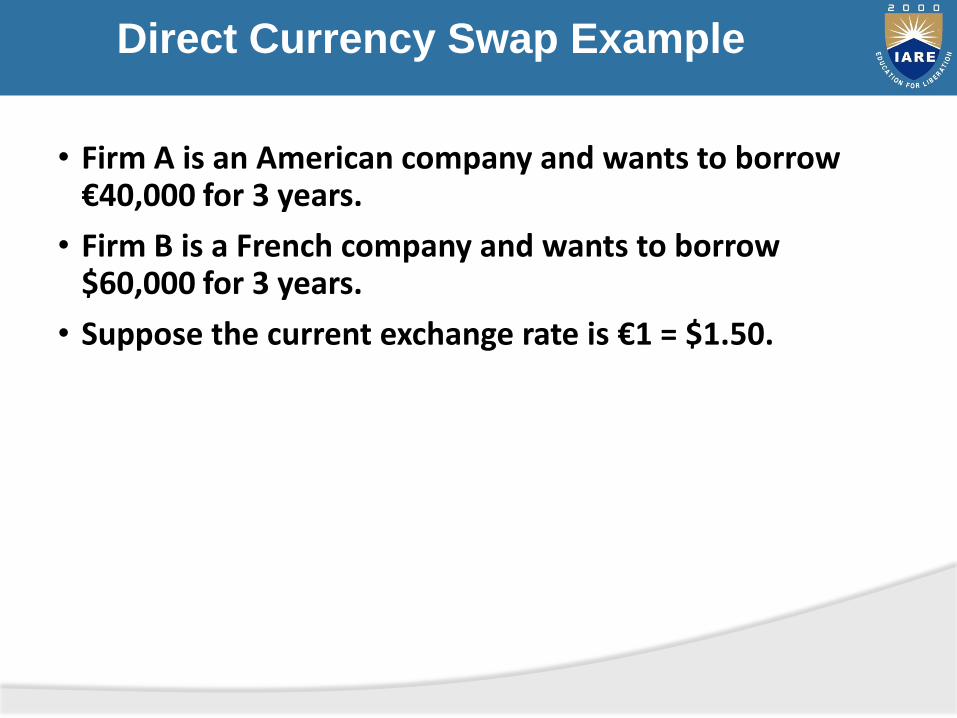
Direct Currency Swap Example
• Firm A is an American company and wants to borrow €40,000 for 3 years.
• Firm B is a French company and wants to borrow $60,000 for 3 years.
• Suppose the current exchange rate is €1 = $1.50.
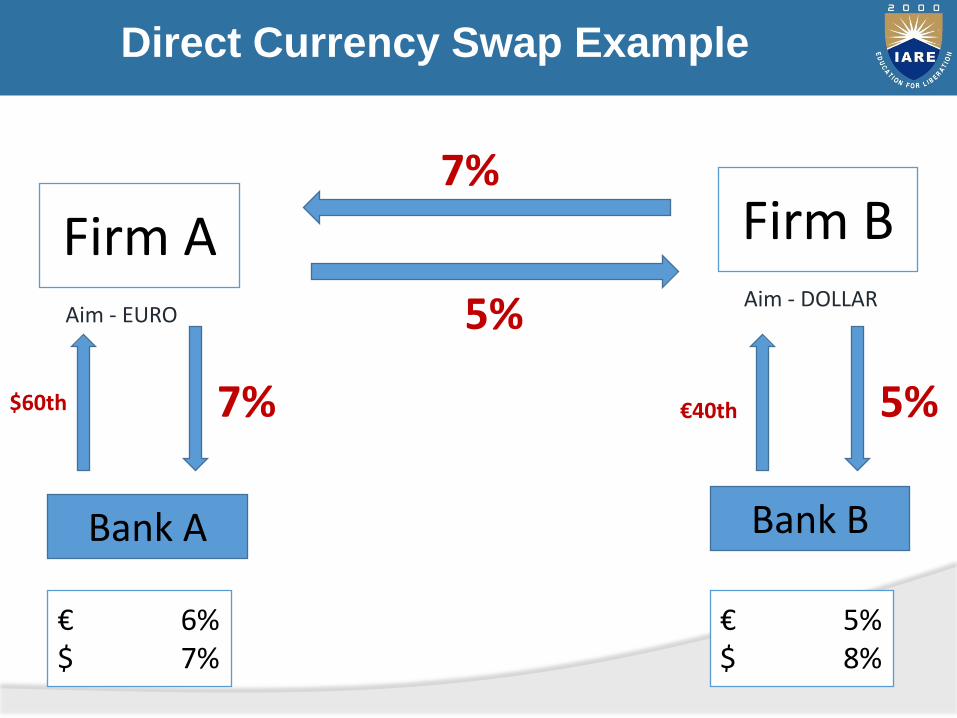
Direct Currency Swap Example
Firm A Firm B
Bank A Bank B
€ 6%$ 7%
€ 5%$ 8%
Aim - EUROAim - DOLLAR
7%
5%
7% 5%$60th €40th
Comparative Advantage
• Firm A has a comparative advantage in borrowing Dollars.
• Firm B has a comparative advantage in borrowing Euros.
• This comparative advantage helps in reducing borrowing cost and hedging against exchange rate fluctuations.
UNIT V
MUTUAL FUNDS

Unit- V: Mutual Funds
A mutual fund is a common pool of money into whichinvestors place their contributions that are to beinvested in different types of securities in accordancewith the stated objective.
An equity fund would buy equity assets – ordinaryshares, preference shares, warrants etc.
A bond fund would buy debt instruments such asdebenture bonds, or government securities/moneymarket securities.
Myths about Mutual Funds
1. Mutual Funds invest only in shares.
2. Mutual Funds are prone to very high risks/actively traded.
3. Mutual Funds are very new in the financial market.
4. Mutual Funds are not reliable and people rarely invest in them.
5. The good thing about Mutual Funds is that you don’t have to pay attention to them.
Facts about Mutual Funds
1.Equity Instruments like shares are only a part of thesecurities held by mutual funds. Mutual funds alsoinvest in debt securities which are relatively muchsafer.
2. Mutual Funds are there in India since 1964. MutualFunds market has evolved in U.S.A and is there forthe last 60 years.
3. Mutual Funds are the best solution for people whowant to manage risks and get good returns.
Facts about Mutual Funds
4. US is very much a part of the market and is not immune to its vagaries. The crisis has risen due to mismanagement of the fund.
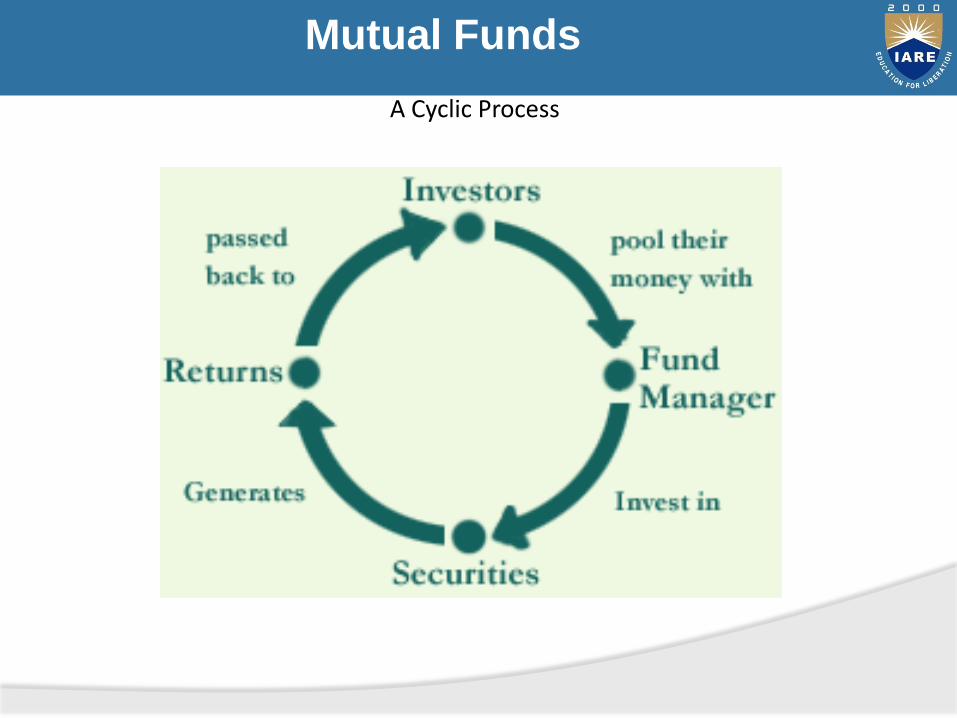
Mutual Funds
A Cyclic Process

History of mf’s
History of MF’s can be discussed in two parts :
1) Emergence through public players; and
2) Emergence through private players
History of Mutual Funds
Phase I – 1964 – 87: In 1963, UTI was set up by Parliament under UTI act and given a monopoly. The first equity fund was launched in 1986.
Phase II – 1987 – 93: Non-UTI, Public Sector mutual funds.
Like-
SBI Mutual Fund,
Canbank Mutual Fund,
LIC Mutual Fund,
Indian Bank Mutual Fund,
GIC Mutual Fund and
PNB Mutual Fund.
History of Mutual Funds
Phase III – 1993 – 96: Introducing private sector funds.
As well as open-end funds.
Phase IV – 1996: Investor friendly regulatory measures Action taken by SEBI to protect the investor, and To enhance investor’s returns through tax benefits.
TYPES OF MUTUAL FUNDS
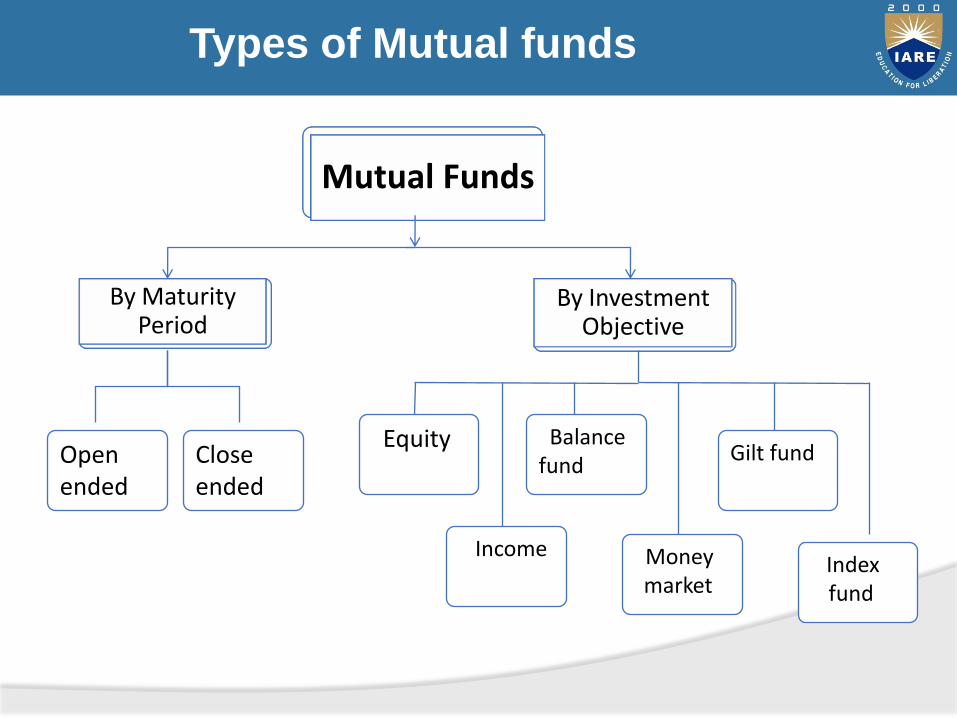
Mutual Funds
By Maturity Period
By Investment Objective
Equity
Income
Balance fund
Money market
Gilt fund
Index fund
Close ended
Open ended
Types of Mutual funds
By Structure:
1. Open-ended Funds2. Closed-ended Funds3. Interval Funds
By Investment Objective:
1.Growth Funds
2. Income Funds
3. Balanced Funds
4. Money Market Funds
5. Load Funds
6. No-Load Funds
OTHER SCHEMES
Tax Saving Schemes
Some times the investors investing their money in the mutual funds to get some tax benefits.
Advantages of Mutual Funds
• Portfolio diversification: It enables him to hold a diversified investment portfolio even with a small amount of investment like Rs. 2000/-.
• Professional management: The investment management skills, along with the needed research into available investment options, ensure a much better return as compared to what an investor can manage on his own.
Advantages of Mutual Funds
• Liquidity: Investors may be unable to sell shares directly, easily and quickly. When they invest in mutual funds, they can cash their investment any time by selling the units to the fund if it is open-ended and get the intrinsic value. Investors can sell the units in the market if it is closed-ended fund.
• Convenience and Flexibility: Investors can easily transfer their holdings from one scheme to other, get updated market information and so on. Funds also offer additional benefits like regular investment and regular withdrawal options.
Advantages of Mutual Funds
• Transparency: Fund gives regular information to its investors on the value of the investments in addition to disclosure of portfolio held by their scheme, the proportion invested in each class of assets and the fund manager's investment strategy and outlook
Disadvantages of Mutual Funds
• No control over costs: The investor pays investment management fees as long as he remains with the fund, even while the value of his investments are declining. He also pays for funds distribution charges which he would not incur in direct investments.
• No tailor-made portfolios: The very high net-worth individuals or large corporate investors may find this to be a constraint as they will not be able to build their own portfolio of shares, bonds and other securities.
Disadvantages of Mutual Funds
• Managing a portfolio of funds: Availability of a large number of funds can actually mean too much choice for the investor. So, he may again need advice on how to select a fund to achieve his objectives.
• Delay in redemption: It takes 3-6 days for redemption of the units and the money to flow back into the investor’s account.
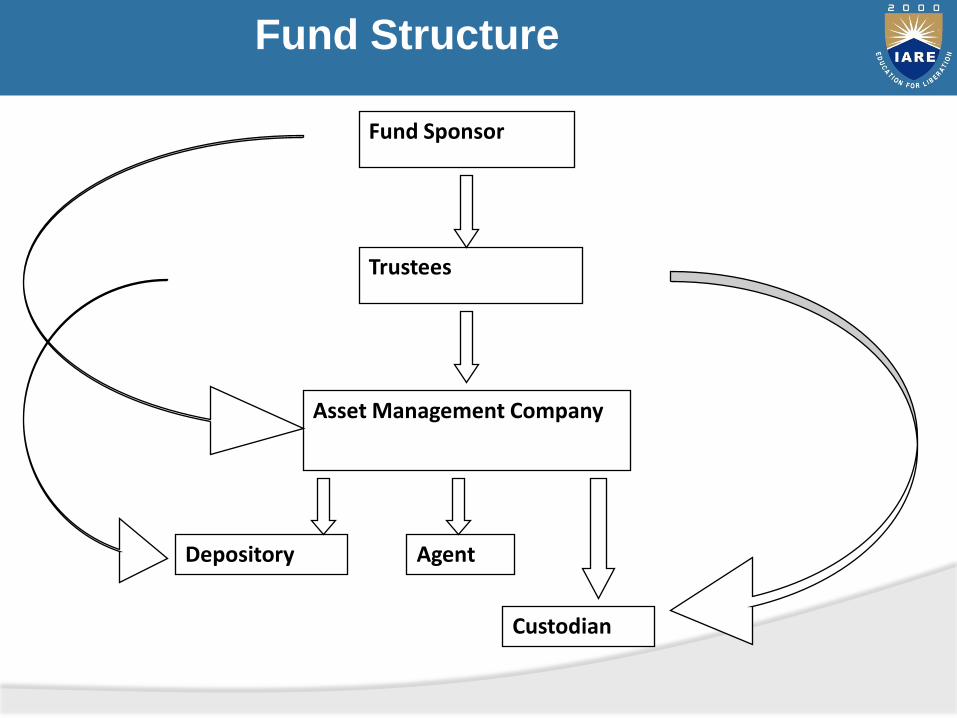
Fund Structure
Fund Sponsor
Trustees
Asset Management Company
Depository
Custodian
Agent

Fund Sponsor
The Fund Sponsor
• Any person or corporate body that establishes the Fund and registers it with SEBI.
• Form a Trust and appoint a Board of Trustees.
• Appoints Custodian and Asset Management Company either directly or through Trust, in accordance with SEBI regulations.
SEBI regulations also define that a sponsor must contribute
at least 40% to the net worth of the asset management
company.
Trustees
Trustees
• Created through a document called the Trust Deed that is executed by the Fund Sponsor and registered with SEBI.
• The Trust-the mutual fund may be managed by a Board of Trustees- a body of individuals or a Trust Company- a corporate body.
• Protector of unit holders interests.
• 2/3 of the trustees shall be independent persons and shall not be associated with the sponsors.
Trustees
Rights of Trustees:
• Approve each of the schemes floated by the AMC.
• The right to request any necessary information from the AMC.
• May take corrective action if they believe that the conduct of the fund's business is not in accordance with SEBI Regulations.
• Have the right to dismiss the AMC,
• Ensure that, any shortfall in net worth of the AMC is made up.
Trustees
Obligations of the Trustees:
• Enter into an investment management agreement with the AMC.
• Ensure that the fund's transactions are in accordance with the Trust Deed.
• Furnish to SEBI on a half-yearly basis, a report on the fund's activities
• Ensure that no change in the fundamental attributes of any scheme or the trust or any other change which would affect the interest of unit holders is happens without informing the unit holders.
• Review the investor complaints received and the redressal of the same by the AMC.
Asset Management Company
• Acts as an invest manager of the Trust under the Board Supervision and direction of the Trustees.
• Has to be approved and registered with SEBI.
• Will float and manage the different investment schemes in the name of Trust and in accordance with SEBI regulations.
• Acts in interest of the unit-holders and reports to the trustees.
• At least 50% of directors on the board are independent of the sponsor or the trustees.
Asset Management Company
Obligation of Asset Management Company:
Float investment schemes only after receiving prior approval from the Trustees and SEBI.
Send quarterly reports to Trustees.
Make the required disclosures to the investors in areas such as calculation of NAV and repurchase price.
Must maintain a net worth of at least Rs. 10 crores at all times.
Will not purchase or sell securities through any broker, which is average of 5% or more of the aggregate purchases and sale of securities made by the mutual fund in all its schemes.
Structure of Mutual Funds
Custodian
• Has the responsibility of physical handling and safe keeping of the securities.
• Should be independent of the sponsors and registered with SEBI.
Structure of Mutual Funds
Depositories
• Indian capital markets are moving away from physical certificates for securities to ‘dematerialized’ form with a Depository.
• Will hold the dematerialized security holdings of the Mutual Fund.
Distribution Channels
Mutual Funds are primary vehicles for large collective investments, working on the principle of pooling funds.
A substantial portion of the investments happen at the retail level.
Agents and distributors are a vital link between the mutual funds and investors.
Agents
- Is a broker between the fund and the investor and acts on behalf of the principal.
- He is not exclusive to the fund and also sells other financial services. This in a way helps him to act as a financial advisor.
Distribution Channels
Banks and NBFCs
- Several banks, particularly private and foreign banks are involved in a fund distribution by providing similar services like that of distribution companies.
- They work on commission basis.
Direct Marketing
- Mutual funds sell their own products through their sales officers and employees of the AMC.
- This channel is normally used to mobilize funds from high net worth individuals and institutional investors.
Sales Practices
Agent Commissions
- No rules prescribed for governing the maximum or minimum commissions payable by a fund to its agents.
- As per SEBI regulations, 1996 all initial expenses including brokerage charges paid to agents cannot exceed 6% of resources raised under the scheme.
- Excess distribution charges have to be borne by the AMC.
- A no-load fund is authorized to charge the schemes with the commissions paid to agents as part of the regular management and marketing expenses allowed by SEBI.
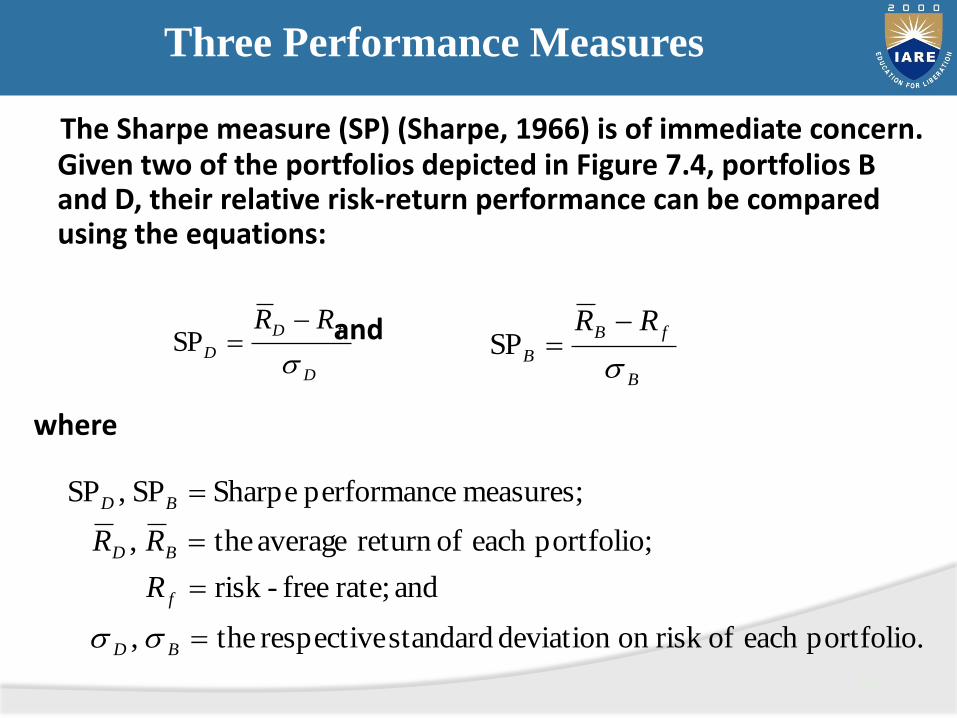
Three Performance Measures
The Sharpe measure (SP) (Sharpe, 1966) is of immediate concern. Given two of the portfolios depicted in Figure 7.4, portfolios B and D, their relative risk-return performance can be compared using the equations:
and
where
264
D
fD
D
RR
SP
B
fB
B
RR
SP
portfolio.each ofrisk on deviation standard respective the,
and rate; free-risk
portfolio;each ofreturn average the,
measures; eperformanc SharpeSP,SP
BD
f
BD
BD
R
RR
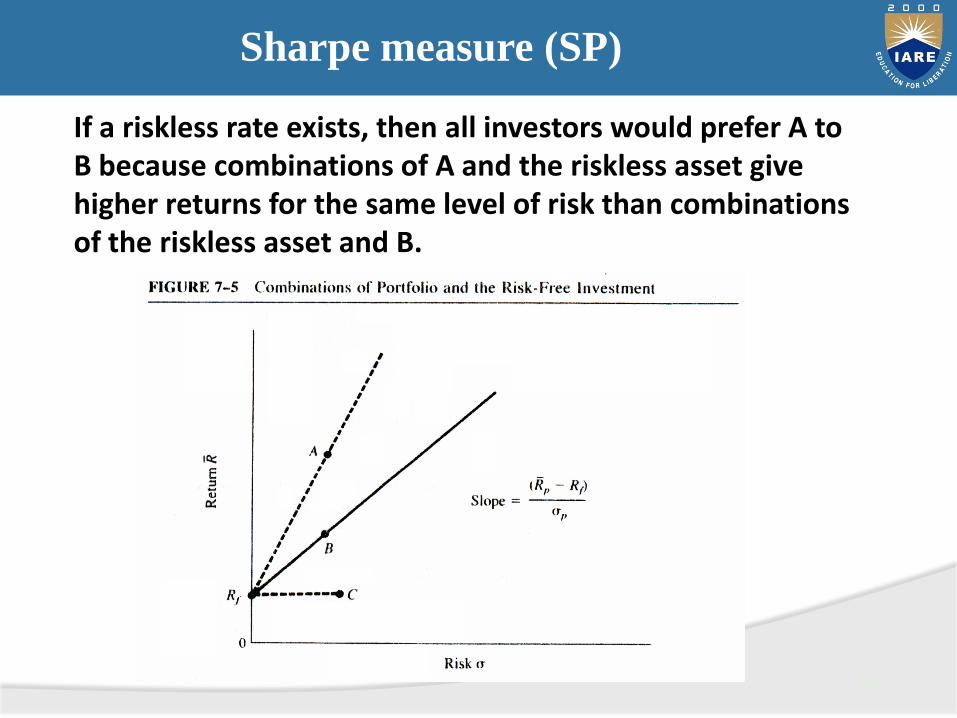
Sharpe measure (SP)
265
If a riskless rate exists, then all investors would prefer A to B because combinations of A and the riskless asset give higher returns for the same level of risk than combinations of the riskless asset and B.
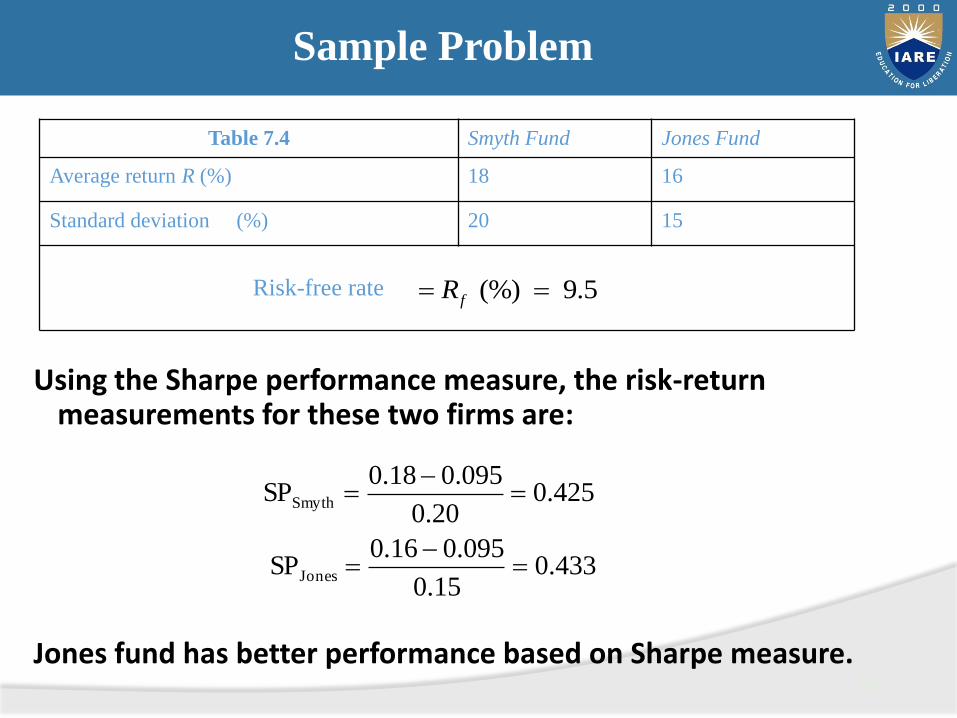
Sample Problem
Using the Sharpe performance measure, the risk-return measurements for these two firms are:
Jones fund has better performance based on Sharpe measure.266
Table 7.4 Smyth Fund Jones Fund
Average return R (%) 18 16
Standard deviation (%) 20 15
Risk-free rate (%) 9.5fR
433.015.0
095.016.0SP
425.020.0
095.018.0SP
Jones
Smyth
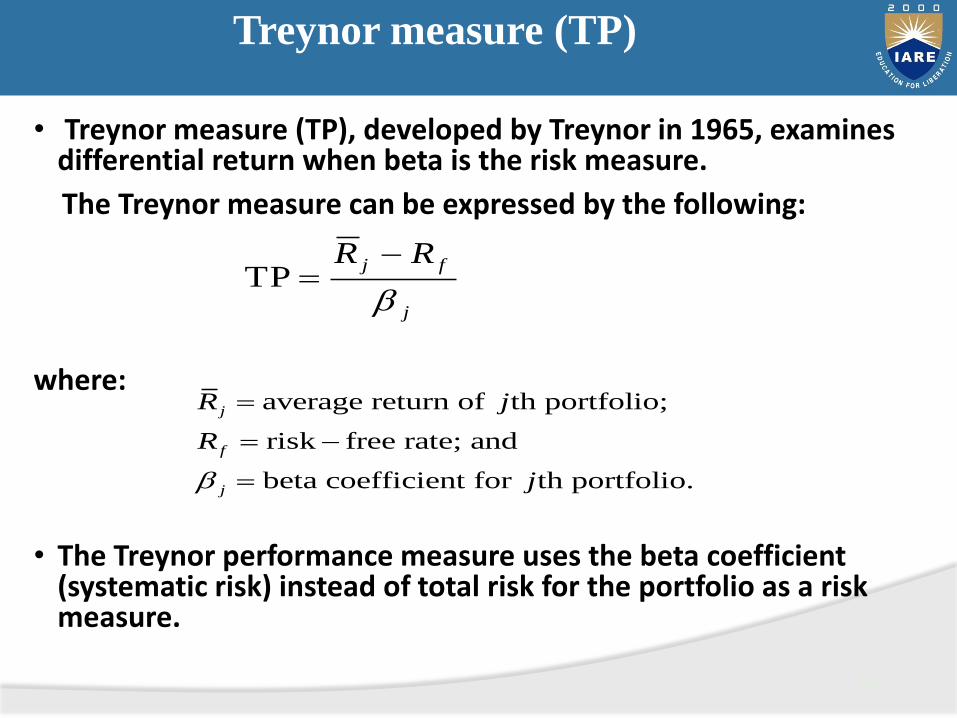
Treynor measure (TP)
• Treynor measure (TP), developed by Treynor in 1965, examines differential return when beta is the risk measure.
The Treynor measure can be expressed by the following:
where:
• The Treynor performance measure uses the beta coefficient (systematic risk) instead of total risk for the portfolio as a risk measure.
267
j
fj RR
b
TP
average return of th portfolio;
risk free rate; and
beta coefficient for th portfolio.
j
f
j
R j
R
jb
Portfolio Revision
• The investor should have competence and skill in therevision of the portfolio.
• The portfolio management process needs frequentchanges in the composition of stocks and bonds.
• Mechanical methods are adopted to earn better profitthrough proper timing.
• Such type of mechanical methods are Formula Plansand Swaps.
Passive Management
• Passive management refers to the investor’s attemptto construct a portfolio that resembles the overallmarket returns.
• The simplest form of passive management is holdingthe index fund that is designed to replicate a good andwell defined index of the common stock such as BSE-Sensex or NSE-Nifty.

Active Management
• Active Management is holding securities based on theforecast about the future.
• The portfolio managers who pursue active strategywith respect to market components are called ‘markettimers’.
• The managers may indulge in ‘group rotations’.
• Group rotation means changing the investment indifferent industries stocks depending on the assessedexpectations regarding their future performance.
The Formula Plans
• The formula plans provide the basic rules andregulations for the purchase and sale of securities.
• The aggressive portfolio consists more of commonstocks which yield high return with high risk.
• The conservative portfolio consists of more bonds thathave fixed rate of returns.
Assumptions of the Formula Plan
• Certain percentage of the investor’s fund is allocatedto fixed income securities and common stocks.
• The stocks are bought and sold whenever there is asignificant change in the price.
• The investor should strictly follow the formula planonce he chooses it.
• The investors should select good stocks that movealong with the market.
Advantages of the Formula Plan
• Basic rules and regulations for the purchase and saleof securities are provided.
• The rules and regulations are rigid and help toovercome human emotion.
• The investor can earn higher profits by adopting theplans.
• It controls the buying and selling of securities by theinvestor.
• It is useful for taking decisions on the timing ofinvestments.
Disadvantages of the Formula Plan
• The formula plan does not help the selection of thesecurity.
• It is strict and not flexible with the inherent problemof adjustment.
• Should be applied for long periods, otherwise thetransaction cost may be high.
• Investor needs forecasting.
Rupee Cost Averaging
• Stocks with good fundamentals and long term growthprospects should be selected.
• The investor should make a regular commitment ofbuying shares at regular intervals.
• Reduces the average cost per share and improves thepossibility of gain over a long period.
Constant Rupee Plan
• A fixed amount of money is invested in selected stocksand bonds.
• When the price of the stocks increases, the investorsells sufficient amount of stocks to return to theoriginal amount of the investment in stocks.
• The investor must choose action points or revaluationpoints.
• The action points are the times at which the investorhas to readjust the values of the stocks in theportfolio.
Constant Ratio Plan
• Constant ratio between the aggressive andconservative portfolios is maintained.
• The ratio is fixed by the investor.
• The investor’s attitude towards risk and return plays amajor role in fixing the ratio.
Variable Ratio Plan
• At varying levels of market price, the proportions ofthe stocks and bonds change.
• Whenever the price of the stock increases, the stocksare sold and new ratio is adopted by increasing theproportion of defensive or conservative portfolio.
• To adopt this plan, the investor is required to estimatea long term trend in the price of the stocks.