SECURITY ANALYSIS AND PORTFOLIO MANAGEMENT Agustin...
66
2000-06 Spring 2000 Security Analysis and Portfolio Management Agustin Gonzalez SECURITY ANALYSIS AND PORTFOLIO MANAGEMENT Agustin Gonzalez
Transcript of SECURITY ANALYSIS AND PORTFOLIO MANAGEMENT Agustin...
2000-06 Spring 2000
Security Analysis and Portfolio Management
Agustin Gonzalez
SECURITY ANALYSIS AND PORTFOLIO
MANAGEMENT
Agustin Gonzalez
MANAGEMENT SUMMARY
The project that is presented in this document is the development, analysis, and formulation of a mutual fund. This particular project focused on the development of two funds, Growth and Venture Funds, both with an emphasis in the technology sector. The Growth Fund will be invested primarily in large—cap companies while the Venture Fundeeks mid to small—cap emerging companies. There are three phases to this project eachihich involves a great deal of analysis and critical decision-making. The three phases of the project are as follows:
(. Sector / Industry Outlook - In this phase, I narrowed the focus of my two mutual funds to oi the technology sector. Within this sector I have also placed a great deal of emphasis on industry
distinction. For example, I focused a great deal of my efforts on semiconductors which have done very well in outperforming the broader market the past year and is expected to continue to do so for the next two to three years. As a result, I ensured that careful analysis was done in this
"particular industry. There were over ten industries that were selected for study and are as follows: telecommunication equipment/services, semiconductors, circuits, telephone, wireless communication, internet portal/retailers, internet services, internet software, computer services, computer software, and applications software.
2. Security Analysis - After dividing up the companies into industries, I tasked my myself with the selection of securities for the two portfolios. In achieving this feat, I built business models for all the companies that I placed into consideration. When it was all done, my research which extended to over 350 companies with about half of those actually being chosen for a second look. In the "second look" companies were evaluated based on revenue, net income, cash flow, and management effectiveness. Finally, each company was expected to closely satisfy three of the following four factors:
a. Robust Earning (>20% year to year) b. Strong Market Share C. Proprietary Advantage d. High Profit Margins
After this was done, companies were categorized by their size and placed into one of the funds based on market capitalization.
3. Portfolio Management - After having selected the securities, I decided to use an optimizing strategy to build the portfolios and allocated the shares accordingly. In doing this I followed the Markowitz Portfolio Theory which is a nonlinear programming model that uses a covariance matrix to derive the optimal portfolio based on expected rates of return. For these models we were to assume that the value of the fund would be $10 million.
By following the phases as I listed above I was able to develop two equity-based mutual funds. Each of these three phases was very important in its own way and each involved a great deal of analysis and research.

BACKGROUND AND DESCRIPTION OF THE PROBLEM
One of the major advances in the investment field during the past few decades has been
the recognition that the creation of an optimum investment portfolio is not simply a matter of
combining a lot of unique securities that have desirable risk return characteristics. It has been
shown that yeu must consider the relationship among the investments if you are going to build an
optimum portfolio that will meet your investment objectives. The recognition 6fwhat is
important in creating a portfolio was demonstrated in the derivation of portfolio theory.
Before commencing an in-depth discussion of the portfolio theory it is imperative to first
clarify some general assumptions of the theory. This includes not only what we mean by
optimum portfolio, but also what we mean by the terms risk aversion and risk. From our
standpoint, we must understand the fundamental premise of this theory which is that as an
investor you want to maximize the returns from your investments for given of risk. To
adequately deal with such an assumption, there area number of ground rules that must be first
put into place. First, your portfolio should include all your assets and liabilities, not only your
stocks or even your marketable securities, but also everything from your car, house, and any
outstanding debt. The entire spectrum of investments must be considered because the returns
from all these investments interact and this relationship between returns is absolutely vital.
Portfolio theory also assumes that investors are basically risk aderse which in essence
means that given a choice between two assets with equal rates of return they will select the asset
with the lower level of risk. Evidence that most investors are risk averse is that they purchase
various types of insurance, including life insurance, car insurance, and health insurance. When
you buy insurance, this implies that you are willing to pay the current known cost related to a car
accident or a major illness. Further evidence of risk aversion is the difference in promised yield

for different grades of bonds that supposedly have different degrees of credit risk. As you might
know from reading about corporate bonds, the promised yield on bonds increases as you go from
AAA (the lowest risk class) to AA to A, and so on. This increase in promised yields means that
investors require a higher rate of return to accept higher risk. IThis does not imply that everybody is risk averse, or that investors are completely risk
averse regarding all financial commitments. The fact is, not everybody buys insurance for
' everything. Some people have no insurance against anything, either by choice or because they
cannot afford it. In addition, some individuals buy insurance related to some risks such as auto
accidents or illness, but they also buy lottery tickets and gamble at race tracks or in casinos,
where it is that returns are negative. This combination of risk preference and
risk aversion can be explained by an attitude toward risk that is not completely risk averse or risk
preferring, but is a combination of the two that depends on the amount of money involved.
(Reilly 259)
While recognizing the diversity of attitudes, our basic assumption is that most investors
committing large sums of money to developing an investment portfolio are risk averse.
Therefore, we expect a positive relationship between expected return and expected risk.
Notably, this is also what we generally find in terms of long-run historical results - that is, there
is generally a positive relationship between rates of return on various assets and their measures
of risk. (Reilly 259)
IV 5\A3

ANALYSIS OF THE SITUATION
In the 1950's and early 1960's, the investment community talked about risk, but there
was no specific measure for the term. To build a portfolio model investors had to quantify their
risk variable. The basic portfolio model was developed by Harry Markowitz, who derived the
expected rate of return for a portfolio of assets and an expected risk measure. He showed that the
variance of rate of return was a meaningful measure of portfolio risk under a reasonable set of
assumptions and he derived the formula for computing the variance of a portfolio. This formula
for the variance of a portfolio not only indicated the importance of diversifying your investments
to reduce the total risk of a portfolio, but also showed how to effectively diversify. The
Markowitz model is based on several assumptions regarding investor behavior:
1. Investors consider each investment alternative as represented by a probability distribution
of expected returns over some holding period.
2. Investors maximize one period expected utility, and their utility curves demonstrate
diminishing marginal utility of wealth. LmL s.
A1
3. Investors estimate risk of portfolio on the basis of the variability of expected returns. j,
4. Investors base decisions on expected returns and risk, so their utility area is a function of
expected return and the expected variance (or standard deviation) of returns only.
5. For a given level of risk, investors prefer higher returns to lower returns. Similarly, for a
given level of expected return, investors prefer less risk to more risk.
Under these assumptions, a single asset or portfolio of assets is considered to be efficient if no
other asset or portfolio of assets offers higher expected return with the same (or lower) risk, or
lower risk with the same (or higher) expected return. (Reilly 260)

One of the best-known measures of risk is the variance, or standard deviation of expected
returns. It is a statistical measure of the dispersion of returns around the expected value whereby
a large variance or standard deviation indicates greater dispersion, all other factors being equal.
The idea is that the more disperse the expected returns, the greater the uncertainty of those
returns in any future period.
Another method of measurement involves that that of covariance. In this project, the
assets we selected in accordance to a covariance of returns. By definition, covariance is a
measure of the degree to which two variables "move together" relative to their mean values over
time. In portfolio analysis, we are usually concerned with the covariance of rates of return rather
than prices or some other variable. A positive covariance means that the rates of return for two
investments tend to move in the same direction relative to their individual means during the same
period of time. On the other hand, a negative covariance indicates that the rates of return for two
investments tend to move in different directions relative to their means during specified time
intervals over time. The magnitude of the covariance depends on the variances of the individual
returns series.
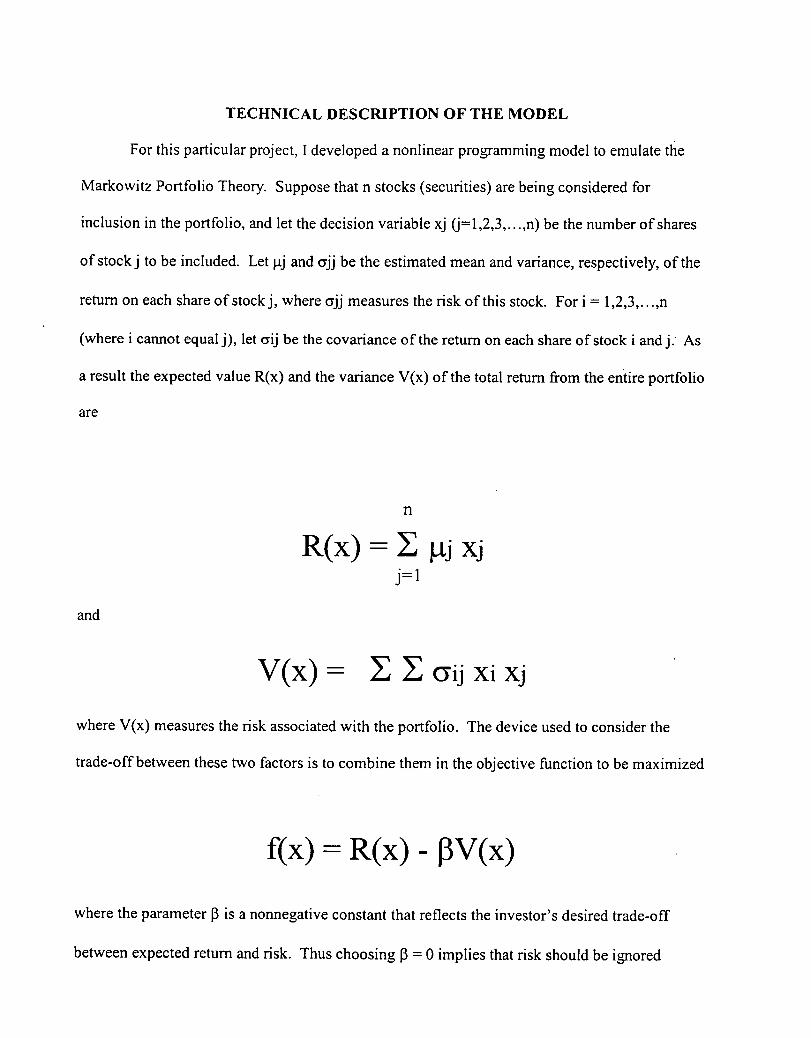
TECHNICAL DESCRIPTION OF THE MODEL
For this particular project, I developed a nonlinear programming model to emulate the
Markowitz Portfolio Theory. Suppose that n stocks (securities) are being considered for
inclusion in the portfolio, and let the decision variable xj 0=1,2,3,. . .,n) be the number of shares
of stock j to be included. Let .tj and ojj be the estimated mean and variance, respectively, of the
return on each share of stock j, where qJ measures the risk of this stock. For 1 1,2,3,..
(where i cannot equal j), let cij be the covariance of the return on each share of stock i and j.. As
a result the expected value R(x) and the variance V(x) of the total return from the entire portfolio
are
Ic
R(x) = tjXj J=1
and
V(X) = ijXiXj
where V(x) measures the risk associated with the portfolio. The device used to consider the
trade-off between these two factors is to combine them in the objective function to be maximized
f(x) = R(x) - 13V(x)
where the parameter 3 is a nonnegative constant that reflects the investor's desired trade-off
between expected return and risk. Thus choosing 0 = 0 implies that risk should be ignored
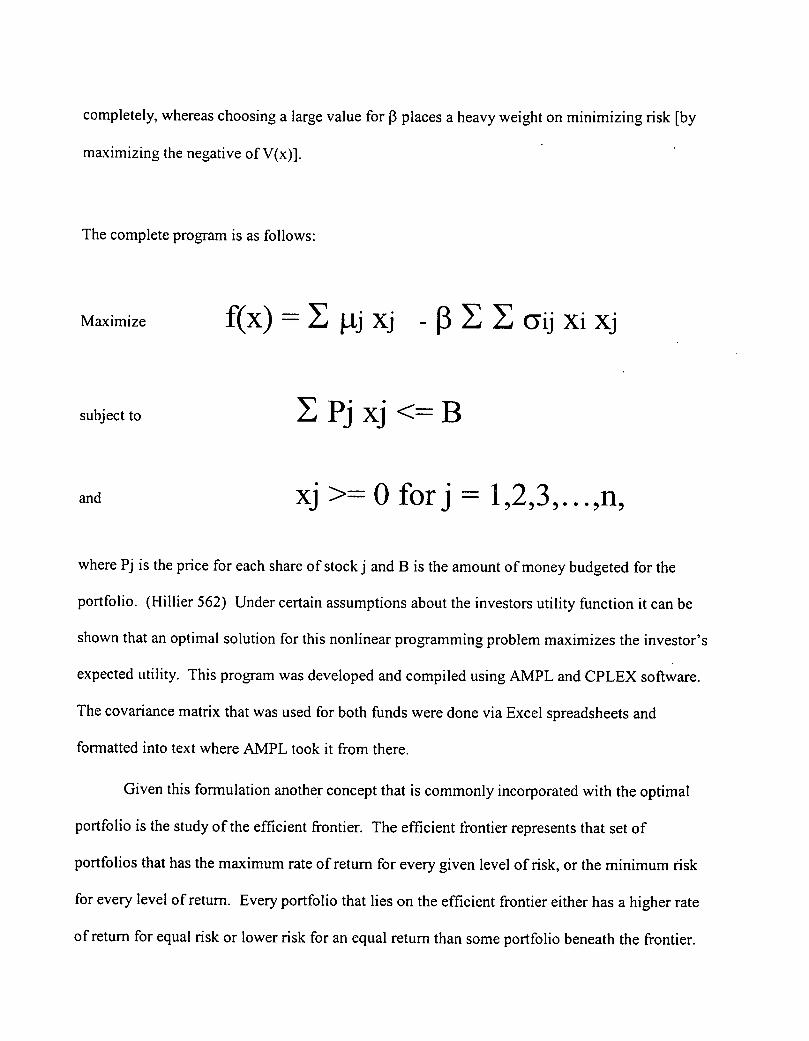
completely, whereas choosing a large value for P places a heavy weight on minimizing risk [by
maximizing the negative of V(x)].
The complete program is as follows:
Maximize f(x) = tj Xi - (Yij Xi Xj
subject to Pi Xj < B
and xj >= 0 forj = 1,2,3, ... ,n,
where Pj is the price for each share of stock j and B is the amount of money budgeted for the
portfolio. (Hillier 562) Under certain assumptions about the investors utility function it can be
shown that an optimal solution for this nonlinear programming problem maximizes the investor's
expected utility. This program was developed and compiled using AMPL and CPLEX software.
The covariance matrix that was used for both funds were done via Excel spreadsheets and
formatted into text where AMPL took it from there.
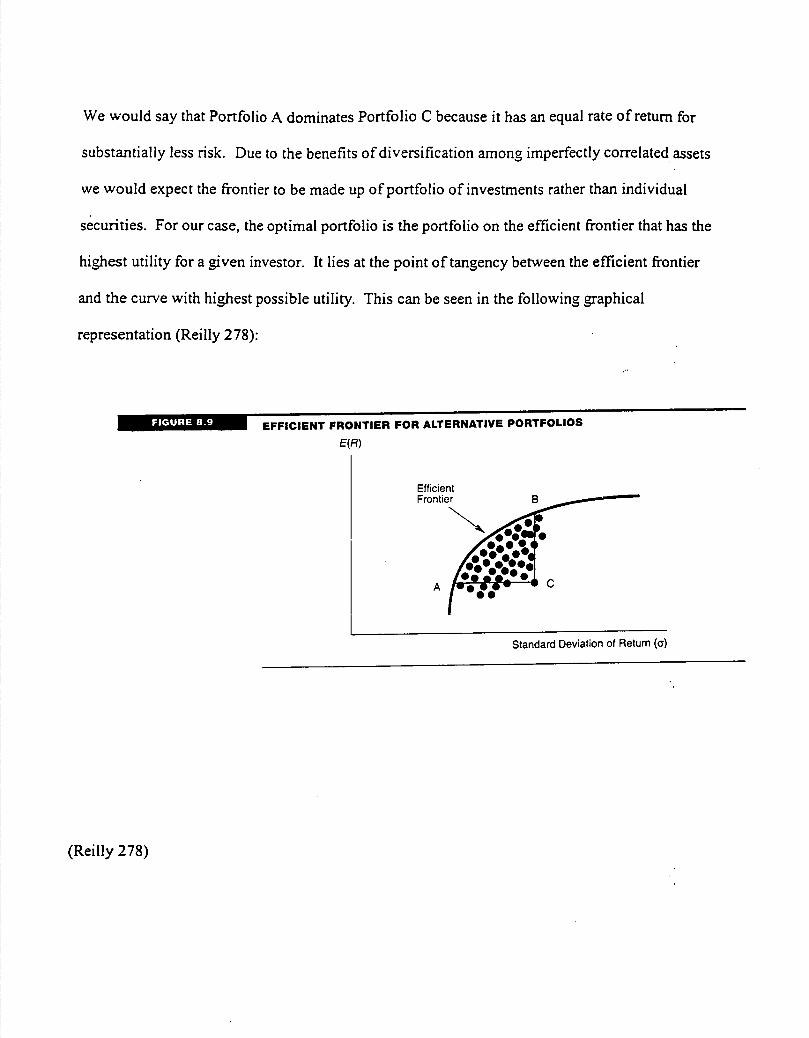
Given this formulation another concept that is commonly incorporated with the optimal
portfolio is the study of the efficient frontier. The efficient frontier represents that set of
portfolios that has the maximum rate of return for every given level of risk, or the minimum risk
for every level of return. Every portfolio that lies on the efficient frontier either has a higher rate
of return for equal risk or lower risk for an equal return than some portfolio beneath the frontier.
Efficient FrontiE
A
We would say that Portfolio A dominates Portfolio C because it has an equal rate of return for
substantially less risk. Due to the benefits of diversification among imperfectly correlated assets
we would expect the frontier to be made up of portfolio of investments rather than individual
securities. For our case, the optimal portfolio is the portfolio on the efficient frontier that has the
highest utility for a given investor. It lies at the point of tangency between the efficient frontier
and the curve with highest possible utility. This can be seen in the following graphical
representation (Reilly 278):
[L'J l EFFICIENT FRONTIER FOR ALTERNATIVE PORTFOLIOS
E(R)
Standard Deviation of Return (a)
(Reilly 278)
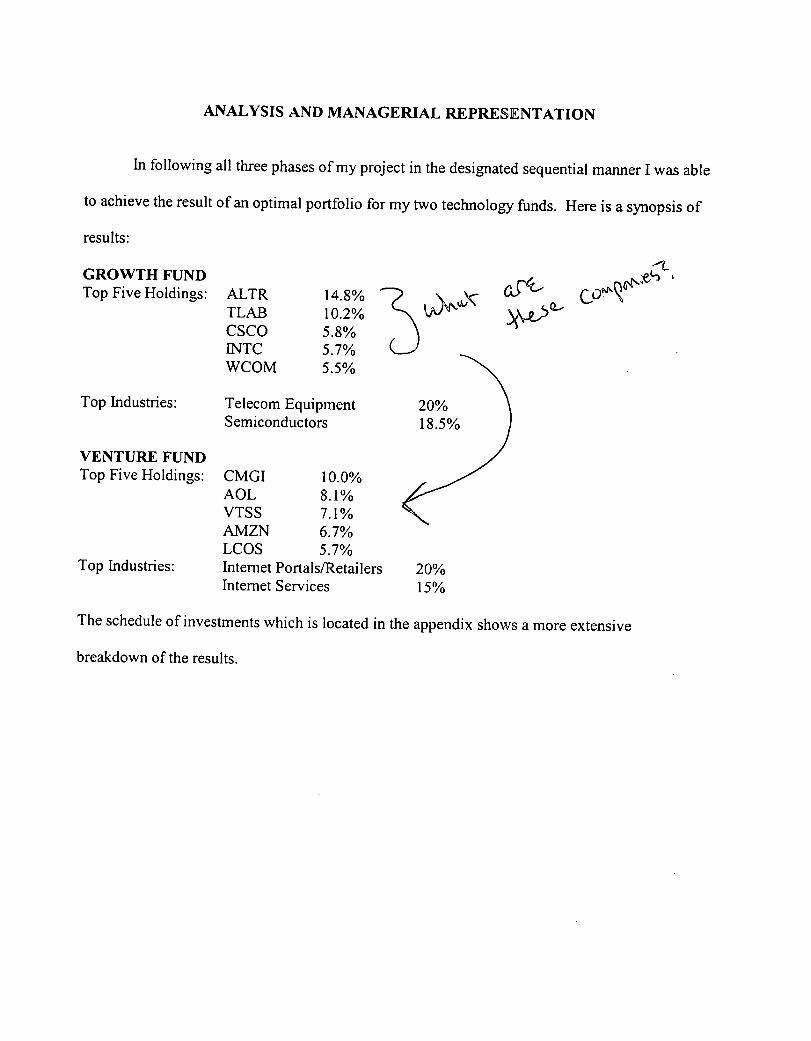
ANALYSIS AND MANAGERIAL REPRESENTATION
In following all three phases of my project in the designated sequential manner I was able
to achieve the result of an optimal portfolio for my two technology funds. Here is a synopsis of
results:
GROWTH FUND Top Five Holdings: ALTR
TLAB cScO 1NTC WCOM
14.8% R\ )\A)c
10.2% 5.8% 5.7% 5.5%
(LN CON
Top Industries: Telecom Equipment 20% Semiconductors 18.5%
VENTURE FUND Top Five Holdings: CMGI 10.0%
AOL 8.1% VTSS 7.1% AMZN 6.7% LCOS 5.7%
Top Industries: Internet Portals/Retailers 20% Internet Services 15%
The schedule of investments which is located in the appendix shows a more extensive
breakdown of the results.

CONCLUSION
In achieving this project the formulation of these two funds did an extremely good job of
quantifying security analysis with modern day portfolio management. This would be a very
good way to begin a basic framework by which to determine the allocation of shares in a very
large portfolio. However, there are some very important drawbacks that money managers must
consider when engaging in this type of modeling. The first obstacle is that the model is entirely &_0 OA
scientific and there is no room for subjective factors. An example of this would be the current
situation with Microsoft. Microsoft is currently in anti-trust litigations with a very likely
outcome of being broken into two companies one whichocus on the operating system and the
other on software. Since this announcement the shares have plummeted almost 25%. Money
managers must make decisions how to react to this situation and must adjust their portfolios
accordingly. Sell all now or buy with the hope of it coming to a more fully valued price in the
next six to twelve months. Unfortunately, the programming model cannot quantify these type of
factors. The other obstacle that money mangers are likely to come across is that rebalancing the
portfolio very often with this programming model might require unnecessary liquidation of
shares and as a result a very high portfolio turnover. This is not to mention that transactions cost
will probably go out the roof.
LOA
' (_I '
(Q-
I&AJ1fs lrm-^C-
APPENDIX
Business Models
Copy of Semester Portfolio Tracking (CNBC.com )
Schedule of Investments
Program Printouts
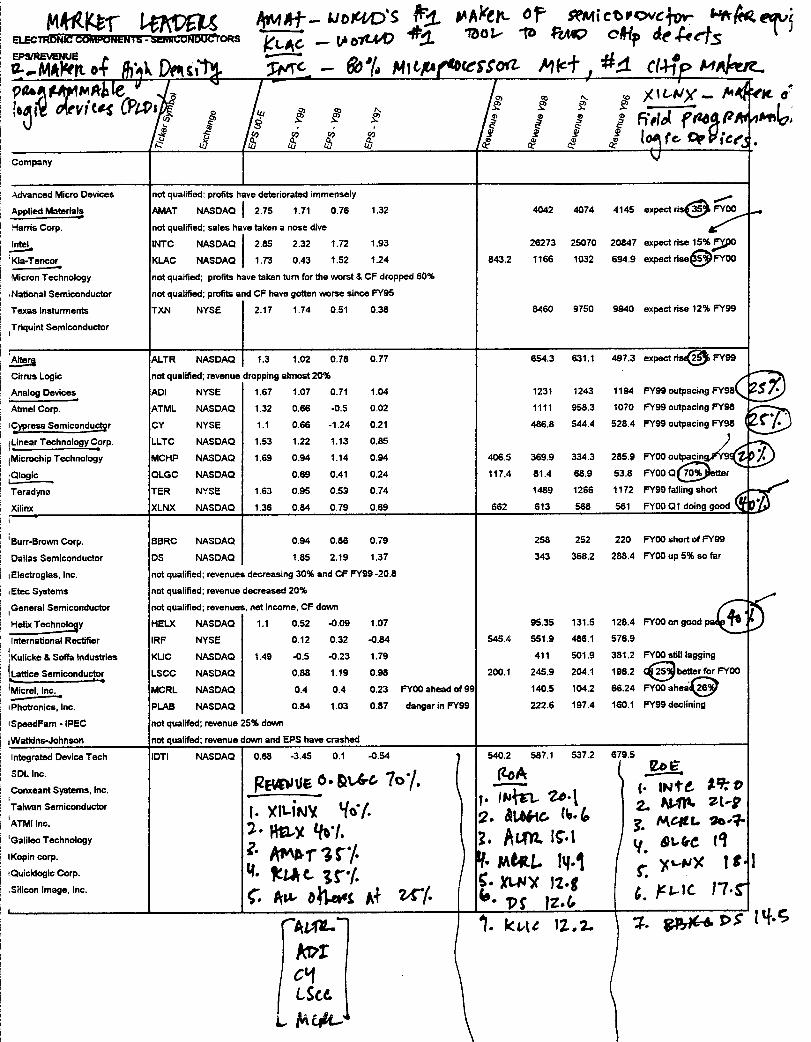
Mk1Qi 4nm ELECTRONIC OMPUNeNT5 - wilUDN1U'lORS
EPS/REVENUE
!..MkJ'e?to flkDqct alevitat (Pat
'j __ _tb1t44)
lNr' - W1.0 MttPi
POOL O ceMicbv0vc4o- S'wj3 1ot- lb RMP 044 d€'f
DCCO'i itIf+ C14-rp M4ie?J_
cc /U-Wy_. /"44€a o# a a a a
:F7
& Lofrc 'Cg'
Company
Advanced Micro Devices not qualified; profits have deteriorated immensely
Applied Materials _____ AMAT NASDAQ 2.75 1.71 0.76 1.32 4042 4074 4145 expectris FY00-,
Harris Corp. not qualified; sales have taken a nose dive
INTO NASDAQ2.85 2.32 1.72 1.93 26273 25070 20847 expect rise 15%90
KIa-Tencor KLAC NASDAQ I 1.73 0.43 1.52 1.24 843.2 1166 1032 894.9 expect rlse&FYOO
Micron Technology not qualfied; profits have taken turn for the worst & OF dropped 60%
National Semiconductor not qualified; profits and OF have gotten worse since FY95
Texas Insturments TXN NYSE 2.17 1.74 0.51 0.38 8460 9750 9940 expect rise 12% FY99
Triquint Semiconductor
ALTR NASDAQ 1.3 1.02 0.78 0.77 654.3 631.1 497.3 expect rist(3s FY99
Cirrus Logic not qualified; revenue dropping almost 20%
Analog Device ADI NYSE 1.67 1.07 0.71 1.04 1231 1243 1194 FY99 outpacing FY98( 2: IDX Atmel Corp. ATML NASDAQ 1.32 0.66 -0.5 0.02 1111 958.3 1070 FY99 outpacing FY98
Cypress Semic dur CY NYSE 1.1 0.66 -1.24 0.21 486.8 544.4 528.4 FYgg outpacing FY98
Linear My LLTC NASDAQ 1.53 1.22 1.13 0.85 1
Microchip Technology MCNP NASDAQ 1.69 0.94 1.14 0.94 406.5 369.9 334.3 285.9 FY00outpacina'9(J? ) Ologic QLGC NASDAQ 0.69 0.41 0.24 117.4 81.4 68.9 53.8 FY00 Qetter
Teradyno TER NYSE 1.63 0.95 0.53 0.74 1489 1266 1172 FY9Ofalllng short
Xilinx XLNX NASDAQ 1.36 0.84 0.79 0.69 662 613 568 561 FYOOQ1 doing good (
Burr-Brown Corp. BBRC NASDAQ 0.94 0.86 0.79 258 252 220 FY00 short of FY99
Dallas Semiconductor OS NASDAQ 1.85 2.19 1.37 343 368.2 288.4 FYOO up 5% so far
Electroglas, Inc. not qualified; revenues decreasing 30% and OF FY99 -20.8
Etec Systems not qualified; revenue decreased 20%
General Semiconductor not qualified; revenues, net income, OF down
41. 5 Techoly MELX NASDAQ 1.1 0.52 -0.09 1.07 95.35 131.5 128.4 FY000n good pa
International Rectifier IRF NYSE 0.12 0.32 -0.84 545.4 551.9 486.1 576.9
Kulicke & Soffa Industries KLIC NASDAQ 1.49 -0.5 -0.23 1.79 411 501.9 381.2 FY00 still lagging
Lattice Semiconductor LSCC NASDAQ 0.88 1.19 0.98 200.1 245.9 204.1 198.2 COC253 better for FY00
'Micrel, Inc. MCRL NASDAQ 0.4 0.4 0.23 FY00 ahead of99 140.5 104.2 66.24 FY00 ahea
Photronics, Inc. PLAB NASDAQ 0.84 1.03 0.87 danger in FY99 222.6 197.4 160.1 FY99 declining
ISpeedFam - IPEC not qualifed; revenue 25% down
Watkins-Johnson not qualifed; revenue down and EPS have crashed
Integrated Device Tech loll NASDAQ 0.68 -3.45 0.1 -0.54 540.2 587.1 537.2 679.5
SDL Inc.RE(W tIE0 he lo 7 iWv 1N1 Conxeant Systems, Inc.
. o.t L(&f &thic. N. ATMI Inc. }L Lt...I. I
2. . MCItC. b4' 'Galileo Technology • ALMc• &l6e i't IKopincorp. " #MA1
Mt4tL. !q.j.
cs-wX It I QuicldoglcCorp.
Silicon Image, Inc.ç vcf.
'• ...
rAL-1 1. ktc )2..2.. •'' !q.c
Ic,.1
I Lke
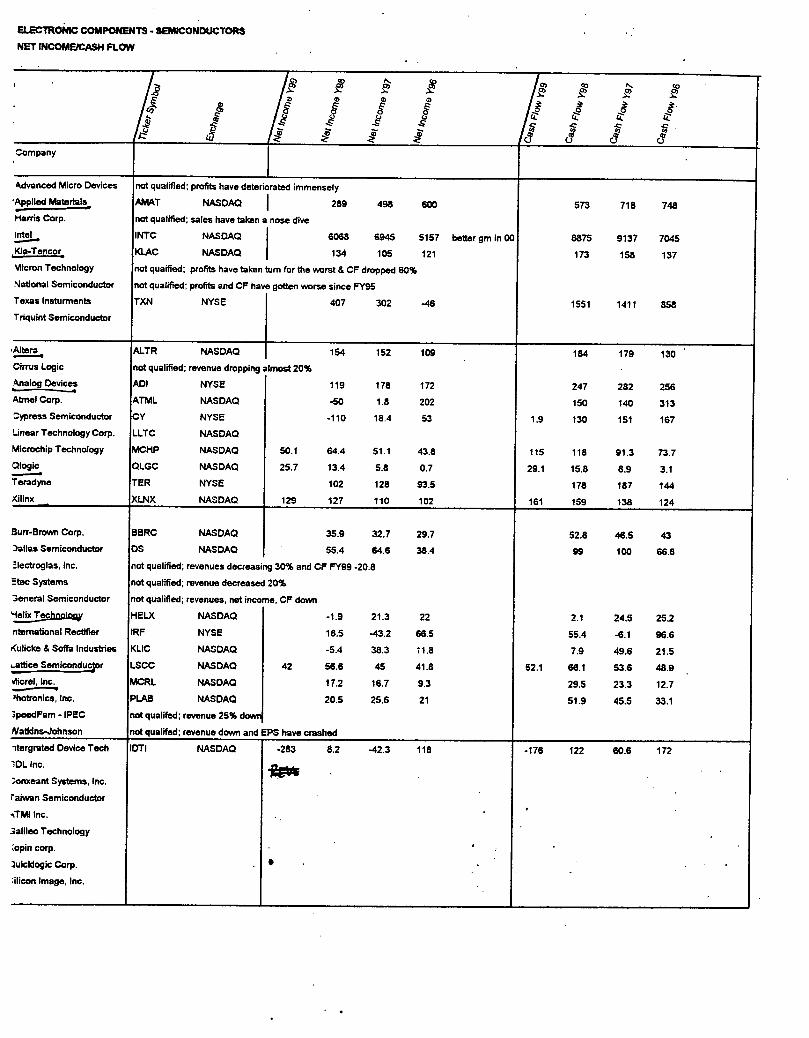
ELECTRONIC COMPONENTS- SEMICONDUCTORS
NET INCOMEJCASH PLOW
/I.) Co 10
"115Z -01Z
/ I 18
I 5 I
- Company
Advanced Micro Devices not qualified; profits have deteriorated immensely
Applied Materials AMAT NASDAQ 289 498 600 573 718 748 Hams Corp. not qualified; sales have taken a nose dive
Intel - INTC NASDAQ 6068 6945 5157 better gm in 00 8875 9137 7045 Kla-Tencor KLAC NASDAQ 134 105 121 173 158 137 Micron Technology not qusifled: profits have taken turn for the worst & CF dropped 60%
National Semiconductor not qualified; profits and CF have gotten worse since FY95
Texas lnsturrnents TXN NYSE 407 302 -46 1551 1411 858 Tnquint Semiconductor
Alters ALTR NASDAQ 154 152 109 184 179 130 Cirrus Logic not qualified; revenue dropping almost 20%
Analog Devices AOl NYSE 119 178 172 247 282 256 AteeI Corp. ATML NASDAQ -50 1.8 202 150 140 313
ypresa Semiconductor CY NYSE -110 18.4 53 1.9 130 151 167 Unear Technology Corp. LLTC NASDAQ
Microchip Technology MCHP NASDAQ 50.1 64.4 51.1 43.8 115 118 91.3 73.7 Ologic QLGC NASDAQ 25.7 13.4 5.8 0.7 29.1 15.8 8.9 3.1 Teradyne TER NYSE 102 128 93.5 178 187 144 Xillnx - XLNX NASDAQ 129 127 110 102 161 159 138 124
Burr-Brown Corp. BBRC NASDAQ 35.9 32.7 29.7 52.8 46.5 43 Dallas Semiconductor OS NASDAQ 55.4 64.6 38.4 99 100 66.8 lectroglas, Inc. not qualified; revenues decreasing 30% and CF FY99 -20.8
!tec Systems not qualified; revenue decreased 20%
eneral Semiconductor not qualified; revenues, net income, CF down
HELX NASDAQ -1.9 21.3 22 2.1 24.5 25.2 ntematfonal Rectifier IRF NYSE 165 -43.2 66.5 55.4 -6.1 96.6 (ulicke & Soft Industries KLIC NASDAQ -5.4 38.3 11.8 7.9 49.6 21.5 .athce Semlconduor LSCC NASDAQ 42 56.6 45 41.8 52.1 66.1 53.6 48.9 4icrel, Inc. MCRL NASDAQ 17.2 16.7 9.3 29.5 23.3 12.7 3hotronics, Inc. PLAB NASDAQ 20.5 25.6 21 51.9 45.5 33.1 peedFam - IPEC not qualifed; revenue 25% dow
Natldns-Johnson not qualifed; revenue down and EPS have crashed
itergrated Device Tech lOTI NASDAQ -283 8.2 -42.3 118 -176 122 60.6 172 ,DL Inc.
onxeant Systems, Inc.
raiwan Semiconductor
TMl Inc.
3allleo Technology
opincorp. .
ulcldogic Corp. . . .
:ilicon Image Inc.
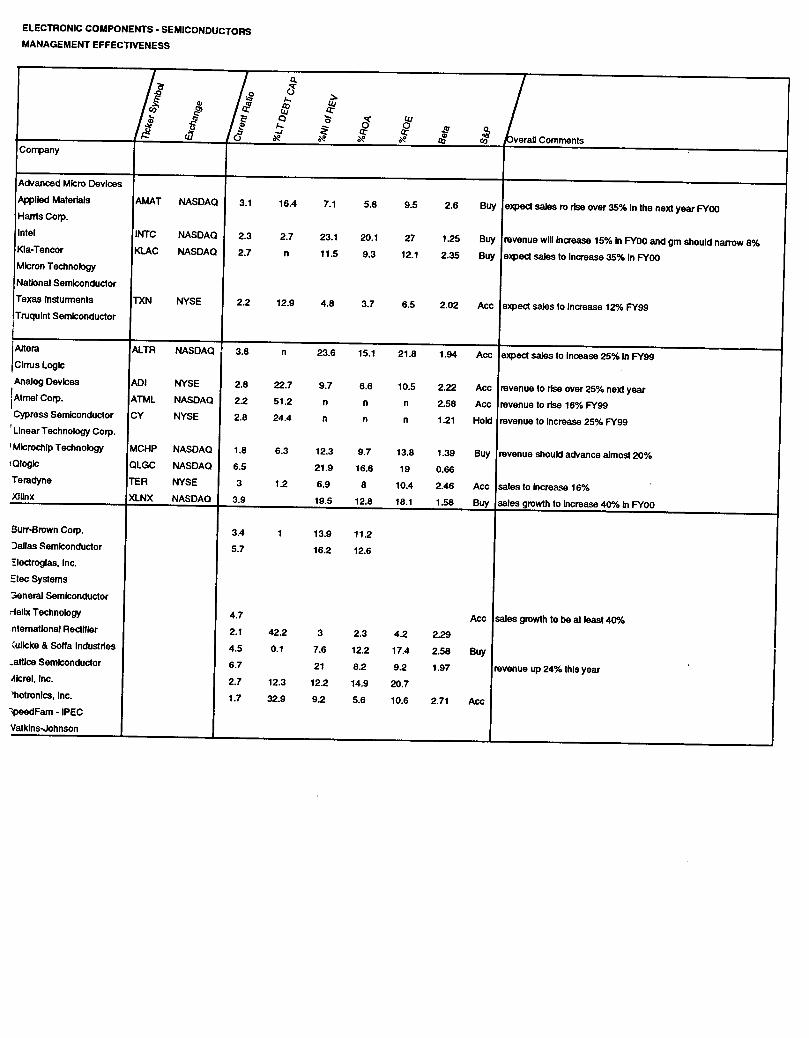
ELECTRONIC COMPONENTS - SEMICONDUCTORS MANAGEMENT EFFECTIVENESS
a. / /0
C j c' 113Z 1 Z./1 2 0 e a.. / ( 0 0 eran Comments
Company
Advanced Micro Devices
Applied Materials AMAT NASDAQ 3.1 16.4 7.1 5.8 9.5 2.6 Buy expect sales ro rise over 35% In the next year FY00 Harris Corp.
Intel INTC NASDAQ 2.3 2.7 23.1 20.1 27 1.25 Buy revenue will Increase 15% In FY00 and gm should narrow 8% KIa-Tencor KLAC NASDAQ 2.7 n 11.5 9.3 12.1 2.35 Buy expect sales to Increase 35% In FY00 Micron Technology
National Semiconductor
Texas Insturmenls TXN NYSE 22 12.9 4.8 3.7 6.5 2.02 Acc expect sales to Increase 12% FY99 Truqulnt Semiconductor
Altera ALTR NASDAQ 3.8 n 23.6 15.1 21.8 1.94 Acc expect sales to Incease 25% In FY99 Cirrus Logic
Analog Devices AOl NYSE 2.8 22.7 9.7 6.6 10.5 2.22 Acc revenue to rise over 25% next year IAtmel Corp. ATML NASDAQ 22 51.2 n n n 2.58 Acc revenue to rise 16% FY99 Cypress Semiconductor CY NYSE 2.8 24.4 n n n 1.21 Hold revenue to Increase 25% FY99 Linear Technology Corp.
'Microchip Technology MCHP NASDAQ 1.8 6.3 12.3 9.7 13.8 1.39 Buy revenue should advance almost 20% OlogIc OLGC NASDAQ 6.5 21.9 16.6 19 0.66 Teradyne TEA NYSE 3 12 6.9 8 10.4 2.46 Acc sales to Increase 16% XIIInX XLNX NASDAQ 3.9 19.5 12.8 18.1 1.58 Buy sales growth to Increase 401Y. In FY00
Burr-Brown Corp. 3.4 1 13.9 11.2 Dallas Semiconductor 5.7 16.2 12.6
lectroglas, Inc.
Etec Systems
3eneral Semiconductor
1eIIx Technology 4.7 Acc sales growth to be at least 40% .ntematlonaJ Rectifier 2.1 422 3 2.3 42 2.29 uIicke & Sofia Industries 4.5 0.1 7.6 12.2 17.4 2.58 Buy
_attice Semiconductor 6.7 21 8.2 9.2 1.97 revenue up 24% this year Aicrel, Inc. 2.7 12.3 12.2 14.9 20.7 Thotronics, Inc. 1.7 32.9 92 5.6 10.6 2.71 Acc peedFam - IPEC
Vatklns-Johnson
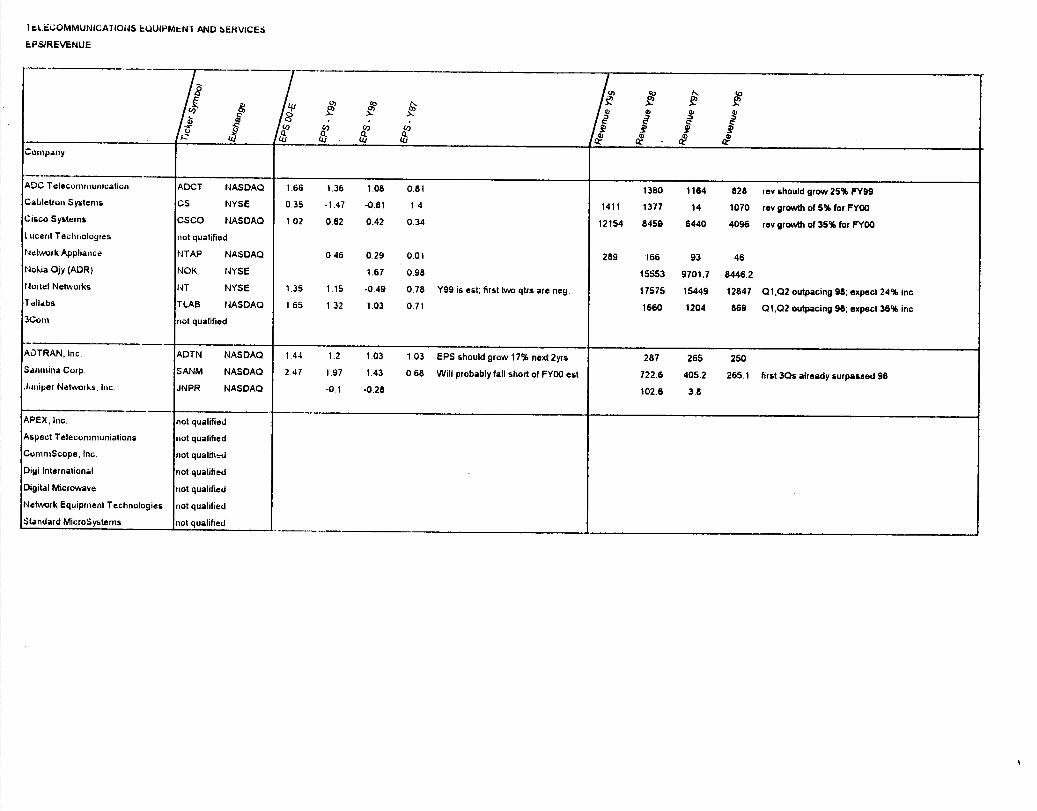
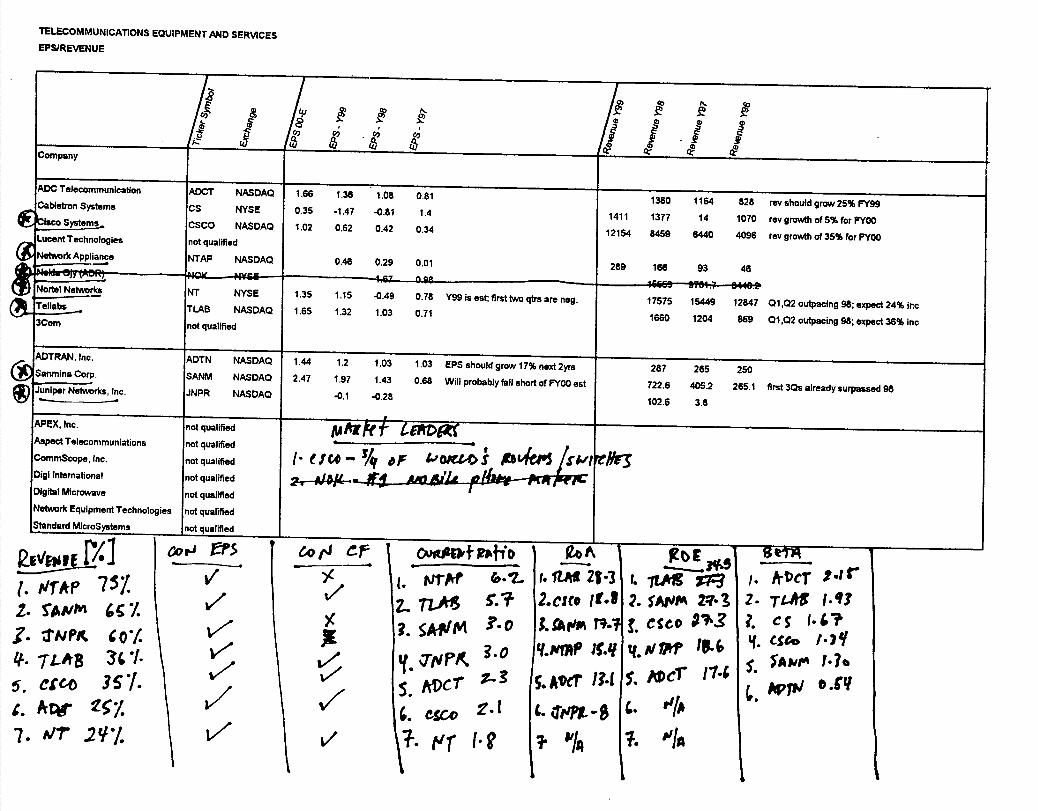
I rLiECOMMUNICATIONS EQUIPMN1 ANDbEHVICES
PS/REVENUE
qj
LU LU. LU LU -
Conrp.ny
ADC Telecommunication ADCT NASDAQ 1.66 1.36 1.08 0.81 1380 1164 628 rev should grow 25% FY99 Cabletron Systems CS NYSE 0.35 -1.47 -0.81 1 4 1411 1377 14 1070 rev growth of 5% for FY00 Cisco Systems CSCO NASDAQ 1.02 0.62 0.42 0.34 12154 8459 6440 4096 rev growth of 35% for FY00 I ucerit Technologies not qualified
Network Appliance NTAP NASDAQ 046 0.29 0.01 289 166 93 46 Nokia Ojy (ADR) NOK NYSE 1.67 0.98 15553 9701.7 8446.2 tJoitel Networks NT NYSE 1.35 1.15 -0.49 0.78 Y99 is est; first two qtrs are neg. 17575 15449 12847 01.02 outpacing 98; expect 24% inc Telkabs Tl.AB NASDAQ 1.65 1.32 1.03 0.71 1660 1204 869 01,02 outpacing 98; expect 36% inc 3Co111 not qualified
AOTRAN,lnc. ADTN NASDAQ 1.44 1.2 1.03 1.03 EPS should grow l7% next 2yrs 287 266 250 Sanurina Corp. SANM NASDAQ 2.47 1.97 1.43 068 Will probably tall short of FY00 ext 722.6 405.2 265.1 first 30s already surpassed 98 .i.iiriper Networks. Inc. JNPR NASDAQ -0.1 -0.28 102.6 3.8
APEX, Inc. not qualified
Aspect Telecomniuniations not qualified
ConimScope Inc. not qualified
Digi International not qualified
Digital Microwave not qualified
Network Equipment Technologies not qualified
Standard MicroSystems not qualified
1ELECOMMUNICATIQNS EQUIPMENT AND SERVICES
NET INCOME/CASH FLOW
M /1 1 1 1 I _____ a a a a Company
ADC Telecommunication ADCT NASDAQ 147 109 87.5 good increase of average $30M/y 212 159 121 increase oI$25M/yr Cabletron Systems CS NYSE -244 -126 222 164 130 -61.8 272 196 Cisco Systems csco NASDAQ 1350 1049 913 consistent increase 1677 1261 1046 consistent increase Lucent Technologies imot qualified
Netwoik Appliance NTAP tJASDAQ 36 21 0.3 6.6 438 265 3 7.9 Nokia Ojy (ADR) NOK NYSE 2043.1 1154.1 700.9 Nmiitel Networks NT NYSE -0.5 829 623 9798 NI dropped heavily 1722 1358 1146 reliabs flAB NASDAQ 398 264 118 steady increase 454 311 151 steady increase in cash flow 3Cuiii hot qualified
ADTRAN, Inc. ADTN NASDAQ 40.3 40.2 39.8 49.3 476 44.7 Sanmuna Corp. SANM NASDAQ 68.2 40.9 28.1 steady increase 95.4 53.8 36.2 steady increase Juniper Networks Inc JNPR NASDAQ -9 -31
APEX, Inc. not qualified
Aspect Telecorninuniations not qualified
ConirnScope. Inc. not qualified
Digi lnte,nationJ not qualified
Digital Microwave not qualified
Nekvvrk Equipment Technologies not qualified
Standard Microsystems not qualified
TELECOMMU11CATION5 EQUIPMN I AND SERVICES
MANAGEMENT EFFECTIVENESS
- /,.i
I Q w 6
e
ADC Telecommunication
Catiletron Systems
Cisco Systems
Lucent Technologies
t4erork Appliance
Nokia Oy (ADR)
Noitel Networks
TeUab
3Com
N, Inc.
a Corp.
Netvvoiki, Inc
APEX, Inc.
Aspect Teleiommuniatjons
ConimScope, Inc.
Digi International
Digital Microwave
Neiwuik Equipment Technologies
ADCT NASDAQ 2 3 0.3 10.6 13.1 17.6 2.15 Buy rev 25% inc FY99 sales inc 20% FY00: epa inc 20% next 2 yis CS NYSE I 8 n n n n 1.67 CSCO NASDAQ 2.1 16 18.8 23.7 1.32 Buy much heavier comp in mkt but much greater oportunity; industry growth or 30-50% for several not qualified
years
NTAP NASDAQ 62 0 12.3 15.4 18.6 n Hold sales inc 74%;data storage systems for networking NOK NYSE 1 64 36.8 36.8 #1 mobile phone maker I-IT NYSE I 8 12.4 n n n n Buy earning o grow 20% for next several years FLAB NASDAQ 5.7 0.2 24 28.3 34.5 1.93 Hold sales to inc 36% for 995 31% for 00, earning grow 25% for next two years riot qualified
ADTN NASDAQ 98 17.6 14.1 13.8 16.2 0.54 SANM NASDAQ
13 1.6 9.4 17.7 27.3 1.3 Buy revenue to advance 65% for 4Q99 and 50% for Y00
JNPR NASDAQ 2. -8 customer include MCI Worlcom and Erricaon
riot qualified
not qualified
not qualified
not qualified
not qualified
not qualified
Helix Technology develops cryogenic and vacuum technology used in manufacturing electronic
components. The company's primary customers (such as Applied Materials, with 20% of sales)
manufacture semiconductors, advanced information displays, and products used in optical and magnetic
data storage. Helix Technology's flagship line, On-Board, features a cryogenic vacuum pumping system
that employs a built-in microprocessor to provide online monitoring and diagnostics. The company
maintains customer support centers worldwide and offers around-the-clock support resources. Helix and
Ulvac of Japan own a joint venture that makes cryogenic vacuum pumps, primarily for use by Ulvac.
International Rectifier (IR) makes electricity behave. The company is a major manufacturer of power
semiconductors - including control integrated circuits, diodes, rectifiers, and power MOSFETs (motel oxide
semiconductor field effect transistors) - which switch and condition electricity. Its HEXFET power MOSFET switches are the market leader in that segment. fR's products are used in appliances, autos, computers,
communications products, and lighting. Its customers include Compaq, Ford, IBM, Lucent, and Sony. IR
has production facilities in China, India, Italy, Mexico, the UK, and the US. More than ha)f of its sales are to customers in Asia and Europe.
Kulicke and Saffa Industries (K&S) has assembled a valuable product line. The company is the worlds
largest producer of semiconductor assembly equipment. Its primary product is wire bonders, which use very
fine wire to connect integrated circuit chips to their package leads, thereby completing the semiconductor's
electrical circuit. K&S subsidiaries make dicing saws (which cut silicon wafers Into individual dies) and
other assembly equipment, bonding wire, and packeging materials. K&S sells Its products to
semiconductor manufacturers such as Intel, Motorola, and AMD. The company has manufacturing plants In
Israel, Singapore, Switzerland, and the US; it generates 80% of its sales outside the US
Lattice Semiconductor lets electronics manufacturers get with the program. The company makes
programmable logic devices (PLDs), logic integrated circuits that manufacturers can custom-program to
perform specific functions. Lattice is one of the world's top suppliers of in-system PLDs, which can be configured and reconfigured even after be ing ffixed to circuit board. It also sells the software needed to customize its chips. Lattice's devices are used in computing, communications, industrial, and military
electronics. The company focuses on design and testing, outsourcing its manufacturing to factories in Asia.
Overseas customers account for half of Lattice's sales.
* Micrel has a macro line of microcircuits. The company makes more than 1,000 varieties of high.
performance standard integrated circuits (ICs, more than two-thirds of sales), including analog, digital, and
mixed-signal versions. The company's ICs are used primarily for power management In automotive,
communications, computer, and industrial electronics. Micrel also designs and manufactures custom IC.
(almost a third of sales) for customers in communications, consumer, and military markets. The company
operates factories in California and sales offices in South Korea, Taiwan, the UK, and the US. Customers
outside the US account for almost half of sales.
Photronics' place in the semiconductor realm is crystal clear. The firm makes high-precision quartz
photomaske,a key element in the construction of semiconductors and integrated circuits. Embedded
within photomaske are microscopic images of electronic circuits, which are used as a blueprint to transfer
circuit patterns onto the semiconductor wafers. Photronics' Beta Squared subsidiary sells semiconductor
wafer etching systems and refurbished semiconductor manufacturing equipment. Texas Instruments is
Photronics's largest customer, accounting for almost one-fifth of the sales. Photronics is acquiring rival
Align-Rite in a combination that will create the world's largest independent maker of photomasks.
Integrated Device Technology (lD'l') is a true performer. The company's high-performance semiconductor
products and modules are found in computers, peripherals, and communications and networking devices.
About 70% of sales are from communications and high-performance logic components such as embedded
RISC microprocessors; specialty memory, logic, and clock management circuits; and networking devices.
lOT also makes static random-access memories (SRAMs). The company has sold its WinChip x88
microprocessor operations, and is using development alliances to boost its SRAM line. Nearly two-thirds of lOT's sales are to customers in the US.
rELEc0MMuNIcAI IONS EQUIPMENT AND SERViCES
Tellabs Tellabs is no dog. The company's equipment is used around the world to transmit data, video, and voice
signals. Its TITAN digital close-connect system (about 60% of sales) helps connect incoming and outgoing
lines. The company also makes the CABLESPAN universal telephony distribution system, which lets cable
systerna transmit voice, video, and data. Outside North America, Tellabs offers the MartisDXX access and
tialispoil network system. Customers Include phone companies, cable operators, corporations, and
government agencies. Baby Bells account for nearly a third of sales; foreign customers account for another
Juniper Networks Juniper Networks hopes its networking products will send an evergreen cash flow its way. The company
makes M40 and M20 Internet backbone routers. The M40 Internet backbone router contains an oversized
piocessor for handling high interface speeds and a redundant cooling system that protects against
individual Ian failure. Both products run using the company's JUNOS network traffic management software
Juniper Networks, which outsources all of its manufacturing to Solectron, sells its products directly and
through OEMs. Customers include Ericsson and MCI WorldCom. Kleiner Perkins Caufleld & Byers owns
about 21% of the company.
ADTRAN AUTRAN helps telephone companies send fast signals over slow lines. Its inventory includes more than 500
high-speed digital transmission products for the transmission of digital signals (used in Internet access,
iiiodein phone equipment, and computer networks) over existing copper lines. ADTRAN equipment is
compatible with popular high-speed digital transmission formats. Local phone companies contribute about
60% of ADTRAN's revenues; half of that is from the regional Bell operating companies. ADTRAN also
customizes its products for private-label distribution and for manufacturers to integrate into their own
systems. Co-founders Mark Smith (CEO) and Lonnie McMillian (SVP) own 32% and 18%, respectively, of
ADT RAN.
Sanriiina Sanniina's board game doesn't involve a spinner or dice. The company is a contract manufacturer of high-
nd electronic components, including printed circuit board assemblies and backplane assemblies, circuit
bucids designed to plug into other boards and cables. Among the company's customers are equipment
niariufactureis in the telecommunications (about 50% of sales), computer, data communications, industrial,
.nid medical instrumentation markets. Telecom equipment maker DSC Communications (now part of
AIc4el) and network haidwsro company Cisco Systems account for nearly a third of Sanmina's sales.
TtLECOMMUNICA1IONS EQUIPMENT AND SERVICES
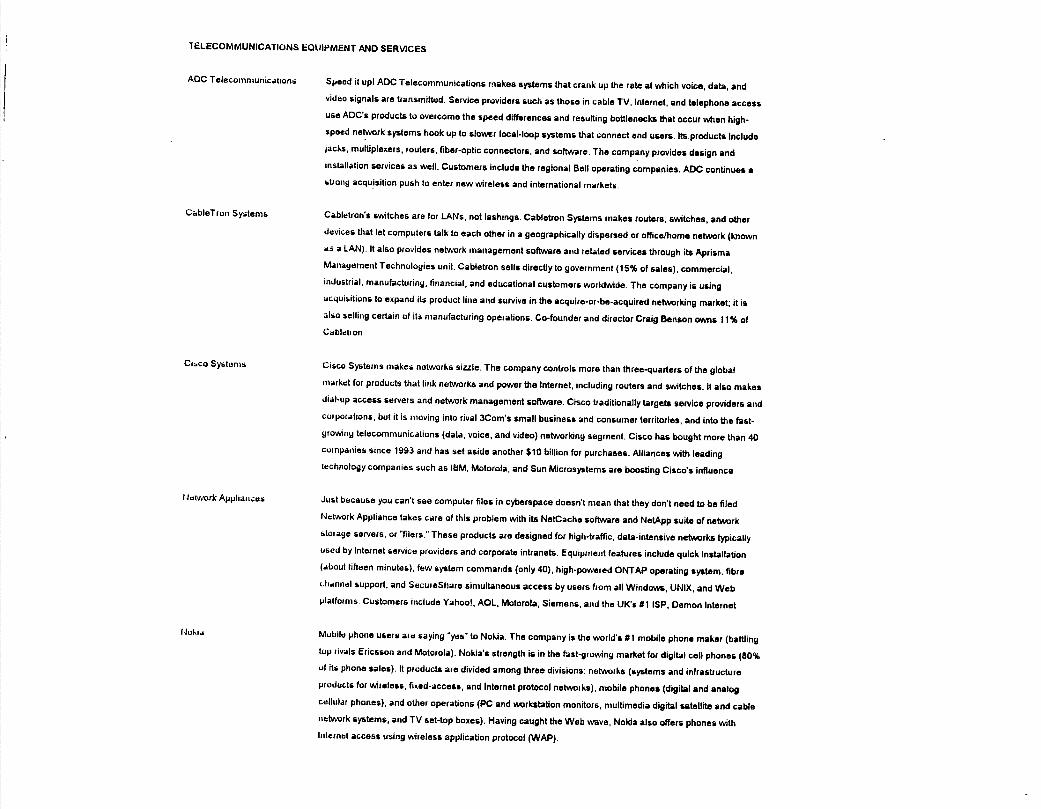
ADC Telecommunications Speed it upi ADC Telecommunications makes systems that crank up the rate at which voice, data, and
video signals are transmitted. Service providers such as those in cable TV, Internet, and telephone access
use ADC's products to overcome the speed differences and resulting bottlenecks that occur when high-
speed network systems hookup to slower local-loop systems that connect end users. Its products Include
lacks, multiplexers, routers, fiber-optic connectors, and software. The company provides design and
installation services as Well. Customers include the regional Bell operating companies. ADC continues a
strong acquisition push to enter new wireless and international markets.
Cablelron Systems Cabletron's switches are for LANs, not lashings. Cabletron Systems makes routers, switches, and other
devices that let computers talk to each other in a geographically dispersed or offic&home network (known
as a LAN). It also provides network management software and related services through its Aprisma
Management Technologies unit. Cabletron sells directly to government (15% of sales), commercial,
industrial, manufacturing, financial, and educational customers worldwide. The company is using
acquisitions to expand its product line and survive in the acquire-or-be-acquired networking market; it is
also selling certain of its manufacturing operations. Co-founder and director Craig Benson owns 11% of
Cabletion
Cmco Systems Cisco Systems makes networks sizzle. The company controls more than three-quarters of the global
market for products that link networks and power the Internet, including routers and switches. It also makes
dial-up access servers and network management software. Cisco traditionally targets service providers and
cum poistions, but it is moving Into rival 3Com's small business and consumer territories, and into the fast-
growing telecommunications (data, voice, and video) networking segment. Cisco has bought more than 40
companies since 1993 and has set aside another $10 billion for purchases. Alliances with leading
technology companies such as I8M. Motorola, and Sun Microsystems are boosting Cisco's influence
Network Appliances Just because you can't see computer files in cyberspace doesn't mean that they don't need to be filed.
Network Appliance takes came of this problem with its NetCache software and Nel.App suite of network
storage servers, or "filers." These products are designed for high-traffic, data-intensive networks typically
used by Internet service providers and corporate intranets. Equipment features include quick installation
(about fifteen minutes), few system commands (only 40), high-powered ONTAP operating system, fibre
iiiamimiel support, and SecumeShare simultaneous access by users from all Windows, UNIX, and Web
platforms. Customers include Yahoo!, AOL, Motorola, Siemens, and the UK's 01 ISP, Demon Internet
ljoki,,m Mubile phone users are saying yes" to Nokia. The company is the world's #1 mobile phone maker (battling
top rivals Ericsson and Motorola). Nokia's strength is in the fast-growing market for digital cell phones (80%
ol its phone sales). It products are divided among three divisions: networks (systems and infrastructure
pioducta for win.tes, fixed-access, and Internet protocol networks), mobile phones (digital and analog
cellular phones), and other operations (PC and workstation monitors, multimedia digital satellite and cable
network systems, and TV set-top boxes). Having caught the Web wave, Nokia also offers phones with
liitcinet access using wireless application protocol (WAP).
5941 7081 9833
31169 24584 18109
18243 12321 7759 5298
3974 2938 2274 revenues to incraas 7468 6294 5035 revenue to gro(j
47061 42895 38420 revenue to Increase 1% 81667 78508 75947 revenue to increase 11% 3021 2494 2378 revenue to grow 17%
11726 9791 6598 7095 revenue (^
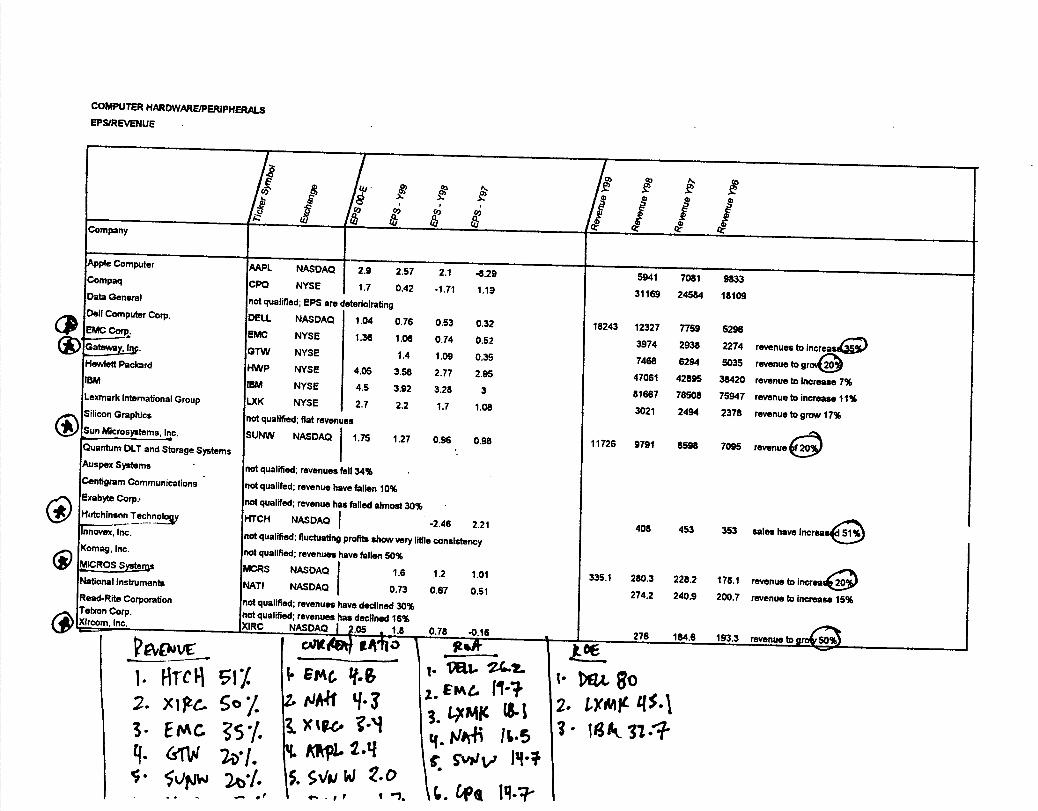
COMPUTER HARDWAREIPERIPHERAILS
EPSIREVENUE
! . !
L L
Apple Computer MPL NASDAQ 2.9 2.57 2.1 -8.29 Compaq CPO NYSE 1.7 0.42 -1.71 1.19
1
Data General not qualified; EPS are deterlolrating Dell Computer Corp. DELL NASDAQ 1.04 0.76 033 0.32
()
EMC Corp. EMC NYSE 1.36 1.06 0.74 0.52 Gayl. 01W NYSE 1.4 1.09 0.39 Hewlett Packa rd HWP NYSE 4.05 3.58 2.77 2.95 IBM IBM NYSE 4.5 3.92 3.28 3 Lexmark International Group LXX NYSE 2.7 2.2 1.7 1.08 Silicon Graphics not qualified; flat revenues
* h6crosystems. Inc. SUNW NASDAQ 1.75 1.27 0.96 0.98 ntum DLI and Storage Systems
rAus pex Systems not qualified; revenues fell 34% tigram Communications not qualifed; revenue have fallen 10%
()
Exabyte Corp.. not qualifed; revenue has felled almost 30% Hutchinson Tech HICK NASDAQ -2.46 2.21 nnovex, Inc. not qualified; fluctuating profits show very lithe consistency
Komag, Inc. not qualified; revenues have fallen 50% MCRS NASDAQ 1.6 1.2 1.01
National Instruments NAIl NASDAQ 0.73 0.67 0.51 Read-Rite Corporation not qualified; revenues have declined 30%
(3
Telxon Corp. not qualified; revenues has declined 16% ) Xlrcom, Inc. XIRC NASDAQ p.05 • 1.8 0.78 -0.16
cA)W1.R tito PFr
1 . HicI1 Ii
2. Xi?-:. So/ Z.NAf1 Lf.3(8.1
3 EM C .X'Vc "1'
Cf. &rw 2,• J S"?'V D!I'r.
^,V ^
2.q
t •1• (P• Cf I4
408 453 353 sates have lncreas
335.1 280.3 228.2 176.1 revenue toincres
274.2 240.9 200.7 revenue to increase 15%
I 276 184.6 193.3 revenue to
(
2. 1)(MIL L(S4
3 D3k.*
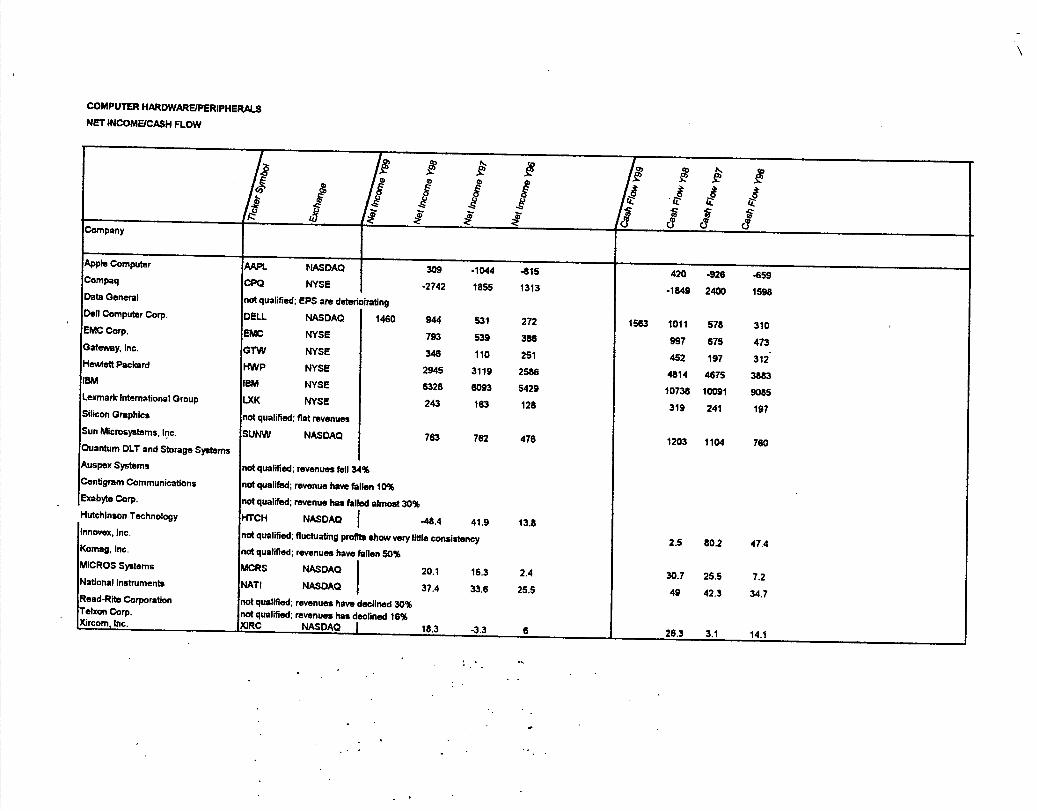
COMPUTER HARDWAREMERIPHERALS
NET INCOMEICASH FLOW
I t I i .. 6 Apple Computer AAPt. ILASDAQ 309 .1044 415 420 -926 -659 Compaq
CPO NYSE -2742 1855 1313 .1849 2400 1598 Data General not qualified; EPS are deterioiratlng Dell Computer Corp. DELL NASDAQ 1460 844 531 272 1563 1011 578 310 EMC Corp. EMC NYSE 793 539 386 997 675 473 Gateway, Inc. GYW NYSE 346 110 251 452 197 312 He4eftPacicard HWP NYSE 2945 3119 2586 4814 4575 3883 IBM IBM NYSE 6328 6093 5429 10738 10091 9085 Lexmark International Group LXK NYSE 243 163 128 Silicon Oriphic, not qualified; flat revenues
319 241 197
Sun Microsystems Inc. SUNW NASDAQ 763 762 476 Quantum DLT and Storage Systems
1203 1104 780
Auspex Systems not qualified; revenues fell 34%
Centigram Communications not qualifed; revenue have fallen 10% Exabyte Corp. not qualifed; revenue has failed almost 30% Hutchinson Technology HTCH NASDAQ f 48.4 41.9 13.8 Innovex, Inc. not qualified; fluctuating proflte show very lithe consistency Komag, Inc. not qualified; revenues have fallen 50%
2.5 80.2 474
MICROS Systems MCRS NASDAQ 20.1 16.3 2.4 National Instruments NATI NASOAQ 37.4 33.6 255
30.7 25.5 7.2
Read-Rite Corporation not qualified; revenues have declined 30%49 42.3 34.7
Telxon Corp. not qualified; revenues has declined 16% Xircom, Inc. XIRC NASDAQ I 18.3 -3.3 6 26.3 3.1 14.1
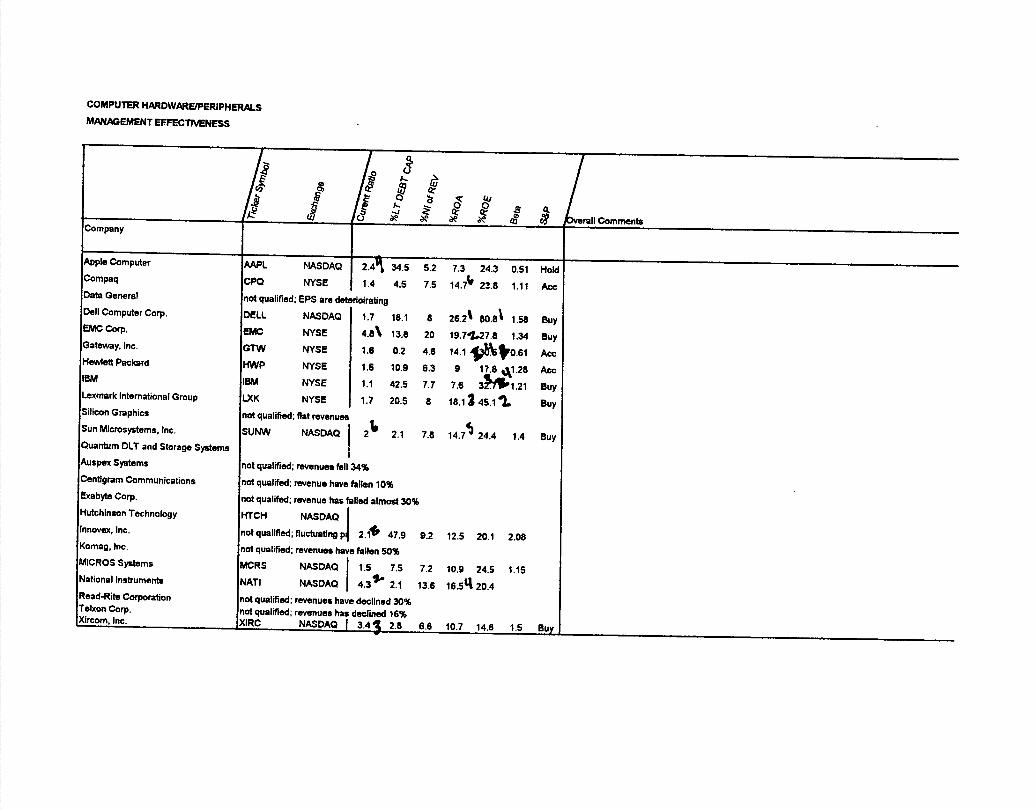
COMPUTER HARDWMEIPERIPHEPS
MANAGEMENT EFFECTIVENESS
'o
/ _IQJ I "- ° 0 0 •, I_____ e Comments
RAPL NASDAQ 2.4-1 34.5 52 7.3 24.3 0.51 Hold CPO NYSE 1.4 4.5 7.5 14.7k 23.8 1.11 A. not qualified; EPS are deterioirating DELL NASDAQ 1.7 18.1 8 26.2 % 60.8' 1.58 Buy EMC NYSE 4.8% 13.8 20 19.7'2.27.8 1.34 Buy GTW NYSE 1.6 0.2 46 14.1 0. $10.61 Acc HWP NYSE 1.6 10.9 6.3 9 17.8 1.28 Acc IBM NYSE 1.1 42.5 7.7 7.6 341.21 Buy LXK NYSE 1.7 20.5 8 18.1 3 45.1 '). Buy not qualified; flat revenues
SUNW NASDAQ J
2 2.1 7.8 14.7 24.4 1.4 Buy
not qualified; revenues fell 34%
not qualifed; revenue have fallen 10%
not qualifed; revenue has failed almost 30% HTCH NASDAQ
not qualified; fluctuating p 2.1$ 47.9 9.2 12.5 20.1 2.08 not qualified; revenues have fallen 50%
MCRS NASDAQ 1.5 7.5 7.2 10.9 24.5 1.15 NAIl NASDAQ 4.3 2.1 13.6 1e.54 20.4 not qualified; revenues have declined 30% not qualified; revenues has declined 16% XIRC NASDAQ I_3.4 _2.8 6.6 10.7 14.8 1.5 Buy
Computer
Data Genera!
Dell Computer Corp.
EMC Corp.
Gateway, Inc.
HeMett Packard
Lexmark international Group
Silicon Graphics
Sun Microsystems, Inc.
Quantum DLI and Storage Systems
Auspex Systems
Centigram Communications Exabyte Corp.
Hutchinson Technology
innovex, Inc.
Komag, Inc.
MICROS Systems
National Instruments
Read-Rite Corporation Teixon Corp. Xlrcom. Inc.
COMPUTER SOFTWARE
EPSIREVENUE.
4 I 4.! /,!, f ? ______u
Company
Adobe Systems
BMCSoftwareAbBE NASDAQ 4.55 2.9 1.55 2.52 894.4 911.9 786.6 ,-
revenues tolncrease 20
Computer AssociatesBMCS NASDAQ 1.95 1.47 0.76 0.77 1304 730.6 563.2 428.9 revenuestorjs not qualified; profit margins seem to be rather weak
Microsoft
701 jnc.
MSFT NASDAQ 1.56 1.42 0.83 0.66 19747 14484 11358 8671 NOVL NASDAQ 0.72 0.5 0.29 -0.22
revenues should advance
PeopleSoft, Inc.not qualified; profits are predicted to be relatively flat
1084 1007 1375 revenues should increase by 20%
Cadence Design Systems not qualified; revenue expected to decrease 20% Electronic Arts ERTS NASDAQ 2.19 1.15 1.19 0.86 1222 908.9 624.8 531.9 Rational Softwre RATL NASDAQ 0.65
1-0.44 -0.62
revenues torjs
VeritsSoftwa VRTS NASDAQ 0.5 0.23412 311 145 91.1 revenues ros(y,to yr
Avid Technology not qualified; profits are lagging210.9 121.1 36.09 revenues advancqtoyr
not qualified; profits are flat and CF declining tenry (Jack) & Associates_ JKHY NASDAQ 1.5 1.13 0.63
are, Inc. I-1NCS NASDAQ184.5 113.4 82.6 67.56 revenuesadvan 30% yr to yr
aJ MACR NASDAQ0.39 0.68 178.6 113.7 53.83 revenues advanc 34yrtoyy
ELR.d
i Sware
ractive0.44
MERQ NASDAQ 1.1-0.16 -0.16 1499 . 113 .1 107.4 116.7 revenue rost ar
ftware0.78
PRGS NASDAO ORSI NASDAQ
0.56
1.18
0.2
-0.09121
239.9
76.7
188.4
545
176.7forecastrevenue f 40%
revenue advanc 6% to yr
!p. RMDY NASDAQ0.84 0.67 91.93 71.63 56.67 revenuer 44% to
Vantive Corp. not qualified; poor CF0.63 0.89 157.4 129.2 80.64 revenues advan d42% stwar
nsio Corp. VSIO NASDAQ 0.89 0.44 V Wall Data n qualifled; CF poor 166 99.5 59.7 revenues ro to yr
COMPUTER SOFTWARE
NET INCOME/CASH FLOW
Company
6 I .I CO 8 / I ii a Ii
a? Adobe Systems ADSE NASDAQ 105 187 153 BMC Software. BMCS NASDAQ 384 166 184 106
161 246 209
Computer Associates not qualified; profit margins seem to be rather weak441 224 196 134
Microsoft MSFT NASDAQ 4490 3439 2195 5486 3996 2075 Novell, Inc. NOVL NASDAQ 102 -78.4 126 PeopleSoft, Inc.
not qualified; profits are predicted to be relatively flat178 12.8 231
Cadence Design Systems not qualified; revenue expected to decrease 20% Electronic Arts ERTS NASDAQ 72.9 72.6 53 40.5 119 99 74.5 56.4 Rational Software RAIL NASDAQ 59.2 -38.4 -43 -4 Veritas5oft,are VRTS NASDAQ 51.6 22.7
78 .17.4 .37.4 0.6
Avid Technology not qualified; profits are tagging9.8 59.1 26 11.5
Epicor Software not qualified; profits are flat and CF declining Henry (Jack) & Associates JKHY NASDAQ 22.2 15.8 12.4 HNC Software, Inc. HNCS NASDAQ 10.5 17.6
27.4 19.8 15.8
Macromedia, Inc. MACR NASDAQ 19.8 .6.2 -5.9
6.4
23
24.5 22.4 9.7
Mercury Interactive MERQ NASDAQ 21.8 6.727.9 1.5 1.8
Progress Software PROS NASDAQ 22.8
4.6 25.9 10.4 7.9
QRS Corp. QRSI NASDAQ 11.2
-1.6
8.8
5.5
6.6
34.5 9 15
Remedy Corp. RMDY NASDAQ 19 27.4 16.8
14.5 10.5 7.8
Vantive Corp. not qualified; poor CF25.5 30.6 18.6
VisioCorp. VSIO NASDAQ 28.1 15.1 11.1 Wall Data Inot qualified; poor CF 34.8 17.8 12.4
COMPUTER SOFTWARE
MANAGEMENT EFFECTIVENESS
co
I-J o e e e e raH Comments
Adobe Systems ADBE NASDAQ 1.8 11.8 12.4 17.1 1.36 Ace BMC Software BMCS NASDAQ 1.4 27.9 20.6 34.8 0.84 Ace Computer Associates not qualified; profit margin-3 seem to be rather weak Microsoft MSFT NASDAQ 2.8 1 31 24.4 35.1 1.33 Ace Novell, Inc. NOVL NASOAQ 4.5 9.4 5.4 6.7 1.54 Ace PeopleSoft, Inc.
not qualified; profits are predicted to be relatively flat Cadence Design Systems not qualified; revenue expected to decrease 20% Electronic Arts ERTS NASDAQ 2.4 6 8.8 11.9 1.4 Ace Rational Software RAIL NASDAQ 2.5 14.4 13.2 20.4 1.9 VeritasSofiwere VRTS NASDAQ 4.5 37.1 24.5 17.5 37.7 1.47 Avid Technology not qualified; profits are lagging Epicor Software not qualified; profits are fiat and CF declining Henry (Jack) & Associates JKHY NASDAQ 1.8 19.6 22.5 35.2 0.33 HNC Software, Inc HNCS NASDAQ 5.7 39.5 5.9 5.2 8.1 Macromedja, Inc. MACR NASDAQ 4.8 13.2 11.4 13.9 1.85 Mercury Interactive MERQ NASDAQ 2.6 18 12.6 16.9 1.21 Hold Progress Software PROS NASDAQ 1.7 9.5 12 22.9 0.92 QRS Corp. QRSI NASDAQ 4.7 12.1 15.2 18.2 1.27 Remedy Corp. RMDY NASDAQ 4.6 0.1 12.1 9.6 12.4 Vantive Corp. not qualified; poor CF Visio Corp.
DataVSIO NASDAQ 4.4 16.9 20.9 27.6 not qualified; poor CF
APPLICATION SOFTWARE
EPSIREVENUE
I; /w• f. (I Application Software I Autodesk, Inc. not qualified; revenues are flat 12 Technologies, Inc. I Oracle, Inc.
not qualified; poor CF management Intuit Inc. INTU NASDAQ J 0.55 1.97 -0.08 -0.02 Investment Technology Corp.
SiebelSystems
hG NYSE J 2.25
SEBI. NASDAQ 1.2 0.94
1.42 1.26
0.43 -0.04 Symantec Corp. SYMC NASDAQ 1.86 1.86 0.86 1.42
Aspen Technology
) Clarif Inc.not qualified; revenue declined 15%
CLFY NASDAQ 0.32 0.18 Harbinq_nr Corp. HRBC NASDAQ J 0.56 0.42 -0.2 -0.85 Hyperion Solutions not qualified; revenues are In real trouble Kronos, Inc. KRON NASDAQ 1.15 0.89
CsiittciT VA11'
lflli. i. 24
2.'S$I- °i. 2.SELt
?. 3d. . uc.-Z4
L1. )br 27
. C1r'AC 2I. S. I&ftr ) 1-t
847.6 592.7 598.9 538.6 revenue to increase 15%
212.2 137 111.6
391.5 118.8 39.5 revenues to Increase vmII ovaf3 592.6 578.4 472.2 445.4 revenues to lncreas
130.5 88.22 56.32 revenues have eased this year J 135.2 120.7 41.73 revenueston 3$
202.5 170.5 143 revenues have advanc ' w to w
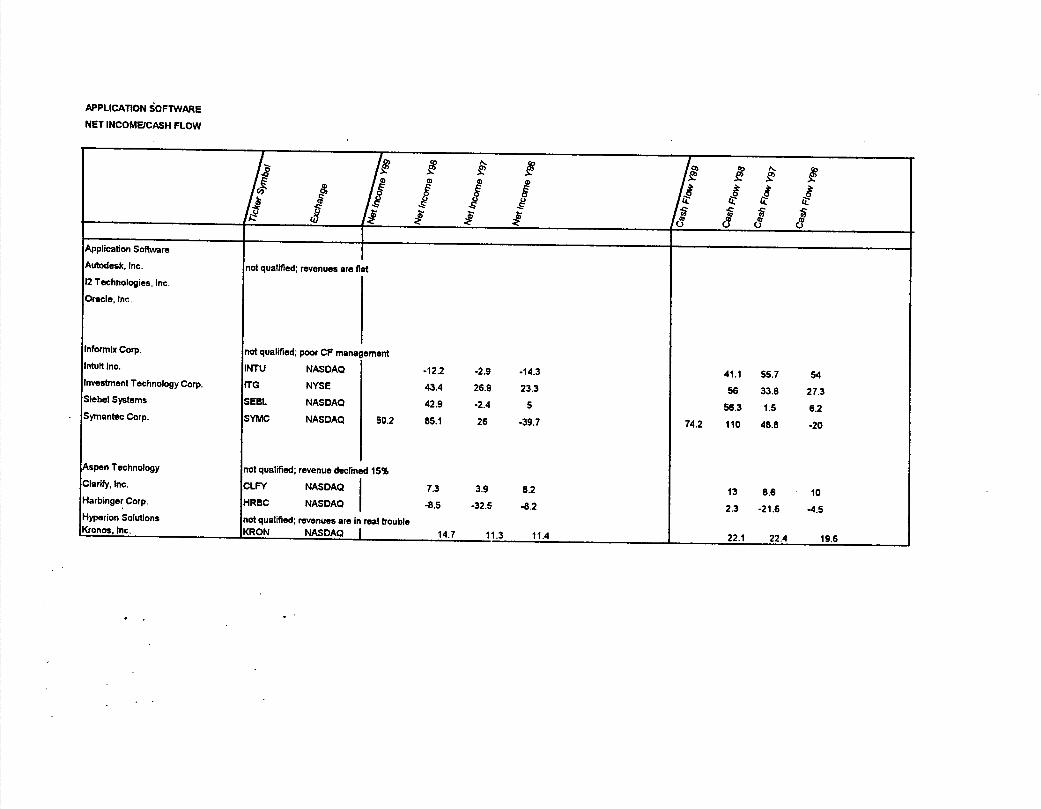
APPLICATION SOFTWARE
NET INCOMEJcASH FLOW
/# 11(1//I &III Application Software
Autodesk, Inc. not qualified; revenues are fiat 12 Technologies, Inc.
Oracle, Inc.
Informix Corp. not qualified; poor C? management Intuit Inc. INTl.) NASDAQ -12.2 -29 -14.3 41.1 55.7 54 Investment Technology Corp. ITG NYSE 43.4 26.9 23.3 56 33.6 27.3 Siebel Systems SEBL NASDAQ 42.9 -2.4 5 56.3 1.5 6.2 Symantec Corp. SYMC NASDAQ 50.2 85.1 26 -39.7 74.2 110 48.8 -20
Aspen Technology not qualified; revenue declined 15% Clarify, Inc. CLFY NASDAQ 7.3 3.9 6.2 13 8.6 10 Harbinger Corp. HRBC NASDAQ -8.5 -32.5 -8.2 2.3 -21.6 4.5 Hyperion Solutions not qualified; revenues are in real trouble Kronoa.Inc. KRON NASDAQ I_14.7 11.3 11.4 22.1 22.4 19.6
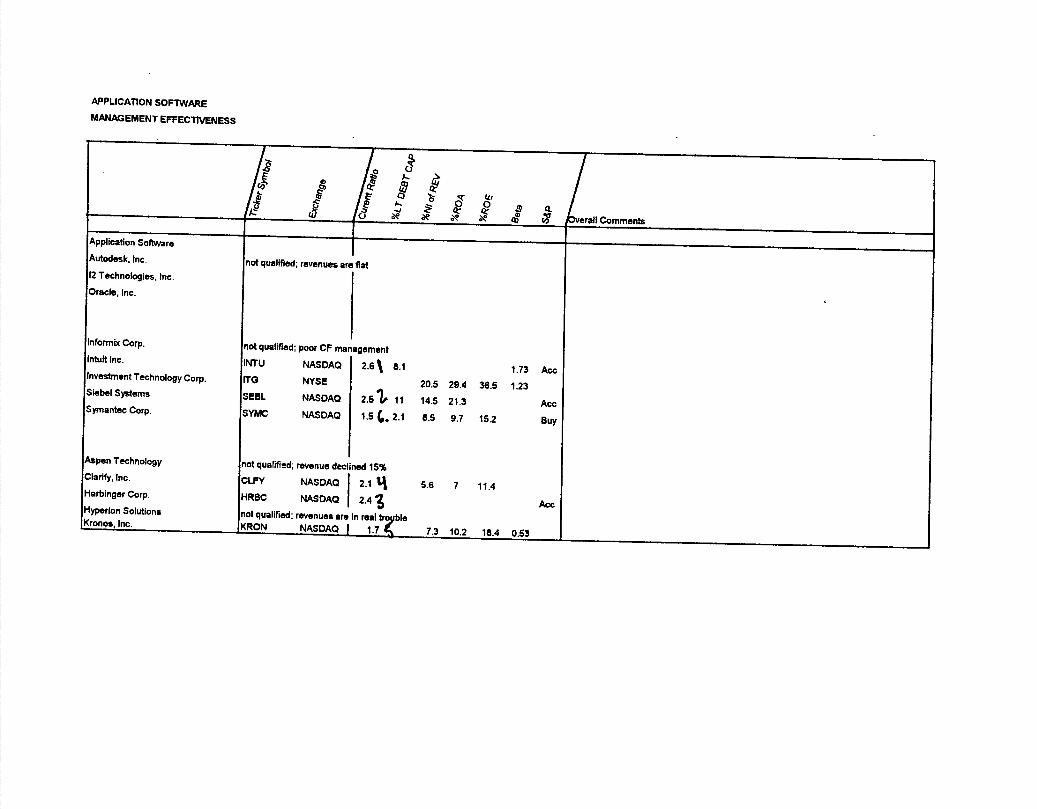
APPLICAI10ri SOFTWARE
MANAGEMENT EFFECTIVENESS
CO f
Lrnman 1/i, , Application Software Autodesk, Inc. not qualified; revenues are fiat 12 Technologies Inc.
Oracle, Inc.
Informix Corp. not qualified; poor CF management Intuit Inc. INTU NASDAQ
2.61 8.1 1.73 Acc
Investment Technology Corp. [TO NYSE 20.5 29.4 36.5 1.23 Siabel Systems SEBL NASDAQ 2.51P 11 14.5 21.3 Acc Snantec Corp. SYMC NASDAQ 1.54.2.1 6.5 9.7 15.2 Buy
Aspen Technology not qualified; revenue declined 15% Clarify, Inc. CLPY NASDAQ 2.1 Iq 5.6 7 11.4 Harbinger Corp. HRBC NASDAQ 2.43 Hyperion Solutions not qualified; revenues are In real froJzbIe
Acc
Kronos, Inc. KRON NASDAQ I 1.7 Z 7.3 10.2 18.4 0.53
TELECOMMUNICATIONS EQUIPMENT AND SERVICES
EPSIREVENUE
p 4) £ . £ f/f 8? 8?0 I J G
?i ' - Ici & o5 t
Telecommunication ADCT NASDAQ 1.66 1.36 1.08 0.81 on Systems cs NYSE 0.35 -1.47 -0.81 1.4
Systems CSCO NASDAQ 1.02 0.62 0.42 0.34 it Technologies not qualified
ork Appliance NTAP NASDAQ 0.46 0.29 0.01
NT
NYSE
1.35 1.15 -0.49 0.78 Y99 is est first two qtrs are neg. TLAB NASDAQ 1.65 1.32 1.03 0.71 not qualified
1380 1164 828 rev should grow 25% FY99
1411 1377 14 1070 rev growth of5% for py00 12154 8459 6440 4096 rev growth of 35% for FY00
269 166 93 46
17575 15449 12847 01,02 outpacing 98; expect 24% inc
1660 1204 869 01,02 outpacing 98; expect 36% inc
287 265 250
722.6 405.2 265.1 first 30s already surpassed 98
102.6 3.8
ADTRAN, Inc.
Sann,ina Corp.
) Juniper Networks, Inc.
APEX, Inc.
Aspect Telecommuniations
CommScope, Inc.
Digi International
Digital Microwave
Network Equipment Technologies
Standard MicroSystems
Lp757.
Z. cNM cci. J.
TN Pit oi.
4. 7'LkB 36I• etc* 36 f.
/. 7. AlD 2'17.
NASDAQ 1 1.44 1.2 1.03 1.03 EPS should grow 17% next2yrs NASDAQ 2.47 1.97 1.43 0.68 Will probably fall short of FY00 est NASDAQ -0.1 -0.28
not qualified I fl,4 I%7Y f L('D(R( not qualified I not qualified I 1 (ICøO
:!
FP3IfrkPS] not qualified
J 2,-4*/ not qualified
f not qualified
.f? t I gfto VP 11-M Z.. .1.t-3 , tz /. ?iVCT .,r
S. 2.c:co (VJ 2. fAjVM 2. 7L-S 1'?J
Vol ;. *WM r ccco D3 ?. cc
V
If .O q.mp ic.q Ø4 CSC. I.3T •ARM I.?
2 IS. Aver I?.1 5. APT 114
.
we1.11*
(JrT. '' I.

TELECOMMUNICATIONS EQUIPMENT AND SERVICES
NET INCOMEJCASH FLOW
/ Ic Iii I I I.
CJ I : $ 5 I Company C) () C)
ADC Telecommunication ADCT NASDAQ 147 109 87.5 good Increase of average $30MJ 212efnL
Cabletron Systems CS NYSE .244 .126 222 164159 121 increase of$25M/yr(
Cisco Systems CS CO NASDAQ 1350 1049 913-130 -61.8 272 196 X
Lucent Technologies not qualifiedconsistent increase 1677 1261 1046 consistent Increase ()
Network Appliance NTAP NASDAQ 36 21 0.3 6.6 Nokia OJy(ADR) NOI< NYSE 2043.1 1154.1 700.9
43.8 26.5x
Nortel Networks NT NYSE -0.5 829 623 97,98 NI dropped heavily 1722 () Tetlabs TLAB NASDAQ 398 264 118 steady increase1358 1148
steady Increase In cash fl .(25 3Com not qualified454 311 151
ADTRAN, Inc. ADTN NASDAQ 40.3 40.2 39.8 Senmlna Corp. SANM NASDAQ 68.2 40.9 28.1 steady Increase
49.3 47.6 44.7
Juniper Networks, Inc. JNPR NASDAQ -995.4 53.8 36.2 steady increa)
-31
APEX, Inc. not qualified
Aspect Telecommuniatlons not qualified CommScope, Inc. not qualified
DlgI International not qualified
Digital Microwave not qualified
Network Equipment Technologies not qualified
Standard MicroSystems not qualified
TELECOMMUNICATIONS EQUIPMENT AND SERVICES
MANAGEMENT EFFECTIVENESS
co Id I Company
X )verall Comments
ADC Telecommunication
Cabletron SystemsADCT NASDAQ 2.3 0.3 10.6 13.1 17.6 2.15 Buy rev 25%incFygg; sales Inc 2o%Fy0o;e Inc 2o%n2 CS NYSE 1.8 n n n n 1.67
Cisco Systems CSCO NASDAQ 2.1 18 18.8 23.7 Lucent Technologies not qualified
1.32 Buy much heavier comp in mkt but much greater opoitunity industry growth of 30-50% for several years
Network Appliance NTAP NASDAQ 6.2 0 12.3 15.4 18.6 n Hold sales Inc 74%;data storage systems for neMvr$dng Nokia Ojy (ADR) NOK NYSE 1.64 36.8 36.8 91 mobile phone maker Norte[ Networks NT NYSE 1.8 12.4 n n n n Buy earning o grow 20% for next several years Tellabs TLAB NASDAQ 5.7 0.2 24 28.3 34.5 1.93 t- Hold sales to Inc 36% for 99 & 31% for 00; earning grow 25% for next two 3Com not qualified years
ADTRAN, Inc. ADTN NASDAQ 9.8 17.6 14.1 13.8 18.2 0.54 Sanmlna Corp. SANM NASDAQ 3 1.8 9.4 17.7 27.3 1.36 Buy revenue to advance 65% for 4099 and 50% for YOC Juniper Networks, Inc. JNPP NASDAQ 2.96 -8 customer include MCI Worlcom and Erricson
APEX, Inc. not qualified
Aspect Telecommunjations not qualified CommScope, Inc. not qualified Digl International not qualified
Digital Microwave not qualified
Network Equipment Technologies not qualified
Standard Microsystems not qualified
1058 872.3 812.2 revenues will Increase b almost 719.9 550.4 262.3 156.9 revenues Increas 25-30%
39.5 19.6 9 revenues advancec,,r
136.9 102.3 104.8 revenues have increasyTto yr
(A420 t&I- 0
dxc
COMPUTER SERViCES
EPSIRE'VENUE
P 4) 4' /0 ! .
I 0 0
L
DS NYSE 2.26 1.86 1.5 1.48 CS NYSE 2.6 2.11 1.64 1.23 CPWR NASDAQ 1.19 0.87 0.5 0.27 not qualified; inconsistent profits
UIS NYSE 1.9 1.5 1.06 -5.3
ACS NYSE 1.66 1.11 1.06 not qualified
CTXS NASDAQ 1.67 1.32 0.67 0.47 not qualified; flat revenues
LOTO NASDAQ 0.34 0.21 NETA NASDAQ 0.83 .0.5 0.26 -0.27 not qualified;
MSY NASDAQ 1.9 1.56 1.21 0.74 BR NYSE 1.12 0.95 0.65 0.4 ot qualified; flat earnings
CRD NASDAQ J 0.64 0.01 -0.57 iot qualified; inconsistent profits
iot qualified; revenues have fallen 20% NTV NASDAQ 1 0.68 0.39
Computer Sciences
Compuwre Corp.
Technology Partners
Isco, Inc.
)Systems
rk Associates
Management Systems Corp.
('IAn1er1can Management S
CIBER, Inc.
ICompute, Task Group
Concord Communications
I
Gerber Scientific
toa(0m Corp. InterVoice-Brite
16891 15236 1441 revenues to raise lO% 7660 6601 5616 4242 revenues to increase 17% 1633 1139 813 614 revenue toincreas
7208 6636 6371 revenues to increase 11%
1642 1189 824.5 398.5 revenues are increasing(3I-' '
248.6 123.9 44.53 revenue to increas.40
143.2 81.83 5425 revenues have advanced 990 612 181 Fe ies l..., LIk.,
REVEWE• I . cCR' WI. v___ \
IT C
'1j • AcS 39 i. C f o p-.i'J tV 1J. \
;K, \
COMPUTER SERVICES
NET INCOMEJCASH FLOW
_______
Company
co
I. I •1
J
I? I I :o I o
/I Ioi
JiZ
I Li.
EDS
Computer SciencesEDS NYSE 743 731 432 2137 1941 1613
CompuaereCorp.
cs NYSE 341
CPWR260 192 142 786 647 526 394
Shared Medical SystemsNASDAQ 350 194 97.4 44.2 391 230 113 52.8
not qualified; inconsistent profits Unisys Corp. UlS NYSE 387 -853 61.6 426 546 253 157
Affiliated Computer Services ACS NYSE 54.4 38.5 23.8 Cambridge Technology Partners not qualified
102 69.8 38.8
Citrix Systems Inc. CTXS NASDAQ 61.1 41.4 18.7 Comdisco, Inc. not qualified; fiat revenues
76.3 43.1 19.1
Legato Systems LGTO NASDAQ 27.7 15.7 8.6 Network Associates NETA NASDAQ
33.8 19.6 10.4
Policy Management Systems Corp. not qualified;
American Management Systems AMSY NASDAQ 51.8 31.2 15.5 CIEER, Inc. CBR NYSE 36.5 14.6 8.5
90.4 65.9 54.8
Computer Task Group not qualified; fiat earnings46 19.2 11
Concord Communications CCRD NASDAQ 8.1 0.1 -5.1 Gerber Scientific not qualified; inconsistent profits
10 0.7 .4.7
InaCom Corp. not qualified; revenues have fallen 20% lnterVoice4rite INTV NASDAQ 20.2 -5.1 12.7 31.2 17.7
Computer Sciences
Compure Corp.
Shared Medical ystems
Unisys Corp.
It Affiliated Computer Services
Cambridge Technology Partners
It Citrix Systems, Inc.
Comdisco, Inc. Inc.
Legato Systems
EDS NYSE 1.5 CS NYSE 1.3 CPWR NASDAQ 2.1 not qualified; inconsistent profits LJIS NYSE 1.1
CS NYSE 2.2 ot qualified
TXS NASDAQ 2.9 iot qualified; flat revenuea
.GTO NASDAQ 1 3.8 IETA NASDAQ
Management Systems Corp. Jnot qualified;
'I UIS 1.
3 (,JIV (..ôb
.. I
1.
COMPUTER SERVICES
MANAGEMENT EFFECTIVENESS
11Z
li LI 0
11•
Ow
Comments
:arican Management Systems -
CIBER, Inc.
Computer Task Group
Concord Communications
cien
InaCom Corp.
15 4.4 6.5
14.2 4.5 7.5
13.2 1 0.85 Hold
15.5 0.92 Buy 1 21.4 25.5 39.11 1.06Acc -
12.1 5.4 6.9 1.85 'r Buy2. C$. Z4.
0.8 4.6 7.1 12.8 0.45 g. (P'I( 'ZO.0
24.6 17.1•
24.7Ace
ç.ecgp e.i
19.4 18.4' 2Z.46 C1) r-•1
7 k*'S 1
of 9. SY NASDAQ 2.1 6.6 4.9 10.8 19.5 0.85 Ace I.:) (.
NYSE 3 6.6 212 ' 24 1.36 Ace ACs •1. I qualified; flat earnings
RD NASDAQ 4.3 23 18.1 22.6 qualified; inconsistent profits
qualified; revenues have fallen 20%
V NASOAQ J 3.3 5.6 14.7 20.6 29 1.27
. cpm 3i1
I. 1 p4V 2j•o
£ C€)t 274 ci. ct,cs zq.?
LO-0 Z4.q
'. cciv
1. A117C ti.0
. Cf Ic!c
¶. fts,3.,
!! ! I a a
&
53223 51319 52184
5194 3264 3192 FY99 increase almosl<rto qtr 31566 30194 13081 FY99 continues toIncrease
23123 20561 19040 revenue to grow lo%
1577 901.5 749.7 revenue up about 15%
TELEPHONE
EPSIREVENUE
liAtlantic
South
Corp.
BC Communications
Sprint Phone Group
Sprint PCS
US West
Cincinnati Bell
3enaral Communications
Inter-Tel, Inc.
I'
' !
T NYSE 2.5 2.2 1.94 1.83
AT NYSE 3 2.55 1.89 2.7 BEL NYSE 3.35 2.95 1.87 1.56 BLS NYSE 2.2 1.95 1.78 1.64 CTI. NYSE 1.9 1.65 1.83 1.87
not qualified; inconsistent profits
GTE NYSE 3.95 3.5 2.57 2.9 WCOM NASDAQ 2.85 2 -2.02 0.4 SBC NYSE 2.7 2.35 2.05 0.8 FON NYSE 2.05 1.85 1.77 1.09
not qualified; inconsistent profits
USW NYSE1 3.4 3.2 2.84 2.42
not qualified; Inconsistent profits
not qualified; inconsistent profits
not qualified; inconsistent profits
25473 23260 21339 revenue to increaseabout 1 %
17678 7351 4485 revenue to increase abo 3
28777 24856 13898 revenue to increase about 8%
16017 14874 14045 revenue to grow 8%
12378 10319 10079 revenue to grow s%
Y4VrPJv
f . RU.TEL q0y.
2. LJCOM 30'!.
S. C1L. 1/.
?. GrE 1.7.
c. 31. c 1°i.
7• T 71.
s. usw g.
go 67 9M 1
ea& ç.'
2.6 21•1 . r
. gL 23 .2- 3. CAl.
rj r zr.? 69C 6-2q
'.. Cu:. i'°5.
c. AT t?.2.• o.
irJ o.5C
L.S oI
1• C COJMP # LsC*V FAMV e.1r4e1er€.
2. jq rek i,hi'tit & .f4DM C/b$gC
2- wM. T - -4
jV kzJt j- t?5
TELEPHONE
NET INCOME/CASH FLOW
II, ii 1 /5 I 5
I 5
AT&T . T NYSE 5235 4472 5608 9864 8299 8349 AUtel AT NYSE 525 508 292 Bell Atlantic BEL NYSE 2991 2455 1739 Belt South BLS NYSE 3527 3270 2863 CenturTeI CTL NYSE 229 256 129 Frontier Corp. not qualified; Inconsistent profits
GTE GTE NYSE 2492 2794 2798 MCI Woddcom WCOM NASDAQ -2539 384 -2188 -352 1278 -1885 SBC Communications SBC NYSE 4068 1474 2101 Sprint Phone Group FON NYSE 457 953 1191 3156 2678 2781 Sprint PCS not qualified; Inconsistent profits
US West USW NYSE 1508 1252 5375 Cincinnati Bell not qualified; Inconsistent profits
General Communications not qualified; Inconsistent profits
Inter-Tel, Inc. not qualified; Inconsistent profits
TELEPHONE
MANAGEMENT EFFECTIVENESS
I Co
p 1 I12 0. ' Dverall Comments
AT&T T NYSE 0.9 15.2 9.8 8.9 21.7 ' 0.895 13uy revenue should increase l% AIIteI AT NYSE 51.6 10.1 192 0.3810*Acc rsvsnu.ehou4d-gmr1S Bell Atlantic BEL NYSE 57.6 9.5 AS Acc BellSouth BLS NYSE 29.8 152 21 0.484 Acc CenturyTel CTL NYSE 62.6 14.5 16.2 0.853 Acc Frontier Corp. not qualified; inconsistent profits GTE GTE NYSE 62.4 9.8 27.9 016 A. MCI Worldcom WCOM NASDAQ 0.7 24.6 5.2 1.8 2.7 4 1.3 1 Buy controls 50%fInternet SBC Communications SBC NYSE 49.4 14.1 135.4 0.8A Acc 50% of all Mexican traafic and 20% of Asian traffic ) Sprint Phone Group FON NYSE 1 45.5 2.6 1.8 4.2 10.561 Buy Sprint PCS not qualified; inconsistent profits US West usw NYSE 92 12.2 0.47A Buy Cincinnati Bell not qualified; inconsistent profits General Communications not qualified; inconsistent profits Inter-Tel, Inc. not qualified; Inconsistent profits

For4s teed off in the deregulated telecommunications contest. The US'. 81 telecom cony,
with some 90 million customers, AT&T is stuffing more services into its bag. Offerings include long
distance, wireless phone service, Internet access (AT&T WoridNet), and local and international phone
services for businesses. The company plans an lPO of part of its wireless business. Driving toward
domination of the cable TV market, AT&T will become the #1 US cable operator (ahead of Time Warner)
with its planned purchase of MediaOne it intends to use cable to offer local phone service. AT&T also
formed global telecom services venture, Concert, with British Telecommunications.
Altogether ALLTEL offers telecommunications services to 8.5 million customers in 25 US states, mainly in
the Southeast and Midwest. The company provides local phone service Over nearly 2 million local lines,
primarily In rural areas, in 15 us states, and It has gained apprdval to offer competitive local access service
in five states. ALLTEL's cellular operations serve about 5 million customers in 23 states, and the company
provides P05 service in Alabama and Florida. ALLTEL also offers long-distance services to more than
500,000 customers, as well as Internet access and paging servites. Additional businesses include
information services and phone directory publishing.
Thi4;D1 Is growing up. The #2 local phone company in the US( Mrid SBC) Bell Atlantic will
approach old Ma Bell's size when it acquires GTE. The company, which has more than 42 million local-
access lines In 13 states from Maine to Virginia, will nearly double in size with the GTE deal to become the
US's #2 telecom company, after AT&T. Ball Atlantic offers wireless service in 24 states, and the company
has agreed to combine its US wireless operations with those of Vodafone Airlouch to create a nationwide
network. Bell Atlantic also offer. Internet access. And, as if AT&T didn't have enough reasons to look over
Its shoulder, Bell Atlantic has begun to sell long-distance service in New York State,
BellSouth Is making a run for the border. The company is focusing on its Latin American wireless
operations and plans to expand its telecommunications offerings in the region as markets deregulate.
BellSouth still relies on the Baby Bell business of local phone service, in which it is the 93 player in the US
(behind SBC Communications and Bell Atlantic). Its local service territory covers the southeastern US. The
company also has about 4.8 million domestic cellular and P05 customers In 14 US states. BelISouth.net provides dial-up Internet access to more than 500,000 customers and is rolling out high-speed ADSL
(asymmetric digital subscriber line) access.
Bright lights and big cities are not for CenturyTel. The local-exchange carrier, formerly called Century
Telephone Enterprises, provides telecom services in rural areas, suburbs, and small towns. Providing local
phone service over about 1.3 million access lines in 18 US states and cellular service in seven states,
Centurylel also offers long-distance service, Internet access and business data services, calling-center
services, and security monitoring. The company is upgrading its analog cellular system by offering digital
P05 based on TDMA (time division multiple access) technology.
Once GTE couldn't stand a big Baby. Novi, the largest non-Baby Bell, has agreed to be acquired by
Bell Atlantic, the second-largest Baby Bell, ins deal that will create the #1 local phone company in the US.
GTE serves more than 23 million local phone customers in 28 US states and offers long-distance service in
50. It provides cellular and P05 phone service to 6.7 million subscribers through subsidiary GTE Wireless,
consumer Internet access through GTE.net and has cable franchises in California and Florida. GTE also
provides telecom services in Argentina, Canada, China, the Dominican Republic, and Venezuela
gotten its fingers on just about every cookie in the telecom jar. Formed in 1998 when
WoddCom bought MCI Communications, the company is now second Only to AT&T in the US long-distance
market. MCI Worldcom will become an even stronger 02 when it acquires rival long-distance provider Sprint,
which also brings a nationwide wireless PCS network to the table. With a fiber-based diet (fiber-optic
networks, that is), MCI WoildCom has taken healthy bites of local and international telecom and Internet
markets in more than 65 countries. Its UJNET unit offers Internet access to businesses over a massive
Internet backbone. The company also plans to offer high-speed Internet access via wireless cable.
Up the trail from Texas with a herd of telecom operations comes SBC Communications, now the 91 local
phone outfit In the US (ahead of Bell Atlantic) after Its purchase of Ameritech, the Midwestern Baby Bell.
SBC operates nearly 60 million access lines in Arkansas, California, Connecticut, Illinois, Indiana, Kansas,
Michigan, Missouri, Nevada, Ohio, Oklahoma, Texas, and Wisconsin. It has taken a stake in Williams
Communications, which has a national fiber-optic network, to prepare for the day It is allowed to enter the
long-distance arena. SBC has more than 10 million wireless phone subscribers in 22 states, Internet
access and paging businesses, and stakes in telecom operations in 22 countries Outside the US.
Fast on Its feet, Sprint trails only AT&T and MCI WortdCom in the race for US long-distance markets. The
field will shrink, however, when Sprint is acquired by MCI Worldcom. Sprint is also the #2 non-Baby Bell
local-service phone company (after GTE), with more than 7.6 million lines in 18 states. Sprint's FON Group
handles these businesses, as well as telecom equipment distribution, directory publishing, and Sprint's
Interests in EsrthLink (Internet access) and Call-Net (long-distance in Canada). Through Sprint PCS the
company provides wireless phone service throughout the US.
It was coming down to an Old West shootout. But US WEST, the object of a monthlong takeover
showdown between rivals Global Crossing and Owest Communications, has hopped In the saddle with
Qwest. U S WEST provides local phone services to more than 25 million residential and business
customers in 14 western and midwestern states in the US. It also provides directory publishing, out-of-
territory long-distance service, high-speed data networking, Internet access, and PCS wireless phone
services. U S WEST Is spending about $3.5 billion to upgrade Its telephone network and Improve Its
reputation for poor customer care. Before US WEST can ride Into the sunset with Qwest, the acquisition
faces regulatory scrutiny.
CIRCUITS
EPS/REVENUE
co
co 02ñisi
Company
PMxIm Integrated MXIM NASDAQJ 1.29 1.18 0.94 607 560.2 433.7 421.6 Mentor Graphics Corp. not qualified; negative cash flow last threee years
Noveilus Systems not qualified; revenues are down
Synopeys, Inc. SNPS NASDAQf 3.12 2.57 0.93 1.25 718 499 354 revenues for FY99 are looking real good Vitsise Semiconductor viss NASDAQ 0.67 0.44 FY99 looking good 175 105 66
Alpha Industries AMAA NASDAQ 1.31 0.65 .1.05 126.3 116.9 85.23 96.89 C-Cube Microsystems not qualified; inconsistent CFs
Cable Design Technologies CDT NYSE 1.36 1.29 1.17 684 651.7 517 375 Uitvatech Stepper not qualified; inconsistent CFs
Unitrode Corp. not qualified; Inconsistent CF*
E-Tek Dynamics
Metromedia Fiber Networks
Brocade Communications Systems
\jVeçe. cM;Vb • 7-e ieis vt lvi. • Cvift' *hD
S. POA R.'J (t.(,
TELECOMMUNICATIONS EQUIPMENT AND SERViCES
NET INCOMEJCASH FLOW
I. / ! £ / I I I AD I I p I I . I- I- - . - ji
I •Li.
Company
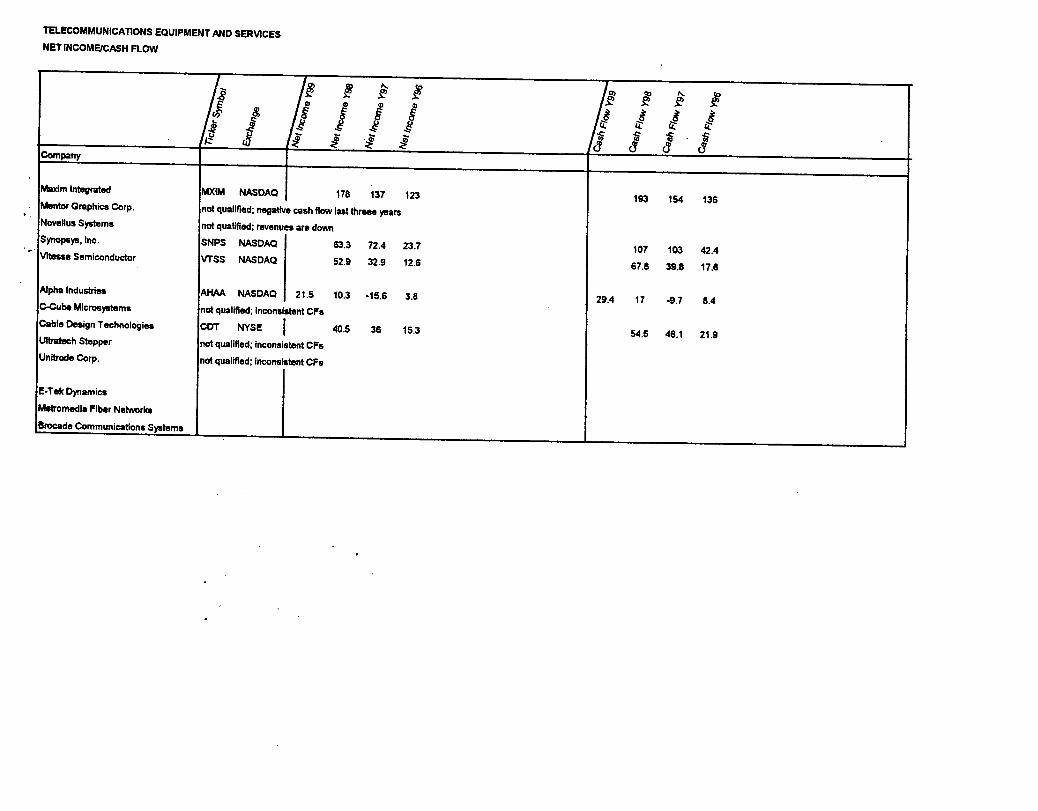
Maxim Integrated MXIM NASDAQ 178 137 123 Mentor Graphics Corp. not qualified; negative cash flow last three. years
193 154 136
Novellus Systems not qualified; revenues are down Synopsys, Inc. SNPS NASDAQ 63.3 72.4 23.7 107 103 42.4 Vitesse Semiconductor 'rss NASDAQ 52.9 32.9 12.6 67.6 39.8 17.6
Alpha Industries AIIM NASDAQ 21.5 10.3 -15.6 3.8 29.4 17 -9.7 8.4 C-Cubs Microsystems not qualified; Inconsistent CPa Cable Design Technologies CDT NYSE 1 40.5 38 15.3 UltTatech Stepper not qualified; inconsistent CPa
54.5 46.1 21.9
Unitrode Corp. not qualified; inconsistent CPa
E-Tek Dynamics
Metromedia Fiber Networks
Brocade Communications Systems
TELECOMMUNICATIONS EQUIPMENT AND SERVICES
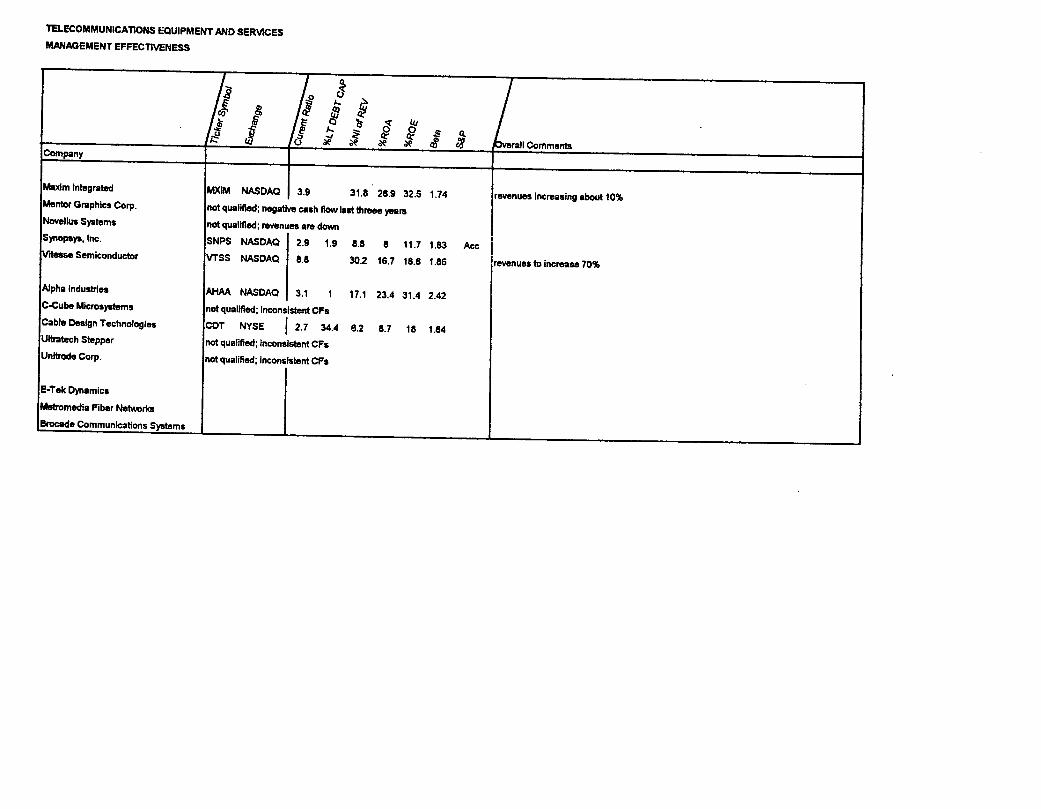
MANAGEMENT EFFECTIVENESS
co /h veran Comments
Company
revenues increasing about 10% Maxim Integrated MXIM NASDAQ 3.9 311 26.9 32.5 1.74 Mentor Graphics Corp. not qualified; negative cash flow last threee years Novellu, Systems not qualified; revenues are down Synopsys, Inc. SNIPS NASDAQ 2.9 1.9 8.8 8 11.7 1.83 Acc r,tease Semiconductor VISS NASDAQ 8.8 30.2 16.7 18.6 1.86 revenues to increase 70%
Alpha Industries AJtAA NASDAQ 3.1 1 17.1 23.4 31.4 2.42 C-Cube Microsystems not qualified; Inconsistent CFs Cable Design Technologies CDT NYSE
J 2.7 34.4 6.2 8.7 18 1.84
Ultratech Stepper not qualified; Inconsistent CFs Uniti-ode Corp. not qualified; inconsistent CFs
E-Tek Dynamic,
Metromedia Fiber Networks
Brocade Communications Systems

Maxim is mixing it up. Maxim Integrated Products makes more than 1.500 kinds of linear and mixed-signal
Integrated circuits. These chips translate temperature, pressure, sound, and speed into digital signals for
computer processing. Maxim's products - Including data converters, interface circuits, power supplies, and v
oltaga references - are used by makers of electronic products such as cordless and cellular phones,
robotics, PCs, and medical equipment. The company owns manufacturing facilities in the US and the
Philippines and gets about a fourth of its sales from overseas. Maxim-Tektronix joint venture Maxtek
Components makes muttichip modules and hybrid circuits.
Sopsyi, In short, makes electronic design automation (EDA) software. The company's products are used
by designers of Integrated circuits (iCs) and electronic systems. Synopsys offers a range of design and
verification tools that let designers develop, simulate the behavior of, and test the performance of ICs. It also
provides libraries of reusable design code, which significantly reduce design time. An ongoing string of
acquisitions has helped Synopsys become the 92 EDA software company, behind Cadence Design
Systems. Synopsys has sales and service offices in more than a dozen countries; about 35% of Its sales
are outside North America.
Vitesse (French for speed") Semiconductor is In the semiconductor fast lane. The company is a leading
manufacturer of digital gallium arsenide (GaAs) integrated circuits (ICs), which perform at higher speeds
than silicon chips. About half of Vitesse's sales are to telecommunications equipment companies such as
Alcatel, Ericsson, and Lucent. Data communications equipment makers deco and IBM and automated
test equipment maker Schiumberger also use its chips. Vitesse products support high-speed protocols
such as ATM gigsbit Ethernet, and SONET/SDH. The company has factories In California and Colorado
and offices In Europe and Japan. About three-quarters of its sates are in the US.
Alpha Industries wants to make a beta chi-nd of chip. Most of Alpha's sales come from integrated circuits
(ICs) that help send and receive radio frequencies; they are sold to wireless telephone makers like Motorola
(28% of sales) and Ericsson (8%). The company, which built its name as a defense contractor, fabricates
its ICS out of gallium arsenide, which lets chips operate at higher speeds and consume less energy than
the industry-standard silicon. Alpha also makes electrical ceramics and ferntes for use in products such as
wireless base station equipment Harvey and Gloria Kaylie, directors of Scientific Components Corporation,
own nearly 10% of Alpha Industries.
Getting wired is a way of life for Cable Design Technologies (CDT). CDT makes copper, fiber-optic, and
composite cables used to connect electronics networks of all kinds, including computer, communications,
and Industrial automation networks. It also produces Interconnect devices, LAN enclosures, and specialty
electronics. The company has used acquisitions to fuel international growth, especially in Europe. CDT has
manufacturing facilities in Canada, Denmark, Germany, Sweden, the UK, and the US, with the US and
Canada accounting for about 70% of sales. CDT's customers include OEMs, distributors, and the Baby
Bells.
CELLULAR WIRELESS TELECOM
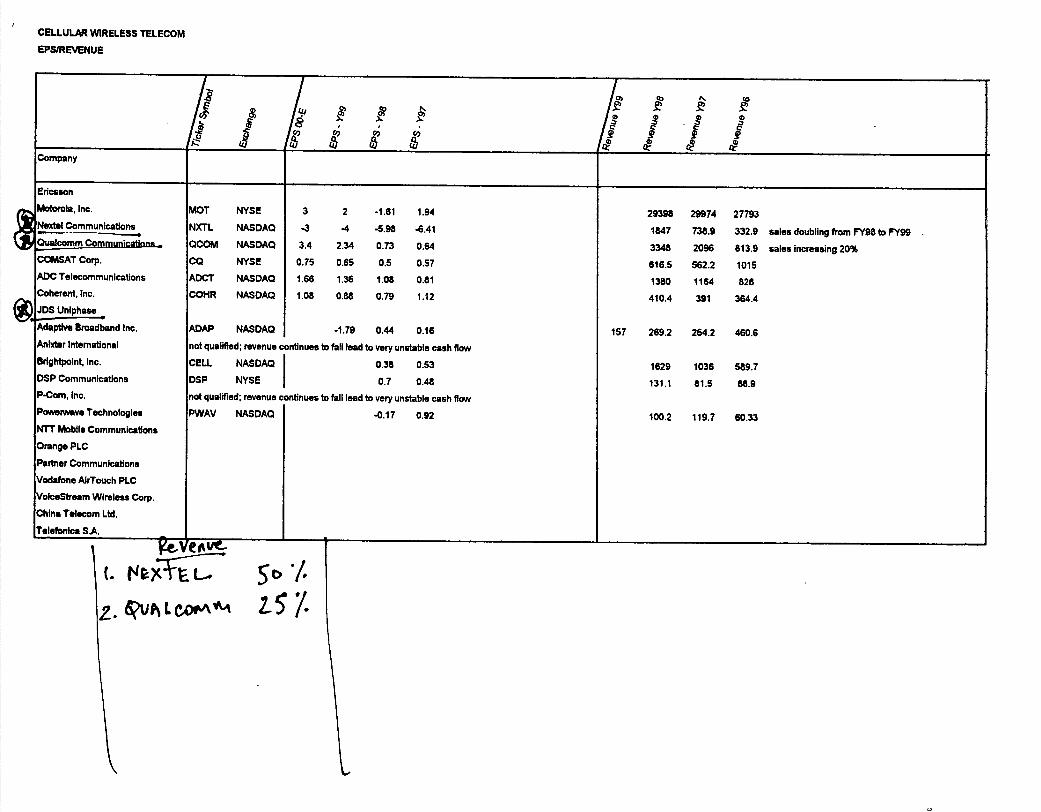
EPS/REVENUE
Co
/884 1
I ! . 0______- I& o! c &
Motorola, Inc.
Nextel Communications
Qualcomm Communications..
COMSAT Corp.
ADC Telecommunications
Coherent, Inc.
JDS Uniphas.
Adaptive Broadband Inc.
Anixter International
Btlghtpolnt, Inc.
DSP Communications
P-Corn, Inc.
Powerwave Technologies
NTT Mobile Communications
Orange PLC
Partner Communications
Vodafone AirTouch PLC
VolceStyeam Wireless Corp.
China T&ecom Ltd.
T.Iefonlca S.A.
I NYSE 3 2 -1.61 1.94
rL NASDAQ -3 -4 -5.98 -6.41
CM NASDAQ 3.4 2.34 0.73 0.64
NYSE 0.75 0.65 0.5 0.57
T NASDAQ 1.66 1.36 1.08 0.81
FIR NASDAQ 1.08 0.88 0.79 1.12
P NASDAQ -1.79 0.44 0.16
qualified; revenue continues to fall lead to very unstable cash flow
.L NASDAQ 0.38 0.53
' NYSE 0.7 0.48
qualified; revenue continues to fail lead to very unstable cash flow
AV NASDAQ I -0.17 0.92
29398 29974 27793
1847 738.9 332.9 sales doubling from FY98 to FY99
3348 2096 813.9 sales increasing 20%
616.5 562.2 1015
1380 1164 828
410.4 391 364.4
157 269.2 254.2 460.6
1629 1036 589.7
131.1 81.5 68.9
100.2 119.7 60.33
iv-
(. Sc>
!.'UP L tom '-i 237.

Adaptive Broadband (formerly California Microwave) is heating up a new dish. A supplier of satellite earth
station and microwave radio products, the company has streamlined its operations and intensified its focus
on emerging broadband markets, particularly the market for Internet access. Customers including AT&T
and British Telecommunications have incorporated into their networks the earth station products offered by
the company's satellite communications division. Through its terrestrial wireless division, Adaptive also
offers digital and analog microwave radios for use in land-based communication networks. The company
has sold its specialized military electronic and satellite communications systems business.
Biightpoint is the world's #2 distributor of mobile phones (behind CellStar). Acting as the middleman
between manufacturers and wireless service providers, the company derives more than 80% of its revenues
from the sale of mobile phones. Brightpolnt also provides distribution services such as purchasing,
packaging, warehousing, and shipping, as well as value-added logistics services such as product fulfillment,
private labeling, and warranty and repair services. It sells equipment to wireless carriers, agents, dealers,
and retailers, doing business in more than 75 countries. International markets, which have been rocky for
Brightpoint, account for about 70% of the company's sales.
No, Powerwave isn't a new ride at Disneyland. Powerwave Technologies' radio-frequency power amplifiers
boost signal strength and reduce transmission interference in the base stations of cellular and personal
communications service networks. Its single- and multi-carrier amplifiers support a variety of digital and
analog transmission protocols and are also found in two-way radio systems used by police and emergency
workers. The company's four largest customers - BellSouth, LG Information & Communications, Nortel
Networks, and Samsung - together account for nearly 70% of sales. About 40% of sales are outside North
America, primarily in South Korea.
- CURRENT QUOTESPage 1 of
Gonzalez Venture FundLast update: 1_mg 0nzalez Venture Fund
Sym Name News Alert Open High Low Last Change Volume Mkt Cap More Info ALTR ALTERA CORP IJ 74.250 77.437 73.250 77.437 +4.434 3,013,600 15,446M Quote, Analysts ADI ANALOG DEVICES INC II 151.000 167.312 150.500 151.875 +4.254 2,704000 26,495M Quote, Analysts CV CYPRESS SEMICONDUCTOR CORP 95 39.812 41.750 38.500 41.750 +1.81 4 1,648,600 4,562M Quote Analysts LLTC QLGC
LINEAR TECHNOLOGY CORP II 103.375 107.500 100.062 106.750 +3.874 1,434,200 16,472M Quote , Analysts QLOGIC CORP l!J 139.000 149.687 132.250 146.000 +10.684 1,974,500 10,671M Quote Analysts XLNX XILINX INC IJ 69.000 72.375 68.187 72.125 ±4.124 5,404,900 11,498M Quote, Analysts HELX HELIX TECHNOLOGY CORP I 62.875 66.125 60.875 64.875 +2.064 269,800 1,449M Quote Analysts LSCC LATTICE SEMICONDUCTOR CORP 62.750 66.125 62.750 65.125 +2.374 771,800 3,121M,
Quote Analysts MCRL MICREL INC 95.750 97.625 92.031 97.500 ±1.964 267,500 4,020M,
Quote Analysts VTSS VITESSE SEMICONDUCTOR CORP 99 76.968 88.500 76.000 85.500 +13.62+ 9,996800 13,121M,
Quote, Analysts SEBL SIEBEL SYS INC tJ 134.500 142.000 130.000 19.875 +10.254 5,185,300 26,445M Quote, Analysts SYMC SYMANTEC CORP ffm 68.000 69.000 65.875 66.375 -1.13+ 976,900 3,859M Quote, Analysts CLFY CLARIFY INC I!J 153.500 154.937 145.750 150.500 -3.22+ 402,700 3,568M Quote, Analysts HRBC HARBINGER CORP 99 30.750 31.437 29.187 30.812 +0.754 1,254,300 1,189M Quote, Analysts KRON KRONOS INC 99 62.750 63.750 60.875 63.625 ±1.12+ 55,000 802M Quote, Analysts HTCH HUTCHINSON TECHNOLOGY INC IJ 15.500 15.750 15.437 15.437 -0.25+ 199,700 381M Quote, Analysts MCRS MICROS SYS INC 56.093 56.125 54.000 54.000 -1.07+ 225,800 886M Quote, Analysts XIRC XIRCOM INC RD 41.250 44.375 41.000 42.875 +1.904 1,580,300 1,068M Quote, Analysts ACS AFFILIATED COMPUTER SVCS INC 32.625 32.750 31.625 32.000 -0.384 453,400 1,578M Quote, Analysts CTXS CITRIX SYS INC II 95.000 97.000 90.000 96.500 +7.18 + 3,366,400 17,294M Quote, Analysts LGTO LEGATO SYS INC RM 41.375 44.000 39.250 43.750 +3.254 4,846,900 3,717M Quote, Analysts AMSY AMERICAN MGMT SYS INC II 31.875 32.250 30.625 31.500 -0.32+ 406,200 1,287M Quote, Analysts CCRD CONCORD COMMUNICATIONS INC 36.000 36.875 34.000 34.937 -1.19+ 409,500 501M Quote, Analysts INTV INTER VOICE-BRITE INC II 37.625 38.125 34.750 36.812 -0.63+ 516,500 1,179M Quote, Analysts SANM SANMINA CORP 119.625 122.375 116.750 122.312 +2.814 1,094,300 14,269M Quote, Analysts ERTS ELECTRONIC ARTS INC 99 88.750 92.875 83.625 91.125 +2.684 757,000 5,759M Quote, Analysis RATL RATIONAL SOFTWARE CORP II 63.000 70.125 63.000 70.062 +7.31+ 1,990,600 6,118M Quote ,Analysts VRTS VERITAS SOFTWARE CO IJ 185.343 190.562 180.312 189.750 +6.62 + 3,476,000 48,456M Quote, Analysts JKHY HENRY JACK & ASSOC INC 61.750 63.000 61.000 62.500 +0.84+ 184,800 1,258M Quote Analysts MACR MACROMEDIA INC IJ 78.937 84.125 78.375 84.000 ±7.50+ 1,583,400 3,737M,
Quote, Anajys PRGS PROGRESS SOFTWARE CORP II 23.000 23.750 22.250 22.562 +0.06 4 485,300 788M Quote, Anah-
http ://host.cnbc.com/jetson/Current Quotes. html?nocache=78 7 80 lI4Ifl(
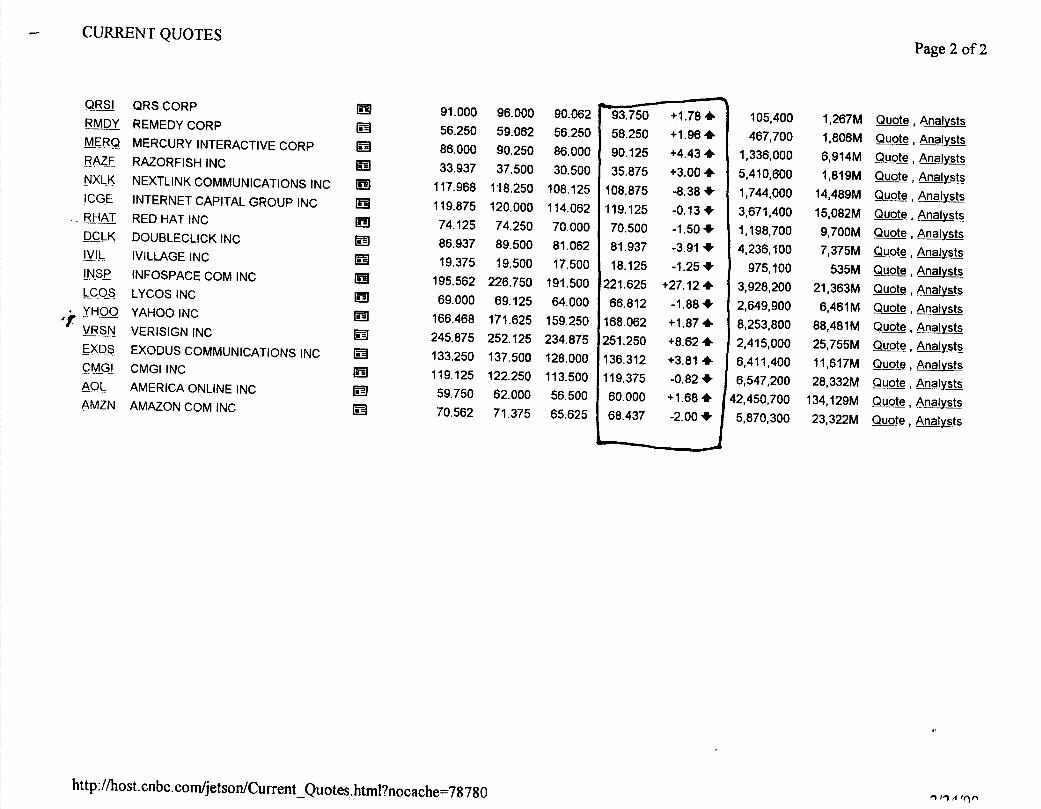
CURRENT QUOTESPage 2 of 2
QJ QRS CORP RD 91.000 96.000 90.062 RMDY REMEDY CORP 99 56.250 59.062 56.250 MERQ MERCURY INTERACTIVE CORP IJ 86.000 90.250 86.000 RAZF RAZORFISH INC 95 33.937 37.500 30.500 NXLK NEXTLINK COMMUNICATIONS INC n 117.968 118.250 108.125 lOGE INTERNET CAPITAL GROUP INC IJ 119.875 120.000 114.062 RHAT RED HAT INC 74.125 74.250 70.000 PCLK DOUBLECIJCK INC 86.937 89.500 81.062 IVIL IVILLAGE INC II 19.375 19.500 17.500 [NSP INFOSPACE COM INC II 195.562 226.750 191.500 !COS LYCOS INC n 69.000 69.125 64.000 YHOO YAHOO INC II 166.468 171.625 159.250 VRSN VERISIGN INC I1 245.875 252.125 234.875 EXDS EXODUS COMMUNICATIONS INC lJ 133.250 137.500 128.000 CMG! CMGIINC IJ 119.125 122.250 113.500 LOL AMERICA ONLINE INC IJ 59,750 62.000 56.500
AWN AMAZON COM INC Ij 70.562 71.375 65.625
93.750 +1.784 58.250 +1.964 90.125 +4434 35.875 +3.00 4
108.875 -8.38+ 119.125 -0.13+ 70.500 -1.50+ 81.937 -3.91* 18.125 -1.25+
221.625 +27124 66.812 -1.88+
168.062 +1.87 4 251.250 +8.62 4 136.312 +3.81 4 119.375 -0.82+ 60.000 +1684 68.437 -2.00*
105,400 1,267M Quote , Ana lysts 467,700 1,806M Quote Ana lys ts
1,336,000 6,914M Quote , Ana lyst s 5,410,600 1,819M Quote , Ana lysts 1,744,000 14,489M Quote, aysts 3,671,400 15,082M Quote, Analysts 1,198,700 9700M Quote, Analygs 4,236,100 7,375M Quote, Analysts
975,100 535M Quote ,Analysts 3,928,200 21,363M Quote, Analysts 2,649,900 6,461M Q uote , Analysts 8,253,800 88,481M Quote, Analys ts 2,415,000 25,755M Quote, Analysts 6,411,400 11,617M Quote, Analysts 6,547,200 28,332M Quip e, Analysts 12,450,700 134,129M Qujote, AI1YStS 5,870,300 23,322M Quote,
http://host.cnbc.com/jetson/Current-Quotes.html?nocache=78780 fr A
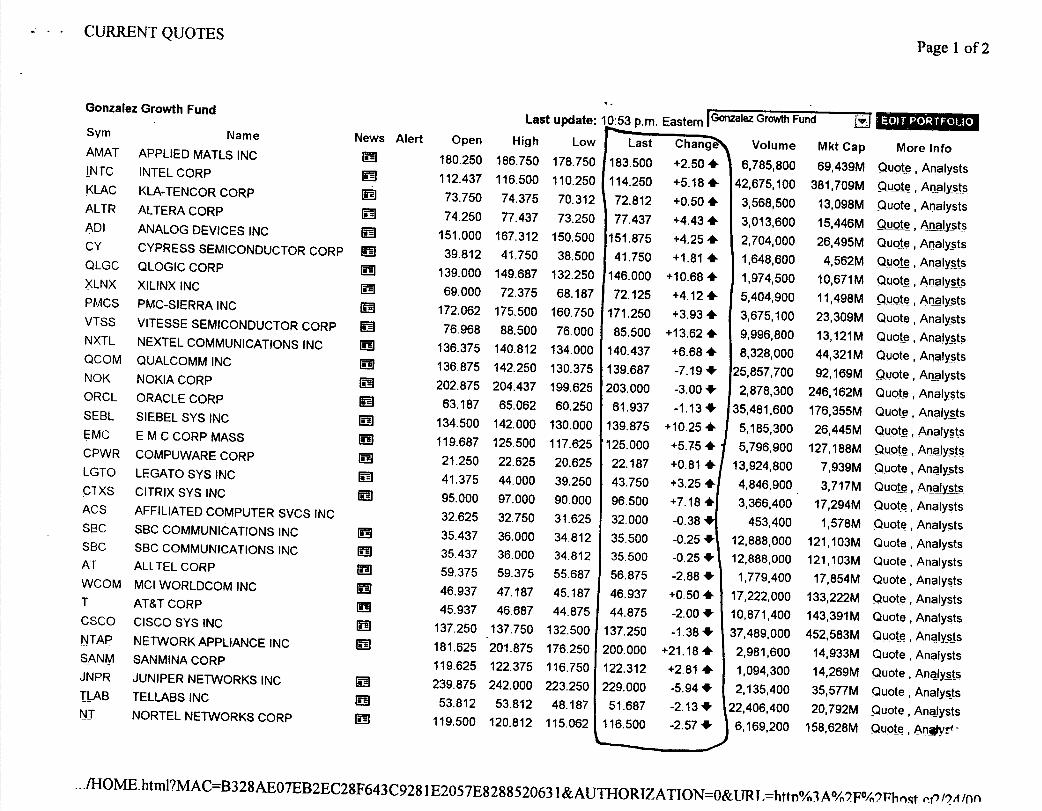
• CURRENT QUOTESPage 1 of 2
Gonzalez Growth FundLast update: 10:53 p.m. Eastern I G0 Growth Fund J I1uiii.iii.i.rs
Sym Name News Alert Open High Low Change Volume Mkt Cap More Info AMAT APPLIED MATLS INC 180.250 186.750 178.750 2.504 6,785,800 69,439M Quote, Analysts INTO KLAC
INTEL CORP
KLA-TENCOR CORPI1 112.437 116.500 110. 250
F151.875
5.184 42,675,100 381,709M Quote, Analysts
ALTR ALTERA CORP73.750 74.375 70.31 2 0,50 4 74. 250
3568,500 13,098M Quote, Analysts
ADI ANALOG DEVICES INC77.437 73. 250 4,43 4 3013,600 15,446M Quote, Analysts
CY CYPRESS SEMICONDUCTOR CORP151.000 167.312 150.500 4.254 2,704,000 26,495M Quote, Analysts
QLGC QLOGIC CORP RM39.812 41.750 38.500 .1.814 1,648600 4,562M Quote, Analysts
XLNX XILINX INC139.000 149.687 132.250 146.000 +10.68+ 1,974500 10,671M Quote , Analysts
PMCS PMC-SIERRA INCRE
ffm
69.000 72.375 68.187 72.125 +4.124 5,404,900 11,498M Quote, Ana lysts
VTSS VITESSE SEMICONDUCTOR CORP 99172.062 175.500 160.750 171.250 +3.934 3,675,100 23,309M Quote, Analysts
NXTL NEXTEL COMMUNICATIONS INC IN76.968 88.500 76.000 85.500 +13.624 9,996,800 13,121M Quote, Analysts
QCOM QUALCOMM INC RE136.375 140.812 134.000 140.437 +6.68 4 8,328,000 44,321M Quote, Analysts
NOK NOKIA CORP136.875 142.250 130.375 139.687 -7.194 25,857,700 92,169M Quote, Analysts
ORCL ORACLE CORPgo 202.875 204.437 199.625 203.000 -3.00+ 2,878,300 246,162M Quote, Analysts
SEBL SIEBEL SYS INCIJ 63.187 65.062 60.250 61.937 -1.134 35,481,600 176,355M Quote, Analysts
EMC E M C CORP MASSRN 134.500 142.000 130.000 139.875 +10.25 4 5,185,300 26,445M Quote, Analysts
CPWR COMPUWARE CORPRN
go119.687 125.500 117.625 125.000 +5.754 5,796,900 127,188M Quote, Analysts
LGTO LEGATO SYS INC RM21.250 22.625 20.625 22.187 +0.81 4 13,924,800 7,939M Quote, Analysts
CTXS CITRIX SYS INC 0141.375 44.000 39.250 43.750 +3.25* 4846,900 3,717M Quote, Analysts
ACS AFFILIATED COMPUTER SVCS INC95.000 97.000 90.000 96.500 +7.184 3,366,400 17,294M Quote, Analysts
SBC SBC COMMUNICATIONS INC IN32.625 32.750 31.625 32.000 -0.38 453,400 1,578M Quote, Analysts
SBC SBC COMMUNICATIONS INC IJ35.437 36.000 34.812 35.500 -0.254 12,888,000 121,103M Quote, Analysts
AT ALLTEL CORP Im35.437 36.000 34.812 35.500 -0.254 12,888,000 121,103M Quote, Analysts
WCOM MCI WORLDCOM INC IT59.375 59.375 55.687 56.875 -2.88 4 1,779,400 17,854M Quote, Analysts
T AT&TCORP46.937 47.187 45.187 46.937 +0.504 17,222,000 133,222M Quote , Analysts
CSCO CISCO SYS INCII
Im45.937 46.887 44.875 44.875 -2.00+ 10,871,400 143,391M Quote ,Analysts
NTAP NETWORK APPLIANCE INC Il137.250 137.750 132.500 137.250 -1.38+ 37,489,000 452,583M Quote, Analysts
SANM SANMINA CORP181.625 201.875 176.250 200.000 +21.184 2,981,600 14,933M Quote, Analysts
JNPR JUNIPER NETWORKS INC IJ119.625 122.375 116.750 122.312 +2.814 1094,300 14,269M Quote, Analysts
LLAB TELLABS INC239.875 242.000 223.250 229.000 -5.94 4 2,135,400 35,577M Quote, Analysts
NT NORTEL NETWORKS CORPlJ
RN53.812 53.812 48.187 51.687 -2.13+ 22,406,400 20,792M Quote, Analysts
119.500 120.812 115.062 116.500 -2.57+ 6169,200 158,628M Quote ,Anyr
./HOME htmI?MAC=B328j07EB2EC28F643C928 I E2057E828852063 I &AUTHORIZATJON=o&jm I httn%3 A%2F°/2Fhnst no f2 el Iflfl
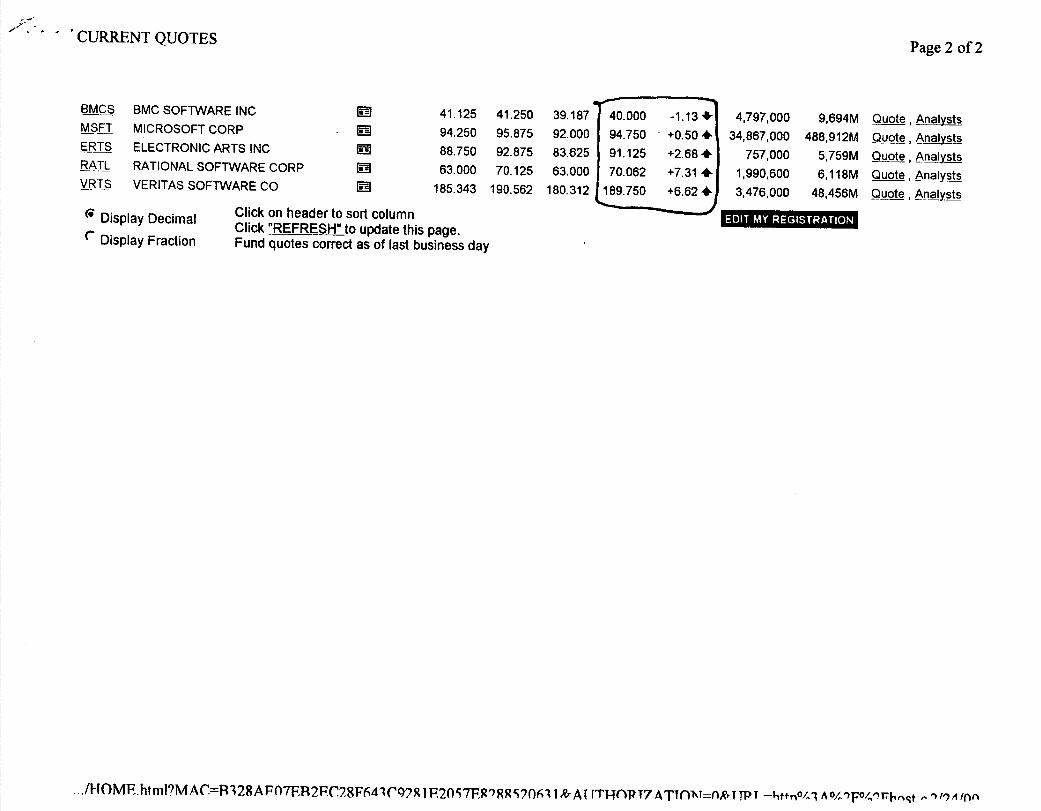
• CURRENT QUOTESPage 2 of 2
BMCS BMC SOFTWARE INC l 41.125 41.250 39.187 F 40.000 M —ET MICROSOFT CORP 94.250 95.875 92.000 94.750 ERTS ELECTRONIC ARTS INC IJ 88.750 92.875 83.625 91.125 RATL RATIONAL SOFTWARE CORP 63.000 70.125 63.000 70.062 VRTS VERITAS SOFTWARE CO lJ 185.343 190.562 180.312 189.750
re Display Decimal Click on header to sort column Click "REFRESH" to update this page.
Display Fraction Fund quotes correct as of last business day
9,694M Quote, Analysts 34,867,000 488,912M SIIYt&
J62
4,797,000
757,000 5,759M Quote, naIysts 1,990,600 6,118M Quote, Analysts 3476,000 48,456M quote, Analysts
Iu1llI:leUH:i!1l[.JI
./HOMF.html?M ACR128,WO7ER2FiC28pc41r q7 Si F.2OS71R"RS2o61 1 Rr A f JTJ-Jflp T7 A TT(IM=flRrI fl I httn0./ A °/lF°''1Th r ct 4
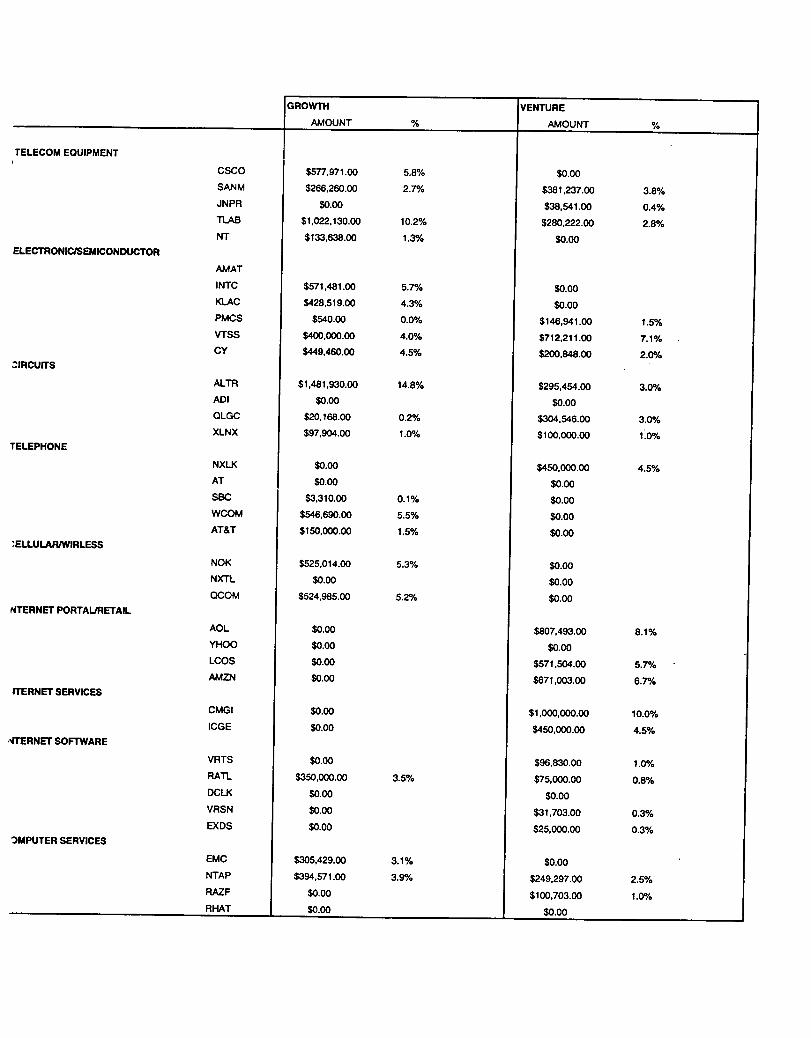
GROWTH
AMOUNT %
VENTURE
AMOUNT
TELECOM EQUIPMENT
CSCO $577,971.00 5.8% $0.00 SANM $266,260.00 2.70/a $381,237.00 3.8% JNPR $0.00 $38,541.00 0.4% TLAB $1,022,130.00 10.2% $280,222.00 2.8% NT $133,638.00 1.3% $0.00
ELECTRONIC/SEMICONDUCTOR
AMAT
INTC $571,481.00 5.75/6 $0.00 KLAC $428,519.00 4.3% $0.00 PMCS $540.00 0.00/6 $146,941.00 1.5% VTSS $400,000.00 4.0% $712,211.00 7.1% CV $449,460.00 4.5% $200,848.00 2.0%
IRCUITS
ALTh $1,481,930.00 14.8% $295,454.00 3.09/6 AOl $0.00 $0.00 QLGC $20,168.00 0.2% $304,546.00 3.00/6 XLNX $97,904.00 1.0% $100,000.00 1.0%
TELEPHONE
NXLK $0.00 $450,000.00 4.5% AT $0.00 $0.00 SBC $3,310.00 0.1% $0.00 WCOM $546,690.00 5.5% $0.00 AT&T $150,000.00 1.5% $0.00
:ELLULAR!WIRLESS
NOI( $525,014.00 5.3% $0.00 NXTL $0.00 $0.00 QCOM $524,985.00 5.2% $0.00
4TERNET PORTALIRETAIL
AOL $0.00 $807,493.00 8.1% YHOO $0.00 $0.00 LCOS $0.00 $571,504.00 5.7% AMZN $0.00 $671,003.00 6.71/9
ITERNET SERVICES
CMGI $0.00 $1,000,000.00 10.0% ICGE $0.00 $450,000.00 4.5%
'ITERNET SOFTWARE
VRTS $0.00 $96,830.00 1.0% RATI $350,000.00 3.5% $75,000.00 0.8% DCLX $0.00 $0.00 VRSN $0.00 $31,703.00 0.3% EXDS $0.00 $25,000.00 0.3%
MPUTER SERVICES
EMC $305,429.00 3.1% $0.00 NTAP $394,571.00 3.91/6 $249,297.00 2.55/6 RAZF $0.00 $100,703.00 1.0% RHAT $0.00 $0.00
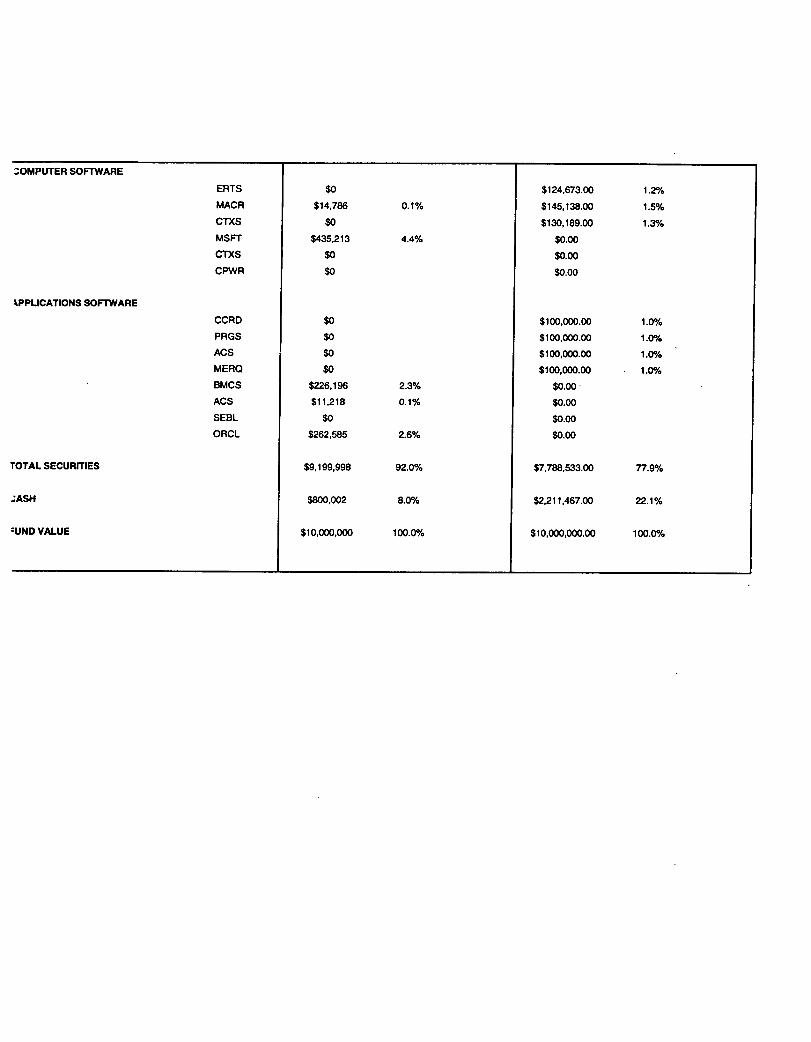
COMPUTER SOFTWARE
EATS $0 $124,673.00 1.2%
MACA $14,786 0.1% $145,138.00 1.5%
CTXS $0 $130,189.00 1.3%
MSFT $435,213 4.4% $0.00
CTxs $0 $0.00
CPWR $0 $0.00
%PPUCATIONS SOFTWARE
CCRD $0 $100,000.00 1.00/0
PRGS $0 $100,000.00 1.0%
ACS $0 $100,000.00 1.0%
MERO $0 $100,000.00 1.00/0
BMCS $226,196 2.3% $0.00
ACS $11,218 0.1% $0.00
SEBL $0 $0.00
ORCL $262,585 2.6% $0.00
TOTAL SECURITIES $9,199,998 92.0% $7,788,533.00 77.9%
.ASH $800,002 8.0% $2,211,467.00 22.1%
:UND VALUE $10,000,000 100.0% $10,000,000.00 100.0%
set SECURITIES; set S within SECURITIES;
param Beta >= 0.10;
param r(SECURITIES); param p(SECURITIES);
# utility parameter
# average return for each security # price per share of each security
param cov{i in SECURITIES, j in SECURITIES);
var x(SECURITIES) >= 0; # do not allow short sales
maximize obj: sum{i in SECURITIES) r(i)*x(i] - Beta * sum(i in SECURITIES, j in SECURITIES) cov(i,j) * x[i] * x[j];
subject to budget_constraint sum(i in SECURITIES) x[i] = 700000;
subject to selection (i in SECURITIES diff S): x[i] = 0;
set SECURITIES := AMAT INTC KLAC ALTR ADI CY QLGC XLNX
set S : RATL VRTS;
param Beta : 0.25;
param:r p:=
AMAT 170 102.1 INTC 107 129.1 KLAC 70 71.6 ALTR 76 103 ADI 129 77 CY 41 52 QLGC 105 100 XLNX 64 71 PMCS 210 188 VTSS 59 69 NXTL 123 113 QCOM 135 108 NOK 193 57 ORCL 60 79.5 SEBL 110 121.6 EMC 127 140.8 CPWR 22 12.4 LGTO 34 35 CTXS 85 57.5 ACS 37 34.6 SBC 51 44.4 AT 64 67 WCOM 48 45.8 T 49 47.9 CSCO 127 71 NTAP 152 71.6 SANM 117 58.3 JNPR 217 219.4 TLAB 60 54.15 NT 103 119 BMCS 43 46.7 MSFT 101 72.6 ERTS 87 59.375 RAM 62 83 VRTS 170 109;
param Coy: ANAT INTC KLAC ALTR ADI CY QLGC XLNX PMCS VTSS NXTL ANAT 252.3 13.2 25.2 14.2 171.2 5.3 63.3 70.0 -837 133.5 -10.5 INTC 13.2 5.0 4.4 5.2 8.4 1.2 3.4 4.4 -12.9 3.8 4.6 KL1AC 25.2 4.4 5.2 4.9 16.0 1.7 6.0 7.1 -49.7 12.6 4.0 LTR 14.2 5.2 4.9 5.8 8.8 1.5 4.6 4.6 -8.2 5.1 5.3 kDI 171.2 8.4 16.0 8.8 117.5 2.5 43.6 48.0 -587.9 88.0 -10.7 5.3 1.2 1.7 1.5 2.5 1.2 1.5 1.2 -0.9 4.8 3.6 2LGC 63.3 3.4 6.0 4.6 43.6 1.5 25.3 18.5 -219.3 33.8 -2.2 CLNX 70.0 4.4 7.1 4.6 48.0 1.2 18.5 19.9 -235.9 35.2 -3.1 ?MCS -837.2 -12.9 -49.7 -8.2 -587.9 -0.9 -219.3 -235.9 3301.4 -429.5 99.3 JTSS 133.5 3.8 12.6 5.1 88.0 4.8 33.8 35.2 -429.5 80.5 -1.8 TXTL -10.5 4.6 4.0 5.3 -10.7 3.6 -2.2 -3.1 99.3 -1.8 14.8 COM 0.2 2.8 2.1 3.5 -0.6 1.4 5.9 0.9 18.9 0.4 6.0 sTOK 14.0 4.8 5.1 5.5 7.9 1.8 2.7 3.9 5.2 6.8 5.9 )RCL 7.0 2.2 2.5 2.6 3.9 0.9 1.3 1.8 4.4 3.8 2.7 EBL. 112.5 6.4 10.8 6.3 77.0 2.2 28.9 31.8 -392.3 57.7 -4.5 MC -154.4 16.7 -1.1 12.5 -112.3 10.9 -26.1 -37.0 550.5 -82.9 66.7 :PWR 7.4 1.2 1.2 1.2 5.0 0.3 2.0 2.2 -21.1 3.1 0.5 GTO -5.2 2.2 2.4 2.5 -7.1 3.8 -0.8 -2.1 54.5 4.1 13.3 TXS 58.7 3.7 6.5 4.1 39.3 1.9 14.6 16.2 -186.0 32.0 -0.1 CS -72.1 0.2 -3.8 0.3 -50.4 0.1 -18.2 -19.8 282.1 -38.6 9.9 BC -231.7 5.0 -17.6 3.3 -139.6 -21.6 -59.6 -55.0 771.9 -187.7 -31.5 -44.2 1.2 -1.3 1.6 -31.5 0.7 -10.4 -12.1 186.7 -23.3 8.5 COM -3.7 2.8 2.1 3.0 -3.7 1.3 -0.9 -0.8 40.6 -2.1 5.9 -9.8 1.3 0.3 1.4 -6.6 -0.2 -2.6 -2.4 46.1 -7.4 1.3 SCO 23.2 2.5 4.5 3.4 14.0 1.8 4.5 5.7 -35.2 14.9 3.2 TAP 328.4 10.8 27.2 11.3 224.3 5.7 84.4 90.8 -1165.2 177.4 -20.4 ANN -26.7 3.3 1.3 3.7 -19.7 1.2 -7.0 -7.1 136.9 -15.3 8.9 NPR 577.4 24.2 55.7 29.7 30.2 13.0 157.2 158.8 -1895.9 317.', -26.0
Q 0 2 2 3
1 5 0 1 0 6 6 2 1 0 3 0 5 0 2
3 2 0 0
3

TLAB -37.6 2.0 -0.2 2.4 -27.5 1.5 -8.6 -10.4 169.8 -18.6 10.5 NT 338.9 10.3 27.2 10.5 232.2 5.2 85.9 93.7 -1215.2 182.3 -23.6 BMCS 3.5 2.1 1.9 2.2 1.4 1.3 1.1 1.1 4.6 2.4 4.6 MSFT -59.0 4.0 -0.3 4.3 -41.9 0.9 -14.8 -15.6 259.0 -34.2 13.0 ERTS 57.3 5.5 7.0 5.9 38.6 2.4 19.8 16.9 -188.1 29.8 3.0 RAM 22.4 1.7 3.3 2.1 13.5 2.2 6.1 5.7 -55.8 15.8 4.4 VRTS 89.8 4.8 9.9 5.6 57.9 5.3 25.8 24.2 -283.9 56.1 6.7
set SECURITIES ANZN AOL CMGI EXDS VRSN YHOO QLGC XLNX set S := QLGC XLNX ADI ALTR;
pararn Beta := 0.10;
parain:r p:=
ANZN 62.0 59.3 AOL 55.5 59.7 CMGI 90.9 72.0 EXDS 142.9 92.3 VRSN 169.9 140.3 YHOO 148.7 130.5 QLGC 105.1 101.5 XLNX 64.0 71.2 PMCS 209.5 190.1 VTSS 59.4 69.6 LCOS 57.7 45.6 DCLK 80.3 73.4 RHAT 50.5 28.1 ICGE 87.7 44.4 NXLK 96.4 88.7 RAZF 30.7 19.9 MERQ 109.0 89.4 LJGTO 28.6 31.1 CTXS 85.1 57.2 ACS 37.0 34.7 CY 44.3 52.1 AT 64.1 67.3 ADI 121.1 77.5 ALTR 89.7 103.1 QRSI 99.8 35.3 NTAP 152.1 74.7 SANN 116.5 58.6 JNPR 216.6 224.0 TLAB 60.5 54.0 4ACR 81.2 88.5 PRGS 22.8 20.1 CCRD 40.7 41.3 ERTS 87.4 59.1 .ATL 61.7 84.4
VRTS 169.6 111.0;
'aram Coy: AMZN AOL CMGI EXDS VRSN YHOO QLGC XLNX PMCS VTSS LCOS .NZN 3.1 4.3 50.2 37.3 105.3 8.5 -6.1 -5.2 84.7 -8.1 -7.5 OL 4.3 6.7 69.6 57.8 137.1 10.9 -6.7 -5.2 104.7 -9.8 -12.3 MGI 50.2 69.6 911.5 624.6 2006.7 143.7 -114.1 -103.8 1622.8 -197.8 -122.6 EXDS 37.3 57.8 624.6 582.3 1207.1 52.8 -57.8 -39.6 941.0 -76.8 -122.6 7RSN 105.3 137.1 2006.7 1207.1 4855.0 400.1 -276.9 -277.5 3938.3 -538.3 -243.6 'HOO 8.5 10.9 143.7 52.8 400.1 64.2 -16.9 -25.8 321.6 -46.3 -15.0 : LGC -6.1 -6.7 -114.1 -57.8 -276.9 -16.9 25.3 18.5 -219.3 33.8 7.8 LNX -5.2 -5.2 -103.8 -39.6 -277.5 -25.8 18.5 19.9 -235.9 35.2 6.2 DMCS 84.7 104.7 1622.8 941.0 3938.3 321.6 -219.3 -235.9 3301.4 -429.5 -184.2 TTSS -8.1 -9.8 -197.8 -76.8 -538.3 -46.3 33.8 35.2 -429.5 80.5 13.8 COS -7.5 -12.3 -122.6 -122.6 -243.6 -15.0 7.8 6.2 -184.2 13.8 28.4 )CLK 17.5 25.3 282.8 233.7 582.9 37.6 -35.4 -24.8 450.0 -42.7 -47.9 ?.HAT 24.8 33.1 458.8 288.2 1080.3 91.8 -57.8 -59.9 882.0 -112.7 -59.1
H.CGE 36.5 50.3 665.9 446.5 1468.9 106.7 -84.3 -77.3 1190.4 -147.6 -86.7 JXLK 13.3 16.8 248.3 140.2 588.8 46.1 -40.5 -35.5 472.9 -67.1 -25.1 AZF 13.7 18.3 256.7 162.3 603.2 49.7 -31.8 -33.2 493.8 -63.5 -33.2 1ERQ 17.9 29.3 292.4 281.2 449.5 8.0 -19.8 -10.3 365.3 -17.7 -53.9 GTO 11.3 14.4 175.2 141.1 417.4 30.6 -27.6 -20.8 324.5 -31.0 -30.5 TXS -3.5 -3.4 -80.4 -24.1 -220.7 -20.4 14.6 16.2 -186.0 32.0 3.2 CS 6.9 8.8 137.0 81.9 342.7 27.8 -18.2 -19.8 282.1 -38.6 -17.1 8.5 13.9 106.2 116.2 174.8 12.1 -14.4 -1.9 98.8 -1.8 -25.1 .T 4.8 6.3 92.3 61.9 225.6 17.8 -10.4 -12.1 186.7 -23.3 -13.5 DI 92.9 142.5 1543.2 1361.6 3127.7 192.7 -152.2 -113.8 2406.5 -222.1 -293.2 -..LTR 8.5 12.5 148.7 139.5 271.6 -1.9 -20.2 -9.7 212.4 -18.6 -25.4 RSI 9.3 12.9 157.1 134.8 303.8 8.8 -19.0 -13.1 251.0 -20.5 -25.2 TAP -26.3 -30.9 -546.0 -257.8 -1404.2 -122.0 84.4 90.8 -1165.2 177.4 47.7 ANN 4.2 6.3 76.6 64.2 174.0 11.8 -7.0 -7.1 136.9 -15.3 -14.7 NPR -39.0 -41.8 -846.5 -338.4 -2326.9 -204.1 157.2 158.8 -1895.9 317.7 59.2 LAB 4.6 6.1 83.4 61.8 206.2 17.2 -8.6 -10.4 169.8 -18.6 -14.4
1 2 2 2 5 3
1 1 2 7 7 1 7
3 5 2 5 5 5
2
2

MACR 8.0 11.4 142.3 126.8 278.9 2.1 -20.6 -11.3 218.3 -21.8 -23.3 PRGS 5.5 7.2 106.0 69.2 245.0 15.8 -14.5 -13.5 200.6 -26.3 -13.3 CCRD 4.8 6.8 84.2 56.7 193.6 19.1 -8.1 -9.8 157.6 -18.3 -12.7 ERTS -4.9 -5.1 -94.7 -33.4 -223.6 -17.3 19.8 16.9 -188.1 29.8 2.2 RAM -0.7 -1.0 -27.4 -0.5 -74.6 -7.3 6.1 5.7 -55.8 15.8 -1.2 VRTS -6.1 -7.9 -145.3 -50.0 -357.6 -30.3 25.8 24.2 -283.9 56.1 6.0
I •--,
rf ;J
P• .
AiO _pll ---..-- r
pc)•H. •-
ty
0 $ - .• . • -.
SIXTH EDITION
Investment Analysis and Portfolio Management
Frank K. Reilly Keith C. Brown
INVESTMENT
AN ALYSIS AND PORTFOLIO
MANAGEMENT
Sixth 'Tditj011
FRANK K. REILLY l InhI'ers,f V of otre Dame
KEITH C. BROWN l/!J!!'rcj( of Itt1 it
THE DRY DEN PRESS
HARCOURT COLLEGE PUBLISHERS Fort Worth Philadelphia San Diego New York Orlando Austin San Antonio
Toronto Montreal London Sydney To'-yo
Publisher Mike Roche Executive Editor Mike Reynolds
Market Strategist Charlie Watson Developmental Editor Tern House
Project Editor Jon Davies Art Director Scott Baker
Production Manager Lois West
Cover image: FPG International.
ISBN: 0-03-025809-x Library of Congress Catalog Card Number: 99-74300
Copyright © 2000 by Harcourt, Inc.
All rights reserved. No part of this publication may be reproduced or transmjtted in any form or by any means, electronic or mechanical, including photocopy, recording, or any information storage and retrieval system, without permission in writing from the publisher.
Requests for permission to make copies of any part of the work should be mailed to: Permissions Department, Harcourt, Inc., 6277 Sea Harbor Drive, Orlando, FL 32887-6777.
Portions of this work were published in previous editions.
Address for Domestic Orders The Dryden Press, 6277 Sea Harbor Drive, Orlando, FL 32887-6777
800-782-4479
Address for International Orders International Customer Service
The Dryden Press, 6277 Sea Harbor Drive, Orlando, FL 32887-6777 407-345-3800
(fax) 407-345-4060 (e-mail) [email protected]
Address for Editorial Correspondence The Dryden Press, 301 Commerce Street, Suite 3700, Fort Worth, TX 76102
Web Site Address http://www.hbcollege.com
THE DRYDEN PRESS, DRYDEN, and the DP LOGO are registered trademarks of Harcourt Brace & Company.
Printed in the United States of America
9012345678 032 987654321
The Dryden Press Harcourt College Publishers
n I NTIIOH tCTION TO OPERIITIO\ IIEEA UGH
Frederick Gerald J. I
tr.i p rrn
-
-
• •
. A
I
Introduction to Operations Research Sixth Edition
Frederick S. Hillier Professor of Operations Research Stanford University
Gerald J. Lieberman Professor Emeritus of Operations Research and Statistics Stanford University
McGraw-Hill, Inc. New York St. Louis San Francisco Auckland Bogota Caicas Lisbon London Madrid Mexico City Milan Montreal New Delhi San Juan Singapore Sydney Tokyo Toronto
vivo,
COMPANY ADDRESSES, TELEPHONE NUMBERS, AND NAMES OF KEY CORPORATE OFFICERS
KEY INCOME AND BALANCE SHEET STATISTICS
EXCLUSIVE S&P RANKINGS (FROM A+ TO D)
EARNINGS, DIVIDENDS, VITAL DATA ON
/
AMERICA'S MOST AND SHARE PRICES WATCHED COMPANIES
Standard & Poor's 500 Guide
2000 Edition
Standard & Poor's
McGraw-Hill Now York San Francisco Washington, D.C. Auckland Bogota
Caracas Lisbon London Madrid Mexico City Milan Montreal New Delhi San Juan Singapore
Sydney Tokyo toronto
FOR STANDARD & POOR'S Vice President, Index Products & Services: Elliott Shurgin Managing Editor: Shauna Morrison Publisher: Frank LoVaglio
McGraw-Hill A Division of The McGrawHil1 Companies
Copyright © 2000 by The McGraw-Hill Companies, Inc. All rights reserved. Printed in the United States of America. Except as permitted under the United States Copyright Act of 1976, no part of this publication may be reproduced or distributed in any form or by any means, or stored in a data base or retrieval sys-tem, without the prior written permission of the publisher.
1234567890 AGM/AGM 9098765432109
ISBN 0-07-135256-2
The sponsoring editor for this book was Griffin Hansbury, the editing supervisor was Patricia V Amoroso, and the production supervisor was Modestine Cameron. The front matter and introduction were set by North Market Street Graphics.
Printed and bound by Quebecor/Martinsburg.
This book is printed on acid-free paper.
This publication is designed to provide accurate and authori-tative information in regard to the subject matter covered. It is sold with the understanding that the publisher is not engaged in rendering legal, accounting, or other professional service. If legal advice or other expert assistance is required, the services of a competent professional person should be sought.
—From a declaration of principles jointly adopted by a committee of the American Bar Association and a com-mittee of publishers
The companies contained in this handbook represented the components of the S&P 500 Index as of September 24, 1999. Additions to or deletions from the Index will cause its composi-tion to change over time. Company additions and company deletions from the Standard & Poor's equity indexes do not in any way reflect an opinion on the investment merits of the company.
1.